Supporting Information Villinger et al. 10.1073/pnas.1012310108 SI Text SI Materials and Methods. Preparation of human VDAC1. Expression, refolding, and purification of wild type (WT) and E73V hVDAC1 was done mostly as described in ref. 1. According to previous findings (2), a His6-Tag was attached to the C terminus of hVDAC1 to improve the overall folding properties of the protein. Improved sample purification (3) was applied to hVDAC1 pre- parations. Functionality of our hVDAC1 preparation was con- firmed by electrophysiological measurements in lipid bilayers as described in 1. NMR spectroscopy. NMR spectra were recorded on 2 Hð75%Þ- 15 N or 2 Hð75%Þ- 13 C- 15 N labeled samples containing 0.5–0.8 mM hVDAC1, 25 mM BisTris pH 6.8, approximately 250 mM lauryl- dimethylamine-N-oxide (LDAO), and 5–10% D 2 O. All spectra were measured at 37 °C (unless stated otherwise) on Bruker 800 or 900 MHz spectrometers equipped with cryogenic probes. Spectra were processed using NMRPipe (4) and analyzed with SPARKY (5). To further improve the previously obtained backbone reso- nance assignment (2), TROSY-based HNCA experiments (6) were recorded on samples with improved purity, and two-dimen- sional 1 H, 15 N-TROSY experiments (7) at varying temperatures (37 °C, 32 °C, 27 °C, and 22 °C) were used to discriminate over- lapping peaks. In addition, N H and C α chemical shifts assigned by solid state NMR in the N-terminal helix (8) were taken into consideration. Peak intensities for WT VDAC1 were collected in triplicate and averaged, using two 1 H, 15 N-TROSY spectra and one refer- ence spectrum of a heteronuclear NOE experiment applying no saturation. To exclude exchange of amide protons with saturated water protons, water flip-back pulse sequences were used (7). All 1 H, 15 N-TROSY spectra were measured with 1;024 × 256 total points and 24–48 scans, and peak intensities were scaled accord- ing to the number of scans and the protein concentration. Steady state heteronuclear f 1 Hg, 15 N-NOEs were measured employing the TROSY scheme (9). Heteronuclear NOE values are reported as the ratio of peak intensities in paired interleaved spectra collected with and without initial proton saturation period (4 s) during the 5-s-recycle delay. The two experiments were measured with 1;024 × 202 total points each and 120 scans. Chemical exchange rates (R ex ) were determined from a set of three TROSY-based pulse sequences (10) used to obtain peak intensities I N x H N α , I N x H N β , and I 2N z H N z . The three spectra were mea- sured interleaved with 1;024 × 244 total points and 240 scans for WT hVDAC1 and 1;024 × 148 total points and 320 scans for E73V hVDAC1. The shortest possible relaxation delay of 2τ ¼ 1∕ J ¼ 10.87 ms was used, corresponding to I N x H N β ∕I N x H N α of 0.2 for most residues. R ex was determined as (10): R ex ¼ R N x H N α 2 − R 2HzNz 1 ∕2 − η xy ðκ − 1Þ: [S1] κ was estimated by the mean of 1 þðR N x H N α 2 − R 2HzNz 1 ∕2Þ∕η xy using all residues in β-strands that were apparently not exchanging in WT hVDAC1 (β8–β11, β14–β15, and β18), resulting in a value of 1.15 (1.17) for WT (E73V) hVDAC1. For nonexchanging resi- dues (−10 < R ex < þ10), R ex is distributed around 0.75 s −1 (0.65 s −1 ) with a standard deviation of 5 s −1 due to variation in magnitude and orientation of the 15 N CSA tensor (11). Very weak peaks that resulted in unusually negative values for R ex were excluded from the analysis (5/6 residues in total for WT/E73V hVDAC1). For the reaction of hVDAC1 with DCCD (Calbiochem-Nova- biochem), the chemical was added to WT hVDAC1 from a stock solution in dimethylformamide (DMF)-d7 to a final concentra- tion of 2 mM (final 1% DMF-d7). 1 H, 15 N-TROSY spectra were measured before and after DCCD incubation for 3 h. Gaussian Network Model analysis. Normal modes were calculated for the mVDAC1 crystal structure (PDB code 3emn) using a standard C α -atom based Gaussian Network Model available as online server oGNM (12). A default value of 10 Å was used as a cutoff (r c ) for construction of the Kirchhoff matrix using C α -atoms. MD simulation. MD simulations were performed using Gromacs 4.0 (13) together with the OPLS (14) and amber99sb force-fields (15), respectively, for the protein, water, and ions. The initial structure of mVDAC1 was taken from PDB structure 3EMN (16). Protonation states of the protein ionizable groups were determined using Whatif (17). mVDAC1 was embedded in an equilibrated and fully hydrated dimyristoylphosphatidylcholine (DMPC) bilayer derived from Berger et al. (18) comprising 392 lipid molecules by employing g_membed (19). The surround- ing aqueous solution consisted of 13,953 water molecules using the TIP4P model (20) in the OPLS simulations, and of 12,937 water molecules employing the TIP3P model (20) in the case of amber99sb. The salt concentration was 0.15 M in all cases, using K þ and Cl − ions. In the OPLS simulations, eight K þ and 11 Cl − were used to neutralize the system. Hydrogen atoms were treated using the virtual sites approach in the OPLS simula- tions (21), allowing for an integration time-step of 4 fs. In the amber simulations, a time-step of 2 fs was used in connection with fully atomistic treatment of hydrogen atoms. The temperature was kept constant by weakly (τ ¼ 0.1 ps) coupling the lipids, pro- tein, and solvent separately to a temperature bath of 320 K using the v-rescale method. The temperature was slightly raised to prevent transitions of DMPC into the gel phase. Likewise, the pressure in the system was kept constant by semiisotropic cou- pling to a pressure of 1 bar. Before the start of production runs, equilibration of the system was performed by applying position restraints of 1;000 kJ mol −1 nm −2 on the protein heavy atoms for 20 ns. Subsequently, trajectories totaling in a length of ∼0.5 μs were obtained by free simulation. To analyze slow and fast motions of mVDAC1, low- and high- pass filtering was applied on the trajectories. Calculated root mean square fluctuation (rmsF) values were transformed into isotropic B-factors and averaged using a running average of eight residues in length. A contribution of 1 Å to the total rmsF was assumed to arise from static disorder and subtracted. Collective motions of mVDAC1 were analyzed by performing a principal component analysis (PCA) on the barrel backbone (amino acids 21–-283) and projecting the trajectories on the ob- tained eigenvectors. Elliptic fitting was carried out on eigenmode 1 using C α positions. All molecular representations were gener- ated using VMD (22). The lipid bilayer thickness was determined by measuring the average distance between the phosphate atoms of DMPC in the lower and upper leaflets using a grid-based approach based upon the GridMAT algorithm (23). Villinger et al. www.pnas.org/cgi/doi/10.1073/pnas.1012310108 1 of 7
Transcript
Supporting InformationVillinger et al. 10.1073/pnas.1012310108SI TextSI Materials and Methods. Preparation of human VDAC1. Expression,refolding, and purification of wild type (WT) and E73V hVDAC1was done mostly as described in ref. 1. According to previousfindings (2), a His6-Tag was attached to the C terminus ofhVDAC1 to improve the overall folding properties of the protein.Improved sample purification (3) was applied to hVDAC1 pre-parations. Functionality of our hVDAC1 preparation was con-firmed by electrophysiological measurements in lipid bilayersas described in 1.
NMR spectroscopy. NMR spectra were recorded on 2Hð75%Þ-15Nor 2Hð75%Þ-13C-15N labeled samples containing 0.5–0.8 mMhVDAC1, 25 mM BisTris pH 6.8, approximately 250 mM lauryl-dimethylamine-N-oxide (LDAO), and 5–10% D2O. All spectrawere measured at 37 °C (unless stated otherwise) on Bruker800 or 900 MHz spectrometers equipped with cryogenic probes.Spectra were processed using NMRPipe (4) and analyzed withSPARKY (5).
To further improve the previously obtained backbone reso-nance assignment (2), TROSY-based HNCA experiments (6)were recorded on samples with improved purity, and two-dimen-sional 1H,15N-TROSY experiments (7) at varying temperatures(37 °C, 32 °C, 27 °C, and 22 °C) were used to discriminate over-lapping peaks. In addition, NH and Cα chemical shifts assignedby solid state NMR in the N-terminal helix (8) were taken intoconsideration.
Peak intensities for WT VDAC1 were collected in triplicateand averaged, using two 1H,15N-TROSY spectra and one refer-ence spectrum of a heteronuclear NOE experiment applying nosaturation. To exclude exchange of amide protons with saturatedwater protons, water flip-back pulse sequences were used (7). All1H,15N-TROSY spectra were measured with 1;024 × 256 totalpoints and 24–48 scans, and peak intensities were scaled accord-ing to the number of scans and the protein concentration.
Steady state heteronuclear f1Hg,15N-NOEs were measuredemploying the TROSY scheme (9). Heteronuclear NOE valuesare reported as the ratio of peak intensities in paired interleavedspectra collected with and without initial proton saturationperiod (4 s) during the 5-s-recycle delay. The two experimentswere measured with 1;024 × 202 total points each and 120 scans.
Chemical exchange rates (Rex) were determined from a set ofthree TROSY-based pulse sequences (10) used to obtain peakintensities INxHN
α , INxHNβ , and I2NzHN
z . The three spectra were mea-sured interleaved with 1;024 × 244 total points and 240 scans forWT hVDAC1 and 1;024 × 148 total points and 320 scans forE73V hVDAC1. The shortest possible relaxation delay of 2τ ¼ 1∕J ¼ 10.87 ms was used, corresponding to INxHN
β ∕INxHNα of 0.2 for
most residues. Rex was determined as (10):
Rex ¼ RNxHNα
2 − R2HzNz1 ∕2 − ηxyðκ − 1Þ: [S1]
κ was estimated by the mean of 1þ ðRNxHNα
2 − R2HzNz1 ∕2Þ∕ηxy using
all residues in β-strands that were apparently not exchanging inWT hVDAC1 (β8–β11, β14–β15, and β18), resulting in a value of1.15 (1.17) for WT (E73V) hVDAC1. For nonexchanging resi-dues (−10 < Rex < þ10), Rex is distributed around 0.75 s−1
(0.65 s−1) with a standard deviation of 5 s−1 due to variationin magnitude and orientation of the 15N CSA tensor (11). Very
weak peaks that resulted in unusually negative values for Rex wereexcluded from the analysis (5/6 residues in total for WT/E73VhVDAC1).
For the reaction of hVDAC1 with DCCD (Calbiochem-Nova-biochem), the chemical was added to WT hVDAC1 from a stocksolution in dimethylformamide (DMF)-d7 to a final concentra-tion of 2 mM (final 1% DMF-d7). 1H,15N-TROSY spectra weremeasured before and after DCCD incubation for 3 h.
Gaussian Network Model analysis. Normal modes were calculatedfor the mVDAC1 crystal structure (PDB code 3emn) using astandard Cα-atom based Gaussian Network Model availableas online server oGNM (12). A default value of 10 Å was usedas a cutoff (rc) for construction of the Kirchhoff matrix usingCα-atoms.
MD simulation. MD simulations were performed using Gromacs4.0 (13) together with the OPLS (14) and amber99sb force-fields(15), respectively, for the protein, water, and ions. The initialstructure of mVDAC1 was taken from PDB structure 3EMN(16). Protonation states of the protein ionizable groups weredetermined using Whatif (17). mVDAC1 was embedded in anequilibrated and fully hydrated dimyristoylphosphatidylcholine(DMPC) bilayer derived from Berger et al. (18) comprising392 lipid molecules by employing g_membed (19). The surround-ing aqueous solution consisted of 13,953 water molecules usingthe TIP4P model (20) in the OPLS simulations, and of 12,937water molecules employing the TIP3P model (20) in the caseof amber99sb. The salt concentration was 0.15 M in all cases,using Kþ and Cl− ions. In the OPLS simulations, eight Kþand 11 Cl− were used to neutralize the system. Hydrogen atomswere treated using the virtual sites approach in the OPLS simula-tions (21), allowing for an integration time-step of 4 fs. In theamber simulations, a time-step of 2 fs was used in connection withfully atomistic treatment of hydrogen atoms. The temperaturewas kept constant by weakly (τ ¼ 0.1 ps) coupling the lipids, pro-tein, and solvent separately to a temperature bath of 320 K usingthe v-rescale method. The temperature was slightly raised toprevent transitions of DMPC into the gel phase. Likewise, thepressure in the system was kept constant by semiisotropic cou-pling to a pressure of 1 bar. Before the start of production runs,equilibration of the system was performed by applying positionrestraints of 1;000 kJmol−1 nm−2 on the protein heavy atomsfor 20 ns. Subsequently, trajectories totaling in a length of∼0.5 μs were obtained by free simulation.
To analyze slow and fast motions of mVDAC1, low- and high-pass filtering was applied on the trajectories. Calculated rootmean square fluctuation (rmsF) values were transformed intoisotropic B-factors and averaged using a running average of eightresidues in length. A contribution of 1 Å to the total rmsF wasassumed to arise from static disorder and subtracted.
Collective motions of mVDAC1 were analyzed by performinga principal component analysis (PCA) on the barrel backbone(amino acids 21–-283) and projecting the trajectories on the ob-tained eigenvectors. Elliptic fitting was carried out on eigenmode1 using Cα positions. All molecular representations were gener-ated using VMD (22). The lipid bilayer thickness was determinedby measuring the average distance between the phosphate atomsof DMPC in the lower and upper leaflets using a grid-basedapproach based upon the GridMAT algorithm (23).
Villinger et al. www.pnas.org/cgi/doi/10.1073/pnas.1012310108 1 of 7
1. Engelhardt H, et al. (2007) High-level expression, refolding and probing the naturalfold of the human voltage-dependent anion channel isoforms I and II. J Membr Biol216:93–105.
2. Bayrhuber M, et al. (2008) Structure of the human voltage-dependent anion channel.Proc Natl Acad Sci USA105:15370–15375.
3. Hiller S, et al. (2008) Solution structure of the integral human membrane proteinVDAC-1 in detergent micelles. Science 321:1206–1210.
4. Delaglio F, et al. (1995) NMRPipe: a multidimensional spectral processing system basedon UNIX pipes. J Biomol NMR 6:277–293.
5. Goddard TD, Kneller DG (2006) SPARKY 3 University of California San Francisco.http://www.cgl.ucsf.edu/home/sparky/
6. Eletsky A, Kienhofer A, Pervushin K (2001) TROSY NMR with partially deuteratedproteins. J Biomol NMR 20:177–180.
7. Zhu G, Kong XM, Sze KH (1999) Gradient and sensitivity enhancement of 2D TROSYwith water flip-back, 3D NOESY-TROSY and TOCSY-TROSY experiments. Journal ofBiomolecular NMR 13:77–81.
8. Schneider R, et al. (2010) The native conformation of the human VDAC1 N terminus.Angew Chem Int Ed Engl 49:1882–1885.
9. Zhu G, Xia Y, Nicholson LK, Sze KH (2000) Protein dynamics measurements byTROSY-based NMR experiments. J Magn Reson 143:423–426.
10. Wang C, Rance M, Palmer AG III (2003) Mapping chemical exchange in proteins withMW > 50 kD. J Am Chem Soc 125:8968–8969.
11. Fushman D, et al. (1998) The solution structure and dynamics of the pleckstrinhomology domain of G protein-coupled receptor kinase 2 (beta-adrenergic receptorkinase 1). A binding partner of Gbetagamma subunits. J Biol Chem 273:2835–2843.
12. Yang LW, et al. (2006) oGNM: online computation of structural dynamics using theGaussian Network Model. Nucleic Acids Res 34:W24–31.
13. Hess B, Kutzner C, van der Spoel D, Lindahl E (2008) GROMACS 4: Algorithms forhighly efficient, load-balanced, and scalable molecular simulation. Journal ofChemical Theory and Computation 4:435–447.
14. Jorgensen WL, Maxwell DS, Tirado-Rives J (1996) Development and testing of theOPLS all-atom force field on conformational energetics and properties of organicliquids. Journal of the American Chemical Society 118:11225–11236.
15. Wang J, Wolf RM, Caldwell JW, Kollman PA, Case DA (2004) Development and testingof a general amber force field. J Comput Chem 25:1157–1174.
16. Ujwal R, et al. (2008) The crystal structure of mouse VDAC1 at 2.3 A resolution revealsmechanistic insights into metabolite gating. Proc Natl Acad Sci USA 105:17742–17747.
17. Vriend G (1990) WHAT IF: a molecular modeling and drug design program. J MolGraph 8:52–56, 29.
18. Berger O, Edholm O, Jahnig F (1997) Molecular dynamics simulations of a fluid bilayerof dipalmitoylphosphatidylcholine at full hydration, constant pressure, and constanttemperature. Biophys J 72:2002–2013.
19. Wolf MG, Hoefling M, Aponte-Santamaria C, Grubmuller H, Groenhof G (2010)g_membed: Efficient insertion of a membrane protein into an equilibrated lipidbilayer with minimal perturbation. J Comput Chem 31:2169–2174.
20. Jorgensen WL, Chandrasekhar J, Madura JD, Impey RW, Klein ML (1983) Comparisonof simple potential functions for simulating liquid water. The Journal of ChemicalPhysics 79:926–935.
21. Feenstra KA, Hess B, Berendsen HJC (1999) Improving efficiency of large time-scalemolecular dynamics simulations of hydrogen-rich systems. Journal of ComputationalChemistry 20:786–798.
22. HumphreyW, Dalke A, Schulten K (1996) VMD: visual molecular dynamics. J Mol Graph14:33–38, 27–38.
23. Allen WJ, Lemkul JA, Bevan DR (2009) GridMAT-MD: a grid-based membrane analysistool for use with molecular dynamics. J Comput Chem 30:1952–1958.
24. DeLano WL (2003) PyMOL Reference Manual. DeLano Scientific LLC, San Carlos, CA.
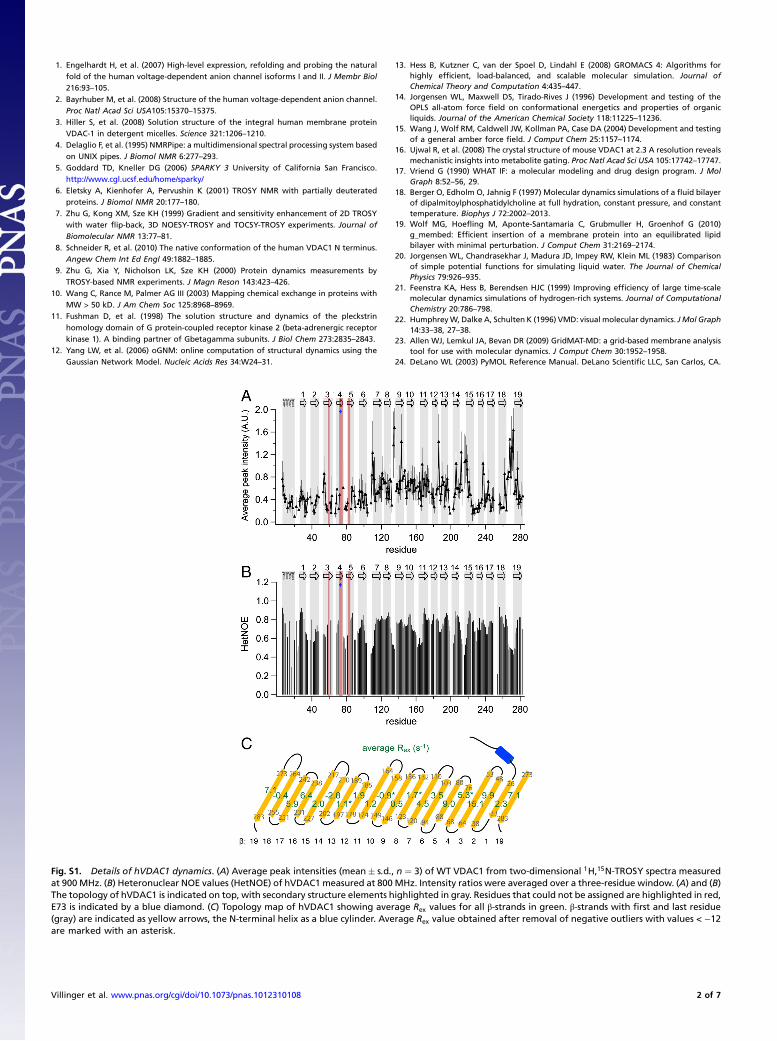
Fig. S1. Details of hVDAC1 dynamics. (A) Average peak intensities (mean� s:d:, n ¼ 3) of WT VDAC1 from two-dimensional 1H,15N-TROSY spectra measuredat 900 MHz. (B) Heteronuclear NOE values (HetNOE) of hVDAC1 measured at 800 MHz. Intensity ratios were averaged over a three-residue window. (A) and (B)The topology of hVDAC1 is indicated on top, with secondary structure elements highlighted in gray. Residues that could not be assigned are highlighted in red,E73 is indicated by a blue diamond. (C) Topology map of hVDAC1 showing average Rex values for all β-strands in green. β-strands with first and last residue(gray) are indicated as yellow arrows, the N-terminal helix as a blue cylinder. Average Rex value obtained after removal of negative outliers with values < −12are marked with an asterisk.
Villinger et al. www.pnas.org/cgi/doi/10.1073/pnas.1012310108 2 of 7
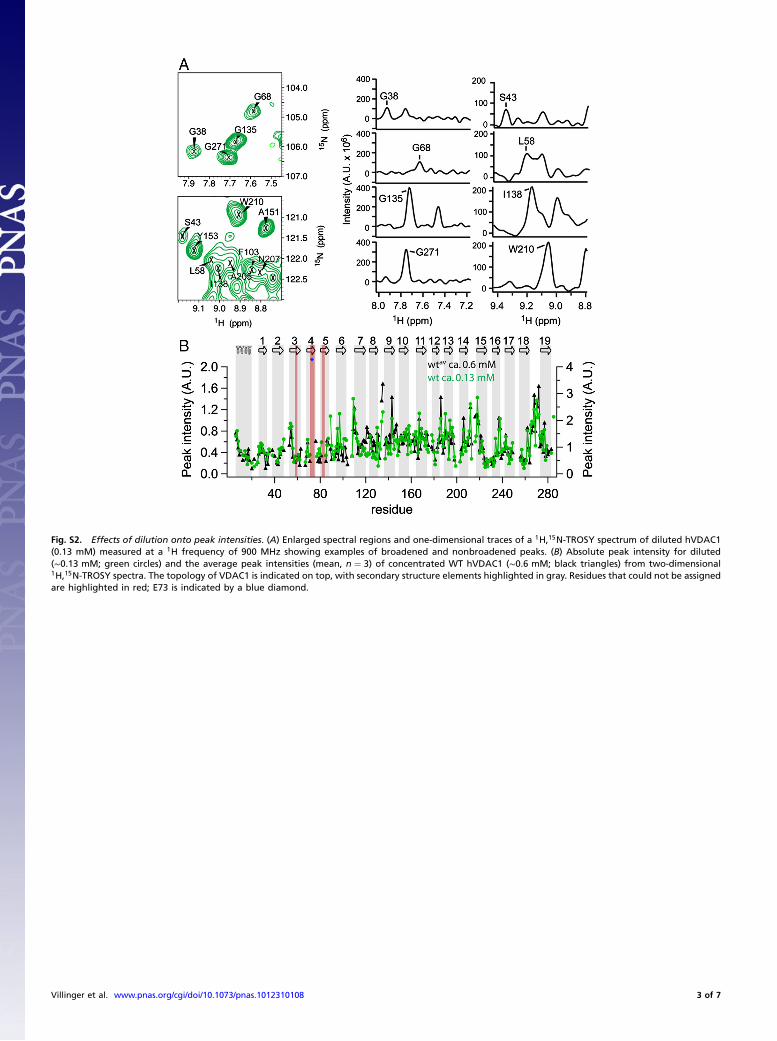
Fig. S2. Effects of dilution onto peak intensities. (A) Enlarged spectral regions and one-dimensional traces of a 1H,15N-TROSY spectrum of diluted hVDAC1(0.13 mM) measured at a 1H frequency of 900 MHz showing examples of broadened and nonbroadened peaks. (B) Absolute peak intensity for diluted(∼0.13 mM; green circles) and the average peak intensities (mean, n ¼ 3) of concentrated WT hVDAC1 (∼0.6 mM; black triangles) from two-dimensional1H,15N-TROSY spectra. The topology of VDAC1 is indicated on top, with secondary structure elements highlighted in gray. Residues that could not be assignedare highlighted in red; E73 is indicated by a blue diamond.
Villinger et al. www.pnas.org/cgi/doi/10.1073/pnas.1012310108 3 of 7
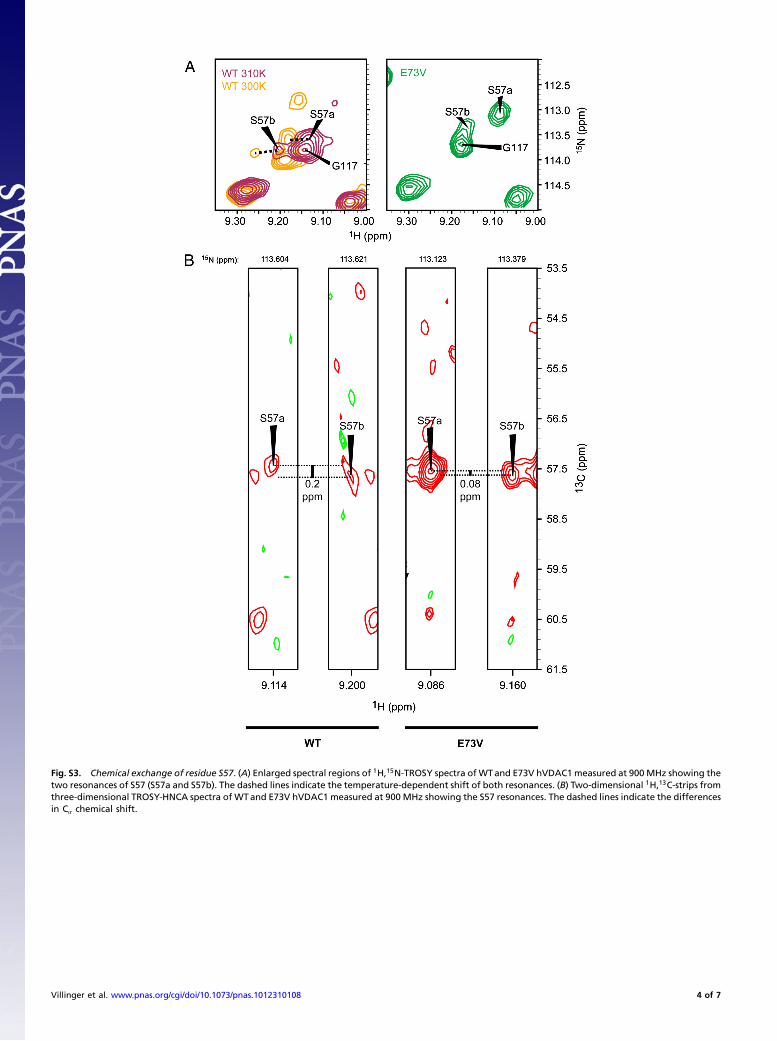
Fig. S3. Chemical exchange of residue S57. (A) Enlarged spectral regions of 1H,15N-TROSY spectra ofWTand E73V hVDAC1measured at 900MHz showing thetwo resonances of S57 (S57a and S57b). The dashed lines indicate the temperature-dependent shift of both resonances. (B) Two-dimensional 1H,13C-strips fromthree-dimensional TROSY-HNCA spectra of WTand E73V hVDAC1 measured at 900 MHz showing the S57 resonances. The dashed lines indicate the differencesin Cα chemical shift.
Villinger et al. www.pnas.org/cgi/doi/10.1073/pnas.1012310108 4 of 7
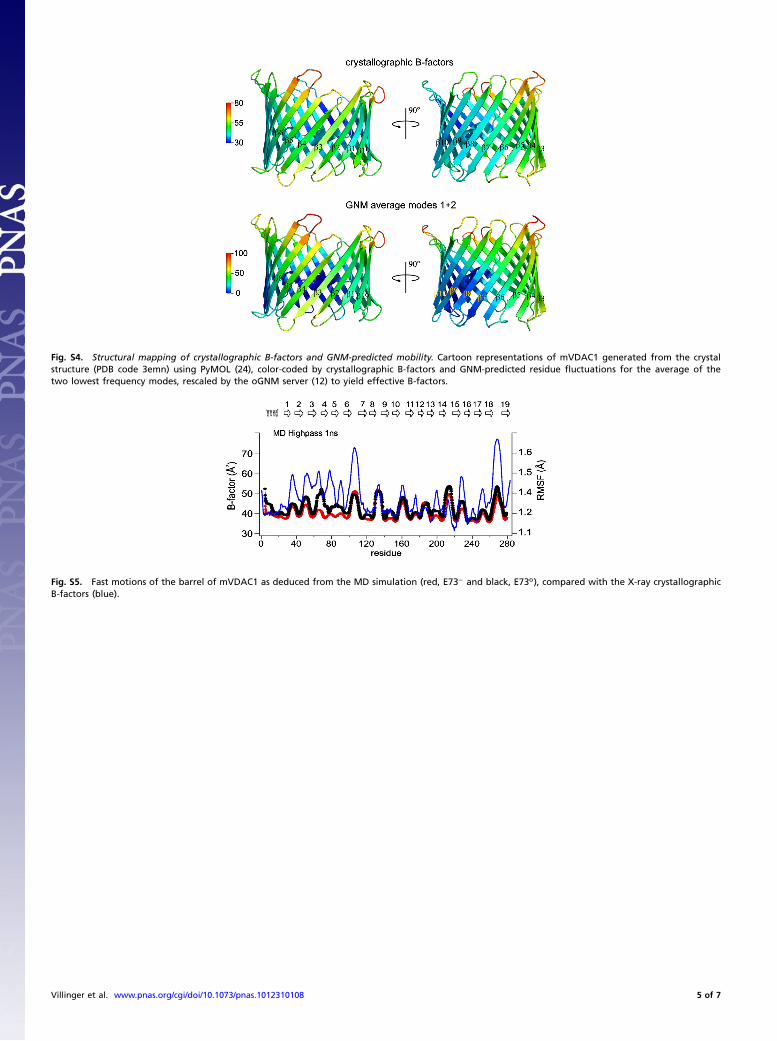
Fig. S4. Structural mapping of crystallographic B-factors and GNM-predicted mobility. Cartoon representations of mVDAC1 generated from the crystalstructure (PDB code 3emn) using PyMOL (24), color-coded by crystallographic B-factors and GNM-predicted residue fluctuations for the average of thetwo lowest frequency modes, rescaled by the oGNM server (12) to yield effective B-factors.
Fig. S5. Fast motions of the barrel of mVDAC1 as deduced from the MD simulation (red, E73− and black, E73o), compared with the X-ray crystallographicB-factors (blue).
Villinger et al. www.pnas.org/cgi/doi/10.1073/pnas.1012310108 5 of 7
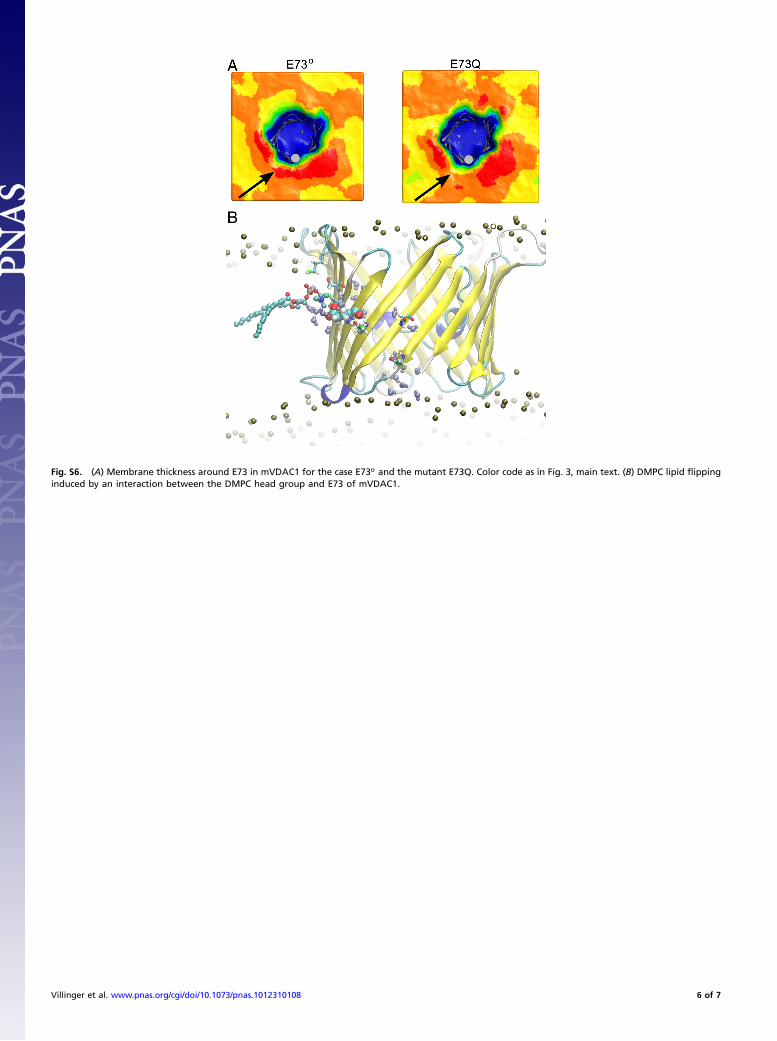
Fig. S6. (A) Membrane thickness around E73 in mVDAC1 for the case E73o and the mutant E73Q. Color code as in Fig. 3, main text. (B) DMPC lipid flippinginduced by an interaction between the DMPC head group and E73 of mVDAC1.
Villinger et al. www.pnas.org/cgi/doi/10.1073/pnas.1012310108 6 of 7
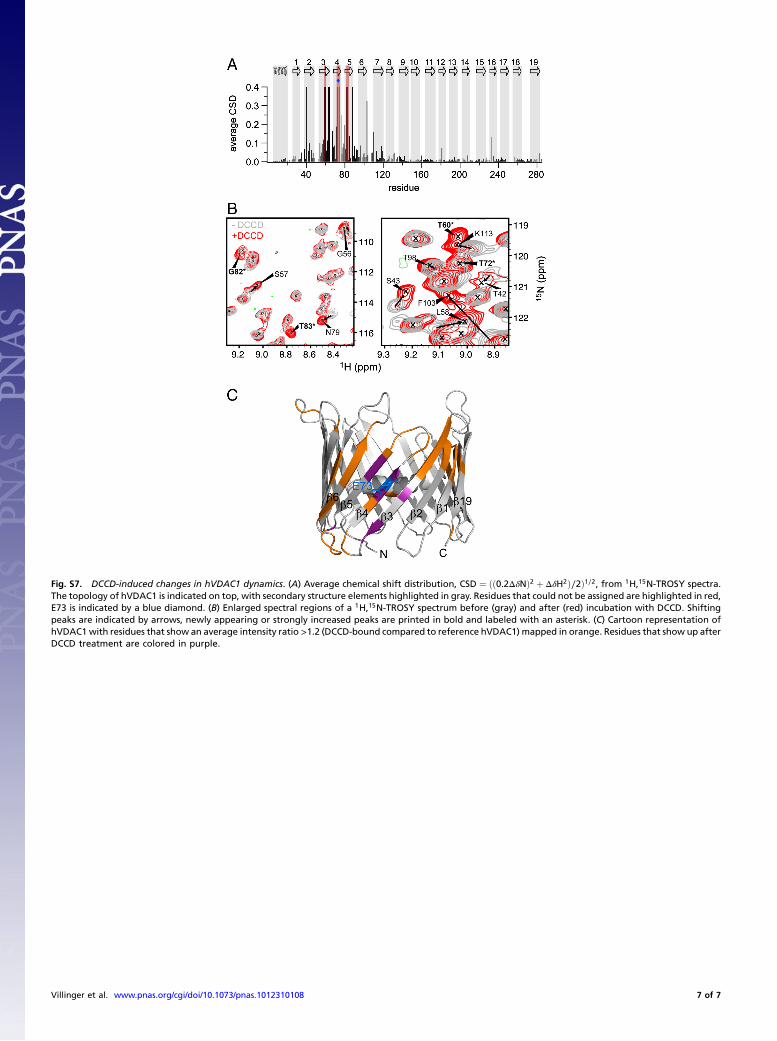
Fig. S7. DCCD-induced changes in hVDAC1 dynamics. (A) Average chemical shift distribution, CSD ¼ ðð0.2ΔδNÞ2 þ ΔδH2Þ∕2Þ1∕2, from 1H,15N-TROSY spectra.The topology of hVDAC1 is indicated on top, with secondary structure elements highlighted in gray. Residues that could not be assigned are highlighted in red,E73 is indicated by a blue diamond. (B) Enlarged spectral regions of a 1H,15N-TROSY spectrum before (gray) and after (red) incubation with DCCD. Shiftingpeaks are indicated by arrows, newly appearing or strongly increased peaks are printed in bold and labeled with an asterisk. (C) Cartoon representation ofhVDAC1 with residues that show an average intensity ratio >1.2 (DCCD-bound compared to reference hVDAC1) mapped in orange. Residues that show up afterDCCD treatment are colored in purple.
Villinger et al. www.pnas.org/cgi/doi/10.1073/pnas.1012310108 7 of 7