2011/11/14 1 Measuring knowledge flow and Survey-based approaches to measuring knowledge flows and use of knowledge exchange mechanisms , OECD-KNOWINNO workshop on “Measuring the use and impact of Knowledge Exchange Mechanisms” Measuring knowledge flow and collaboration for scientific discovery: evidence from a large scale scientists’ survey in Japan and the US 15 November 2011 USPTO 15 November 2011, USPTO Sadao Nagaoka 1 1. Survey Framework on Knowledge Production Process • Hitotsubashi Univ-NISTEP-Georgia Tech scientists’ survey in Japan and the US. <Survey framework> • Basic findings are reported in the following working paper: “Knowledge creation process in science: Key comparative findings from the Hitotsubashi-NISTEP-Georgia Tech scientists’ survey in Japan and the US” (joint scientists survey in Japan and the US (joint with Igami, Walsh and Ijichi ) (http://www.iir.hit-u.ac.jp/iir-w3/file/WP11- 09NagaokaIgamiWalshIjichi.pdf) 2
Transcript
2011/11/14
1
Measuring knowledge flow and
Survey-based approaches to measuring knowledge flows and use of knowledge exchange mechanisms , OECD-KNOWINNO workshop on “Measuring the use and impact of Knowledge Exchange Mechanisms”
Measuring knowledge flow and collaboration for scientific discovery:
evidence from a large scale scientists’ survey in Japan and the US
15 November 2011 USPTO15 November 2011, USPTOSadao Nagaoka
1
1. Survey Framework on Knowledge Production Process
• Hitotsubashi Univ-NISTEP-Georgia Tech scientists’ survey in Japan and the US.
<Survey framework>
sc e t sts su ey Japa a d t e US• Basic findings are reported in the following
working paper:“Knowledge creation process in science: Key comparative findings from theHitotsubashi-NISTEP-Georgia Tech scientists’ survey in Japan and the US” (jointscientists survey in Japan and the US (joint with Igami, Walsh and Ijichi )
• Developing systematic and objective data on the knowledge creation process in science at
<Survey framework>
the knowledge creation process in science at the project level (Japan and the US).– Motivations of the research projects– Knowledge sources that inspired the project– Uncertainty in the knowledge creation process– Research competition– Composition of the research teamComposition of the research team– Sources of funds– Research outputs, e.g., research papers,
students, patents, etc.
3
Bottom-up approach to explore structural characteristics in the knowledge creation process
Structural characteristics in the knowledge creation process in science and in science based innovation
(3) Analyze the characteristics of the
<Survey framework>
Pro
ject
A
Pro
ject
D
Pro
ject
C
Pro
ject
B
in science and in science-based innovation
Pro
ject
E
(2) Collect the profiles of research through a comprehensive questionnaire survey of researchers.
characteristics of the research projects.
4
Paper A Paper B Paper C Paper D Paper E (1) Select research papers in all fields of science.
2011/11/14
3
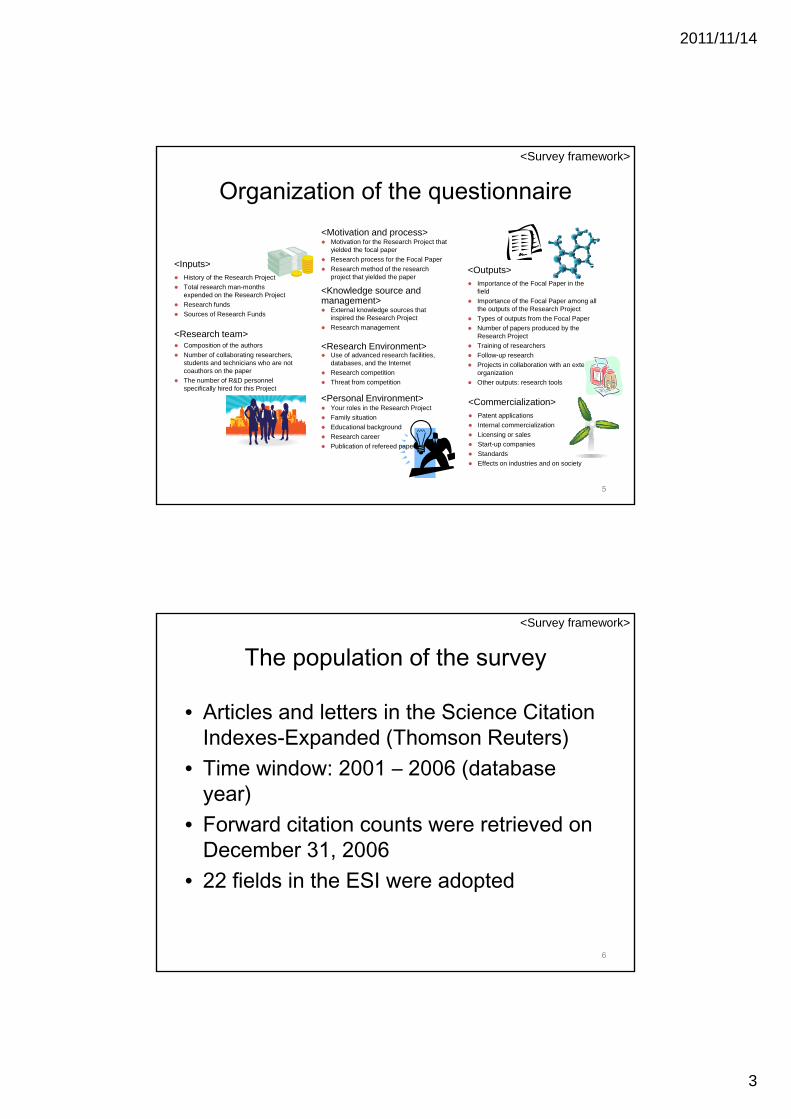
Organization of the questionnaire
<Inputs>
Motivation for the Research Project that yielded the focal paper
Research process for the Focal Paper
<Motivation and process>
<Survey framework>
<Inputs> History of the Research Project
Total research man-months expended on the Research Project
Research funds
Sources of Research Funds External knowledge sources that
inspired the Research Project
Research management
Composition of the authors
Number of collaborating researchers, students and technicians who are not coauthors on the paper
The number of R&D personnel
Importance of the Focal Paper in the field
Importance of the Focal Paper among all the outputs of the Research Project
Types of outputs from the Focal Paper
Number of papers produced by the Research Project
Training of researchers
Follow-up research
Projects in collaboration with an external organization
Other outputs: research tools
Use of advanced research facilities,databases, and the Internet
Research competition
Threat from competition
<Research team>
<Knowledge source and management>
<Research Environment>
<Outputs> Research method of the research project that yielded the paper
5
specifically hired for this Projectpp
Patent applications
Internal commercialization
Licensing or sales
Start-up companies
Standards
Effects on industries and on society
<Commercialization><Personal Environment> Your roles in the Research Project
Family situation
Educational background
Research career
Publication of refereed papers
The population of the survey
• Articles and letters in the Science Citation I d E d d (Th R t )
<Survey framework>
Indexes-Expanded (Thomson Reuters)• Time window: 2001 – 2006 (database
year)• Forward citation counts were retrieved on
December 31 2006December 31, 2006• 22 fields in the ESI were adopted
6
2011/11/14
4
Identification of possible focal papers
• Highly Cited Papers (H papers) – Top 1% highly cited papers in each journal field (22
<Survey framework>
Top 1% highly cited papers in each journal field (22 fields in total) and in each database year; at least one organization of authors should be located in the target country (approximately 3,000 in total).
• Normal Papers (N papers)– Randomly selected papers in each journal field and in
each database year from the population of the survey, y p p yexcluding the above highly cited papers; at least one organization of authors should be located in the target country (approximately 7,000).
7
H projects and N projects
• The project is defined as a series of research activities in which the specified focal paper
<Survey framework>
activities in which the specified focal paper and the other closely related research outcomes were produced.
• H projects– Research projects from which the H papers were
produced. p• N projects
– Research projects from which the N papers were produced.
8
2011/11/14
5
Implementation of the survey
• Survey was conducted on the Web.J US
<Survey framework>
Japanese survey• Survey launch:
December 21, 2009• Initial due date:
February 9, 2010• Reminders were sent
US survey• Initial mail-outs:
September – November, 2010
• Reminder emails: November – December,
twice (mid of Jan., mid of Feb.)
• Final due date: April 11, 2010
2010• Second (final) reminders:
January, 2011
9
Relation between the 22 ESI journal fields, 10 fields, and the large 3 fields
<Survey framework>
22 ESI journal fields 10 fields large fieldsChemistry 1_ChemistryMaterials Science 2_Materials SciencePhysics
2. Knowledge Sources • The survey asked a respondent to evaluate how each
knowledge was important for suggesting the research project
<Knowledge sources>
• It identified 11 categories of knowledge sources based on pre-testing, - including scientific literature, colleagues or past collaborators, visiting researchers and post-doctoral students, competitors, partners in industrial-academic- government alliance as well as - experts in a different field or with a different skill (which have overlaps with the other categories).
• New facilities and database as knowledge source (only in Japan)
15
Importance of external knowledge sources for inspiring the research project (% , very important)
Japan
<Knowledge sources>
46%48%(a) Scientific literature (Articles in journals etc )
4%
12%
11%
22%
15%
1%
14%
46%
8%
13%
17%
25%
21%
1%
19%
(l) Competitors
(k) Past research collaborators
(j) Visiting researchers or post-doctoral students in the organization
(i) Colleagues in the organization (a university, a laboratory, etc.)
(e) Conferences, workshops, and academic meetings
(d) Patent literature
(b) Scientific literature (Preprints, information on websites, those …
(a) Scientific literature (Articles in journals, etc.)
16Note1: The results show the share of "very important" in the importance of knowledge sources for conceiving the research project.Note2: The upper figure is for the H projects and the lower figure is for the N projects. Note3: Results weighted by field.
8%
6%
5%
11%
7%
8%
0% 10% 20% 30% 40% 50% 60%
(o) Researchers with different research skills (experimental …
(n) Researchers in different academic fields
(m) Partners in industrial - academic - government alliance
H projects N projects
2011/11/14
9
Importance of external knowledge sources for inspiring conceiving the research project (% , very important)
US
<Knowledge sources>
52%48%(a) Published literature (articles in journals, etc.)
2%
11%
10%
14%
9%
1%
5%
8%
3%
11%
12%
15%
9%
1%
6%
(i) Partners in an industrial-academic-government alliance
(h) Competitors
(g) Past research collaborators
(f) Visiting researchers or post-doctoral researchers in your …
(e) Colleagues in your organization (university, government lab, …
(d) Conferences, workshops or academic meetings
(c) Patent literature
(b) Unpublished literature (preprints, information on websites, etc.)
17Note1: The results show the share of "very important" in the importance of knowledge sources for conceiving the research project.Note2: The upper figure is for the H projects and the lower figure is for the N projects. Note3: Results weighted by field.
12%
8%
7%
15%
9%
8%
0% 10% 20% 30% 40% 50% 60%
(k) Researchers with different research skills (for example, …
(j) Researchers in different academic fields
(i) Partners in an industrial-academic-government alliance
H projects N projects
• Very similar rankings of the importance of knowledge sources in Japan and the US
→ robust findingsS i tifi lit t i b f th t i t t
<Knowledge sources>
• Scientific literature is by far the most important knowledge source.- difference between invention and scientific
research• Colleagues in the organization come next in
both countriesboth countries.• Visiting researchers or post-doctoral students
in the organization are also important.
18
2011/11/14
10
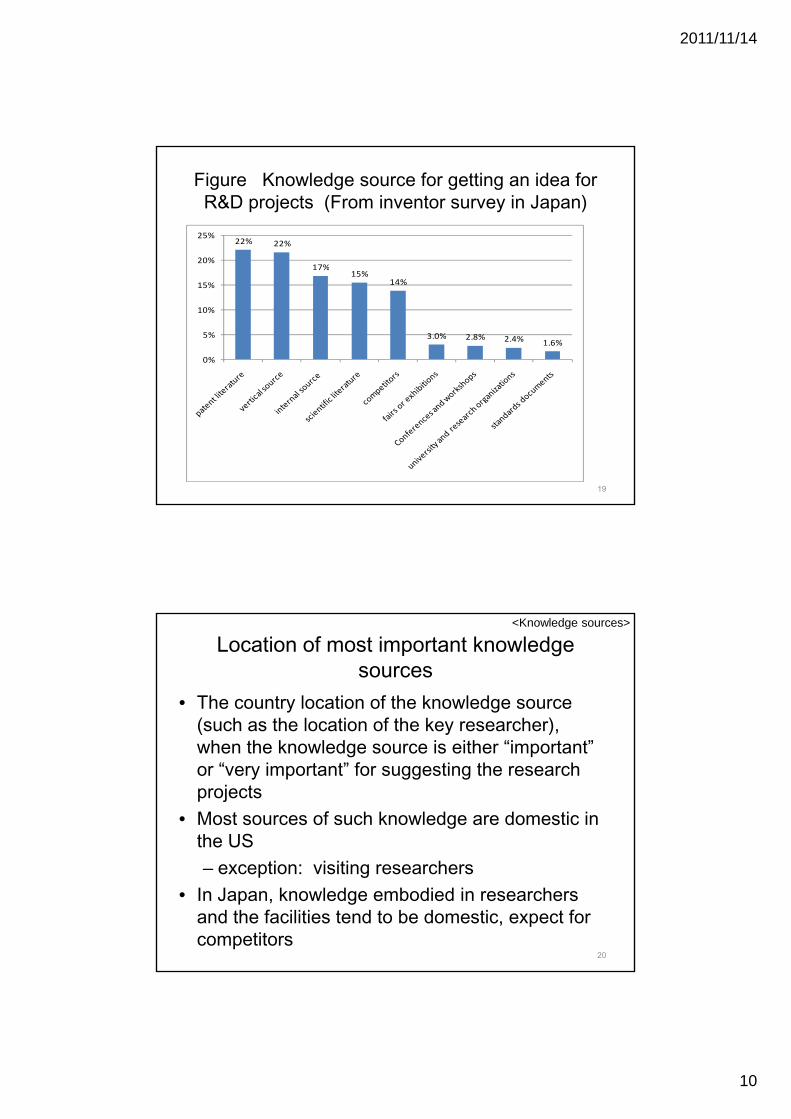
Figure Knowledge source for getting an idea for R&D projects (From inventor survey in Japan)
22% 22%
17%20%
25%
17%15%
14%
3.0% 2.8% 2.4% 1.6%
0%
5%
10%
15%
19
Location of most important knowledge sources
• The country location of the knowledge source (such as the location of the key researcher),
<Knowledge sources>
( y ),when the knowledge source is either “important” or “very important” for suggesting the research projects
• Most sources of such knowledge are domestic in the US– exception: visiting researchers
• In Japan, knowledge embodied in researchers and the facilities tend to be domestic, expect for competitors
20
2011/11/14
11
Percent ranking domestic knowledge sources as most important (for those who rank a source as important)Japan US
10% 77%
< Knowledge sources >
22%
67%
66%
82%
42%
57%
12%
18%
11%
62%
65%
68%
26%
52%
10%
10%
(l) Competitors
(k) Past research collaborators
(j) Visiting researchers or post-…
(i) Colleagues in the …
(e) Conferences, workshops, …
(d) Patent literature
(b) Scientific literature …
(a) Scientific literature (Articles …
63%
68%
37%
89%
83%
86%
79%
78%
74%
66%
43%
89%
80%
90%
74%
77%
(h) Competitors
(g) Past research collaborators
(f) Visiting researchers or post-…
(e) Colleagues in your …
(d) Conferences, workshops, …
(c) Patent literature
(b) Unpublished literature …
(a) Published literature …
71%
69%
92%
63%
68%
83%
0% 20% 40% 60% 80% 100%
(o) Researchers with different …
(n) Researchers in different …
(m) Partners in industrial -…
H projects N projects
79%
83%
86%
76%
82%
91%
0% 20% 40% 60% 80% 100%
(k) Researchers with different …
(j) Researchers in different …
(i) Partners in an industrial-…
H projects N projects
Note1: The upper figure is for the H projects and the lower figure is for the N projects. Note2: Results weighted by field. 21
3. Collaboration as seen from authors• To identify the detailed structure of research
teams th k d h i l d d i th th
<Research teams>
- the survey asked who were included in the authors- It also collected the following information on
authors of the focal paper (up to six authors).– Academic/professional positions– Field of expertise (27 fields)– Main skill (Theoretical, Experimental, and Clinical)– Types of organizational affiliations (University, Public
research organization,Firm, Private and non-profit organization, Other)
4. Material sciences5. Physics6. Space science7. Earth science8. Environmental studies, Ecological science9. Clinical medicine10. Psychiatric medicine, Psychology11 Bi l Bi h i t
Information engineering21. Mechanical engineering22. Chemical engineering23. Material engineering 24. Medical engineering 25 Environmental engineering11. Biology, Biochemistry
25. Environmental engineering26. Economics, Management27. Social science28. Do not know
Scope of authorsJapan
19%28%
(a) Any researcher who only supplied research materials
analyzed in the research
US
17%17%
(a) Any researcher who only supplied research materials
analyzed in the research
<Research teams>
7%
7%
14%
6%
8%
11%
17%
(d) Any researcher who only supplied funds used in the
research
(c) Any researcher who only supplied or developed the
computer program or database …
(b) Any researcher who only supplied or developed the
research facilities or …
5%
8%
10%
5%
6%
11%
11%
(d) Any researcher who only supplied funds used in the
research
(c) Any researcher who only supplied or developed the
computer program or database …
(b) Any researcher who only supplied or developed the
research facilities or …
y
6%6%
0% 10% 20% 30% 40% 50%
(e) Other
H projects N projects
5%5%
0% 10% 20% 30% 40% 50%
(e) Other
H projects N projects
24
Note1: The choice is non-exclusive.Note2: Others are those researchers who did not provide direct contribution to the research project nor any four of the listed conNote3: The upper figure is for the H projects and the lower figure is for the N projects. Note4: The weighted result of natural sciences.
2011/11/14
13
Distributions of number of authors by field, Japan
unit: personsRespondents Minimum Q1 Median Q3 Maximum Average
Note1: Red boxplots indicate the distributions for the H projects; and blue ones for the N projects. Left end of boxes indicate the first quartiles; and right end of boxes the third quartiles. Left end of whiskers indicate the 5th percentile; and right end of whiskers the 95th percentile. The red bands in bars indicate the medians; and rhombi in bars the means.
Note2: Result of social sciences in the H projects was not shown due to the small number of responses. 25
Distributions of number of authors by field, US
unit: personsRespondents Minimum Q1 Median Q3 Maximum Average
Note1: Red boxplots indicate the distributions for the H projects; and blue ones for the N projects. Left end of boxes indicatethe first quartiles; and right end of boxes the third quartiles. Left end of whiskers indicate the 5th percentile; and right end of whiskers the 95th percentile. The red bands in bars indicate the medians; and rhombi in bars the means.
26
2011/11/14
14
Scope of authors
• Authorship is more expansive in Japan.
<Research teams>
– higher percent of authors whose contribution was providing materials or data; or who only contributed specialized facilities
• This is consistent with a larger size of authors per paper in Japan.
27
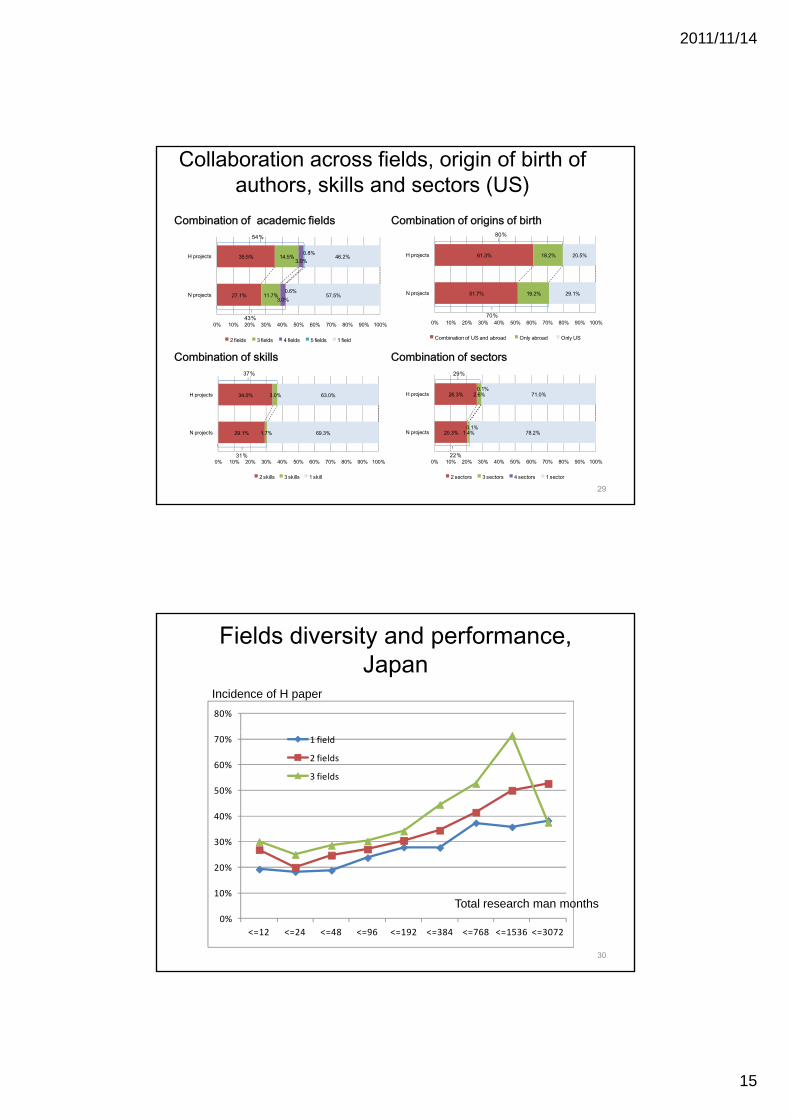
Collaboration across fields, origin of birth of authors, skills and sectors (Japan)
Combination of academic fields Combination of origins of birth
32.6% 13.4%2.3%
0.5%51.3%H projects
49%
48.6% 1.4% 50.1%H projects
50%
Combination of skills Combination of sectors
27.7% 9.3%2.1%
0.4%60.6%
0% 10% 20% 30% 40% 50% 60% 70% 80% 90% 100%
N projects
2 fields 3 fields 4 fields 5 fields 1 field
39%
29.8% 0.3% 69.8%
0% 10% 20% 30% 40% 50% 60% 70% 80% 90% 100%
N projects
Japan + Other countries Only other countries Only Japan
30%
36% 41%
28
26.7%
32.5%
3.3%
3.3%
70.0%
64.2%
0% 10% 20% 30% 40% 50% 60% 70% 80% 90% 100%
N projects
H projects
2 skills 3 skills 1 skill
30%
27.2%
36.3%
3.1%
3.9%
0.1%
0.3%
69.7%
59.5%
0% 10% 20% 30% 40% 50% 60% 70% 80% 90% 100%
N projects
H projects
2 sectors 3 sectors 4 sectors 1 sector
30%
2011/11/14
15
Collaboration across fields, origin of birth of authors, skills and sectors (US)
Combination of academic fields Combination of origins of birth
Young scholar (107) 64.5% 6.5% 8.4% 9.3% 5.6% 5.6%
HEIs
Japan
(b) H papers
Note1: The sample focuses on those papers the authors of which are ordered according to the contribution of the authors to the research.Note2: Young scholars: M.A. and/or undergraduate student, PhD student, and Postdoctoral fellow. Senior scholars: Assistant professor
level, Associate professor level, Professor level, and other.Note3: The results are not weighted by field.
• Research teams have more diversified memberships in terms of specialized academic fields, specialized skills, origins of birth and types of sectors in H papers than in N papers in both
<Diversity of authors>
birth and types of sectors in H papers than in N papers in both countries.
• The US teams are significantly more diversified in the origins of birth than the Japanese teams. Given that international co-authorship in terms of the locations of affiliated organizations of the US is only modestly larger than that of Japan (24% in Japan and 29% in the US in 2005 – 2007), the above difference largely reflects the inflow of foreign born scholars indifference largely reflects the inflow of foreign-born scholars in the US.
• Somewhat more cross-sector collaboration in Japan