71
Surveying the Stars Insert TCP 5e Chapter 15 Opener
| Date post: | 01-Jan-2016 |
| Category: |
Documents |
| Upload: | marvin-sampson |
| View: | 35 times |
| Download: | 0 times |

Surveying the Stars
Insert TCP 5e Chapter 15 Opener

Properties of Stars
Our goals for learning:
• How do we measure stellar luminosities?
• How do we measure stellar temperatures?
• How do we measure stellar masses?
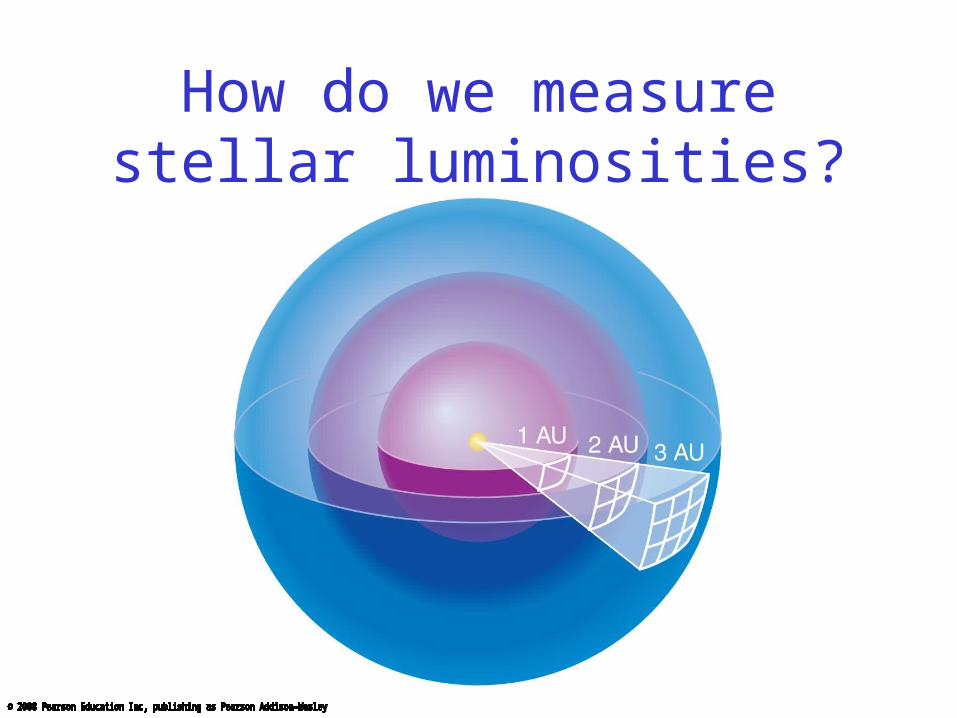
How do we measure stellar luminosities?
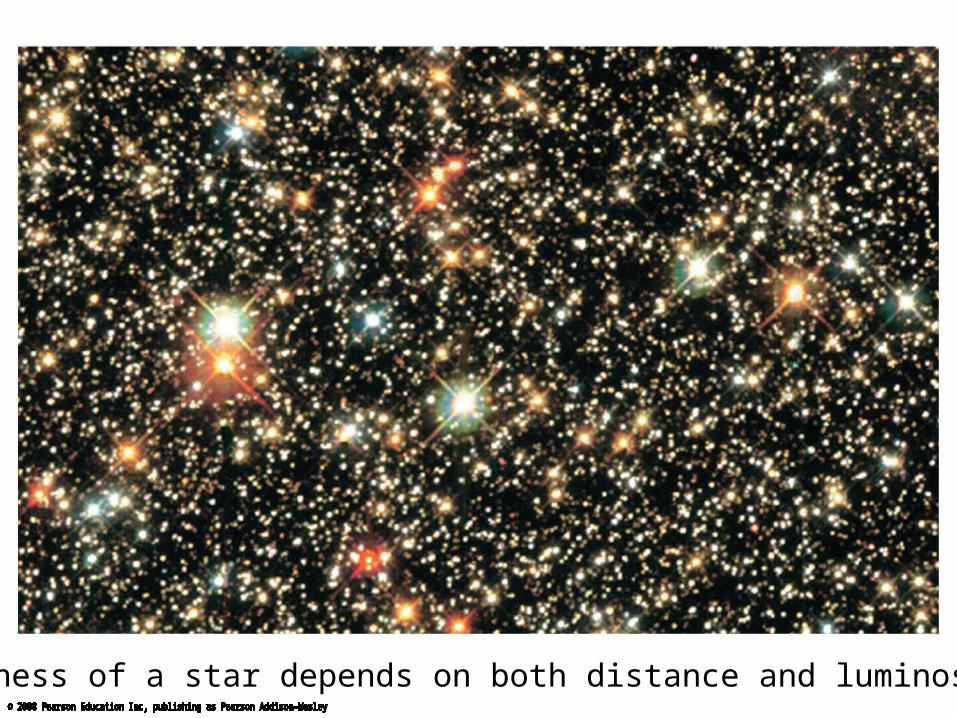
The brightness of a star depends on both distance and luminosity
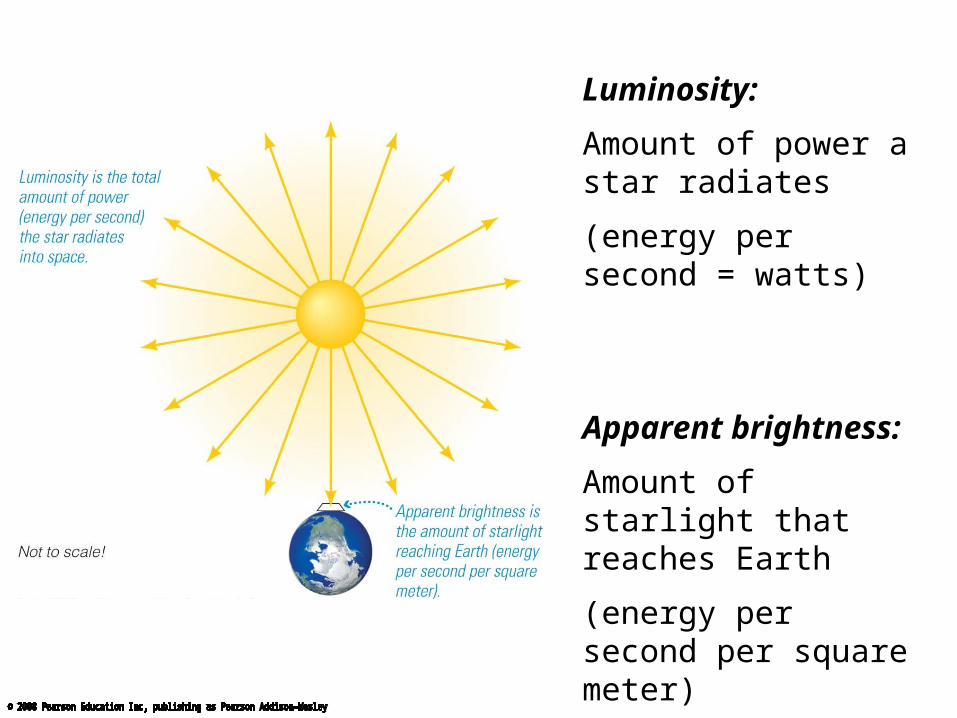
Luminosity:
Amount of power a star radiates
(energy per second = watts)
Apparent brightness:
Amount of starlight that reaches Earth
(energy per second per square meter)
Insert TCP 5e Figure 15.1

Thought Question
These two stars have about the same luminosity -- which one appears brighter?
A. Alpha CentauriB. The Sun

Thought Question
These two stars have about the same luminosity -- which one appears brighter?
A. Alpha CentauriB. The Sun

So how far are these stars?

Parallaxis the apparent shift in position of a nearby object against a background of more distant objects

Parallax angle depends on distance
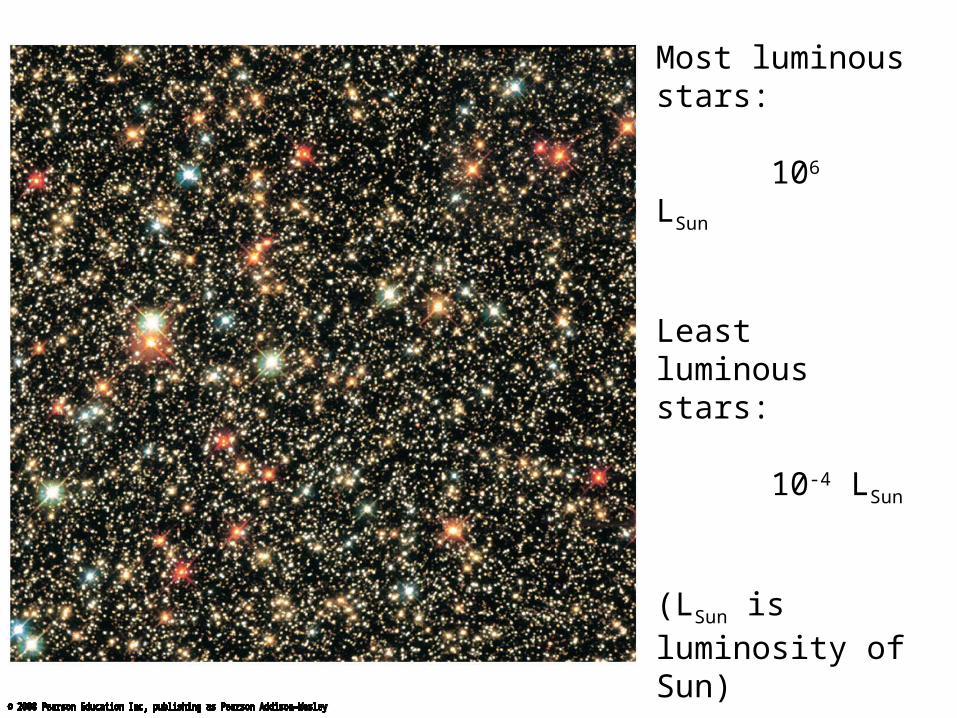
Most luminous stars:
106 LSun
Least luminous stars:
10-4 LSun
(LSun is luminosity of Sun)
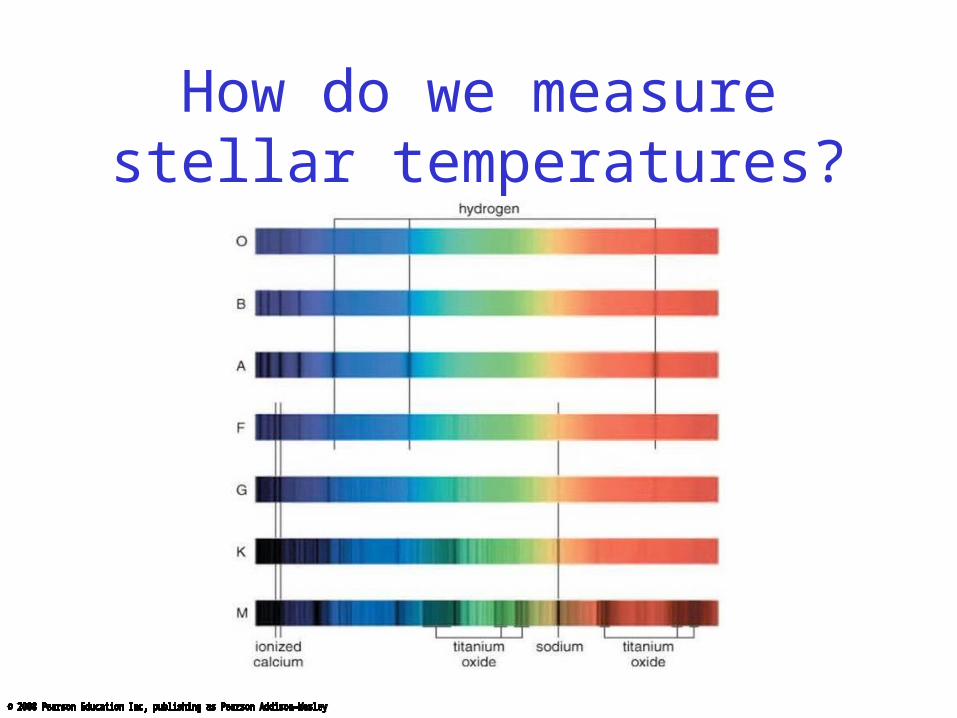
How do we measure stellar temperatures?

Every object emits thermal radiation with a spectrum that depends on its temperature
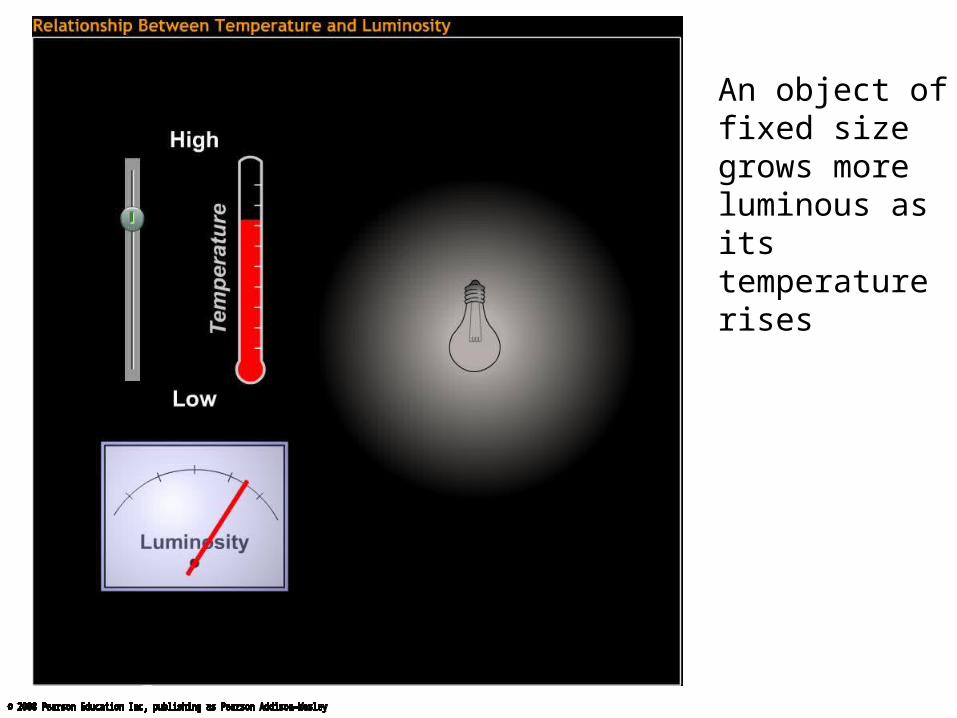
An object of fixed size grows more luminous as its temperature rises
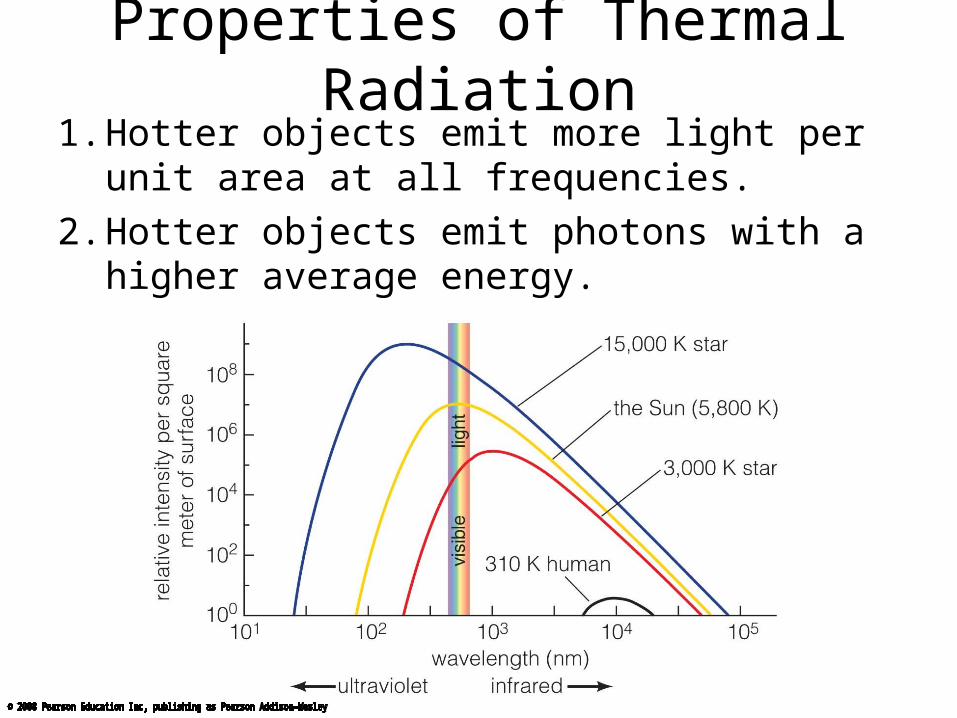
Properties of Thermal Radiation1. Hotter objects emit more light per unit area at all
frequencies.
2. Hotter objects emit photons with a higher average energy.
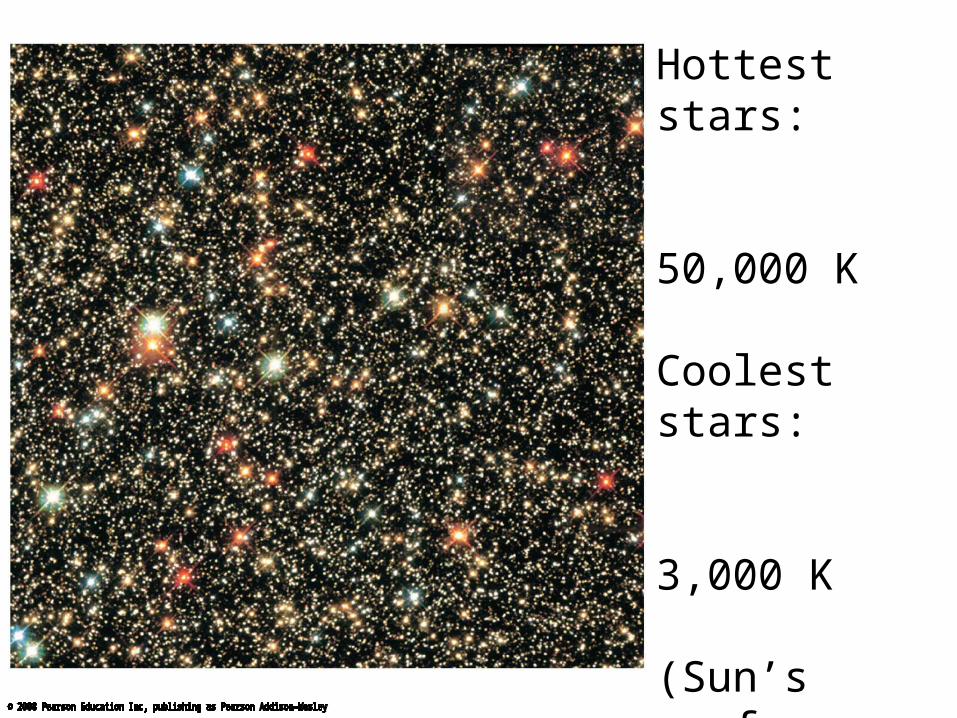
Hottest stars:
50,000 K
Coolest stars:
3,000 K
(Sun’s surface is 5,800 K)

Solid
Molecules
Neutral Gas
IonizedGas(Plasma)
Level of ionization also reveals a star’s temperature
10 K
102 K
103 K
104 K
105 K
106 K

Absorption lines in star’s spectrum tell us ionization level

Lines in a star’s spectrum correspond to a spectral type that reveals its temperature
(Hottest) O B A F G K M (Coolest)

(Hottest) O B A F G K M (Coolest)
Remembering Spectral Types
“Oh, Be A Fine Girl, Kiss Me”
Thought Question
Which kind of star is hottest?
A. M starB. F starC. A starD. K star

Thought Question
Which kind of star is hottest?
A. M starB. F starC. A starD. K star

How do we measure stellar masses?
The orbit of a binary star system depends on strength of gravity

Types of Binary Star Systems
• Visual Binary
• Eclipsing Binary
• Spectroscopic Binary
About half of all stars are in binary systems
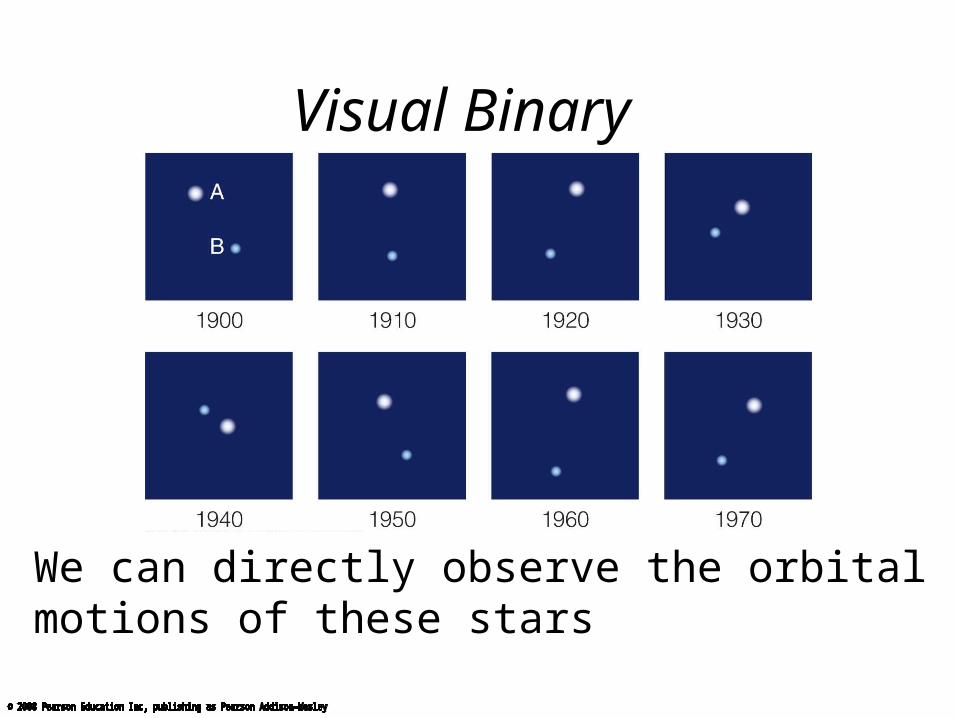
Visual Binary
We can directly observe the orbital motions of these stars

Eclipsing Binary
We can measure periodic eclipses

Spectroscopic Binary
We determine the orbit by measuring Doppler shifts

We measure mass using gravity
Direct mass measurements are possible only for stars in binary star systems
p = period
a = average separation
p2 = a3 4π2
G (M1 + M2)

Most massive stars:
100 MSun
Least massive stars:
0.08 MSun
(MSun is the mass of the Sun)

What have we learned?
• How do we measure stellar luminosities?– If we measure a star’s apparent brightness and
distance, we can compute its luminosity with the inverse square law for light
– Parallax tells us distances to the nearest stars
• How do we measure stellar temperatures?– A star’s color and spectral type both reflect its
temperature
What have we learned?
• How do we measure stellar masses?– Newton’s version of Kepler’s third law tells us
the total mass of a binary system, if we can measure the orbital period (p) and average orbital separation of the system (a)

Patterns Among Stars
Our goals for learning:
• What is a Hertzsprung-Russell diagram?
• What is the significance of the main sequence?
• What are giants, supergiants, and white dwarfs?
• Why do the properties of some stars vary?
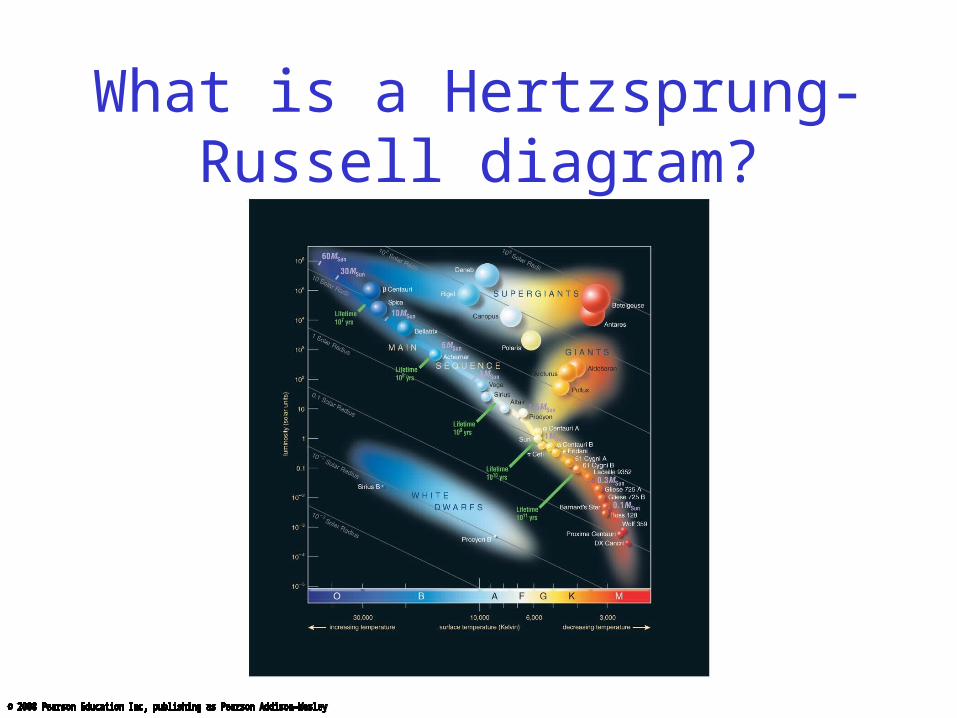
What is a Hertzsprung-Russell diagram?
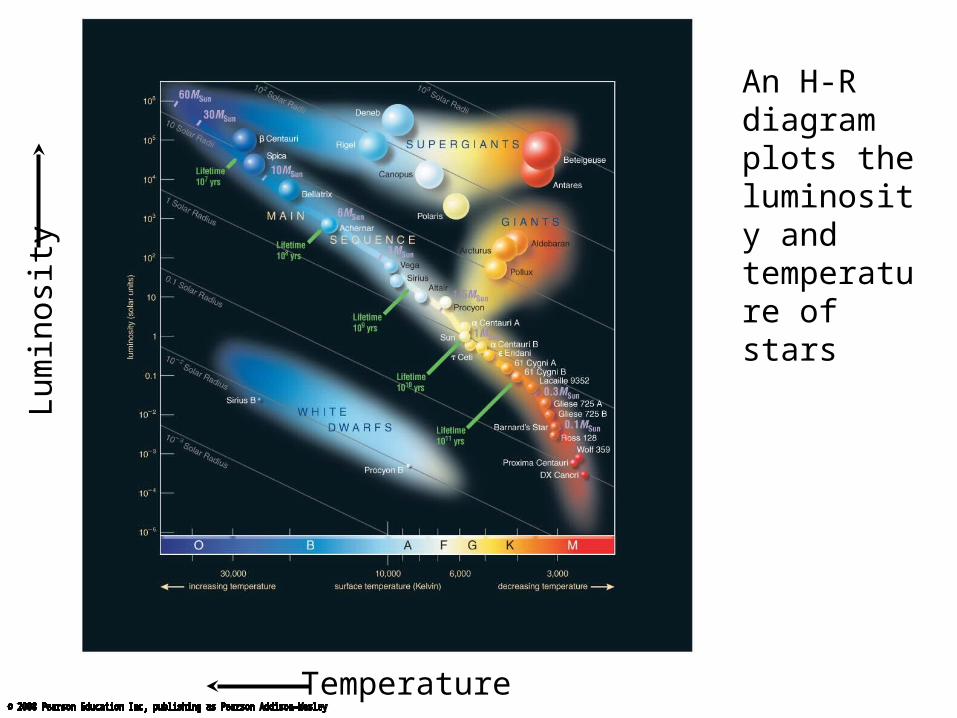
Temperature
Lu
min
osi
tyAn H-R diagram plots the luminosity and temperature of stars


Most stars fall somewhere on the main sequence of the H-R diagram
Main Sequence

Stars with lower T and higher L than main-sequence stars must have larger radii:
giants and supergiants
Large radius
Main Sequence
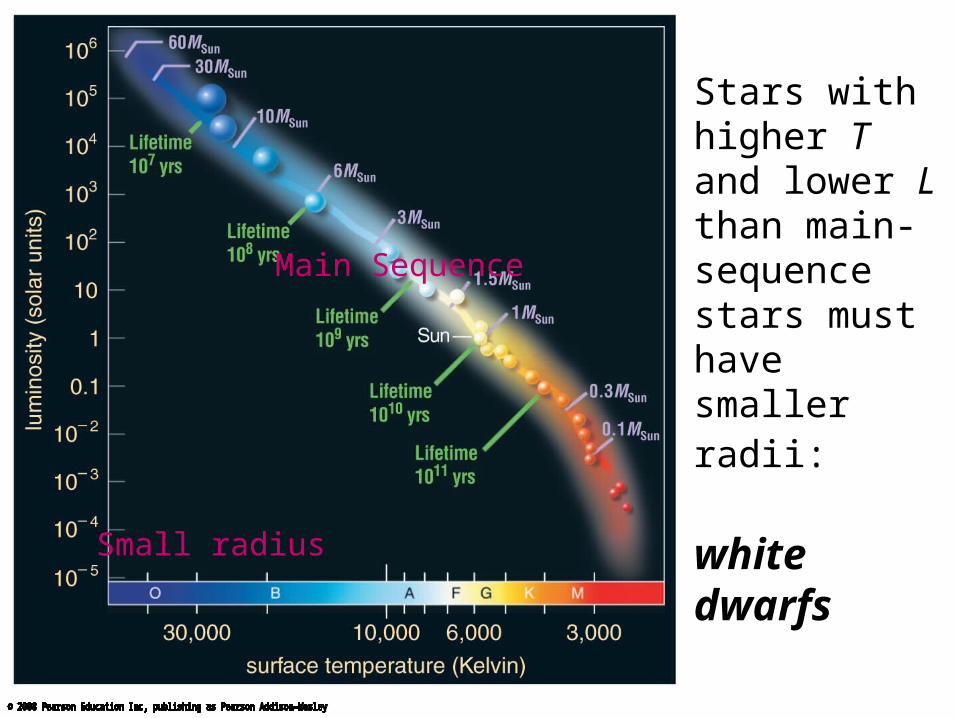
Small radius
Stars with higher T and lower L than main-sequence stars must have smaller radii:
white dwarfs
Main Sequence

A star’s full classification includes spectral type (line identities) and luminosity class (line shapes, related to the size of the star):
I - supergiantII - bright giantIII - giantIV - subgiantV - main sequence
Examples: Sun - G2 VSirius - A1 VProxima Centauri - M5.5 VBetelgeuse - M2 I
Temperature
Lu
min
osi
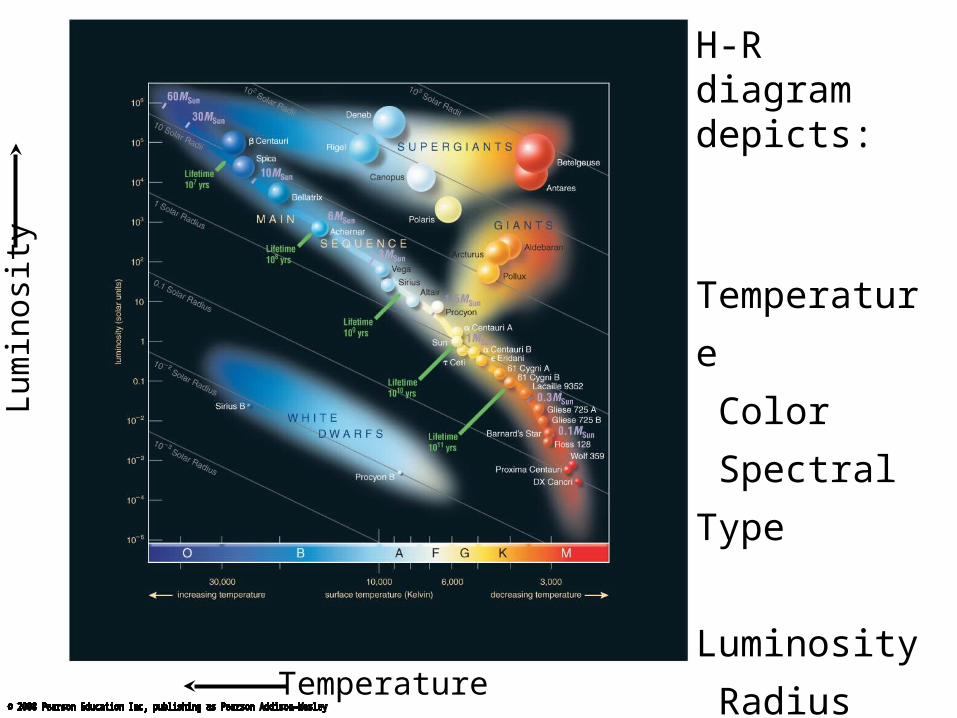
tyH-R diagram depicts:
Temperatur
e
Color
Spectral
Type
Luminosity
Radius

Temperature
Lu
min
osi
ty
Which star is the hottest?

Temperature
Lu
min
osi
ty
Which star is the hottest?
A

Temperature
Lu
min
osi
ty
Which star is the most luminous?

Temperature
Lu
min
osi
tyWhich star is the most luminous?
C
Temperature
Lu
min
osi
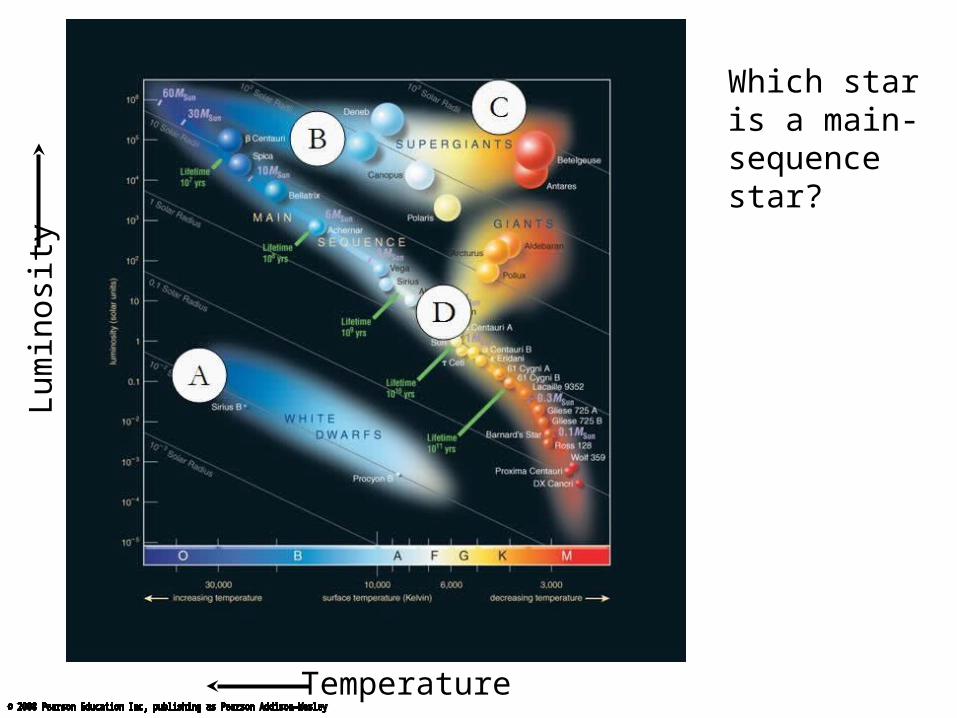
tyWhich star is a main-sequence star?

Temperature
Lu
min
osi
tyWhich star is a main-sequence star?
D

Temperature
Lu
min
osi
tyWhich star has the largest radius?

Temperature
Lu
min
osi
tyWhich star has the largest radius?
C

What is the significance of the main sequence?

Main-sequence stars are fusing hydrogen into helium in their cores like the Sun
Luminous main-sequence stars are hot (blue)
Less luminous ones are cooler (yellow or red)
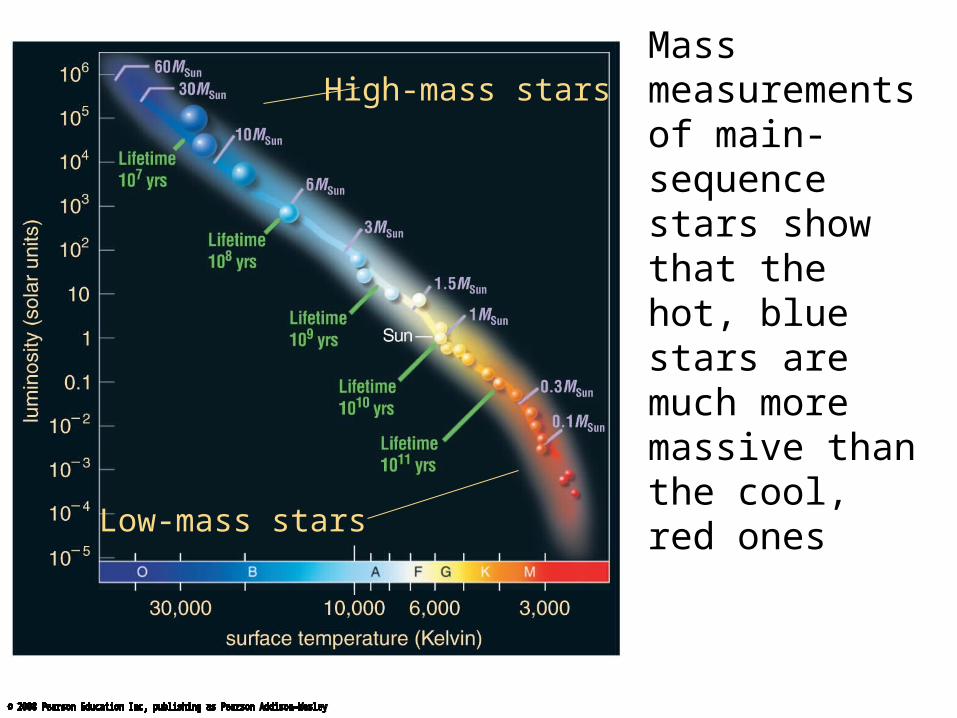
Mass measurements of main-sequence stars show that the hot, blue stars are much more massive than the cool, red ones
High-mass stars
Low-mass stars

The mass of a normal, hydrogen-burning star determines its luminosity and spectral type!
High-mass stars
Low-mass stars
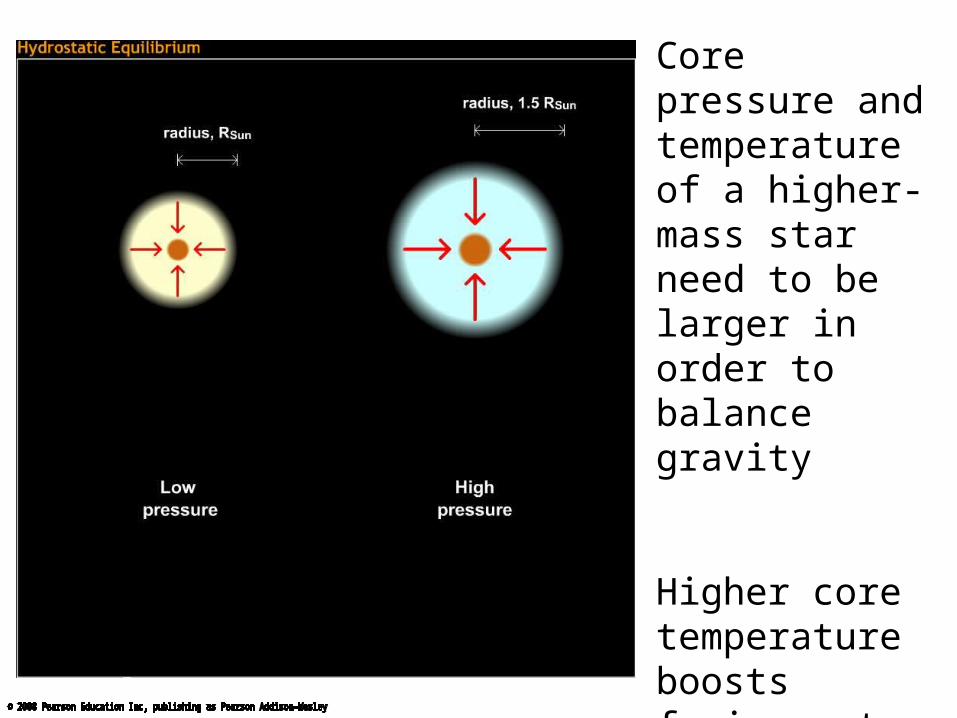
Core pressure and temperature of a higher-mass star need to be larger in order to balance gravity
Higher core temperature boosts fusion rate, leading to larger luminosity

Stellar Properties Review
Luminosity: from brightness and distance
10-4 LSun - 106 LSun
Temperature: from color and spectral type
3,000 K - 50,000 K
Mass: from period (p) and average separation (a) of binary-star orbit
0.08 MSun - 100 MSun

Stellar Properties Review
Luminosity: from brightness and distance
10-4 LSun - 106 LSun
Temperature: from color and spectral type
3,000 K - 50,000 K
Mass: from period (p) and average separation (a) of binary-star orbit
0.08 MSun - 100 MSun
(0.08 MSun) (100 MSun)
(100 MSun)(0.08 MSun)

Mass & Lifetime
Sun’s life expectancy: 10 billion years
Mass & Lifetime
Sun’s life expectancy: 10 billion years
Until core hydrogen(10% of total) is used up
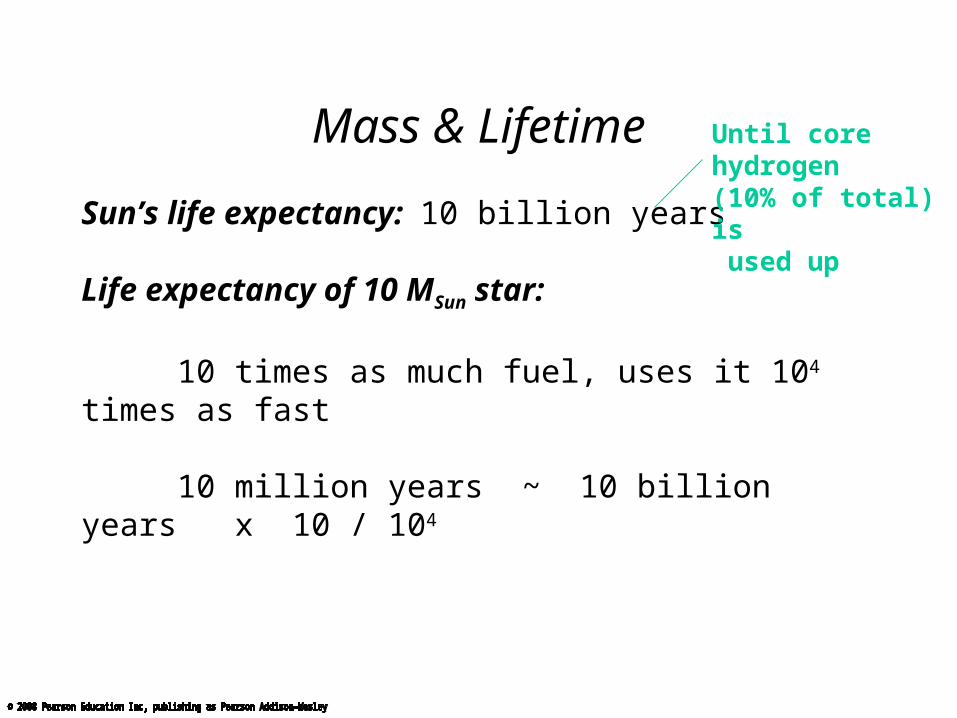
Mass & Lifetime
Sun’s life expectancy: 10 billion years
Life expectancy of 10 MSun star:
10 times as much fuel, uses it 104 times as fast
10 million years ~ 10 billion years x 10 / 104
Until core hydrogen(10% of total) is used up

Mass & Lifetime
Sun’s life expectancy: 10 billion years
Life expectancy of 10 MSun star:
10 times as much fuel, uses it 104 times as fast
10 million years ~ 10 billion years x 10 / 104
Life expectancy of 0.1 MSun star:
0.1 times as much fuel, uses it 0.01 times as fast
100 billion years ~ 10 billion years x 0.1 / 0.01
Until core hydrogen(10% of total) is used up

Main-Sequence Star SummaryHigh Mass:
High Luminosity Short-Lived Large Radius Blue
Low Mass:
Low Luminosity Long-Lived Small Radius Red

What are giants, supergiants, and white dwarfs?
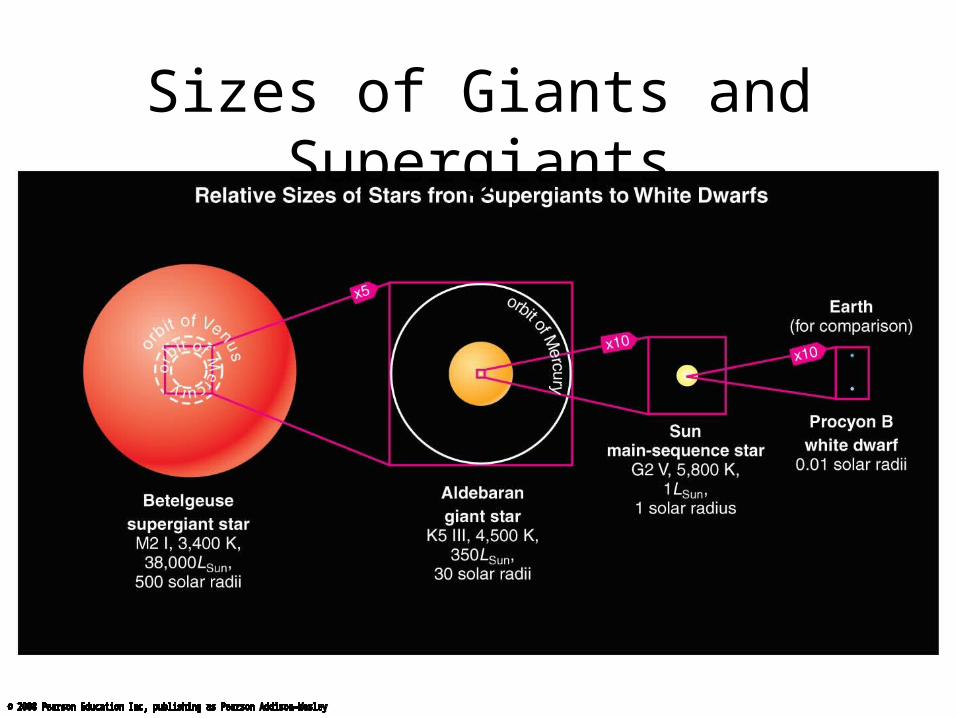
Sizes of Giants and Supergiants
Off the Main Sequence
• Stellar properties depend on both mass and age: those that have finished fusing H to He in their cores are no longer on the main sequence
• All stars become larger and redder after exhausting their core hydrogen: giants and supergiants
• Most stars end up small and white after fusion has ceased: white dwarfs

Temperature
Lu
min
osi
ty
Which star is most like our Sun?
A
B
C
D

Temperature
Lu
min
osi
tyWhich star is most like our Sun?
B
A
B
C
D
Temperature
Lu
min
osi
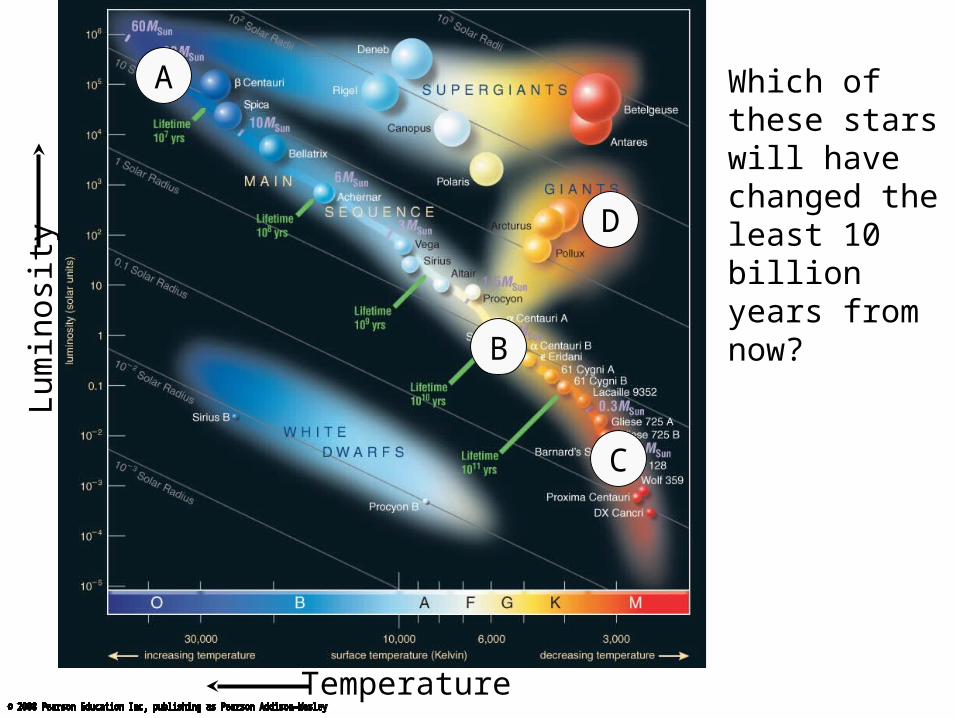
tyWhich of these stars will have changed the least 10 billion years from now?
A
B
C
D

Temperature
Lu
min
osi
tyWhich of these stars will have changed the least 10 billion years from now?
C
A
B
C
D

Temperature
Lu
min
osi
tyWhich of these stars can be no more than 10 million years old?
A
B
C
D

Temperature
Lu
min
osi
tyWhich of these stars can be no more than 10 million years old?
A
A
B
C
D

What have we learned?
• What is a Hertzsprung-Russell diagram?– An H-R diagram plots stellar luminosity of
stars versus surface temperature (or color or spectral type)
• What is the significance of the main sequence?– Normal stars that fuse H to He in their cores
fall on the main sequence of an H-R diagram– A star’s mass determines its position along the
main sequence (high-mass: luminous and blue; low-mass: faint and red)

What have we learned?
• What are giants, supergiants, and white dwarfs?– All stars become larger and redder after core
hydrogen burning is exhausted: giants and supergiants
– Most stars end up as tiny white dwarfs after fusion has ceased


