54
1 Williamson Local Energy Action Plan 2011
| Date post: | 04-Jun-2018 |
| Category: |
Documents |
| Upload: | sustainable-williamson |
| View: | 215 times |
| Download: | 0 times |

8/13/2019 Sustainable Williamson - Local Energy Action Plan
http://slidepdf.com/reader/full/sustainable-williamson-local-energy-action-plan 1/53
1
Williamson Local Energy Action Plan 2011

8/13/2019 Sustainable Williamson - Local Energy Action Plan
http://slidepdf.com/reader/full/sustainable-williamson-local-energy-action-plan 2/53
2
A. Introduction
Without easily accessible energy, our modern civilization would not exist. Like the rest of the
country, Williamson depends on reliable and affordable energy to keep its buildings illuminated
and comfortable, traffic lights functional, and vehicles mobile. This reliance on energy leads to
considerable debate on the sources and pricing of energy supplies. Consumers often advocate
lower energy prices; however, low prices do not necessarily lead to low total energy bills if
consumers live and work in energy inefficient buildings, drive inefficient cars, and/or commute
excessive distances. In these situations, increasing energy efficiency measures, rather than
decreasing prices, may be a more affordable energy solution for both individual consumers and
the greater community.
Many cities in the United States understand that investments in energy efficiency:
Reduce energy consumption;
Shield consumers from spikes in energy prices; and,
Decrease long-term operating costs of buildings and vehicles.
Therefore, these cities are developing plans that promote energy conservation and energy
efficiency within city operations and across their community. Cities are uniquely positioned to
reduce energy consumption and promote energy efficiency because they operate energy
intensive buildings, facilities, and vehicles. They also enact policies and regulations (e.g.,
building codes) that impact their community’s energy consumption.
Aside from the immediate desire to reduce energy bills, another motivation for adopting energy
plans is the concept of sustainability. The basic definition of sustainability is “development that
meets the needs of the present without compromising the ability of future generations to meet
their own needs.”1 Sustainability encompasses three areas of concern for local governments and
communities:
Economic development;
Equitable social inclusion; and,
Environmental performance.
Cities increasingly understand that the economy,
equity, and environment are not separate silos but
rather partners in improving their citizens’ quality
of life. Sustainability encompasses many topics that
affect the long-term economic, social, and
environmental well being of a community including
energy, land and water use, transportation, and
materials management. The focus of this Report,
however, is energy and the steps Williamson can
take to decrease its energy bills while at the same
time promote local job growth and reduce
ecological impacts.
1 Brundtland Commission. 1987. “Our Common Future.” Oxford University Press.
Figure A-1: Sustainability seeks to
ultimately enhance people’s quality of life.
EconomicDevelop-
ment
Environ-mental
Performance
EquitableSocial
Inclusion

8/13/2019 Sustainable Williamson - Local Energy Action Plan
http://slidepdf.com/reader/full/sustainable-williamson-local-energy-action-plan 3/53
3
Williamson Local Energy Action Plan
The Appalachian Regional Commission, U.S. Department of Energy, U.S. Department of
Agriculture, and local sources have provided funds for a range of projects in Williamson
including:
A Smart-Office to showcase energy saving techniques, spark entrepreneurship, and train
95 individuals in energy efficiency, green building standards, and solar technology;
Demonstration projects that will result in three solar installations, an Energy Star
certification for the Williamson Emergency Services building, and annual savings of at
least $2,500 for the City; and,
A Local Energy Action Plan (LEAP) that seeks to achieve energy savings by investing in
cost-effective and low impact technologies.
Southface, an Atlanta-based nonprofit with expertise in energy efficiency, was hired to assist the
Williamson LEAP project team with the formulation of Williamson’s LEAP. The planning
process for Williamson’s LEAP began with an identification of data required to inventory local
energy use (e.g., utility bills). Analysis of this information, the details of which are contained in
this LEAP Report, provided insight into the areas of greatest energy consumption. The analysis
of data was followed by a Charrette, i.e., collaborative workshop, led by Southface with diverse
participants including City personnel, Mingo County employees, members of various City
Boards, and Williamson citizens. These discussions helped prioritize goals and revealed local
and regional assets than Williamson can leverage to achieve energy savings, as well as barriers
that might hinder otherwise viable energy savings strategies.
Williamson LEAP Mission Statement
At the community meeting that kicked off the
Charrette on Monday evening, April 25, 2011, the
Southface team asked attendees to list words and
phrases that describe what Williamson’s LEAPshould embody and accomplish. Attendees suggested
words and phrase that fall into these general
categories:
Cost effective;
Efficiency;
Education; and,
Collaboration.
The Southface team took these words and phrases
and crafted two versions of a mission statement. Atthe conclusion of the findings presentation on
Wednesday evening, April 27, 2011, attendees were
asked to select the version that should be the
Williamson LEAP Mission Statement. By
unanimous decision, the attendees selected the
following Mission Statement:
Mission statement words and phrases
suggested by attendees of Williamson
LEAP Charrette kick off meeting,
Williamson Fire Chief Jerry Mounts
marks his selection for the Williamson
LEAP Mission Statement.

8/13/2019 Sustainable Williamson - Local Energy Action Plan
http://slidepdf.com/reader/full/sustainable-williamson-local-energy-action-plan 4/53
4
The Williamson Local Energy Action Plan
seeks cost-effective energy efficiency solutions
for the City of Williamson through energy
awareness, waste reduction, and reinvestment
of savings.
LEAP Report Structure
The data analysis and discussions with key stakeholders that formed the foundation of this
LEAP Report have resulted in a preliminary set of recommendations that will help Williamson
reduce its energy expenditures and spur local jobs creation. This LEAP Report also contains
information and templates that the City of Williamson can use to create department-, facility,
and building-level goals, which will help Williamson reduce its energy consumption and lower
its energy bills.
To discuss sustainable approaches to meeting Williamson’s energy needs, we must first
understand both the sources and consumers of energy. Therefore, this LEAP Report begins with
background information on energy and state-wide data regarding energy sources and end-
users.2 The LEAP Report continues with details of local energy usage, the results of the
Charrette, a high-level analysis of municipal buildings, an analysis of viable local sources of
renewable energy, and a discussion regarding financing sources. The next section provides
recommendations on how to reduce energy consumption of Williamson’s buildings, water and
sewage treatment plants, and vehicles, as well as recommendations on how to implement the
recommendations and templates that can be used to formulate department-, facility, and building-level goals, action items, and performance measurement metrics that will help the City
reduce its energy consumption and lower its energy bills.
2 While precise information regarding Williamson’s sources and consumers of energy is inaccessible, we can gain an understandingof the City’s statistics by referring to state-wide data. For example, the building, sewage treatment facility, and transportationsectors consume approximately 44 percent of all the energy consumed in West Virginia. Therefore, it can be inferred that thesesectors also consume at least 44 percent of the all the energy consumed in Williamson.

8/13/2019 Sustainable Williamson - Local Energy Action Plan
http://slidepdf.com/reader/full/sustainable-williamson-local-energy-action-plan 5/53
5
Renewable (e.g.,
Hydroelectric,
Biomass, Solar, and
Wind)
3.7%
Coal
66.9%
Natural Gas
10.3%
Petroleum
19.1%
Fossil Fuels
96.3%
B. Energy Overview
Simply defined, energy is the ability or potential to do work such as warm a building, provide
light, or move a vehicle. We can warm a building by burning natural gas in a furnace, illuminate
a street light by using electricity, and move a car by combusting gasoline. In these examples
natural gas, electricity, and gasoline are the types of energy that perform the work.
Types of Energy
Not all types of energy are the same. Fossil fuels (e.g., coal, oil, and natural gas) and uranium are
examples of primary energy sources because they contain energy directly from natural sources.
Solar and wind are examples of primary energy sources because they are natural sources of
energy. Electricity is a secondary energy source because it is produced from primary sources of
energy such as coal, nuclear, natural gas, solar, moving water (hydro), or wind. This distinction
is important because it takes a lot of primary energy to generate electricity. According to the
Department of Energy (DOE), the nation’s coal-fueled electric power plants convert only a third
of coal’s energy potential into electricity.3 Therefore, consumers save an even greater amount of
primary energy sources such as coal by using less electricity.
Another important distinction should be made between non-renewable and renewable energy
sources. Non-renewable energy sources such as coal, oil, natural gas, and nuclear are finite and
will eventually be depleted. By contrast, renewable energy sources such as solar, wind, hydro,
and biomass are either unlimited or can be quickly replenished.
Sources of West Virginia’s Energy
Energy for all Uses
Non-renewable fossil fuel energy sources dominate West Virginia’s energy portfolio. Figure B-1
contains the U.S. Energy Information Administration (EIA) 2009 estimates for West Virginia’s
primary energy sources.4 In that year, West Virginia got 96.3 percent of its energy from fossilfuels, which include coal, natural gas, and petroleum and the remaining 3.7 percent from
renewable sources.
Figure B-1: West Virginia Energy Consumption Estimates by Primary Sources (2009 EIA
Data)
3 Department of Energy. “Electric Power.” Available online: http://www.energy.gov/energysources/electricpower.htm. Referencedon June 15, 2011.
4 The West Virginia energy consumption estimates listed do not factor the difference between the amount of energy in the electricitysold within West Virginia and the energy input at the electric utilities within West Virginia. See U.S. Energy Information Administration. 2011. “Table C3. Primary Energy Consumption Estimates, 2009.” Available online:http://www.eia.gov/state/seds/hf.jsp?incfile=sep_sum/html/sum_btu_totcb.html. Referenced on Aug. 16, 2011.

8/13/2019 Sustainable Williamson - Local Energy Action Plan
http://slidepdf.com/reader/full/sustainable-williamson-local-energy-action-plan 6/53
6
Energy for Electricity Generation
Most of the electricity consumed in West Virginia is generated in thermoelectric power plants
that burn coal to produce heat. This heat boils water and creates steam that turns electricity-
generating turbines. In 2009, about 96.6 percent of all electricity generated in West Virginia was
from non-renewable energy sources. Only 3.4 percent of the electricity generated in West
Virginia in 2009 was from renewable energy sources.5
A Kilowatt Saved = A Kilowatt Earned
In addition to non-renewable and renewable energy sources, we should think of energy
efficiency as a source of energy. Every kilowatt of electricity saved is a kilowatt that does not
have to be generated. Every gallon of transportation fuel not used is a gallon that does not have
to be extracted. By improving energy efficiency, West Virginia can reduce demand for electricity,
natural gas, and transportation fuels. Moreover, the nature of energy conservation projects
requires local labor for activities such as improvements to existing buildings, which keeps more
local dollars within the community.
Consumers of West Virginia’s Energy
Figure B-2 contains 2009 West
Virginia energy consumption by
end-use sector.6 The residential
end-use sector, which consists of
living quarters for private
households,7 accounted for 21.1
percent of West Virginia’s energy
consumption. The commercial end-
use sector, which consists of office,
government, educational, religious,
and civic buildings, institutionalliving quarters, and sewage
treatment facilities,8 accounted for
15.6 percent of West Virginia’s
energy consumption. Therefore,
buildings and sewage treatment
facilities accounted for the largest portion of energy consumed in West Virginia in 2009. The
industrial end-use sector, which includes energy used for mining and construction,9 accounted
for 38.3 percent and the transportation end-use sector accounted for 23.1 percent. Because of
the limited amount of mining and other industrial activities that occur within the Williamson
5 U.S. Energy Information Administration. 2011. “Table 4. State Total Electric Power Industry Net Generation, by Energy Source,2004 - 2008.” Available online: http://www.eia.gov/cneaf/solar.renewables/page/state_profiles/excel/rspt04wv.xls. Referencedon Dec. 20, 2011.
6 U.S. Energy Information Administration. 2011. “Table C10. Energy Consumption by End-Use Sector, Ranked by State, 2009.” Available online: http://www.eia.gov/state/seds/hf.jsp?incfile=sep_sum/html/rank_use.html. Referenced on Aug. 16, 2011.
7 U.S. Energy Information Administration. 2011. “Glossary R.” Available online:http://www.eia.doe.gov/tools/glossary/index.cfm?id=R . Referenced on May 25, 2011.
8 U.S. Energy Information Administration. 2011. “Glossary C.” Available online:http://www.eia.doe.gov/tools/glossary/index.cfm?id=C. Referenced on May 25, 2011.
9 U.S. Energy Information Administration. 2011. “Glossary I.” Available online:http://www.eia.doe.gov/tools/glossary/index.cfm?id=I. Referenced on May 25, 2011.
Industrial38.3%
Transpor-
tation
23.1% Commercial
15.6%
Residential
23.1%
Buildings
and Sewage
Treatment
Facilities
38.7%
Figure B-2: West Virginia Energy Consumption by
End Use Sector (2009 EIA Data)

8/13/2019 Sustainable Williamson - Local Energy Action Plan
http://slidepdf.com/reader/full/sustainable-williamson-local-energy-action-plan 7/53
7
city limits, buildings and sewage treatment facilities probably account for more than 38.7
percent of Williamson’s community-wide total energy consumption.
Economic Benefits of Energy Efficiency and Renewable Energy
Lower Bills
The immediate benefit of consuming less energy is a lower energy bill. Reducing the bills paid by
local governments, businesses, and residents is an important motivator even in a state that hassome of the lowest electricity rates in the nation. Table B-1 shows that West Virginia’s
residential and commercial electricity rates are considerably below the national average.10
However, lower rates do not necessarily
result in lower overall bills. Table B-1
also shows that West Virginia
residential and commercial average
electricity rates increased more than
the national average between March
2007 and March 2011. West Virginia’s
average residential electricity rate rose45.7 percent while the national average
residential electricity rate only rose 14
percent. West Virginia’s average
commercial electricity rate rose 41.1
percent, which was also much steeper
than the national average commercial
electricity rate increase of 7.3 percent.
West Virginia local governments,
businesses, and residents have
been squeezed by these sharplyincreasing electricity rates. The
average West Virginia home paid
$94.17 a month for electricity in
2010.11 Improving a home’s
energy efficiency is quick way to
reduce this bill. As shown in
Table B-2, the average home in
West Virginia consumes
considerably more energy than
the national average. Even when
compared to its neighbors, West Virginia’s homes have much room for efficiency improvements.In 2009, the average home in West Virginia consumed 32.5 percent more energy than the
10 Information contained in the “epmxlfile5_6_a.xls” file within each year’s “June” issue of the U.S. Energy Information Administration Electronic Power Monthly. Back Issues containing historical excel tables available online:http://www.eia.gov/cneaf/electricity/epm/epm_ex_bkis.html. Referenced on June 15, 2011.
11 The Intelligencer / Wheeling News-Register. Jan. 2011. “W. Va. Utility rates decreased in 2010.” Available online:http://www.theintelligencer.net/page/content.detail/id/127492/W-Va--utility-rates-decreased-in-2010-.html?isap=1&nav=535.Reference on June 15, 2011.
Table B-1: Comparison of West Virginia and
National Electricity Rates
Period
Residential Averages
Commercial Averages
WV US WV US
March 2007 6.26¢ 10.21¢ 5.76¢ 9.37¢
March 2008 6.70¢ 10.57¢ 5.97¢ 9.62¢
March 2009 7.72¢ 11.33¢ 6.92¢ 10.07¢
March 2010 8.42¢ 11.21¢ 7.54¢ 10.08¢
March 2011 9.12¢ 11.64¢ 8.13¢ 10.05¢
Table B-2: Comparison of West Virginia, Pennsylvania,
Ohio, and National Residential Electricity Consumption
Period WV
Monthly Average
PAMonthly Average
OH Monthly Average
USMonthly Average
2005 1,12o kWh 868 kWh 923 kWh 938 kWh
2006 1,075 kWh 831 kWh 875 kWh 920 kWh
2007 1,138 kWh 874 kWh 926 kWh 936 kWh
2008 1,135 kWh 861 kWh 910 kWh 920 kWh
2009 1,116 kWh 842 kWh 878 kWh 908 kWh

8/13/2019 Sustainable Williamson - Local Energy Action Plan
http://slidepdf.com/reader/full/sustainable-williamson-local-energy-action-plan 8/53
8
average Pennsylvania home and 27.1 percent more energy than the average Ohio home. 12 Given
this difference between West Virginia and its neighbors, there is ample room for reducing the
energy consumed in Williamson.
Local governments that have implemented energy
efficiency initiatives and increased use of
renewable energy sources have seen a reduction in
their energy bills. In 2005, the U.S. localgovernments that participated in ICLEI’s Cites for
Climate Protection Program collectively reduced
emissions by approximately 23 million tons and
saved $600 million in related energy costs.13
According to the American Council for an Energy-
Efficient Economy (ACEEE), if West Virginia
implemented a proposed federal Energy Efficiency
Resource Standard that results in 15 percent
electricity savings and 10 percent natural gas
savings between 2011 and 2020, then West
Virginia would save 5,132 gigawatts of electricity by 2020.14 This is enough electricity to powerapproximately 383,214 West Virginia homes for a year (based on average 2009 electricity
consumption).15 The ACEEE calculates that implementation of such an Energy Efficiency
Resource Standard would reduce West Virginia’s energy bill by more than $920 million by
2020, which would result in about $1,280 in savings per household from energy efficiency
measures installed by 2020.16
Local Jobs
West Virginia produces over 13 percent of the nation’s coal and is the second largest producer of
coal in the country. It goes without saying that coal mining is a vital component of West
Virginia’s and Mingo County’s economy. Coal mining companies employed over 1,500 people in
Mingo County in 2008.17 However, it would be a mistake to view West Virginia as simply a “coal
state.” As discussed above, coal is stored energy. And it is just one form of energy that West
Virginia exports to other states. In addition to being a net exporter of coal, West Virginia leads
the nation in net intestate electricity exports.18 Therefore, it is more appropriate to think of West
12 Information contained in the “Table 5” files within each year’s issue of the U.S. Energy Information Administration “Back Issues:Electronic Sales, Revenue, and Price.” Available online: http://www.eia.gov/cneaf/electricity/esr/backissues.html. Referenced on Aug. 9, 2011. 13 “U.S. Mayors’ Climate Protection Agreement – Climate Action Handbook.” ICLEI Local Governments for Sustainability, City ofSeattle, and U.S. Conference of Mayors. Available online:http://www.iclei.org/documents/USA/documents/CCP/Climate_Action_Handbook-0906.pdf . Reference on June 7, 2011.
14 Furrey, L.A., S. Nadel,, and J.A. Laitner. Mar. 2009. “Laying the Foundation for Implementing a Federal Energy Efficiency
Resource Standard.” Available online: http://www.aceee.org/research-report/e091. Referenced on June 9, 2011.15 Based on average West Virginia residential electricity consumption in 2009. See U.S. Energy Information Administration. 2011.“Table 5. Average Monthly Bill by Census Division, and State 2009.” Available online: www.eia.doe.gov/cneaf/electricity/esr/table5_a.xls. Referenced on May 24, 2011.
16 The per household savings amount is based on a national electricity savings figures divided by the U.S. Census Bureau estimationof U.S. households in the year 2020. See Furrey, L.A., S. Nadel,, and J.A. Laitner. Mar. 2009. “Laying the Foundation forImplementing a Federal Energy Efficiency Resource Standard.” Available online: http://www.aceee.org/research-report/e091.Referenced on June 9, 2011.
17 Bureau of Business and Economic Research, West Virginia University and Center for Business and Economic Research, MarshallUniversity. Feb. 2010. “The West Virginia Coal Economy.” Available online: http://www.be.wvu.edu/bber/pdfs/BBER-2010-04.pdf .Referenced on June 15, 2011.
18 W.V. Department of Commerce. 2011. “Power” Available online: http://www.wvcommerce.org/mobile/business/why-west- virginia/power/default.aspx. Referenced on Aug. 8, 2011.
Energy efficiency can lower the City's, as well
as its residents' and businesses' utility bills.
Image by Sarah Gilbert, Flickr via Creative
Commons Attribution.

8/13/2019 Sustainable Williamson - Local Energy Action Plan
http://slidepdf.com/reader/full/sustainable-williamson-local-energy-action-plan 9/53
9
Virginia as an “energy state.” As it does with coal and electricity, West Virginia can tap into its
energy efficiency and renewable energy potential to generate local jobs.
Despite the vital importance of the coal industry, it cannot pull West Virginia and Mingo County
out of the recession by itself. As of May 2011, Mingo County has an unemployment rate of 9.8
percent, which is higher than the state unemployment rate of 8.6 percent. 19 The Williamson /
Mingo County area recognizes that it has to diversify the jobs base. For example, the TransGas
Development Systems coal-liquefaction plant inMingo County will take about four years to build,
create approximately 3,000 construction jobs
during that time, and provide 300 full-time jobs
once operational.20
Energy efficiency and increased use of renewable
energy sources can also complement the coal
industry and spur local economic growth. The
nature of energy efficiency and renewable energy
projects requires local labor for activities such as
improvements to existing buildings and installation
of solar panels. A 2009 study by the University of
Massachusetts-Amherst and the Center for
American Progress calculates that one million
dollars invested in fossil fuels creates about 5.3 jobs.
In contrast, a one million dollar investment in
energy efficiency and clean energy creates
approximately 16.7 jobs.21 The ACEEE estimates
that by reaching year 2020 Energy Efficiency
Resources Standard targets, West Virginia could
create approximately 1,447 jobs.22
Diversified Energy Sector
Being a major exporter of coal and electricity generated by coal, West Virginia is uniquely
positioned to reap the benefits from expenditures in fossil fuels as well as energy efficiency and
clean energy. For example, investing in electricity efficiency will lower consumers’ electricity
consumption. This benefits consumers directly through lower bills. It also benefits West Virginia
by creating local jobs in the electricity conservation/efficiency sector (e.g., construction jobs).
Reduced local electricity consumption can allow West Virginia to expand economic growth using
the electricity output of its existing electricity generation plants rather than having to construct
new plants to meet increased electricity needs. Moreover, reduced local peak-demand
19 Bureau of Labor Statistics. Jun. 2011. “Unemployment Rates by County in West Virginia, April 2011.” Available online:http://www.bls.gov/ro3/wvlaus.htm. Reference on Aug. 8, 2011.
20 The Times West Virginian. May 2011. “Coal-to-gas project in Mingo County can be powerful message in U.S. energy policy.” Available online: http://timeswv.com/editorials/x2108373993/Coal-to-gas-project-in-Mingo-County-can-be-powerful-message-in-U-S-energy-policy . Reference on June 15, 2011.
21 Pollin, R., J. Heintz, H. Garrett-Peltier, B. Hendricks, and M. Ettlinger. Jun. 2009. “The Economic Benefits of Investing in CleanEnergy.” Department of Economics and Political Economy Research Institute, University of Massachusetts, Amherst and Center for American Progress. Available online: http://thecopenhagenstory.files.wordpress.com/2010/04/economic-benefits-of-investing-in-clean-energy.pdf. Referenced on June 6, 2011.
22 Furrey, L.A., S. Nadel,, and J.A. Laitner. Mar. 2009. “Laying the Foundation for Implementing a Federal Energy EfficiencyResource Standard.” Available online: http://www.aceee.org/research-report/e091. Referenced on June 9, 2011.
Worker applying insulation during a
retrofit of a building. Image by Community
Environmental Center, Flickr.

8/13/2019 Sustainable Williamson - Local Energy Action Plan
http://slidepdf.com/reader/full/sustainable-williamson-local-energy-action-plan 10/53
10
consumption of electricity increases the value of West Virginia’s coal resource by allowing the
State’s utilities to sell excess electricity to neighboring states during times of peak demand.
Strategies for Williamson to Reduce Impact of Energy Consumption
The cheapest energy is the energy not
used. Therefore, Williamson’s sustainable
energy policies should first focus onenergy reduction and efficiency and then
on clean renewable energy sources to
maximize the impact of its and the
community’s investments. For example,
placing a solar panel on a building that has
inadequate insulation will simply waste
expensive solar energy. The upfront capital
required to purchase and install the solar
panel will not yield the expected return
because of the inefficiency of the building.
However, if that capital is first invested inimproving building efficiency, then the
resulting savings in utility bills can be used
towards the purchase of solar panels,
which can further reduce the building’s
utility bills and reduce the community’s
reliance on non-renewable energy sources.
This LEAP Report directs Williamson to prioritize its sustainable energy policies to focus on
those that result in the greatest energy savings and cost reductions with the least amount of
upfront investment. To this end, Williamson should follow the energy sustainability principles
prioritized in Figure B-3 in order to make Williamson’s energy consumption more sustainable. Williamson should keep in mind, however, that there are opportunities to address energy
efficiency and renewable local energy production at the same time. Where such opportunities
are identified, Williamson should assess the cost effectiveness of concurrently pursing energy
efficiency and renewable local production.
1. Energy Reduction and Efficiency
Williamson should primarily focus on energy efficiency because energy efficiency is cheaper and
produces benefits much faster than installing alternate sources of energy. Arguably, the cost of
energy efficiency can be zero. It costs nothing to change behavior, for example turning off the
lights when leaving the office. Even if we consider energy efficiency capital investments, energy
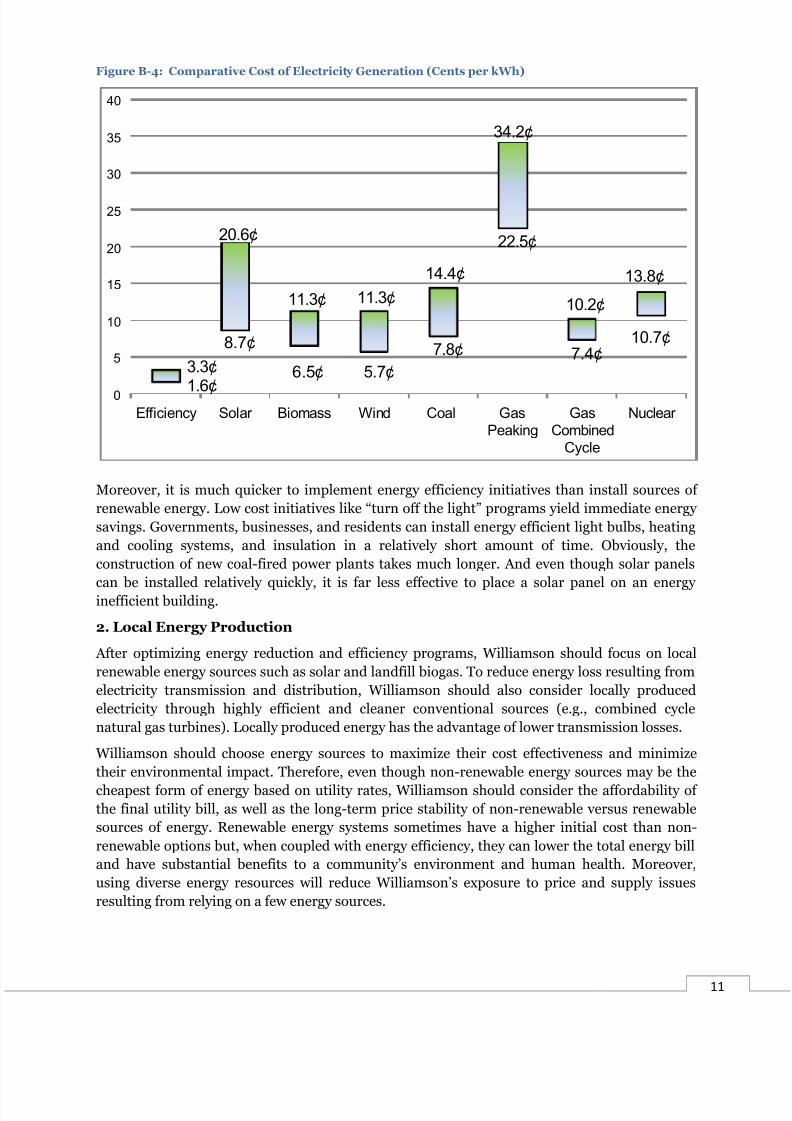
efficiency is still the most cost-effective source of energy. Based on analysis performed by ACEEE, the U.S. average cost for electricity efficiency is 2.5¢ per kilowatt-hour (kWh), with a
range of 1.6¢ to 3.3¢ per kWh.23 As shown in Figure B-4, this is considerably lower than the cost
of obtaining electricity from any non-renewable or renewable energy source.24
23 Friedrich K., M. Eldridge, D. York, P. Witte, and M. Kushler. Sep. 2009. “Saving Energy Cost-Effectively: A National Review of theCost of Energy Saved through Utility-Sector Energy Efficiency Programs.” Available online: http://www.aceee.org/research-report/u092. Referenced on June 9, 2011.
24 Solar, biomass, wind, coal, and nuclear data obtained from Lazard. See “Levelized Cost of Energy Analysis – Version 3.0.” Lazard.Feb. 2009. Available online: http://www.cleanenergy.org/images/factsheets/Lazard2009_LevelizedCostofEnergy.pdf . Referencedon June 9, 2011.
1. Energy Reduction
and Efficiency
2. Local Energy
Production
3. Capture and Reuse
Wasted Energy
Figure B-3: Energy Sustainability Principles
8/13/2019 Sustainable Williamson - Local Energy Action Plan
http://slidepdf.com/reader/full/sustainable-williamson-local-energy-action-plan 11/53
11
Figure B-4: Comparative Cost of Electricity Generation (Cents per kWh)
Moreover, it is much quicker to implement energy efficiency initiatives than install sources of
renewable energy. Low cost initiatives like “turn off the light” programs yield immediate energy
savings. Governments, businesses, and residents can install energy efficient light bulbs, heating
and cooling systems, and insulation in a relatively short amount of time. Obviously, the
construction of new coal-fired power plants takes much longer. And even though solar panels
can be installed relatively quickly, it is far less effective to place a solar panel on an energyinefficient building.
2. Local Energy Production
After optimizing energy reduction and efficiency programs, Williamson should focus on local
renewable energy sources such as solar and landfill biogas. To reduce energy loss resulting from
electricity transmission and distribution, Williamson should also consider locally produced
electricity through highly efficient and cleaner conventional sources (e.g., combined cycle
natural gas turbines). Locally produced energy has the advantage of lower transmission losses.
Williamson should choose energy sources to maximize their cost effectiveness and minimize
their environmental impact. Therefore, even though non-renewable energy sources may be the
cheapest form of energy based on utility rates, Williamson should consider the affordability ofthe final utility bill, as well as the long-term price stability of non-renewable versus renewable
sources of energy. Renewable energy systems sometimes have a higher initial cost than non-
renewable options but, when coupled with energy efficiency, they can lower the total energy bill
and have substantial benefits to a community’s environment and human health. Moreover,
using diverse energy resources will reduce Williamson’s exposure to price and supply issues
resulting from relying on a few energy sources.
1.6¢
8.7¢
6.5¢ 5.7¢
7.8¢
22.5¢
7.4¢10.7¢
3.3¢
20.6¢
11.3¢ 11.3¢
14.4¢
34.2¢
10.2¢
13.8¢
0
5
10
15
20
25
30
35
40
Efficiency Solar Biomass Wind Coal Gas
Peaking
Gas
Combined
Cycle
Nuclear

8/13/2019 Sustainable Williamson - Local Energy Action Plan
http://slidepdf.com/reader/full/sustainable-williamson-local-energy-action-plan 12/53
12
3. Capture and Reuse Wasted Energy
Williamson should identify opportunities to capture and reuse waste heat to power auxiliary
energy generating turbines, provide heat for industrial purposes, or provide climate control for
buildings. To facilitate the capture and reuse of otherwise wasted energy, Williamson should
foster the co-location of complementary energy production/energy consumption facilities (e.g.,
industrial parks that use biogas obtained from an adjacent landfill or wastewater treatment
plants).

8/13/2019 Sustainable Williamson - Local Energy Action Plan
http://slidepdf.com/reader/full/sustainable-williamson-local-energy-action-plan 13/53
13
C. Analyses and Recommendations
The centerpiece of the LEAP planning process was the Charrette, which the National Charrette
Institute defines as “a multi-day, collaborative workshop harnessing the talents and energies of
all interested parties to create and support a feasible plan that represents transformative
community change.” A charrette engages a variety of stakeholders at levels appropriate to their
involvement in the project. It provides short feedback loops to check progress against goals set
for the project. A charrette also reduces the chance of repetitive work and revisions by having
the professionals, officials, and stakeholders all together in planning sessions.
To prepare for the Charrette, the Williamson LEAP project team and Southface reviewed utility
bills, building inventories, and vehicle inventories to gain an understanding of Williamson’s
energy consumption. This background information provided Southface and the LEAP project
team with insight into Williamson’s current energy landscape and helped the LEAP Team
identify a list of stakeholders to invite to a Charrette.
The Charrette was conducted in Williamson by Southface.
After substantial preparations by Southface and the LEAP
Project team, a community meeting kicked off the Charretteon Monday evening, April 25, 2011. Participants received
background information about the LEAP planning process
and objectives, an overview of West Virginia energy data, an
introduction to energy sustainability principles, an
explanation of the tasks of an energy coordinator, and
details regarding funding options. This was followed by a
full day of interviews with key stakeholders on Tuesday
April 26, 2011 and a half-day of interviews with key
stakeholders on Wednesday April 27, 2011. The following
stakeholders were interviewed:
John Stallard and Jason Allen –Veolia Water
Charley McCoy – Tug Valley Chamber of Commerce and First National Bank
Leigh Ann Ray – Mingo County Grant Writer and Project Manager
Lisa Vaughn – Williamson Utility Office
Reverend Settles – Williamson Utility Board
Jared Fletcher – Mingo County Emergency Medical Services and Downtown Williamson
Property Owner
Pierce Whitt, Curt Phillips, and Chris Ooten – Parks and Recreation Board
Anne Lambright – Williamson Redevelopment Authority
Dr. Dino Beckett – Williamson Redevelopment Authority and Downtown Williamson
Property Owner
Margaret Conner – Real Estate 2
Larry Brown Jr. – City of Williamson
During these stakeholder interviews, Southface and the LEAP Project Team obtained
background information, utility bills, technical information, and feedback from the
stakeholders, as well as the names of additional individuals with whom to speak. The Charrette
closed with a findings presentation on Wednesday evening, April 27, 2011.
The findings presentation held on
Wednesday evening, April 27, 2011.
8/13/2019 Sustainable Williamson - Local Energy Action Plan
http://slidepdf.com/reader/full/sustainable-williamson-local-energy-action-plan 14/53
14
After the Charrette, Southface and the LEAP project team requested and reviewed additional
data regarding City-owned buildings and utilities, as well as geographic information system data
and National Renewable Energy Laboratory data regarding the viable renewable energy sources
available to Williamson. The result of these analyses and the Charrette process is a LEAP Report
that focuses on energy reduction and energy efficiency strategies that should be effective in
Williamson based on stakeholder input and local assets than Williamson can leverage to achieve
energy savings.
Williamson Buildings and Facilities
Municipal Buildings and Facilities: Overview
The City of Williamson has the following buildings and facilities in its inventory:
Field House;
Community Center and swimming pool;
City Hall;
Emergency Services Building; and
City Garage.
The City also has four water tanks (Goodwin, Sycamore, Gaujot, and College Hill), traffic lights,
miscellaneous outdoor lights, and pumps at the floodwall. The City pays for the electricity
consumed by street lights. Veolia Environmental Services (Veolia) operates the City-owned
water treatment plant and wastewater treatment plant.
Municipal Utility Cost Analysis25
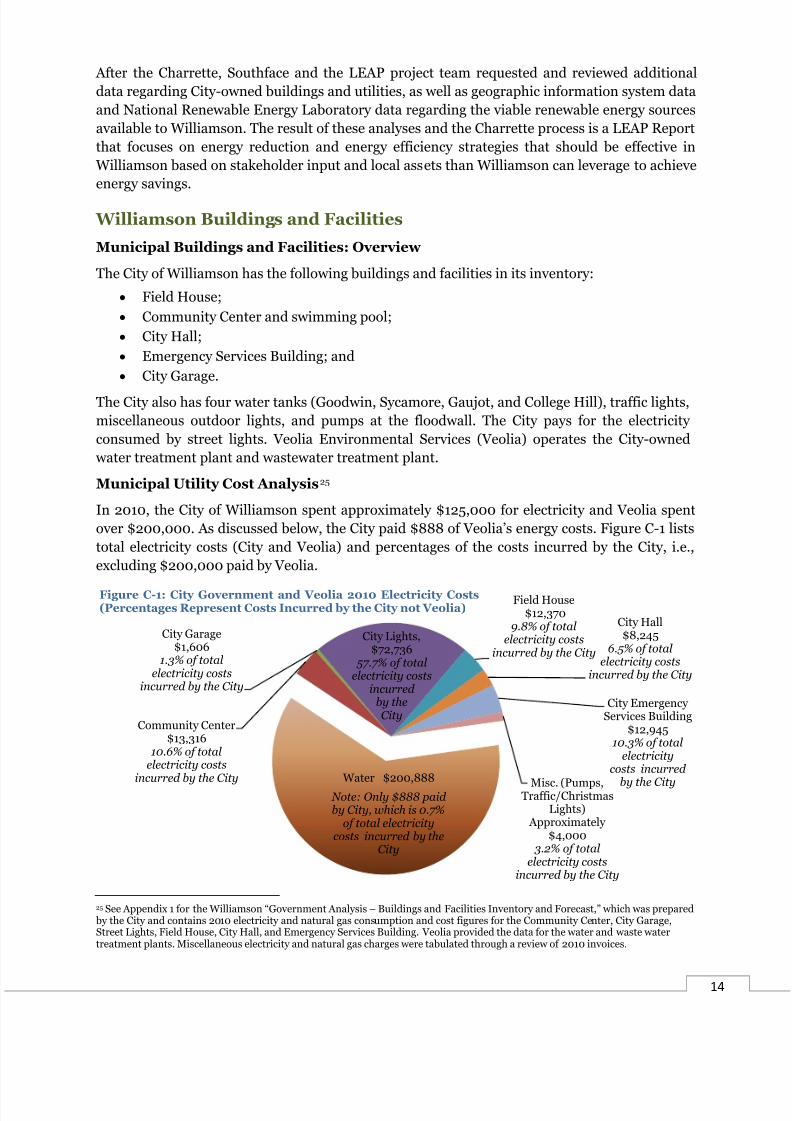
In 2010, the City of Williamson spent approximately $125,000 for electricity and Veolia spent
over $200,000. As discussed below, the City paid $888 of Veolia’s energy costs. Figure C-1 lists
total electricity costs (City and Veolia) and percentages of the costs incurred by the City, i.e.,
excluding $200,000 paid by Veolia.
25 See Appendix 1 for the Williamson “Government Analysis – Buildings and Facilities Inventory and Forecast,” which was prepared by the City and contains 2010 electricity and natural gas consumption and cost figures for the Community Center, City Garage,Street Lights, Field House, City Hall, and Emergency Services Building. Veolia provided the data for the water and waste watertreatment plants. Miscellaneous electricity and natural gas charges were tabulated through a review of 2010 invoices.
Water $200,888
Note: Only $888 paidby City, which is 0.7%
of total electricitycosts incurred by the
City
Community Center$13,316
10.6% of totalelectricity costs
incurred by the City
City Garage$1,606
1.3% of totalelectricity costs
incurred by the City
City Lights,$72,736
57.7% of totalelectricity costs
incurred by theCity
Field House$12,370
9.8% of totalelectricity costs
incurred by the City
City Hall$8,245
6.5% of totalelectricity costs
incurred by the City
City EmergencyServices Building
$12,94510.3% of total
electricitycosts incurred
by the CityMisc. (Pumps,Traffic/ChristmasLights)
Approximately$4,000
3.2% of totalelectricity costs
incurred by the City
Figure C-1: City Government and Veolia 2010 Electricity Costs(Percentages Represent Costs Incurred by the City not Veolia)
8/13/2019 Sustainable Williamson - Local Energy Action Plan
http://slidepdf.com/reader/full/sustainable-williamson-local-energy-action-plan 15/53
15
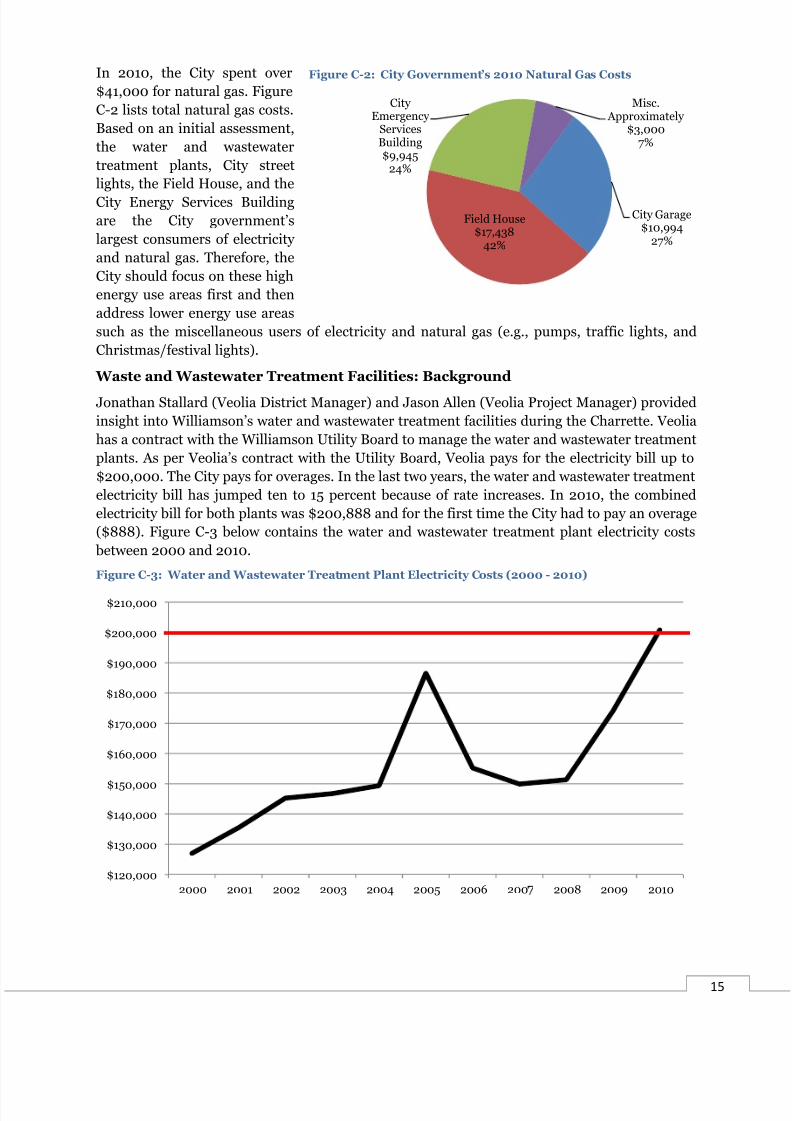
In 2010, the City spent over
$41,000 for natural gas. Figure
C-2 lists total natural gas costs.
Based on an initial assessment,
the water and wastewater
treatment plants, City street
lights, the Field House, and the
City Energy Services Building
are the City government’s
largest consumers of electricity
and natural gas. Therefore, the
City should focus on these high
energy use areas first and then
address lower energy use areas
such as the miscellaneous users of electricity and natural gas (e.g., pumps, traffic lights, and
Christmas/festival lights).
Waste and Wastewater Treatment Facilities: Background
Jonathan Stallard (Veolia District Manager) and Jason Allen (Veolia Project Manager) provided
insight into Williamson’s water and wastewater treatment facilities during the Charrette. Veolia
has a contract with the Williamson Utility Board to manage the water and wastewater treatment
plants. As per Veolia’s contract with the Utility Board, Veolia pays for the electricity bill up to
$200,000. The City pays for overages. In the last two years, the water and wastewater treatment
electricity bill has jumped ten to 15 percent because of rate increases. In 2010, the combined
electricity bill for both plants was $200,888 and for the first time the City had to pay an overage
($888). Figure C-3 below contains the water and wastewater treatment plant electricity costs
between 2000 and 2010.
Figure C-3: Water and Wastewater Treatment Plant Electricity Costs (2000 - 2010)
$120,000
$130,000
$140,000
$150,000
$160,000
$170,000
$180,000
$190,000
$200,000
$210,000
2000 2001 2002 2003 2004 2005 2006 200 2008 2009 2010
City Garage$10,994
27%
Field House$17,438
42%
CityEmergency
ServicesBuilding$9,945
24%
Misc. Approximately
$3,0007%
Figure C-2: City Government’s 2010 Natural Gas Costs

8/13/2019 Sustainable Williamson - Local Energy Action Plan
http://slidepdf.com/reader/full/sustainable-williamson-local-energy-action-plan 16/53
16
Water and Wastewater Treatment Facilities: Current Energy Conservation
Initiatives and Recommendations
Veolia is addressing these increases in electricity rates by trying to reduce energy consumption.
When Veolia renewed its contract in 2008, Veolia purchased new energy efficiency computers
and software for their water and wastewater facilities, as well as motion detectors for lighting in
the restrooms. They are also going to purchase a smart metering system that will allow them to
establish a direct wireless link from meters to the water office.In addition, Veolia budgeted $100,000 for energy efficiency upgrades in the water and waste
water treatment facilities. After a discussion during the Charrette, it was decided that the best
use of these funds would be to purchase a positive displacement blower for the wastewater
treatment plant for approximately $60,000 and use the remaining funds for a water pump
motor upgrade at the water treatment plant (purchasing a more efficient water pump motor
would cost between $80,000 to $100,000).
The efforts already taken by Veolia and the additional capital improvements identified during
the Charrette only address the efficiency of the actual water and wastewater treatment facilities.
The City can also reduce energy consumption by treating less water and wastewater. During the
Charrette, Reverend Robert Settles of Williamson’s Public Utility Board stated
that the Public Utility Board already tries
to reduce water usage by identifying
buildings that have spikes in water usage,
which suggests that the building has a
leak. The Public Utility Board gives the
property owner one month to fix the leak.
If fixed within a month, the property
owner does not have to pay the extra
amount owed. If the leak is not fixed, then
the property owner has to pay the extra
amount. Reverend Settles suggested that
the City perform community outreach on
the utility bills (e.g., informing consumers
on how to save money on their utilities).
He also suggested that the City list data of
water used by each establishment last
month and the same month as the billing
cycle a year before.
Municipal Buildings: Energy Benchmarking
One of the first steps in improving the energy efficiency of a building is energy benchmarking,
i.e., comparing the evaluated building’s energy use to that of other similar buildings. Energy
benchmarking is especially useful for owners/municipalities with multiple buildings because the
comparison process allows them to prioritize energy conservation measures and allocate
resources towards the worst performing buildings.
The Energy Star Rating system allows for energy efficiency comparisons of similar buildings.
The Energy Star Rating is based on data from the Environmental Protection Agency (EPA)
Target Finder tool. Target Finder compares the energy efficiency of commercial buildings of the
An example of a comparative bill showing electricity
consumption of efficient neighbors, all neighbors, and
the bill payer. The Public Utility Board could generate
a similar bill comparing water consumption in an
effort to reduce the City’s consumption of electricity
related to treating water and wastewater. Image by
Kate T, Flickr via Creative Commons Attribution.

8/13/2019 Sustainable Williamson - Local Energy Action Plan
http://slidepdf.com/reader/full/sustainable-williamson-local-energy-action-plan 17/53
17
same type while accounting for factors that drive energy use such as floor area, occupancy,
operating hours, and geographic location. The Target Finder tool produces two metrics with
which to assess the energy efficiency of buildings:
Energy Star Rating; and,
Site Energy Use Intensity (EUI).
The Energy Star Rating is a statistical percentile score based on where an evaluated building
falls in comparison to a building of the same type with similar operating characteristics. An
average rating is 50/100 and an extremely efficient building has a rating of 90/100 or above.
The second metric, site EUI, compares building energy use by accounting for differences in
building floor area. Site EUI is calculated by converting all energy used within the building to
the same units, British thermal units (Btus), and then dividing by the building floor area. Site
EUI is beneficial for comparing buildings that do not fit into one of the space type categories in
Target Finder. The site EUI for a broader range of building types is available through the
Commercial Buildings Energy Consumption Survey (CBECS). The energy performance data
from CBECS, however, does not take into account differences in building floor area, occupancy,
operating hours, or geographic location. No metric for comparing building energy efficiency is
perfect, but an Energy Star Rating and a CBECS site EUI comparison provide a good startingpoint for assessing building energy efficiency. The results of our energy benchmarking and
recommendations appear below.
Field House: Background
The Field House is the largest building
owned by the City of Williamson. Pierce
Whitt, Curt Phillips, and Chris Ooten of
the Parks and Recreation Board provided
insight into the Field House during the
Charrette. The 43,000 square foot
building contains a large arena for
basketball, two dressing rooms, and
offices. It has no fans and no air
conditioning, but it does have eight
16,000 Btu space heaters for the main
area of the building. According to
information provided by Williamson, the heaters keep the upstairs area at 90 ºF and the
downstairs at 65 ºF. In addition, each of the two dressing rooms has a space heater. The press
box has a window air conditioning unit. There is also a caboose that has a metal roof from which
concessions are served. As of right now, the caboose does not have air conditioning so it does
not consume much energy. However, the Parks and Recreation Board would like to provide airconditioning in the caboose.
According to the interviewees, the building has six inches of insulation. The roof needs to be
replaced or retreated and the Parks and Recreation Board does not plan on re-installing shingles
on the roof. The Field House is paid for by an ad valorem tax on Williamson property. The Parks
and Recreation Board plans to install 15 computers in the Field House for learning purposes.
They are also trying to get the building declared as a historic building. The facility’s football field
has 48 lights (150 watt) that are used for baseball and football games only.
The Williamson Field House.

8/13/2019 Sustainable Williamson - Local Energy Action Plan
http://slidepdf.com/reader/full/sustainable-williamson-local-energy-action-plan 18/53
18
Field House: Energy Benchmarking
Facility Name Address City – State Year BuiltOverall Square
Feet (Sq-Ft)
Field House 1703 W 3rd Ave Williamson – WV 43,900
Field House EUI(Btu/Sq-Ft/Yr)
Average Office Building EUI(Btu/Sq-Ft/Yr)
Energy Star Rating
49,000 73,000 80/100
An exact match for this building type is not available in Target Finder. When compared to a
typical office building, the Field House receives an Energy Star rating of 80/100. However, a
typical office building does not provide a suitable baseline for comparison. The usage of the
Field House likely varies significantly from a typical office building because the majority of this
building is not air conditioned and it is not occupied throughout the year.
Data from CBECS provides a better energy use comparison. According to CBECS, the average
site EUI for a Public Assembly-Recreation facility is 65,000 Btu/Sq-Ft/Yr. The Field House uses
32.7 percent more energy than the typical recreation facility, which indicates significant room
for improvement.
Field House: Energy Conservation Recommendations
Based on information provided at the Charrette and data provided by Williamson, the City
should consider the following recommendations for reducing energy consumption and
improving energy efficiency at the Field House:
Increase air circulation to decrease temperature disparity between the upstairs and
downstairs area of the building. Installing a central heating system is the best method to
increase air circulation and improve efficiency, especially if the City uses a sealed
combustion 95 percent efficient (Annual Fuel Utilization Efficiency) furnace. A less
expensive option would be to install an air handling unit with a short amount ofductwork to move the air from the warm upstairs area to the cooler downstairs area.
Installing radiant space heaters is another option to decrease the temperature disparity
and improve the efficiency of the heating system. Radiant heaters use infrared radiation
to transmit heat. The advantage of radiant heaters is that only exposed surfaces of
objects and people are being heated instead of heating all of the air in the building. While
a radiant heater might be more efficient, special attention needs to be paid to the
placement of the heaters to avoid cold spots, i.e., areas not reached by the radiant heat,
and turning off heaters when the building is unoccupied.
For the air conditioning unit in the press box, a ductless mini-split system might be more
efficient. However, the press box is likely not used often enough to justify the expense.
For the concession caboose, installing an expensive air conditioning system is not the
best use of funds because the caboose is only used for part of the year. Moreover, the
concession area has large openings through which concessions are served. Therefore,
increasing air flow through the concession area using fans may be the best option for
keeping the area cool, especially if there is a large amount of cooking.
With regards to insulation and the roof, around 11.5 inches of insulation is needed to
comply with the minimum requirement of R-38 as specified by ASHRAE 90.1-2007 for

8/13/2019 Sustainable Williamson - Local Energy Action Plan
http://slidepdf.com/reader/full/sustainable-williamson-local-energy-action-plan 19/53
19
Climate Zone 4. Additional attic insulation will have a much larger impact on energy
performance than a cool roof. A cool roof will lower cooling costs (not for a non-cooled
space) by roughly one to five percent for a flat roof building with adequate roof
insulation.
Any computers installed by the Parks and Recreation Board should be Energy Star
compliant and should be set on energy savings modes (e.g., computer monitor power
save mode and computer sleep mode).Community Center: Background
During the Charrette, the Parks and
Recreation Board members also provided
details regarding the Community Center
and swimming pool. The Community
Center building is 50x60 feet and has two
floors. The downstairs is a bath house used
for showers during the summer. The
upstairs is an event space used four times a
month during September through May andabout six to eight times a week from June
to August. The event space is heated and
cooled by a ten ton unit. The bath house
does not have a climate control system. The
parks and Recreation Board is trying to raise the funds for a new heating package. The
swimming pool has a large pump that runs full time from May 20 to August 20. The same pump
has been used since 1971 and while it is serviced regularly, there might be an opportunity for an
efficiency upgrade.
Community Center: Energy Benchmarking
Facility Name Address City - State Year BuiltOverall Square
Feet (Sq-Ft)
Community Center 500 Logan St Williamson – WV 6,000
Community Center EUI(Btu/Sq-Ft/Yr)
Average Office Building EUI(Btu/Sq-Ft/Yr)
Energy Star Rating
95,000 41,000 1/100
An exact match for this building type is not available in Target Finder. When compared to a
typical office building, the Community Center receives a rating of 1/100. The usage of this
building likely varies significantly from a typical office building. Therefore, a typical office
building does not provide a suitable baseline for comparison.
Data from CBECS provides a better energy use comparison. According to CBECS, the average
site EUI for a Public Assembly-Recreation facility is 65,000 Btu/Sq-Ft/Yr. The typical site
energy use for a medium-sized swimming pool (75x60 feet) is around 60,000 Btu/Yr. The
adjusted site EUI (found by adding the energy use for the swimming pool to the typical energy
use for a Public Assembly-Recreation facility and dividing by the floor area of the building) for a
comparable facility that includes a swimming pool is calculated to be 75,000 Btu/Sq-Ft/Yr.
Hence, the Community Center uses roughly 27 percent more energy than a typical recreation
facility, even after adjusting for the additional energy use of the swimming pool.
The Williamson Community Center.

8/13/2019 Sustainable Williamson - Local Energy Action Plan
http://slidepdf.com/reader/full/sustainable-williamson-local-energy-action-plan 20/53
20
Community Center: Energy Conservation Recommendations
Based on information provided at the Charrette and data provided by Williamson, the City
should consider the following recommendations for reducing energy consumption and
improving energy efficiency at the Community Center:
With regards to purchasing a new heating package, if the building is currently heated
using electric resistance heating, then switching to a split system that uses a heat pump
cycle to produce heating will reduce costs. A heat pump moves heat instead of generatingit directly from electric resistance. Therefore, a heat pump can produce the same amount
of heat with one third less electricity.
With regards to cooling, the Recreation Board should select equipment with an
Electronically Commutated Motor for the supply fan and a unit with multiple cooling
stages. Using two 5-ton units instead of a 10-ton unit would improve the efficiency and
enable better humidity control.
With regards to the 40-year old pump used at the swimming pool, the Parks and
Recreation Board should consider replacing the pump with a correctly-sized pump that
meets the needs of the system. Almost all pumps are oversized by a large safety factor to
ensure that the system works, and that the engineer/contractor does not have to pay to
replace the pump. However, installing an oversized pump causes it to operate at a much
lower efficiency than a properly sized system.
If the required flow rate/pressure varies, then fitting the pump with a Variable
Frequency Drive (VFD) would allow the speed of the pump to be varied in response to a
variable pumping requirement. A VFD can save a large amount of energy because motor
power draw varies exponentially of the pump’s speed (revolutions per minute). At 50
percent speed, a pump will draw roughly 12.5 percent of its rated power at full speed.
City Hall: Background
The City Hall building used to be one of Williamson’s train depots. The entire
building is heated and cooled. The
building’s basement is used as storage.
Regular hours are 8:30am to 4:30pm
during the weekdays. There are four part-
time employees and one full-time
employee. There are also bi-weekly evening
town council and city board meetings that
have around 30 people. During the
Charrette, some interviewees mentioned
that they have issues with the temperature
in the City Hall building. The Williamson City Hall building.

8/13/2019 Sustainable Williamson - Local Energy Action Plan
http://slidepdf.com/reader/full/sustainable-williamson-local-energy-action-plan 21/53
21
City Hall: Energy Benchmarking
Facility Name Address City - State Year BuiltOverall Square
Feet (Sq-Ft)
City Hall 107 E 4th Ave. Williamson – WV 5,000
City Hall EUI
(Btu/Sq-Ft/Yr)
Average Office Building EUI
(Btu/Sq-Ft/Yr)
Energy Star Rating
69,000 25,000 1/100
An exact match for this building type is not available in Target Finder. When compared to a
typical office building, the City Hall receives a rating of 1/100. While this is not a typical office
building, it should have somewhat similar operating characteristics to an office building. The
City Hall has very poor energy performance compared to other office buildings. According to
CBECS, the average site EUI for a Public Assembly-Social/Meeting facility is 52,000 Btu/Sq-
Ft/Yr. The City Hall uses 32.7 percent more energy than a comparable facility. City Hall: Energy Conservation Recommendations
Based on information provided at the Charrette and data provided by Williamson, the Cityshould consider the following recommendations for reducing energy consumption and
improving energy efficiency at the City Hall:
Improving the thermal envelope by adding insulation and stopping air infiltration
through air sealing.
Checking the duct system to make sure it is installed and balanced properly. A system
that is not properly balanced, i.e., too much or not enough air flow, will cause comfort
issues. It may be possible for City personnel to re-balance the system by adjusting
damper settings without outside assistance. However, a professional test and balance
contractor should balance a complex duct system. Note that a duct system that is not
properly designed / installed cannot be balanced without correcting the problem (e.g.ducts are too small).
If one HVAC system serves multiple areas with different heating/cooling loads, then this
can cause comfort issues because of poor zoning. The thermostat senses the temperature
at only one zone, which may be very different from the temperature in another zone of
the building. This is especially true for a building with no insulation and old windows
with a high solar heat gain coefficient. The City can address poor zoning by installing
multiple smaller systems or by installing a system that allows for individual zone control
(e.g., Variable Air Volume units to control zone air flow from a central air handling unit).
The comfort problems caused by poor zoning may be mitigated or eliminated by
installing insulation and stopping air infiltration.
Setting all computers on energy savings modes (e.g., computer monitor power save mode
and computer sleep mode).

8/13/2019 Sustainable Williamson - Local Energy Action Plan
http://slidepdf.com/reader/full/sustainable-williamson-local-energy-action-plan 22/53
22
Emergency Services Building: Background
This 20,800 square foot facility houses
the City’s Police Department and
Municipal Judge on the first floor, the
full-time paid Fire Department on the
first and third floors, and the public
Community Hall on the second floor. Allof the building’s area is heated and 70
percent is cooled.
The City of Williamson has received an
Energy Efficiency and Conservation Block
Grant (EECBG) to perform the following
energy improvements to the Emergency
Services Building26:
Replace the existing inefficient HVAC system;
Replace the existing 24-year old, 160 four-bulb light fixtures, and install high light
reflecting ceiling tile; Install air lock chamber vestibule at the entrance door; and,
Replace windows that have lost their insulation value.
Emergency Services Building: Energy Benchmarking
Facility Name Address City - State Year BuiltOverall Square
Feet (Sq-Ft)
Emergency Services 108 East 4th Avenue Williamson – WV 20,800
Emergency Services Building EUI(Btu/Sq-Ft/Yr)
Average Office Building EUI(Btu/Sq-Ft/Yr)
Energy Star Rating
72,000 106,000 80/100
An exact match for this building type is not available in Target Finder. When compared to a
typical office building, the Emergency Services Building receives a rating of 80/100. However, a
typical office building does not provide a suitable baseline for comparison. The Emergency
Services Building, unlike an office building, is continuously occupied. The constant occupancy
skews the comparison.
Data from CBECS provides a better energy use comparison. According to CBECS the average site
EUI for a police station/fire station is 78,000 Btu/Sq-Ft/Yr. This building consumes 7.7 percent
less energy than the average Fire Station/Police Station. The energy efficiency of the Emergency
Services Building is better than average, and the improvements being made pursuant to theEECBG application should further improve this building’s performance.
26 Information obtained from the “Emergency Services Building Energy Efficiency Project” EECBG application.
The Williamson Emergency Services Building.

8/13/2019 Sustainable Williamson - Local Energy Action Plan
http://slidepdf.com/reader/full/sustainable-williamson-local-energy-action-plan 23/53
23
City Garage: Background
This approximately 6,000 square
foot facility houses City and
Veolia vehicles. Eight employees
work in and out of this building.
The natural gas furnaces run
while the garage doors are open.The facility has several areas
where air can infiltrate the
building.
City Garage: Energy Benchmarking
Facility Name Address City - State Year BuiltOverall Square
Feet (Sq-Ft)
City Garage Williamson – WV ~6,000
City Garage EUI
(Btu/Sq-Ft/Yr)
Average Warehouse EUI
(Btu/Sq-Ft/Yr)Energy Star Rating
155,000 98,000 20/100
An exact match for this building type is not available in Target Finder. When compared to a
typical unrefrigerated warehouse, the City Garage receives a rating of 20/100. However, this
building is a garage/vehicle repair facility. Therefore, data from CBECS provides a better energy
use comparison. According to CBECS the average site EUI for a vehicle repair/service facility is
77,000 Btu/Sq-Ft/Yr. This building consumes twice the energy of a typical vehicle repair/service
facility.
City Garage: Energy Conservation Recommendations
The City should asses the need for heating at the City Garage. Lowering the heater set pointtemperature or turning the furnace off entirely will drastically reduce the energy use of this
facility. The City Garage is a metal building with visible holes in the walls and bay doors. The bay
doors are opened every time a vehicle enters or leaves the garage. Heating this building with a
central furnace requires a large amount of energy due to amount of air infiltration that is
occurring. Repairing the walls and doors will reduce air infiltration, but there is not a reasonable
way to prevent cold air from entering the building when the bay doors are opened.
Eliminating the heating system entirely is probably not acceptable. The most efficient way to
provide heating for this facility is with radiant heaters. Radiant heaters will heat only surfaces
and people rather than all of the air in the building. This is important because the air leakage in
the building is quite high due to the large number of air leaks.
The Williamson City Garage.

8/13/2019 Sustainable Williamson - Local Energy Action Plan
http://slidepdf.com/reader/full/sustainable-williamson-local-energy-action-plan 24/53
24
Water Tanks: Background
Williamson currently has four water tanks (Goodwin, Sycamore, Gaujot, and College Hill) that
will be consolidated into one new tank. The City and Veolia are seeking a Rural Utility Service
loan, as well as other sources of funding for the tank consolidation project.
Water Tanks: Energy Conservation Opportunities
The water tank consolidation is an opportunity to maximize energy efficiency in the new tank.
For example, instead of using a pressure reducing value, Veolia is thinking about using micro-
hydro generators that can both slow the flow of water going downhill and generate electricity
(see Figure C-4). During the Charrette, Jonathan Stallard and Jason Allen stated that the tank
upgrade budget contains $200,000 for smart metering that would allow for a wireless link
between individual meters and the water office.
City Street Lights: Background27
Williamson has a contract with Appalachian Power for Williamson street lights. Pursuant to the
contract, the City’s street lights are not metered. Rather, Appalachian Power charges the City a
contractual rate based on the type of light fixture times the number of units for that type of light
fixture. For example, the City has 326 of the 175w light (7,000 lumens) mercury vapor lights.The City pays about $7.05 a month per unit (327 x $7.05) for a total of $2,305.35 a month for
this type of street light bulb. Therefore, payment is not pegged to the amount of electricity used
by the City for its street lights but rather the type and number of lights. Appendix 2 contains an
unsigned copy of the City’s contract with Appalachian Power.
Appalachian Power periodically performs an inventory of street lights. Williamson has not had
27 Information provided by Randy Saunders (Appalachian Power Customer Service Representative) through phone conversationsand email correspondence during August, 2011.
Figure C-4: Energy Recapture Using Gravity to Generate Electricity

8/13/2019 Sustainable Williamson - Local Energy Action Plan
http://slidepdf.com/reader/full/sustainable-williamson-local-energy-action-plan 25/53
25
such an inventory since at least 2006. Appalachian Power is willing to work with the City to
perform an inventory of the City’s street lights. Such inventories typically result in the
identification of street lights that are on a municipality’s contractual inventory that do not work,
as well as street lights that work but are not listed in the municipality’s contractual inventory.
City Street Lights: Energy Conservation Opportunities
Because Williamson pays Appalachian Power based on type of bulb as opposed to amount of
electricity consumed, the City can lower its total costs by replacing the more expensive lights(e.g., $10 or more per unit a month) with less expensive lights that still meet the user
requirements and preferences, i.e., lights that the neighborhood will like. The City can request
change of street lights prior to the expiration of the contract. Metering each street light is not a
cost-effective option due to cost of installation and a base-level charge of about $8.00 per month
per meter. Metering is also not an administratively feasible option because of the number of
resulting invoices. The City should also work with Appalachian Power to perform a detailed
inventory of Williamson's street lights with the goal of identifying opportunities to eliminate
unnecessary street lighting.
Non-Municipal Buildings: Background
Based on 2005-2009 U.S. Census Bureau
data, Williamson has approximately
1,950 to 2,000 housing units of which
830 are owner-occupied, 730 are renter-
occupied, and about 400 are unoccupied.
Sixty nine percent are single-unit
structures, 29 percent are multi-unit
structures, and one percent are mobile
homes. Approximately 1,276 homes were
built before 1960 and about 86 homes
were built between 2000 and 2009. Approximately 820 homes are heated
using utility gas and 730 are heated using
electricity. A handful of homes are heated
using bottled, tank, or liquefied petroleum
gas.28
Commercial buildings are concentrated in Williamson’s Downtown and West End areas. For a
variety of reasons, it is difficult for the City to facilitate modifications to many of the Downtown
commercial buildings (e.g., the building is in an estate or owned by absentee owners). Many
commercial buildings in Williamson are either vacant or underutilized.
Non-Municipal Buildings: Energy Savings Opportunities
Based on information obtained during the Charrette and observations made by Southface
personnel, there are many opportunities to decrease Williamson’s residential and commercial
building energy consumption. Newer heating, ventilating and air conditioning (HVAC) systems,
28 U.S. Census Bureau. “Williamson city, West Virginia: 2005-2009 American Community Survey 5-Year Estimates.” Availableonline at:http://factfinder.census.gov/servlet/ACSSAFFFacts?_event=&geo_id=16000US5487508&_geoContext=01000US|04000US54|16000US5487508&_street=&_county=williamson&_cityTown=williamson&_state=04000US54&_zip=&_lang=en&_sse=on&ActiveGeoDiv=&_useEV=&pctxt=fph&pgsl=160&_submenuId=factsheet_1&ds_name=DEC_2000_SAFF&_ci_nbr=null&qr_name=null®=null%3Anull&_keyword=&_industry . Referenced on Aug. 9, 2011.
Williamson City Hall in the foreground and
Downtown Williamson in the background.

8/13/2019 Sustainable Williamson - Local Energy Action Plan
http://slidepdf.com/reader/full/sustainable-williamson-local-energy-action-plan 26/53
26
and proper insulation provide a reasonable return on investment. While replacing windows can
often be economically impractical, some occupied buildings in Williamson have broken
windows. In such instances, fixing or replacing the broken windows can dramatically reduce the
amount of energy wasted. Moreover, given the number of renter-occupied housing units,
Williamson should consider providing landlords, who often do not pay the utility bill, incentives
to improve the energy efficiency of their rental unit(s). While Williamson’s LEAP focuses on
municipal operations, Energy Goals 5 and 6 in the Recommended Energy Goals section below
contain initiatives that would result in community-wide energy savings.
Municipal Vehicles
The City’s vehicles are varied for types of use (e.g., public safety, sanitation, or administrative).
They include fire engines, light trucks, heavy trucks, sedans, mobile equipment units, garbage
trucks, and vans. A current listing is contained in Appendix 3. Some vehicles are currently being
repaired or are going to be put out of commission soon. The City also owns a variety of mobile
non-vehicular units (e.g., lawn mowers, air compressors, backhoes, tractors, trash pumps, and
generators).
Veolia has a contract with the City for garbage collection. Two garbage trucks and three to four
pickup trucks operate a day as needed. The City owns the garbage trucks and a smaller pickup
truck. Veolia owns the other waste management vehicles. The commercial garbage truck goes to
the landfill in Kentucky about two to three times a week. The residential truck has to go every
day. The 60-mile roundtrip to the landfill takes between two and three hours. While Veolia pays
for the fuel consumed by the garbage trucks it operates, the City will ultimately have to keep
Veolia’s fuel costs in mind during its renegotiation of Veolia’s waste management contract.
Veolia tracks its daily fuel consumption and currently pays about $4,000 to $5,000 a month in
fuel for waste management vehicles. For 2010, the City of Williamson paid $87,968.67 for
vehicle fuel, which includes 17,000 gallons of unleaded gasoline (87 octane), 13,100 gallons of
#2 low sulfur diesel for trucks, and 1,500 gallons of #2 high sulfur diesel for off-road engines.
Between January 2010 and December 2010, the City’s fuel costs increased as follows:
Unleaded gasoline (87 octane) – increase of 12.77 percent from $2.6868 a gallon to
$3.0299 a gallon.
#2 low sulfur diesel – increase of 14.78 percent from $2.7937 a gallon to $3.2066 a
gallon.
Municipal Vehicles: Current Energy Conservation Initiatives and
Recommendations
Based on discussions during the Charrette, the City has limited ability to purchase newer, more
fuel efficient vehicles. Veolia currently reduces fuel consumption by not driving empty trucks to
the landfill. Moreover, the City has an anti-idling policy but it is unclear whether the policy is
enforced.
Rather than making capital investments, the City should focus its efforts on reducing fuel
consumption through driver education regarding optimal acceleration / braking and the impact
of idling. The City should enforce its anti-idling policy and should establish a Vehicle Selection
Policy that seeks to get City personnel to use the most fuel efficient vehicle while still meeting
their application.

8/13/2019 Sustainable Williamson - Local Energy Action Plan
http://slidepdf.com/reader/full/sustainable-williamson-local-energy-action-plan 27/53
27
For vehicles that run on routes, the City should create a routing system to increase overall
efficiency (e.g., by reducing idle time, reducing the number of left turns, and/or decreasing the
number of times the vehicles has to travel uphill). An optimized route that saves the most in fuel
costs may not necessarily be the shortest route. For example, Mingo County is building a
transfer station at Pigeon Creek. Because of the two-lane road, it would most likely take
Williamson’s waste management vehicles the same amount of time to get to the Pigeon Creak
transfer station as the Johns Creek landfill in Kentucky. Therefore, when assessing which route
is the most cost effective, Williamson should take into consideration the efficiency of driving on
a highway versus two-lane road, as well as the total cost of tipping fees.

8/13/2019 Sustainable Williamson - Local Energy Action Plan
http://slidepdf.com/reader/full/sustainable-williamson-local-energy-action-plan 28/53
28
Viable Local Sources of Renewable Energy
The two most promising renewable energy sources for Williamson are solar and biomass.
According to the National Renewable Energy Laboratory (NREL), the Williamson area can
generate approximately 1,550 kWh per square meter a year. 29 In other words, the amount of
electricity generated in one year by a square meter photovoltaic solar panel would be enough to
power the average West Virginia home for over five weeks.30 To put the potential of this solar
resource in perspective, Germany is a world leader in photovoltaic (solar) energy production yetits solar capacity is only 1,100 kWh per square meter a year – considerably less than Williamson
(see Map C-1).31
29 Annual average solar resource data are for a solar collector oriented toward the south at a tilt = local latitude.
30 Information contained in the “Table 5” files within each year’s issue of the U.S. Energy Information Administration “Back Issues:Electronic Sales, Revenue, and Price.” Available online: http://www.eia.gov/cneaf/electricity/esr/backissues.html. Referenced on Aug. 9, 2011. 31 Solar Energy Industries Association. Available online: http://www.seia.org/galleries/default-file/PVMap_USandGermany.pdf .Referenced on August 8, 2011.
Map C-1: Photovoltaic Solar Resource of the United States and Germany

8/13/2019 Sustainable Williamson - Local Energy Action Plan
http://slidepdf.com/reader/full/sustainable-williamson-local-energy-action-plan 29/53
29
In addition to solar,
Williamson has biomass
resources at its disposal.
Biomass sources close to
Williamson include methane
emissions from its
wastewater treatment plant
as well as forest residues.
According to the NREL,
Mingo County can generate
between 25,000 to 50,000
dry tonnes of forest residues
a year (see Map C-2).32
Forest residue, i.e., logging
residue, comprises unused
portions of trees, cut or killed
by logging and left in the
woods. Viable Sources of Renewable Energy: West Virginia Incentives
West Viriginia has a net metering law that allows retail customers of utlity companies to receive
a credit for a portion of the electricity they generate through, among other things, solar thermal,
photovoltaics, and biomas. Pursuant to the law, all utilties must offer net metering to residential
customers that have qualifying systems (e.g., photovoltaics) up to 25 kilowatts. The law provides
different limits for commercial and industrial customers depending on the size of their utlitlity
company:
Commercial customers of investor-owned utilities with more than 30,000 customers
may have a net metering system up to 500 kilowatts.
Industrial customers of investor-owned utilities with more than 30,000 customers may
have a net metering system up to two megawatts.
Commercial and industrial customers of smaller invester-owned utilities, municipal
utilities, and co-ops may have a net metering system up to 50 kilowatts.
Any net excess electricity generation by a customer during a billing cycle will be credited to the
customer’s next bill at their retail rate, i.e., carried over to their next bill as a kWh credit. The
law requires utilities to offer net metering to customers until net metering generation reaches
three percent of peak demand during the previous year.33
West Virginia also offers a residential solar tax credit of up to 30 percent (maximum $2,000) of
the cost of purchasing and installing solar systems that generate electricity, heat or cool a
residence, or provide hot water or solar process heat for use in the residence. To qualify, a solar
water heating system must derive half or more of its energy from the sun and cannot be used to
32 National Resource Energy Laboratory. Jun. 2011. “Biomass Maps.” Available online: http://www.nrel.gov/gis/biomass.html.Referenced on Aug. 9, 2011.
33 Database of State Incentives for Renewables & Efficiency. May 2011. “West Virginia – Net Metering,” Available online at:http://www.dsireusa.org/incentives/incentive.cfm?Incentive_Code=WV03R&re=1&ee=1. Referenced on Aug. 8, 2011.
Map C-2: Biomass Resources of the United States – Forest Residues

8/13/2019 Sustainable Williamson - Local Energy Action Plan
http://slidepdf.com/reader/full/sustainable-williamson-local-energy-action-plan 30/53
30
heat a pool or hot tub. West Virginia homeowners may carry forward unused portions of the tax
credit until July 1, 2014.34
Viable Sources of Renewable Energy: Recommendations
Given West Virginia’s net metering law, Williamson should identify opportunities to install cost-
effective grid-tied solar systems. Because such a system is plugged into the electricity grid as
opposed to just providing electricity for the building to which it is attached, owners of the
system can benefit from selling electricity back into the grid. For example, after a homeowner
has maximized efficiency, the homeowner could take advantage of both the residential solar tax
credit as well as the net metering law that would allow for the homeowner to sell electricity back
to the grid. It should be noted that any net excess electricity generation by a customer during a
billing cycle will be carried over to their next bill as a kWh credit at their retail rate. In addition,
Williamson should explore the potential of producing methane from its wastewater treatment
plant.
Recommended Energy Goals
Based on an analysis of City energy consumption, a high-level review of City buildings, and
discussions with key stakeholders, Williamson’s LEAP contains the following six goals related toEnergy.
Energy Goal 1
Williamson will reduce its government operations' energy consumption by eliminating excess
energy use, investing in energy efficiency, and encouraging fuel-efficient driving techniques.
To reach Energy Goal 1, Williamson should first implement the following “Level 1” initiatives:
By June 1, 2012, identify City policies, codes, ordinances, and development regulations
that hinder activities that would promote energy savings.
By June 1, 2012, review the street light inventory provided by Appalachian Power andsubmit to Appalachian Power a list of high-cost bulbs (e.g., $10 or more per unit a
month) for replacement with lower-cost bulbs.
Work with Appalachian Power to perform a detailed inventory of Williamson's street
lights to create an accurate inventory of street lights with the goal of identifying
opportunities to eliminate unnecessary street lighting.
By January 1, 2013, reduce City government's electricity consumption by ten percent
from 2010 levels, adjusted for increase in buildings and/or square footage.
By January 1, 2013, reduce City government's natural gas consumption by ten percent
from 2010 levels, adjusted for increase in buildings and/or square footage.
Establish a Vehicle Selection and Driving Policy that seeks to get City personnel to use
the most fuel efficient vehicle while still meeting their application, as well as provide
driver education regarding optimal acceleration / braking and the impact of idling.
Enforce the existing anti-idling policy for vehicles that lowers fuel consumption while
still allowing for City personnel to perform their tasks.
34 Database of State Incentives for Renewables & Efficiency. May 2011. “West Virginia – Residential Solar Energy Tax Credit,” Available online at: http://www.dsireusa.org/incentives/incentive.cfm?Incentive_Code=WV08F&re=1&ee=1. Referenced on Aug. 8,2011.

8/13/2019 Sustainable Williamson - Local Energy Action Plan
http://slidepdf.com/reader/full/sustainable-williamson-local-energy-action-plan 31/53
31
By January 1, 2014, reduce fuel consumption in City government vehicles by five percent
from 2010 levels.
After completing the Level 1 initiatives, Williamson should then implement the following “Level
2” initiatives that are broader in scope and/or more complex than Level 1:
Establish incentives for City employees to carpool and reduce the amount of vehicle fuel
they consume.
By January 1, 2014, reduce City government's electricity consumption by 15 percent from
2010 levels, adjusted for increase in buildings and/or square footage.
By January 1, 2015, reduce City government's municipal government natural gas
consumption by 15 percent from 2010 levels, adjusted for increase in buildings and/or
square footage.
For vehicles that run on routes, create a routing system to increase overall efficiency (by
reducing idle time, reducing the number of left turns, and/or decreasing the number of
times the vehicles has to travel uphill).
After completing the Level 2 initiatives, Williamson should then implement the following “Level
3” initiative, which is the broadest and/or most complex:
By January 1, 2016, reduce City government's electricity consumption by 20 percent
from 2010 levels, adjusted for increase in buildings and/or square footage.
The Williamson Buildings and Facilities, City Street Lights, Municipal Vehicles, and Viable Local
Sources of Rernewable Energy sections above contain specific actions and information that can
assist Williamson reach Energy Goal 1.
Energy Goal 2
Williamson will improve the energy efficiency of all new and existing City facilities.
To reach Energy Goal 2, Williamson should first implement the following Level 1 initiatives:
Promote a culture of efficiency by adopting policies and preparing guidelines to:
o Integrate sustainable building operations and maintenance principles and
practices at all City facilities; and,
o Perform life-cycle cost analysis that takes into account energy consumption
throughout the lifetime of a building upgrade and equipment purchase as
opposed to just the up-front costs.
Irrespective of building size, adopt regulations that require all new City buildings meet
energy efficiency building standards appropriate for the building size through
sustainable building certification programs such as LEED, EarthCraft, or Energy Star.
Irrespective of whether a building renovation will seek sustainable building certification,
adopt a policy and prepare guidelines to integrate sustainable building principles and
practices into the renovation of all City facilities, and City-funded renovation projects, to
the fullest extent possible.

8/13/2019 Sustainable Williamson - Local Energy Action Plan
http://slidepdf.com/reader/full/sustainable-williamson-local-energy-action-plan 32/53
32
After completing the Level 1 initiatives, Williamson should then implement the following Level 2
initiative that is broader in scope and/or more complex than Level 1:
Irrespective of building size, adopt regulations that require all renovated City buildings
meet sustainable building standards appropriate for the building size through
sustainable building certification programs such as LEED, EarthCraft, or Energy Star.
After completing the Level 2 initiative, Williamson should then implement the following Level 3
initiative, which is the broadest and/or most complex:
Adopt regulations that set sustainable building certification levels (e.g., LEED Platinum
and LEED Gold, or EarthCraft Light Commercial) for all new and renovated City
buildings based on building size or use.
The Williamson Buildings and Facilities section above contains specific actions and information
that can assist Williamson reach Energy Goal 2.
Energy Goal 3
After maximizing energy efficiency, Williamson will invest in and promote lesser polluting
energy sources and renewable energy sources.
After completing the Level 1 initiatives under Goals 1 and 2, Williamson should then implement
the following Level 2 initiatives under Goal 3:
Where it is appropriate, promote the use of natural gas, propane, and other alternative
fuel vehicles (e.g., hybrid and electric vehicles) for specific City fleet vehicles.
Adopt ordinances that incent, support, and protect business and home owners who have
renewable energy installations (e.g., photovoltaic panels and solar water heaters).
After completing the Level 2 initiative, Williamson should then implement the following Level 3
initiatives, which are the broadest and/or most complex:
Evaluate the economics of constructing large scale photovoltaic solar arrays on City-owned property and privately-owned land that would otherwise not lend itself well to
development for other uses.
Evaluate the economics and environmental benefits of locally available biomass sources
(e.g., landfills and waste water treatment plants); and then incent the development of
systems that produce power from the identified biomass sources.
The Viable Local Sources of Rernewable Energy section above contains specific information that
can assist Williamson reach Energy Goal 3.
Energy Goal 4
The City will identify opportunities to capture and reuse otherwise wasted hyrdo power andwaste heat to power auxiliary energy generating turbines, provide heat for industrial
purposes, or provide climate control for buildings.
To reach Energy Goal 4, Williamson should implement the following Level 1 initiative:
By June 1, 2012, the City will identify sites and opportunities for the co-location of
complementary energy production/energy consumption facilities (e.g., energy recapture
at the consolidated water tank, as well as buildings that use waste heat obtained from
nearby industries).

8/13/2019 Sustainable Williamson - Local Energy Action Plan
http://slidepdf.com/reader/full/sustainable-williamson-local-energy-action-plan 33/53
33
The Water Tanks section above contains specific information that can assist Williamson reach
Energy Goal 4.
Energy Goal 5
Williamson will focus on community-wide sustainable building standards.
To reach Energy Goal 5, Williamson should implement the following Level 1 initiatives:
Ensure that the Williamson Fire Chief and the Williamson Unsafe Building Commissionhave the tools and support required to enforce the existing building code for new and
renovated buildings.
Offer incentives for homes and commercial projects that meet certified energy efficiency
standards for buildings. For example:
o Expedited permit review;
o Density or height bonus;
o Reduced/waived fees; and/or,
o Free technical assistance.
Establish an Awards Program that identifies residential and commercial projects within
Williamson that have been recognized through an energy efficiency and/or sustainable
building certification program.
After completing the Level 1 initiatives, Williamson should then implement the following Level 2
initiatives that are broader in scope and/or more complex than Level 1:
Offer incentives for homes and commercial projects certified using sustainable building
certification programs such as LEED, EarthCraft, or Energy Star. For example:
o Expedited permit review;
o Density or height bonus;
o Reduced/waived fees; and/or,
o Free technical assistance.
As soon as possible, begin enforcing the International Energy Conservation Code (IECC)
for residential and ASHRAE 90.1 for Commercial buildings; adopt the appropriate high
performance building standards for residential and commercial buildings (e.g., ICC
Green Construction Code or ASHRAE 189.1-2009) with sustainable building certification
programs as compliance options.
Energy Goal 6
Williamson will advocate for comparative building-level utilities tracking and reporting,
leading to improved maintenance programs and reduced energy and water usage in City and
commercial buildings.
To reach Energy Goal 6, Williamson should first implement the following Level 1 initiatives:
Offer incentives for businesses that meet an ongoing energy efficiency and/or
sustainable building performance measure such as ranking in the top ten percent of
Energy Star Portfolio Manager and/or LEED Existing Buildings Operations &
Maintenance. For example: business license discounts, reduced sewer charge, and
recognition.
Provide historical water use data on the water bill for customers.
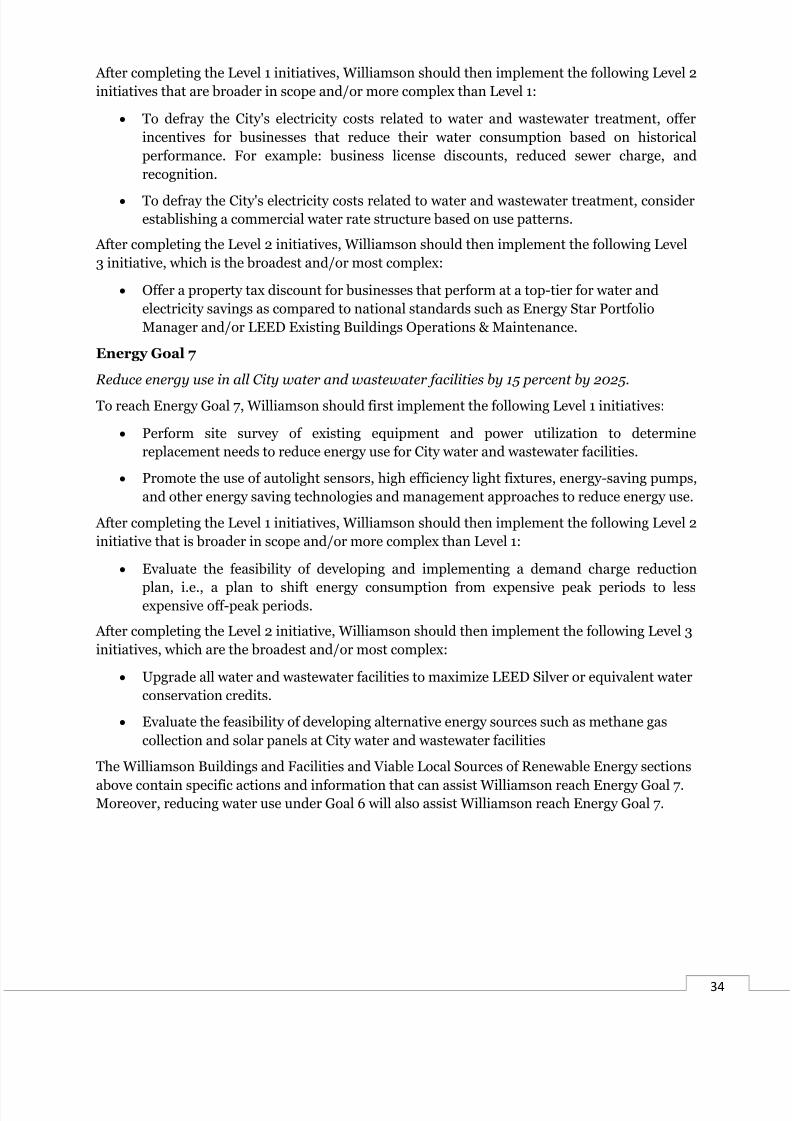
8/13/2019 Sustainable Williamson - Local Energy Action Plan
http://slidepdf.com/reader/full/sustainable-williamson-local-energy-action-plan 34/53
34
After completing the Level 1 initiatives, Williamson should then implement the following Level 2
initiatives that are broader in scope and/or more complex than Level 1:
To defray the City's electricity costs related to water and wastewater treatment, offer
incentives for businesses that reduce their water consumption based on historical
performance. For example: business license discounts, reduced sewer charge, and
recognition.
To defray the City's electricity costs related to water and wastewater treatment, considerestablishing a commercial water rate structure based on use patterns.
After completing the Level 2 initiatives, Williamson should then implement the following Level
3 initiative, which is the broadest and/or most complex:
Offer a property tax discount for businesses that perform at a top-tier for water and
electricity savings as compared to national standards such as Energy Star Portfolio
Manager and/or LEED Existing Buildings Operations & Maintenance.
Energy Goal 7
Reduce energy use in all City water and wastewater facilities by 15 percent by 2025.
To reach Energy Goal 7, Williamson should first implement the following Level 1 initiatives:
Perform site survey of existing equipment and power utilization to determine
replacement needs to reduce energy use for City water and wastewater facilities.
Promote the use of autolight sensors, high efficiency light fixtures, energy-saving pumps,
and other energy saving technologies and management approaches to reduce energy use.
After completing the Level 1 initiatives, Williamson should then implement the following Level 2
initiative that is broader in scope and/or more complex than Level 1:
Evaluate the feasibility of developing and implementing a demand charge reduction
plan, i.e., a plan to shift energy consumption from expensive peak periods to lessexpensive off-peak periods.
After completing the Level 2 initiative, Williamson should then implement the following Level 3
initiatives, which are the broadest and/or most complex:
Upgrade all water and wastewater facilities to maximize LEED Silver or equivalent water
conservation credits.
Evaluate the feasibility of developing alternative energy sources such as methane gas
collection and solar panels at City water and wastewater facilities
The Williamson Buildings and Facilities and Viable Local Sources of Renewable Energy sections
above contain specific actions and information that can assist Williamson reach Energy Goal 7.Moreover, reducing water use under Goal 6 will also assist Williamson reach Energy Goal 7.

8/13/2019 Sustainable Williamson - Local Energy Action Plan
http://slidepdf.com/reader/full/sustainable-williamson-local-energy-action-plan 35/53
35
LEAP Implementation
Developing, implementing,
and monitoring Department-
and Facility-level policies and
procedures that help
Williamson become more
energy efficient requires aconcentrated effort by
dedicated personnel,
otherwise Williamson risks
losing the momentum created
by the LEAP process. Existing
personnel may not have the
time or the institutional
capacity to undertake such
tasks in a thorough and
sustained manner.
Fortunately, Williamson has
received funds to hire a short-
term Energy Coordinator.
This Energy Coordinator will
work with City personnel to
use the information and tools
contained in this LEAP
Report to articulate Department- and Facility-level energy efficiency goals and action items. The
Energy Coordinator will then implement policies and procedures that help Williamson meet its
energy goals, monitor compliance with policies and procedures, and track performance. The
Energy Coordinator will also leverage investments and funding for energy efficiency andrenewable energy initiatives, coordinate energy efficiency programs across Departments and
Facilities, and interface with community organizations that promote civic engagement across
Williamson.
Empowering the Energy Coordinator
To be effective, the Energy Coordinator must have the authority to formulate, implement,
incent, and enforce energy policies and procedures for the City government, as well as
coordinate community-wide energy initiatives. Otherwise the Energy Coordinator will not be
able to implement and monitor policies and procedures that help Williamson meet its energy
goals. Therefore, the organizational placement of the Energy Coordinator within the City of
Williamson government should be such that the Energy Coordinator reports to an individual or
Department that is charged with overseeing the operations of City Departments and Facilities.
Irrespective of the Energy Coordinator’s placement on the City government organization chart,
the Energy Coordinator should be physically located close to the individual(s) with whom
he/she will have the most contact to facilitate the actual implementation and monitoring of
policies and procedures.
In addition, Williamson should consider establishing an Energy Board that provides the Energy
Coordinator with guidance. The Energy Board should consist of Williamson personnel, Veolia
EnergyCoordinator
TranscendsPolitics
ManagesSustain-ability
Iniativies
IdentifiesInnovative
Ideas
ObtainsFunding
ReinvestsSavings
Fosters
Coopera-
tion
Interfaces With
Community
Figure C-5: Attributes of the Energy Coordinator

8/13/2019 Sustainable Williamson - Local Energy Action Plan
http://slidepdf.com/reader/full/sustainable-williamson-local-energy-action-plan 36/53
36
personnel, and community members who would be charged with implementing policies and
procedures in their respective Department, Facility, company, or organization. The Energy
Coordinator would periodically provide updates to and receive input from the Energy Board.
Goals of the Energy Coordinator
The main goal of the Energy Coordinator will be to oversee the development, implementation,
and monitoring of all policies and procedures that help Williamson meet the Energy Goals listed
in this LEAP Report. This will require each City Department and Facility to complete actionitems. For example, goals related to City personnel reducing electricity consumption and
following anti-idling policies will require support from all Departments and Facilities.
Therefore, the Energy Coordinator will have to work with each Department/Facility Head to
develop a Department/Facility Energy Plan. The steps required to create a Department/Facility
Energy Plan are detailed below:
The Department/Facility Energy Plan template (attached to this Report as Addendum A)
has been created to assist with the creation of Department- and Facility-level action
items. The Energy Coordinator will work with each Department/Facility to:
o Create the Department/Facility Energy Savings Vision/Commitment Statement
that establishes the foundation of the Department/Facility Energy Plan;o Summarize the Department’s/Facility’s responsibilities for those Energy Goals
that affect the Department/Facility;
o List action items, the responsible parties, and the measures of success; and,
o Develop the Department/Facility Employee Communication Plan for
communicating with Department/Facility staff regarding the
Department/Facility Energy Plan.
After creating each Department/Facility Energy Plan, the Energy Coordinator will work
with designated Department/Facility personnel to populate Reporting Tabs contained in
Addendum B, which will list each Department/Facility Action Item, its Status, the
Results/Outcome, and applicable Notes/Comments. The Energy Coordinator will also review the broad set of performance measurement
metrics already included in the Goals Templates contained in Addendum B. These
performance measurement metrics can help Williamson develop a baseline and compare
progress against that baseline as a means to assess whether goals have been met. The
Energy Coordinator will work with designated Department/Facility personnel to delete
those metrics for which the City cannot obtain data, as well as formulate new metrics for
which the City can obtain data.
The Energy Coordinator will work with designated Department/Facility personnel to
analyze data to set baselines, monitor progress based on performance measurement
metrics, and update both the Department/Facility Energy Plan and ReportingTemplates.
The Energy Coordinator will update the Goals Templates to provide a yearly status
review to the Energy Board, elected City leaders, and the community-at-large.
Each of the steps listed above are “Level 1” action items for the Energy Coordinator, i.e., the first
tasks to be completed by the Energy Coordinator. Additional “Level 1” initiatives for the Energy
Coordinator identified during the LEAP planning process are:

8/13/2019 Sustainable Williamson - Local Energy Action Plan
http://slidepdf.com/reader/full/sustainable-williamson-local-energy-action-plan 37/53
37
Develop an “Energy Savings Products” Procurement protocol;
Create an outreach plan to interface with the broader community, including Mingo
County government and the schools; and,
Identify financing options and grant funding that can be used for energy efficiency
upgrades and to train employees on energy efficiency, lifecycle analysis, and lifecycle
costing.
After completing the Level 1 initiatives, the Energy Coordinator should then implement the
following “Level 2” initiative that is broader in scope and/or more complex than Level 1:
Oversee the creation of a Williamson LEAP website for the community at large that
provides information about the benefits of energy savings, current energy savings
initiatives, available rebates and grants, and the progress of energy savings initiatives.
Financing and Available Incentives
Self Financing Mechanism
A short-term focus by a dedicated Energy Coordinator should allow Williamson to lay the
groundwork for energy efficiency initiatives. However, many of these initiatives will not be
“implement and forget” solutions. They will require monitoring and adjustments based on such
factors as reduced vigilance by personnel, changes in utility pricing, introduction of new
technologies and best practices, and new sources of funding. Moreover, the scope of what is
possible extends beyond a short-term implementation timeframe.
Discussions during the Charrette revealed that the Williamson Memorial Hospital has been
engaged in energy savings and efficiency initiatives for five years. The success of their initiatives
is due in part to the fact that a facilities manager monitors building performance and adjusts
policies and procedures in response to any decrease in energy efficiency. Similarly, to maximize
the benefits that come from having an Energy Coordinator, Williamson should create a
permanent Energy Coordinator position.
Williamson can fund a permanent Energy Coordinator position by making it self-financing. The
Appalachian Regional Commission has already provided initial funding. Williamson can place a
portion of the cost savings resulting from the short-term Energy Coordinator’s efforts in a
dedicated fund to finance the Energy Coordinator beyond the short-term initial funding period.
This fund can also finance key capital improvements (e.g., purchase of new equipment and
building improvements) that will yield additional cost savings. Figure C-6 illustrates this model
for funding municipal sustainability work.
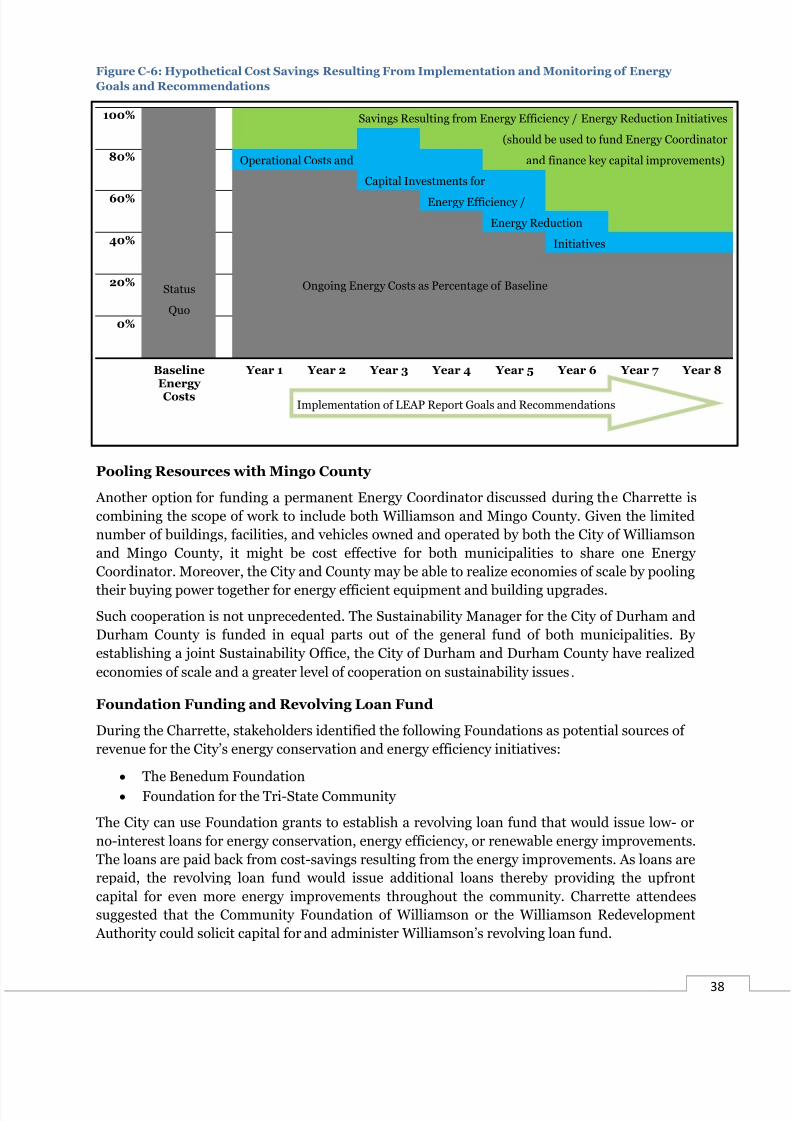
8/13/2019 Sustainable Williamson - Local Energy Action Plan
http://slidepdf.com/reader/full/sustainable-williamson-local-energy-action-plan 38/53
38
Figure C-6: Hypothetical Cost Savings Resulting From Implementation and Monitoring of Energy
Goals and Recommendations
100% Savings Resulting from Energy Efficiency / Energy Reduction Initiatives
(should be used to fund Energy Coordinator
80% Operational Costs and and finance key capital improvements)
Capital Investments for
60% Energy Efficiency /
Energy Reduction
40% Initiatives
20%Status Ongoing Energy Costs as Percentage of Baseline
Quo0%
BaselineEnergy
Costs
Year 1 Year 2 Year 3 Year 4 Year 5 Year 6 Year 7 Year 8
Pooling Resources with Mingo County
Another option for funding a permanent Energy Coordinator discussed during the Charrette is
combining the scope of work to include both Williamson and Mingo County. Given the limited
number of buildings, facilities, and vehicles owned and operated by both the City of Williamson
and Mingo County, it might be cost effective for both municipalities to share one Energy
Coordinator. Moreover, the City and County may be able to realize economies of scale by pooling
their buying power together for energy efficient equipment and building upgrades.
Such cooperation is not unprecedented. The Sustainability Manager for the City of Durham and
Durham County is funded in equal parts out of the general fund of both municipalities. By
establishing a joint Sustainability Office, the City of Durham and Durham County have realized
economies of scale and a greater level of cooperation on sustainability issues. Foundation Funding and Revolving Loan Fund
During the Charrette, stakeholders identified the following Foundations as potential sources of
revenue for the City’s energy conservation and energy efficiency initiatives:
The Benedum Foundation
Foundation for the Tri-State Community
The City can use Foundation grants to establish a revolving loan fund that would issue low- or
no-interest loans for energy conservation, energy efficiency, or renewable energy improvements.
The loans are paid back from cost-savings resulting from the energy improvements. As loans are
repaid, the revolving loan fund would issue additional loans thereby providing the upfront
capital for even more energy improvements throughout the community. Charrette attendees
suggested that the Community Foundation of Williamson or the Williamson Redevelopment
Authority could solicit capital for and administer Williamson’s revolving loan fund.
Implementation of LEAP Report Goals and Recommendations

8/13/2019 Sustainable Williamson - Local Energy Action Plan
http://slidepdf.com/reader/full/sustainable-williamson-local-energy-action-plan 39/53
39
Federal Tax Incentives
Appendix 4 contains a summary of federal tax incentives for energy efficiency and alternative
energy. Of particular importance to Williamson is the Section 179D tax deduction of up to $1.80
per square foot available to “designers” who assist Williamson with energy upgrades to new or
existing publically owned buildings. Municipalities are not capable of taking advantage of many
federal tax incentives. Section 179D allows Williamson to allocate its otherwise wasted tax
deduction to the engineer, contractor, architect, environmental consultant, or energy servicesprovider that assists a new or renovated City building save at least 50 percent of the heating,
cooling, water heating, and interior lighting energy cost of a building that meets ASHRAE
Standard 90.1-2001. Each of the three energy-using systems of a building — the envelope,
interior lighting system, and heating and cooling system — is eligible for one third of the
incentive ($0.60 per square foot) if it meets its share of the whole-building savings goal. The
Section 179D tax deduction applies to buildings or systems placed in service or remodeled
between January 1, 2006 and December 31, 2013.
The designer that is going to receive Williamson’s Section 179D tax deduction should first
consult a tax professional qualified to handle such transactions (e.g., certified public account or
tax attorney). According to Internal Revenue Service Notice 2008-40,35 before a designer can
claim the Section 179D deduction with respect to property installed on or in a Williamson-
owned building, the designer must obtain all of the following information from the City of
Williamson in writing:
(1) The name, address, and telephone number of an authorized representative of the owner
of the government-owned building;
(2) The name, address, and telephone number of an authorized representative of the
designer receiving the allocation of the Section 179D deduction;
(3) The address of the government-owned building on or in which the property is installed;
(4) The cost of the property;
(5) The date the property is placed in service;
(6) The amount of the Section 179D deduction allocated to the designer;36
(7) The signatures of the authorized representatives of both the owner of the government-
owned building and the designer or the designer’s authorized representative; and,
(8) A declaration, applicable to the allocation and any accompanying documents, signed by
the authorized representative of the owner of the government-owned building, in the
following form:
“Under penalties of perjury, I declare that I have examined
this allocation, including accompanying documents, and to thebest of my knowledge and belief, the facts presented in support
of this allocation are true, correct, and complete.”
35 Internal Revenue Service. Internal Revenue Bulletin: 2008-14 (April 7, 2008), Notice 2008-40 “Amplification of Notice 2006-52;Deduction for Energy Efficient Commercial Buildings.” Available online: http://www.irs.gov/irb/2008-14_IRB/ar12.html#d0e3966. Referenced on Dec. 20, 2011.
36 According to Internal Revenue Service Notice 2008-40, if more than one designer (e.g., engineer, contractor, architect,environmental consultant, or energy services provider) is responsible for creating the technical specifications for installation ofenergy efficient commercial building property on or in a Williamson-owned building, the owner of the building should eitherdetermine which designer is primarily responsible and allocate the full deduction to that designer, or at the owner’s discretion,allocate the deduction among several designers.
8/13/2019 Sustainable Williamson - Local Energy Action Plan
http://slidepdf.com/reader/full/sustainable-williamson-local-energy-action-plan 40/53
40
According to Internal Revenue Service Notice 2008-40, the owner of the public building is not
required to include any amount in income on account of the Section 179D deduction allocated to
the designer. The owner of the public building is, however, required to reduce the basis of the
energy efficient commercial building property (or partially qualifying commercial building
property) by the amount of the Section 179D deduction allocated.
Combining Incentives and Programs
Williamson can maximize funds available for energy efficiency and/or renewable energy bycombining multiple tax incentives. For example, after a homeowner has maximized efficiency,
the homeowner can take advantage of both West Virginia’s residential solar tax credit as well as
the state’s net metering law that would allow for the homeowner to sell electricity back to the
grid. It should be noted that any net excess electricity generation by a customer during a billing
cycle will be carried over to their next bill as a kWh credit at their retail rate.
Many discussions during the Charrette focused on the historic significance of Williamson’s
buildings. There is an opportunity for Williamson to attract funds for historic preservation, such
as the Historic Preservation Tax Incentives Program administered by the National Park Service,
which is a tax credit that applies specifically to preserving income-producing historic properties.
If Williamson can successfully assist its commercial building owners receive funds of historicpreservation, then energy conservation/efficiency should be included in the project. Another
opportunity for Williamson is to invest savings from increased energy efficiency into historic
building restoration.
Looking Forward
The Williamson Local Energy Action Plan has been developed through considerable input and
guidance from Williamson City employees, elected officials, board members, and concerned
citizens. The LEAP planning process itself yielded a tremendous amount of information that can
help Williamson lower its energy bills and spur economic development. The City should
continue this momentum by implementing the Energy Goals contained in this LEAP Report.

8/13/2019 Sustainable Williamson - Local Energy Action Plan
http://slidepdf.com/reader/full/sustainable-williamson-local-energy-action-plan 41/53
Williamson Local
Energy
Action Plan Appendix 1 – LEAP Energy Inventory Data

8/13/2019 Sustainable Williamson - Local Energy Action Plan
http://slidepdf.com/reader/full/sustainable-williamson-local-energy-action-plan 42/53

8/13/2019 Sustainable Williamson - Local Energy Action Plan
http://slidepdf.com/reader/full/sustainable-williamson-local-energy-action-plan 43/53

8/13/2019 Sustainable Williamson - Local Energy Action Plan
http://slidepdf.com/reader/full/sustainable-williamson-local-energy-action-plan 44/53

8/13/2019 Sustainable Williamson - Local Energy Action Plan
http://slidepdf.com/reader/full/sustainable-williamson-local-energy-action-plan 45/53
Williamson Local Energy Action Plan Appendix 2 – Unsigned Copy of Street Lights Contract

8/13/2019 Sustainable Williamson - Local Energy Action Plan
http://slidepdf.com/reader/full/sustainable-williamson-local-energy-action-plan 46/53
This Agreement entered into this 18th day of July, 2001 by and between Appalachian Power Company dba
American Electric Power, hereafter call the Company, and City of Williamson or his or its heirs, successors or
assigns, hereafter called the Customer.
Witnesseth:For and in consideration of the mutual covenants and agreements hereinafter contained, the parties hereto agree
with each other as follows:
1. The Company agrees to operate and maintain, as hereinafter provided, certain street and highway lighting
equipment owned and installed by others the downtown area of the City of Williamson, antique streetlighting
system, consisting of the following number of lamps set forth below, and to supply sufficient electric energy tocontinuously operate the lamps to give the maximum amount of illumination obtainable under commercial
conditions from one-half hour after sunset until one-half hour before sunrise, every night and all night,
approximately 4,000 hours per annum during the term of years hereinafter set forth.
The maintenance to be performed by the Company will be limited to normal maintenance requirements and
shall include replacing the cleaning of glassware and lamps owned by others, and replacement of ballasts and photocells as required by normal mortality, but shall not include replacement of other equipment owned by others, such as
lighting standards or bases, conduit systems, electrical conductors, luminaries, etc. The Customer agrees to acceptthe service herein specified during the term hereof and to pay therefor at the rates on file with the Public Service
Commission of West Virginia. Current Rate Schedule S.L. (Street Lighting) of P.S.C. W. Va. Tariff No. 11 is
attached.
NO.
OF LAMPS
SIZE
IN LUMENS
TYPE
28 9500 sodium vapor enclosed
2. The Company agrees that during the term of this Agreement it will furnish, for the Customer, operation andmaintenance for such additional lighting units as may be installed and owned by others when requested to do so by
written notice from a duly authorized representative of the Customer. Whenever operation and maintenance of such
additional lighting units are so ordered and supplied, the number of lamps to be served throughout the remainder of
the period covered by this Agreement shall be increased accordingly. The Customer agrees to pay for suchadditional lamps in accordance with the prices listed above.
3. Bills are due upon receipt and payable at the main or branch offices of the Company within twenty (20) daysof the mailing date.
4. All material furnished by the Company shall remain the property of the Company and may be removed at thetermination of this Agreement, if the Company so desires.
5. The Company shall keep each and every lamp herein specified in operation during the time provided.
Adjustments to the bill for outages which are reported to the company shall be made for all days during which the
lamp failed to work, provided that the Company shall be given two regular work days (Monday thru Friday) fromthe time of notification by the customer or its representative to repair any fixture covered in this agreement and that
no adjustment shall be made if the repair is completed within that two day period. Formal notification shall be
considered to be in written form only but it is agreed that verbal notification shall be sufficient for precipitatingrepair measures. The adjustment made by the Company shall be on a daily pro rata basis to reflect the actual
number of days which the unit was inoperative.

8/13/2019 Sustainable Williamson - Local Energy Action Plan
http://slidepdf.com/reader/full/sustainable-williamson-local-energy-action-plan 47/53
6. If the Customer shall default in the payment of any bills as herein provided, the Company may at its option,
after having given ten (10) days written notice of its intention to do so, discontinue the service herein specified and
continue to withhold the supply of electric energy for street lighting until such time as the Customer has made payment for all bills in which it is in arrears. Any such suspension of service by the Company shall not terminate
this Agreement unless Company so elects. Otherwise, upon payment by the Customer of the amount it is in arrears,
the Agreement shall remain in full force and effect for the period herein specified.
7. The Customer, as a further consideration for the promises and agreements made by the Company, herein set
forth, hereby grants to the said Company the privilege of the use of the streets, alleys and public places of saidCustomer for the purpose of placing its poles and equipment.
8. The Customer agrees that during the life of this Agreement it will provide in its annual budgets and estimatesand levy of taxes sufficient funds to pay the Company any amounts due for services rendered under said Agreement.
9. All and singular the terms and conditions of this Agreement shall be binding upon and insure to the benefit
of the parties hereto, their respective successors and/or assigns.
10. This Agreement cancels and supersedes all previous Agreements relating to the supply of the servicedescribed herein.
11. This Agreement shall extend for a period of ten (10) years from the date thereof and continue with self-renewal provisions for successive periods of one year each until either party shall give at least 60 days’ notice to the
other of the intention to discontinue the Agreement at the end of the initial term or any successive yearly period.
Rates during the term of this Agreement will change in accordance with revisions in Rate Schedule S.L. asapproved by the Public Service Commission of West Virginia.
IN WITNESS WHEREOF, the parties hereto have caused these presents to be executed in triplicate by theirduly authorized officers the day and year first above written.
Appalachian Power Company
d/b/a AMERICAN ELECTRIC POWER
City of Williamson
BY: ________________________________
Alan Bragg
BY: ____________________________
TITLE: Manager
Account# 028-221-952-0 Title: ____________________________

8/13/2019 Sustainable Williamson - Local Energy Action Plan
http://slidepdf.com/reader/full/sustainable-williamson-local-energy-action-plan 48/53
Williamson Local
Energy
Action Plan Appendix 3 – Williamson City Vehicles

8/13/2019 Sustainable Williamson - Local Energy Action Plan
http://slidepdf.com/reader/full/sustainable-williamson-local-energy-action-plan 49/53

8/13/2019 Sustainable Williamson - Local Energy Action Plan
http://slidepdf.com/reader/full/sustainable-williamson-local-energy-action-plan 50/53
8/13/2019 Sustainable Williamson - Local Energy Action Plan
http://slidepdf.com/reader/full/sustainable-williamson-local-energy-action-plan 51/53
Williamson Local
Energy
Action Plan Appendix 4 – Tax Incentives

8/13/2019 Sustainable Williamson - Local Energy Action Plan
http://slidepdf.com/reader/full/sustainable-williamson-local-energy-action-plan 52/53
Southface Energy Institute is a non-profit that promotes sustainable homes, workplaces and communities through research, education, advocacy and technical assistance. 1
Visit southface.org for more information. 1-2011
On December 17, 2010, President Obama signed the ax Relie,
Unemployment Insurance Reauthorization, and Job Creation Act o
2010. Tis law extends, but alters, the tax credits or energy efficiency
available in 2011. Tis latest update to the Energy Policy Act o 2005
incentivizes American homeowners and business by providing:
• Tax credits for homeowners for energy eciency
improvements to existing homes
• Tax credits for builders of highly ecient new homes
• Rebates for energy ecient appliances
he American Recovery and Reinvestment Act o 2009 (ARRA)
continues to provide incentives or:
• Tax credits1 or residential and commercial photovoltaics,
solar water heating systems, geothermal heat pumps, and
other renewable technologies
• Tax deductions1 or owners or designers o highly efficient
commercial buildings
Residential Energy Efficiency
Existing Homes
For homeowners wishing to make their primary residence more energy
efficient, the ax Relie, Unemployment Insurance Reauthorization,
and Job Creation Act o 2010 will provide some incentives. Qualifiedimprovements receive a ederal tax credit o 10% o the cost, excluding
labor, with a lietime maximum o $500. Tereore, homeowners
who have claimed $500 or more in any previous year are ineligible.
Te improvements must be in place prior to December 31, 2011. Te
ollowing improvements are eligible or the tax credit:
• Insulation material which meets 2009 IECC and
amendments
• Exterior windows that meet ENERGY SAR criteria (subject
to $200 cap, through lietime o credit 2006-2011)
• Exterior doors and skylights that meet ENERGY SAR
criteria
• Metal roofing having pigmented coatings specifically design
to reduce heat gain and meets ENERGY SAR
Te ollowing products have individual limits:
• Advanced main air circulating fan (subject to $50 cap)
• Natural gas, propane, or oil furnace or hot water boiler
with an annual uel utilization efficiency o 95 or greater
(subject to $150 cap)
• Electric heat pump water heater with an energy actor o at
least 2.0 (subject to $300 cap)
• Electric heat pump which achieves the highest efficiency tier
established by the Consortium or Energy Efficiency (subject
to $300 cap)
• Central air conditioner which achieves the highest efficiency
tier established by the Consortium or Energy Efficiency
(subject to $300 cap)
• Natural gas, propane, or oil water heater which has either
an energy actor o at least 0.82 or a thermal efficiency o at
least 90 percent (subject to $300 cap)
• Biomass stoves that use “plant-derived uel available on arenewable or recurring basis, including agricultural crops and
trees, wood and wood waste and residues (including wood
pellets), plants (including aquatic plants), grasses, residues,
and fibers” (subject to $500 cap)
Residential Solar and Renewables
New Homes & Existing Homes
For new and existing homes, there is no limit on the size o the tax
credit or many renewable systems including geothermal heat pumps
solar water heaters, solar photovoltaics, small wind energy, uel cell
and microturbine systems. Qualified products receive a ederal taxcredit equal to 30% o their cost. Tese systems must be placed in
service between Jan 1, 2009 and Dec 31, 2016. Some examples o
qualified products are:
• Solar water heating systems property certified by the Solar
Rating and Certification Corporation (SRCC) which provide
at least 50% o the system demand
• Photovoltaic systems which provide electric power or the
residence
• Wind energy systems which provide 100 kW or less electric
power to the residence
• Geothermal heat pumps which satisy the ENERGY SAR
criteria
• Fuel cells with a capacity ≥ 0.5 kW and efficiency ≥ 30%
($500 per 0.5 kW)
• Microturbines with a maximum capacity o 2,000 kW and a
minimum efficiency o 26%
White Paper Prepared by Southface Energy Institute – January, 2011
Tax Incentive Opportunities forEnergy Efciency and Alternative Energy 241 Pine St. NE, Atlanta, GA 30308
www.southface.org

8/13/2019 Sustainable Williamson - Local Energy Action Plan
http://slidepdf.com/reader/full/sustainable-williamson-local-energy-action-plan 53/53
Renewables for Businesses
Te business investment tax credit varies rom 10% to 30% depending
upon they type o system installed. Tis tax credit is available to
businesses that purchase solar water heaters, solar photovoltaics, smal
wind energy, geothermal heat pumps, uel cells and microturbine
systems placed into service between Jan 1, 2009 and Dec 31, 2016. Ti
business investment tax credit has no maximum cap. ARRA allows
business to receive a ederal grant or renewable energy property bu
this offer may not be combined with the investment tax credit.
Combined Incentives
In many cases, multiple tax incentives may be claimed. In the case
o a new home or example, the builder may claim credit or the
high efficiency home and the homeowner may claim tax credits o
solar hot water, photovoltaic, and uel cell systems. Other financia
incentives, such as local utility rebates, urther reduce the cost o
building or owning a solar and energy efficient home. For example
in Georgia, Georgia Power offers financial incentives to builders o
ENERGY SAR® qualified new homes. o learn more about state
incentives or renewable energy, visit: www.dsireusa.org .
Resources
Database o State Incentives or Renewables & Efficiency
www.dsireusa.org
Florida Solar Energy Center
www.fsec.ucf.edu
Residential Energy Services Network (RESNE)
www.natresnet.org
Southeast Energy Efficiency Alliance
www.seea.us
ax Incentives Assistance Project (IAP)
www.energytaxincentives.org
Internal Revenue Service (IRS)
www.irs.gov
Te American Recovery and Reinvestment Act o 2009 (ARRA)
www.recovery.gov
Footnotes
1 ax deductions are subtracted rom income beore total tax
liability is computed. ax credits are subtracted directly rom
the total tax liability. A credit is three or more times more
advantageous to the taxpayer than a deduction. For example
a tax credit o $500 or someone in the 28% tax bracket isequivalent to a tax deduction o $1,786.
2 Te building envelope separates conditioned space rom
unconditioned (or outside) and consists o an air barrier and
insulation that must be continuous and touching. Another
Energy Efficient Home Credit
Home Builders
Te ax Relie, Unemployment Insurance Reauthorization, and Job
Creation Act o 2010 extends the tax credit created by the Energy Policy
Act o 2005. It provides retroactive and current tax credits or houses
acquired between December 31, 2009 and January 1, 2012.
• Site-built homes may receive up to $2000 if they reduce
heating and cooling energy consumption by 50% relative
to the 2004 Supplement to the 2003 International EnergyConservation Code standard and the minimum efficiency
standards established by the Department o Energy. Te
building envelope component improvements must account
or at least one-fifh o the reduction in energy consumption.
• Manufactured homes may receive $2000 if their consumption
is cut by 50% relative to the same stipulations provided or the
site- built home as well as follow the Federal Manufactured
Home Construction and Saety Standards.
• Manufactured homes may also receive $1000 for a
30% decrease relative to 2004 Supplement to the 2003
International Energy Conservation Code. Building envelope
improvements must account or at least one-third o thereduction in energy consumption, and the house must meet
ENERGY SAR® Labeled Home requirements.
In all instances, the builder must complete a certification process
provided by the Internal Revenue Service (IRS). More information is
provided on www.dsireusa.org/incentives/incentive.cm?Incentive_
Code=US41F&re=1&ee=1.
Commercial Buildings
Owners or tenants (or designers, in the case o publicly owned
buildings) o new or existing commercial buildings may qualiy or
a tax deduction o up to $1.80 per square oot. Te buildings mustbe constructed or reconstructed to save at least 50% o the heating,
cooling, water heating, and interior lighting energy cost o a building
that meets ASHRAE Standard 90.1-2001.
Each o the three energy-using systems o the building — the envelope2,
interior lighting system, and heating and cooling system — is eligible
or one third o the incentive ($0.60 per square oot) i it meets its share
o the whole-building savings goal.
Sofware that meets the Internal Revenue Service’s requirements
or accuracy and consistency will determine the projected energy
savings. Tird party inspectors review the plans and veriy building
parameters to determine compliance. Te incentives apply to buildings
or systems placed in service or remodeled between January 1, 2006and December 31, 2013
For more inormation, visit the Commercial Building ax Deduction
Coalition website: www.efficientbuildings.org.


