Page 1
Prof. Wadid ERIAN
DIRECTOR, Land and Water Uses Division
LAS ACSAD
Lead Author in IPCC - SREX , WGII
Member in UNISDR GAR Advisory Board
Advisor World Bank
AGRICULTURE DROUGHT and LAND DEGRADATION
LOSS in ARAB REGION
NENA Land and Water Days 15-18 December, Amman, JORDAN
Page 2
Temperatures … Increase
Precipitation ……decline
Evapo-transpiration levels …. move up
Water availability reduced
Population continue ……. growing
Climate variability ----increases
The already on going Water-Scarce in the
region becomes disaster
Accordingly, People in many Arab countries
may not have enough water to irrigate crops,
support industry, or provide drinking water.
Poverty, Unemployment, Diseases,
Instability between farmers and pastoralists
People living in cities and those working in
tourism …….. increase
natural resources becomes under risk
Climate change also affects gender
dynamics.
Challenges requires Adaptation Pyramid,
which is based on
process of assessing the climate, reacting to the
perceived challenges, implementing cross-
sectoral responses, and monitoring progress; all
with strong leadership.
Page 3
Population Density Person/Km 2
http://en.wikipedia.org/wiki/Image:Pop_density.jpg
Population
Page 4
the majority of Arab countries are already experiencing deficits in internal and external renewable water resources.
By midcentury all Arab countries will face serious water deficits as demand and supply continue to diverge.
Total regional renewable water shortage will be about 200 cubic kilometers per year in 2040–2050 based on the average climate change projection.26 The demand is expected to rise by about 25 percent in 2020–2030 and up to 60 percent in 2040–2050,
The demand is expected to rise by about 25 percent in 2020–2030 and up to 60 percent in 2040–2050, while renewable supply will drop by more than 10 percent over the same time period in the region.
As a result unmet demand for the entire MENA region, expressed as percentage of total demand, is expected to increase from 16 percent currently to 37 percent in 2020–2030 and 51 percent in 2040–2050
Renewable Water Resources versus Total Water
Demand Through 2050, Source: World Bank, 2011.
16 37 51
Page 5
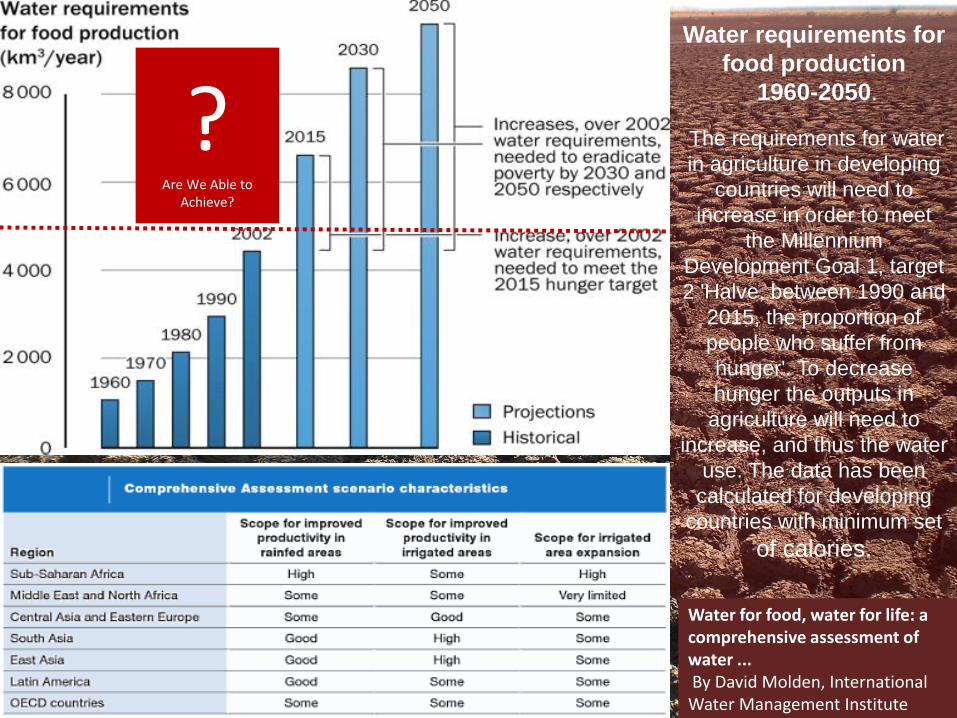
Water requirements for
food production
1960-2050.
The requirements for water
in agriculture in developing
countries will need to
increase in order to meet
the Millennium
Development Goal 1, target
2 'Halve, between 1990 and
2015, the proportion of
people who suffer from
hunger'. To decrease
hunger the outputs in
agriculture will need to
increase, and thus the water
use. The data has been
calculated for developing
countries with minimum set
of calories.
? Are We Able to
Achieve?
Water for food, water for life: a comprehensive assessment of water ... By David Molden, International Water Management Institute
Page 6
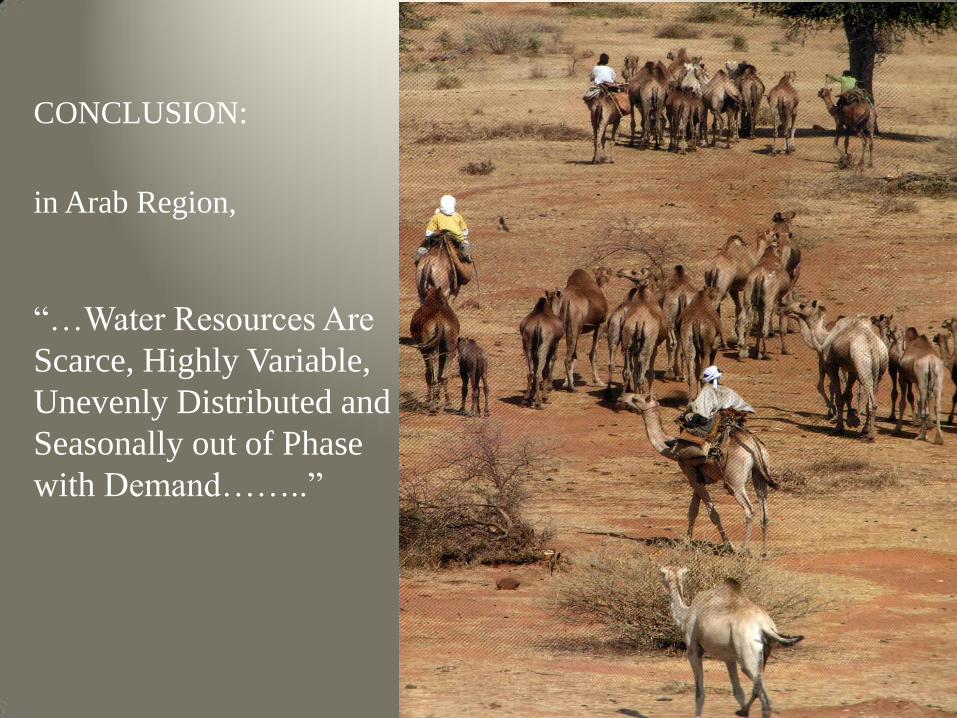
CONCLUSION:
in Arab Region,
“…Water Resources Are
Scarce, Highly Variable,
Unevenly Distributed and
Seasonally out of Phase
with Demand……..”
Page 7
ARAB REGION 3. Drought
Where Hazards Have Struck
Arab Region Between Drought and Flash Floods
Page 8
during the growing season affects yield - SOIL
MOISTURE DROUGHT, or
AGRICULTURAL DROUGHT,
Storage changes in soil moisture and
groundwater are also affected by
increases in actual evapotranspiration in
addition to reductions in precipitation.
Precipitation deficit is defined as a
METEOROLOGICAL DROUGHT.
A MEGADROUGHT
is drought, lasting much longer than normal,
usually a decade or more.
Drought is a relative term shortage of precipitation
related to particular activity
A period of abnormally dry weather long enough
to cause a serious hydrological imbalance.
during the runoff season affects water supplies –
HYDROLOGICAL DROUGHT.
What is Drought?
Page 9
There is medium confidence that since the
1950s some regions of the world have
experienced trends toward more intense and
longer droughts, in particular in Southern
Europe and West Africa, but in some
regions droughts have become less frequent,
less intense, or shorter, for example, central
North America and northwestern Australia.
There is medium confidence that
anthropogenic influence has contributed to
some changes in the drought patterns
observed in the second half of the 20th
century, based on its attributed impact on
precipitation and temperature changes
(though temperature can only be indirectly
related to drought trends).
Major Key Massage Indicated in IPCC 2012
Page 10
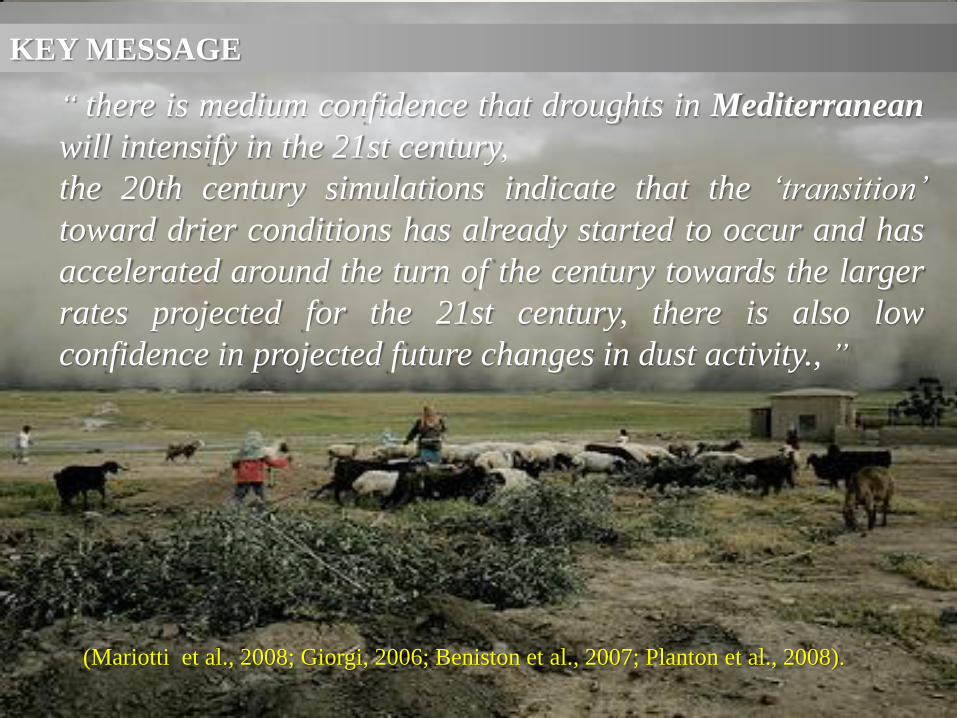
KEY MESSAGE
“ there is medium confidence that droughts in Mediterranean
will intensify in the 21st century,
the 20th century simulations indicate that the ‘transition’
toward drier conditions has already started to occur and has
accelerated around the turn of the century towards the larger
rates projected for the 21st century, there is also low
confidence in projected future changes in dust activity., ”
(Mariotti et al., 2008; Giorgi, 2006; Beniston et al., 2007; Planton et al., 2008).
Page 11
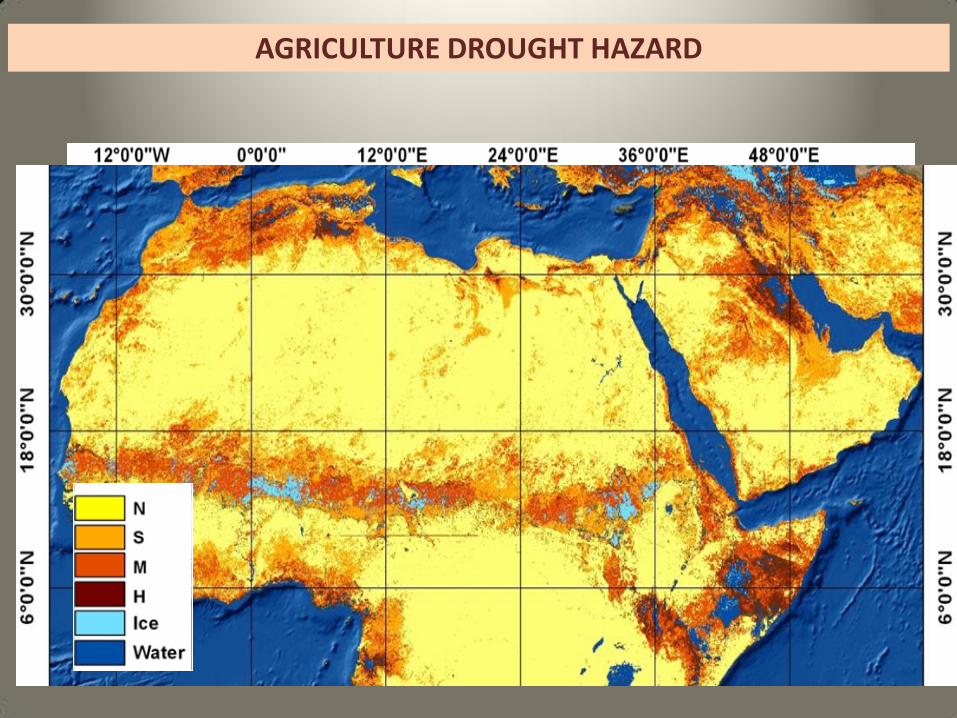
AGRICULTURE DROUGHT
HAZARD
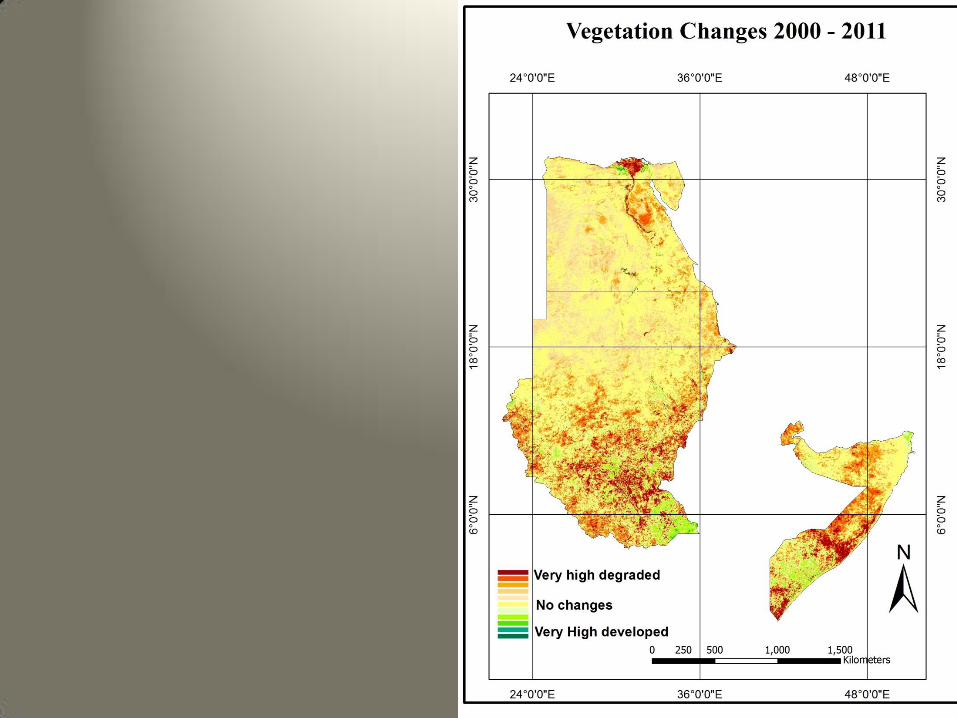
LAND COVER/USE
Vegetation LAND –USE including Negative change in
vegetation Cover Land degradation in Arab Countries
and River’s Basins
LOSS IN CROPS
SPEI
AGRICULTURAL DROUGHT SOCIO
ECONOMICA LOSSES
AVAILABLE STATISTICAL
DATA ANALYSIS
HAZARD
RISK
VULNERABILITY
EXPOSURE POPULATION
Affected
POPULATION
Land Degradation
COUNTRY
CAPACITY
Page 12
Projected Aridity Changes in the 21st Century.
Dai Aiguo 2010. “Drought under Global Warming “ . National Center for Atmospheric
Research, Boulder, Colorado , USA , John Wiley & Sons, Ltd. DOI: 10.1002/wcc.81
أ
ب
ج
وه
ـ
ج د
أ ب
Page 13
Historical Drought Data
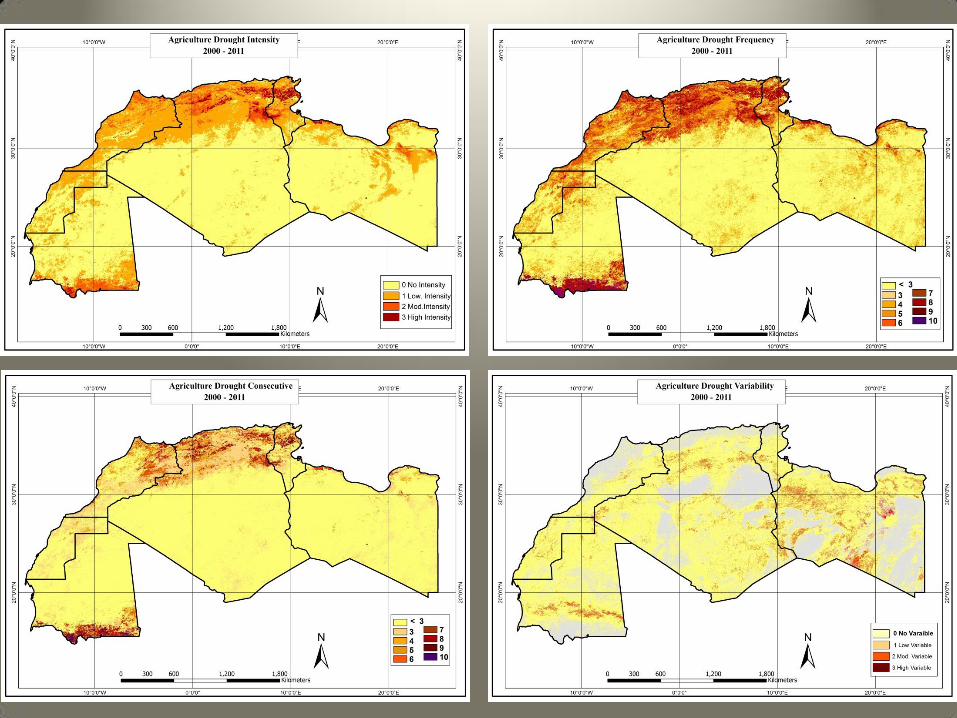
Page 14
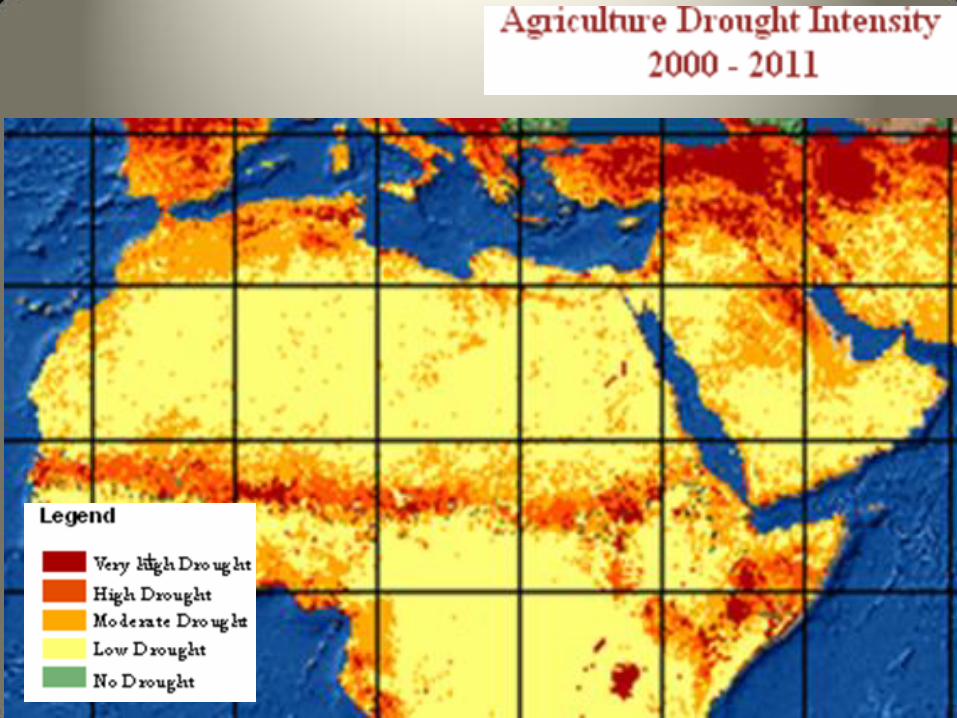
Drought intensity Map of
Agriculture Season 2000/2010
Page 19
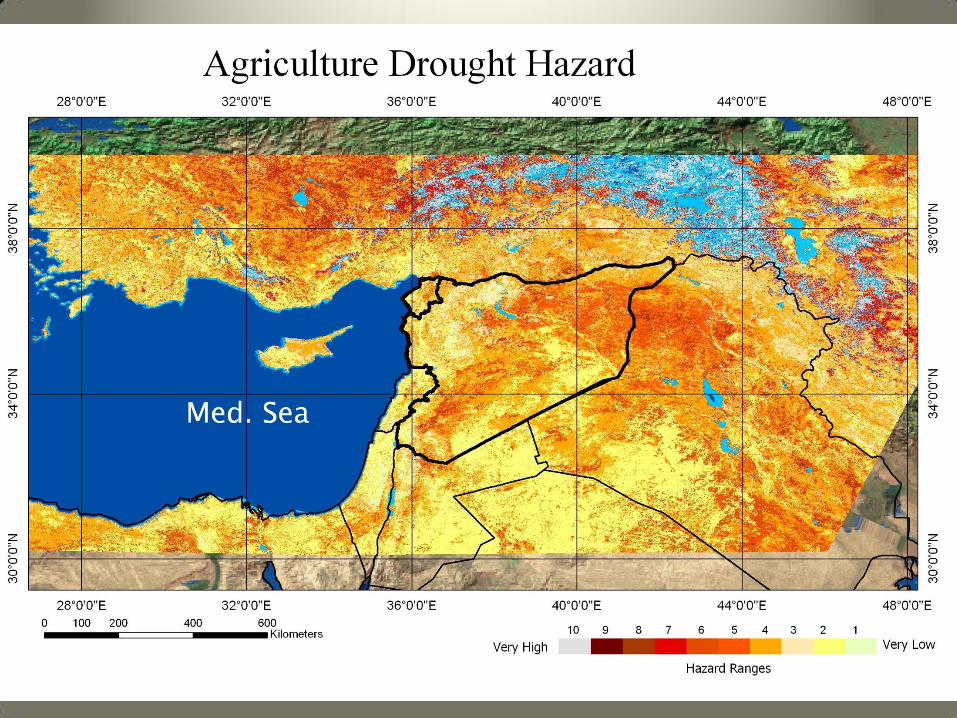
AGRICULTURE DROUGHT HAZARD
Page 20
Country High Moderate Slight No Change All Hazard High/Moderate Ranking
3 2 1 0 (1+2+3) (2+3) (2+3)
Class 7: very High coverage of ADH >85 %
Lebanon 15.16 24.67 49.79 10.38 89.62 39.83 3
Gaza Strip 9.69 35.09 44.82 10.39 89.6 44.78 3
Qatar 18.15 33.34 34.88 13.62 86.37 51.49 4
Class 6, High coverage of ADH 75 – 85%
Morocco 2.9 31.14 50.18 15.77 84.22 34.04 3
Kuwait 47.12 26.71 9.29 16.88 83.12 73.83 6
West Bank 3.8 19.96 57.23 19.01 80.99 23.76 2
Syria 19.87 30.02 29.9 20.21 79.79 49.89 4
Class 5, high to Moderate Coverage of ADH 60-75 %
Tunisia 10.6 20.17 39.03 30.2 69.8 30.77 3
Iraq 21.95 27.31 19.61 31.12 68.87 49.26 4
Djibouti 9.08 38.74 20.51 31.67 68.33 47.82 4
Class 4, Moderate Coverage of ADH 45-60 %
Somalia 18.56 34.01 3.96 43.46 56.53 52.57 4
Class 3, moderate to low Coverage ADH 30-45 %
Saudi Arabia 4.09 11.5 24.12 60.29 39.71 15.59 2
U. A. Emirates 0.14 6.69 32.85 60.31 39.68 6.83 1
Sudan 1.74 13.21 18.35 66.7 33.3 14.95 1
Class 2, low Coverage of ADH 15-30 %
Yemen 1.87 11.8 15.79 70.54 29.46 13.67 1
Jordan 3.65 6.44 18.64 71.27 28.73 10.09 1
Algeria 3.34 9.41 12.77 74.49 25.52 12.75 1
Mauritania 1.03 9.61 14.13 75.23 24.77 10.64 1
Oman 0.18 3.4 15.85 80.58 19.43 3.58 1
Libya 0.6 2.86 13.34 83.2 16.8 3.46 1
Egypt 0.89 3.09 11.92 84.09 15.9 3.98 1
Agriculture Drought Severity in Arab Region
Page 26
2009 - 2000
2039 - 2030
ARIDITY CHANGES
Expected Aridity Drought Severity Index Penman–Monteith method (sc-PDSI pm)
Dai Aiguo 2010. “Drought under Global Warming “ . National Center
for Atmospheric Research, Boulder, Colorado , USA , John Wiley &
Sons, Ltd. DOI: 10.1002/wcc.81
ACSAD result for Agriculture Drought
Page 28
Affected Land Use By Agriculture Drought Hazard
Page 29
LAND DEGRADATION
Land Degradation
Page 36
Country Total
Affected
Population Level of Affection
population Total Highly Moderately Slightly
Person Person % % Person % Person % Person
more than 75 %
Gaza Strip 1710257 1631699 95.4 23.1 394595 37.3 637533 35.1 599571
Lebanon 4140289 3659245 88.4 14.9 615930 23.7 980977 49.8 2062338
Morocco 32309239 28489205 88.2 3.4 1084323 25.6 8279726 59.2 19125155
Kuwait 2646314 2182391 82.5 38.7 1024692 30.2 799656 13.5 358043
Qatar 1951591 1604689 82.2 11.7 228063 35.1 685045 35.4 691580
West Bank 2622544 2155328 82.2 3.1 80084 20.6 539562 58.6 1535681
Syria 22530746 18154031 80.6 20 4511188 32.2 7256524 28.3 6386319
50 - 75%
Iraq 31129225 22414138 72 22 6848353 29.5 9185593 20.5 6380192
Djibouti 774389 546459 70.6 9.1 70750 41.7 322737 19.8 152972
Algeria 35406303 24702390 69.8 8.4 2968549 24.4 8649945 37 13083896
Tunisia 10732900 7489320 69.8 11 1177323 21 2255575 37.8 4056423
Jordan 6508887 3940650 60.5 6.8 444253 11.7 759343 42.1 2737054
UA Emirates 5314317 2876597 54.1 0.1 6651 12 640022 42 2229925
25 - 50%
Sudan 34206710 16755837 49 3.7 1277099 21.1 7201304 24.2 8277435
Somalia 10085638 4763780 47.2 14 1408350 28.9 2913056 4.4 442374
Mauritania 3359185 1449593 43.2 2.7 89834 19.1 642136 21.4 717624
Saudi Arabia 26534504 11026083 41.6 3 790694 12 3174464 26.6 7060925
Yemen 24771809 10145643 41 5 1226404 17.4 4311169 18.6 4608071
Libya 6733620 2478479 36.8 4.2 280180 11.1 744411 21.6 1453888
Oman 3090150 977462 31.6 1.3 41180 6.5 200541 23.8 735742
Egypt 83688164 21387582 25.6 1.7 1417875 6 5023838 17.9 14945869
Page 37
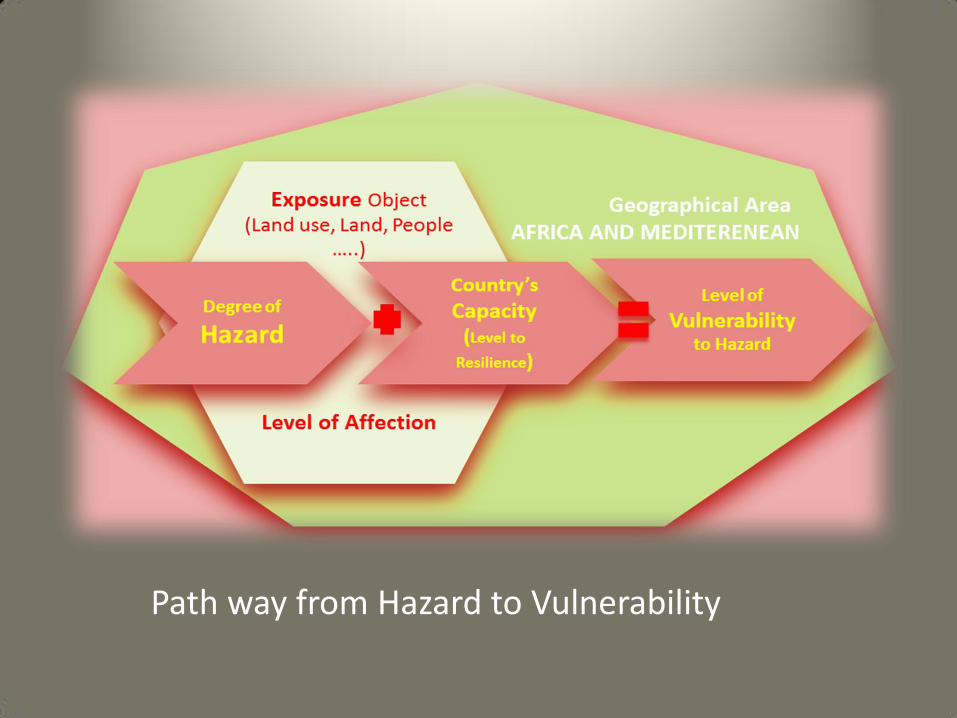
Path way from Hazard to Vulnerability
Page 38
PoA. Mean Population Density
person/Km2
PoB. People in working age (15-
64) years %.
PoC. Population growth rate.
PoD. Net migration rate: for each
1000 person.
PoE. Females % of Labour force
in Agriculture- 2011.
PoF. Average Agriculture
population Change 2011 -
2001%.
Step 2: Assessing The Main Population Capacity Characteristics of the
Studied Countries.
Page 39
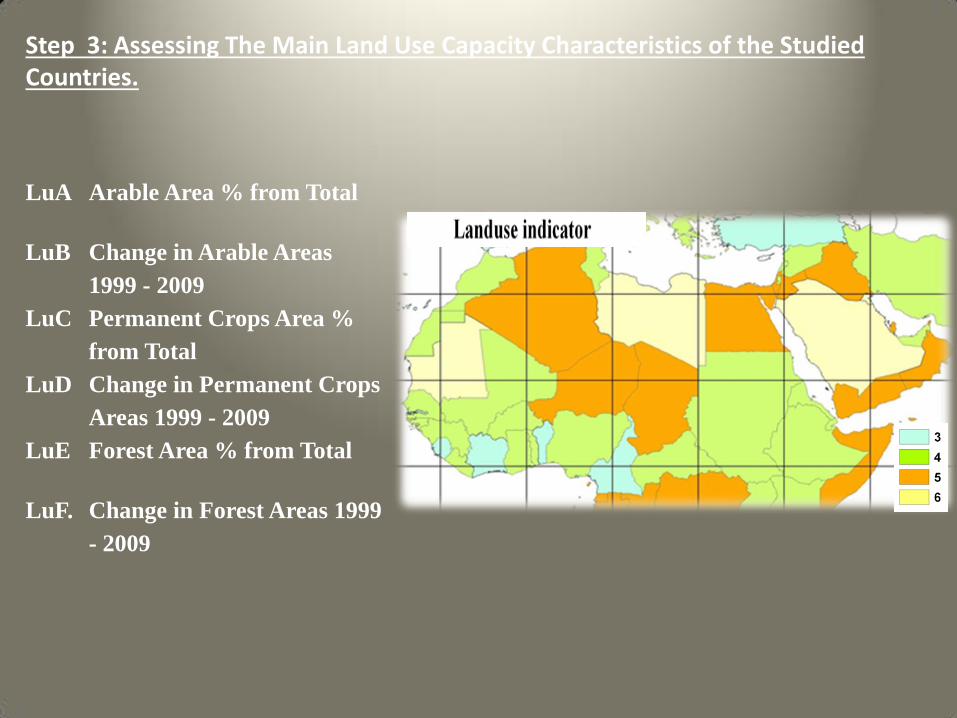
Step 3: Assessing The Main Land Use Capacity Characteristics of the Studied Countries.
LuA Arable Area % from Total
LuB Change in Arable Areas
1999 - 2009
LuC Permanent Crops Area %
from Total
LuD Change in Permanent Crops
Areas 1999 - 2009
LuE Forest Area % from Total
LuF. Change in Forest Areas 1999
- 2009
Page 40
Step 4: Assessing the Main Water Availability Capacity Characteristics of The
Studied Countries.
WaA Total Renewable Water
Resources cu km
WaB Fresh water Withdrawal
Total Cu km/y
WaC Fresh water Withdrawal
agricultural %
WaD Fresh water Withdrawal per
Capita Cu km/y
Page 42
Vulnerability Classes to ADH
Vulnerability classes Countries
High to Moderate Vulnerability: moderate coverage of ADH
45-60 %, moderate severity and very Low to low capacity
Somalia,
Moderate Vulnerability: high coverage of ADH 75 – 85%,
moderate severity and moderate capacity
Morocco, Syria and
(Kuwait, has a very low vegetation
cover).
Moderate Vulnerability: high to moderate coverage of ADH
60-75 %, moderate severity and high to moderate capacity
Tunisia, Djibouti, and Iraq
Moderate to Low Vulnerability: very high coverage of ADH
>85 %, high severity and very high capacity
Lebanon
(Qatar, has a very low vegetation cover)
Moderate to Low Vulnerability: moderate to low coverage
ADH 30-45 %, moderate to low severity and moderate to low
capacity
Sudan, Saudi Arabia and UAE ( UAE
has a very low vegetation cover).
Low Vulnerability: low coverage of ADH 15-30 %, low
severity and high to moderate capacity
Jordan, Yemen, Mauritania, Algeria,
Libya, and Oman,
Low Vulnerability: low coverage of ADH 15-30 %, low
severity and low capacity
Egypt,
Page 43
Total Affected
Population Level of Affection
population Total Highly Moderately Slightly Million Person
M. Person % M. Person % M. Person % M Person %
350 188 54 26 7 65 19 97 28
Affected Population in Arab Region
Page 44
Country
HAZARD COVERAGE AND SEVERITY in %
AFFECTED VEGETATION LAND USE
ADH coverage
ADH severity
LD coverage
LD severity
Forest Rangelands Rainfed Total
Lebanon 89.62 39.83 9.5 7.1 1.07 18.32 63.45 82.84
Gaza Strip 89.6 44.78 69.2 56.7
Qatar 86.37 51.49 45.9 13.3 0.41 0.09 0.5
Morocco 84.22 34.04 14.5 3.6 0.22 17.6 22.28 40.1
Kuwait 83.12 73.83 83 44.7 0.17 0.09 0.26
West Bank 80.99 23.76 37.5 26.2 22.04 47.52 69.56
Syria 79.79 49.89 63.1 51.6 0.23 16.77 19.64 36.64
Tunisia 69.8 30.77 27.3 13 0.34 10.52 13.49 24.35
Iraq 68.87 49.26 64.1 51 0.02 13.43 8.29 21.74
Djibouti 68.33 47.82 82.2 69.3 19.69 0.05 19.74
Somalia 56.53 52.57 50.2 39.1 0.11 37.47 11.04 48.62
Saudi Arabia 39.71 15.59 68.7 28.9 0 0.47 0.14 0.61
U. A. Emirates 39.68 6.83 35.3 6 0.13 0.1 0.23
Sudan 33.3 14.95 47.4 26.7 0.61 16.05 7.1 23.76
Yemen 29.46 13.67 46.3 20.4 0 2.32 0.99 3.31
Jordan 28.73 10.09 29.1 9.3 33.2 25.13 58.33 Algeria 25.52 12.75 40.5 2.9 0.1 3.8 3.6 7.5
Mauritania 24.77 10.64 36.9 8.9 8.73 2.01 10.74
Oman 19.43 3.58 38 9.5 0.01 0.55 0.17 0.73
Libya 16.8 3.46 45.8 6.2 0.62 0.22 0.84
Egypt 15.9 3.98 47.3 10.7 0.1 0.23 0.33
Page 45
AFFECTED AGRICULTURE AREAS (2009)
Page 46
AREAS AFFECTED BY LAND DEGRADATION AND DROUGHT
Drought
Land Degradation
Slight Moderate High non
Slight
Moderate 3.6 1.6 0.5
High 3.5 3.3 1.7
non 85.8
Page 47
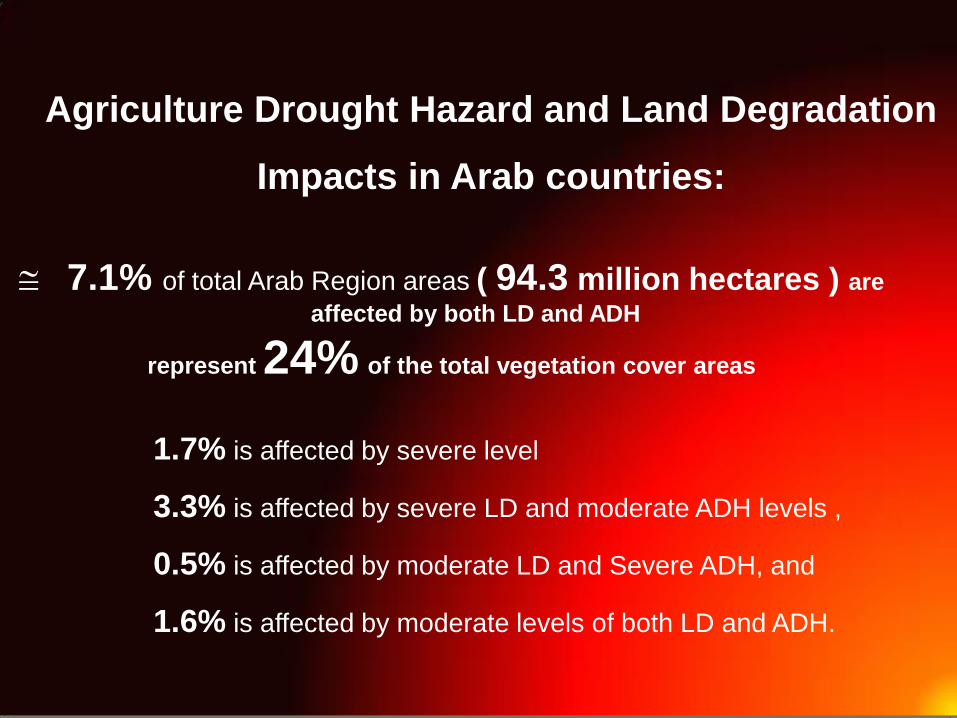
Agriculture Drought Hazard and Land Degradation
Impacts in Arab countries:
7.1% of total Arab Region areas ( 94.3 million hectares ) are
affected by both LD and ADH
represent 24% of the total vegetation cover areas
1.7% is affected by severe level
3.3% is affected by severe LD and moderate ADH levels ,
0.5% is affected by moderate LD and Severe ADH, and
1.6% is affected by moderate levels of both LD and ADH.
Page 48
Country
Duration Potatoes Wheat Maize Sorghum Millet Crops Total Losses
1999-2011 Million Million Million Million Million
Ton US$ Ton US$ Ton US$ Ton US$ Ton US$ Million Ton Million US$
Morocco
Million Ton 1.37 411.6 3.91 1171.64 1588.52 Million US$ -0.91 -271.61 -8.73 -2620.12 -2901.37
Egypt
Million Ton 2.6 779.09 7.27 2182.11 2971.07 Million US$ -3.81 -1143.8 -3.93 -1177.73 -2329.27
Algeria
Million Ton 1.85 555.56 2.17 651.32 1210.9 Million US$ -3.25 -974.34 -2.91 -873.87 -1854.37
Syria
Million Ton 0.57 171.54 3.94 1183.34 1359.39 Million US$ -0.45 -136.34 -5 -1500.34 -1642.13
Iraq
Million Ton 0.68 205.37 1.88 563.85 771.78 Million US$ -0.68 -203.43 -2.91 -872 -1079.02
Saudi Arabia
Million Ton 0.41 121.74 2.16 648.17 0.24 18.11 790.83 Million US$ -0.32 -97.2 -2.61 -782.98 -0.1 -7.8 -891.01
Tunisia
Million Ton 0.34 100.85 1.27 379.83 482.29 Million US$ -0.16 -47.75 -2.22 -666.78 -716.91
Lebanon
Million Ton 0.43 128.85 0.14 41.19 170.61 Million US$ -0.55 -165.54 -0.02 -5.49 -171.6
Yemen
Million Ton 0.23 69.77 0.16 47.79 0.38 28.33 146.66 Million US$ -0.16 -49.24 -0.24 -71.79 -0.49 -36.4 -158.32
Libya
Million Ton 0.24 72.91 73.15 Million US$ -0.33 -99.97 -100.3
Jordon
Million Ton 0.13 38.77 38.9 Million US$ -0.17 -49.8 -49.97
Somalia
Million Ton 0.19 13.92 0.12 8.9 46.21 Million US$ -0.4 -29.9 -0.13 -9.99 -49.45
Mauritania
Million Ton 0.01 4.34 0.02 1.15 0.07 5.56 0.01 0.46 11.62 Million US$ -0.01 -3.58 -0.01 -0.62 -0.12 -8.99 0 -0.14 -13.47
Oman
Million Ton 0.02 4.89 0.02 1.37 6.3 Million US$ -0.02 -5.47 -0.06 -4.41 -9.96
Kuwait
Million Ton 0.02 6.84 6.86 Million US$ -0.02 -5.48 -5.5
TOTAL 9675.09 -11972.7
CROP(s) LOSSES
Page 49
Erian 2013, Estimated Agriculture (Crops and Rangelands) drought and Land Degradation t direct vegetation losses of about ………..
US$ 2.2 billion annually during the period from 2000-2010, The social and environmental impacts on rural areas is not estimated……..