72


TAB
LE
OF
CO
NTE
NTS
BIOTEC10 Penergetic® K as Bioactivator of Microorganism Growth in vitro
12 Effects of Penergetic® P application on leaf chlorophyll content in soybean and tomato plants
FEPAGRO38 Effect of Penergetic® Technology on decomposition rate in ryegrass (Lolium
multiflorum Lam.) crop residues
41 Feeding activity of soil microorganisms and fauna in crops using different management practices
47 Effect of soil bioactivation on suppression of damage caused by Pratylenchus brachyurus in soybean
50 Effects of Penergetic® technology on seed germination and chlorophyll content in soybean plants
HOLANTEC53 Evaluation of Penergetic® P and Penergetic® K in temperate climate
fruit trees
UFSM - UNIVERSIDADE FEDERAL DE SANTA MARIA24 Effect of Penergetic® P and Penergetic® K in the stimulation of
mycorrhization in soybean roots
26 Effect of Penergetic® P and Penergetic® K in the suppression of damage caused by nematodes in soybean crops
28 Bioactivation effect of Penergetic® on microbial activity and soil quality
30 Biological activity and persistence of crop residues deposited on the surface of soil treated with Penergetic®
32 Effect of Penergetic® P and Penergetic® K on mycorrhization and phytonematode penetration in wheat roots
34 Effect of Penergetic® P and Penergetic® K on soil microorganism activity in wheat crop
37 Effect of Penergetic® P and Penergetic® K on production components of wheat grown in the presence or absence of nematodes
ACA / FUNDAÇÃO PROCAFÉ14 Effect of the Bioactivators Penergetic® P and Penergetic® K on the
vegetative development of the coffee tree in cultivated and bare soil, in association with phosphate fertilizers and cattle manure.
ACA / UNIUBE / FUNDAÇÃO PROCAFÉ21 Assessing the viability of using Penergetic® to increase availability of
Potassium and Phosphorus in Savanna Soils
UNIOESTE55 The use of soil and plant bioactivator with and without mineral fertilizer
in soybean and its relation to nutritional bioavailability and production components
PENERGETIC®58 Phosphate fertilizer adjustment using Penergetic® technology in soybeans
INTEGRAÇÃO ASSESSORIA AGRICOLA61 Effect of Penergetic® P and Penergetic® K Penergetic® K on soybean
production
3

We live in a constantly changing environment, which gene- rates challenges related to social, political and environmen-tal issues. Regulation of these issues is a basic premise for the formation of a healthy, balanced and prosperous society, capable of respecting and preserving scarce resources of our planet without endangering future generations.
Currently one of the biggest challenges of world agriculture is to develop sustainable agriculture systems that are finan-cially viable, which can produce food, fiber and energy in suf-ficient quantity and quality, with a reduced impact on natural resources. In this sense, the adoption of models and tech-nologies of alternative and innovative production that result in the optimization for the use of inputs with high economic and environmental impact may represent a viable strategy for producers who are seeking to adopt more sustainable and productive systems.
The use of technologies that increase the efficiency of the use of water, light and nutrients available to plants, constitutes a quantum leap in the pursuit of more productive, balanced and less polluting processes.
In this edition, you will find valuable information that is revolu-tionizing agriculture in Brazil and the world.
Penergetic® is a natural bioactivation technology, unique in the world, developed and produced in Switzerland by the company Penergetic® Inter-national AG, which allows the copy and transfer of specific information from original substances (IC’s – Information Carriers) to a substance carrier, through the process of energizing electromagnetic waves in a reduced spectrum.These pieces of information are transferred through this energetic charge and contain specific properties, harmless to any living organism, capable of promot-ing increased biological activity of soil and plants, re-vitalizing disturbed ecological processes (an example is our present agriculture, an intensive monoculture), by treating the cause and not the consequence of such disturbances, bringing quality standards and biological balance closer to nature. This action pro-moted by Penergetic®, we call BIOACTIVATION.
What are we after?
What is Penergetic®?
240
200
160
120
80
40
0
K20 P205 N
Fertilizer consumption Mt
61 73 83 89 92 95 98 ‘01 ‘04 10 13 16 19‘07
Source: IFA/ANDA
3% a. a.
4

The mode of action of the Penergetic technology is based on the practical principles of biophysics and chemistry and natural science.
All atoms and molecules, compounds or substances have a specific electromagnetic frequency (= wave), measurable with the Tesla scale. Using electromagnetic induction under controlled conditions these frequencies can be transferred to a carrier material.
The Penergetic Technology can transfer any bio-electromagnetic fre-quency of solid, liquid or gaseous natural substances to carrier materi-als.
This process changes the state of the electrons of the carrier material and when put to use the previously transferred bio-electromagnetic
frequencies are emitted to the area of application.
Some of the proven effects of the use of Penergetic Products in agri-culture are improvements in the biological activity in the soil and ab-sorption and utilization of plant nutrients, reduction of biotic and abi-otic stress, as well as promotion of plant growth and plant protection.
In part the Penergetic Technology utilizes the theories of frequency modulation of Michael Faraday (1846) and James Clerk Maxwell (1864).
Based on the works of Faraday and Maxwell, Nikola Tesla in the mid-1900s developed the first methodology of frequency transmission
without the use of wires, on which also the Penergetic Technology is based in part.
Today the following equation applies to the Penergetic Technology:
Scientists: Nikola Tesla (above) & Michael Faraday (below)
How does Penergetic® technology work?
In short: The Penergetic® Technology is capable of activating biochemical processes and modulating the activities of microorganisms and plants, which then in turn stimulate or activate biochemical processes in the various systems and the environment.
5
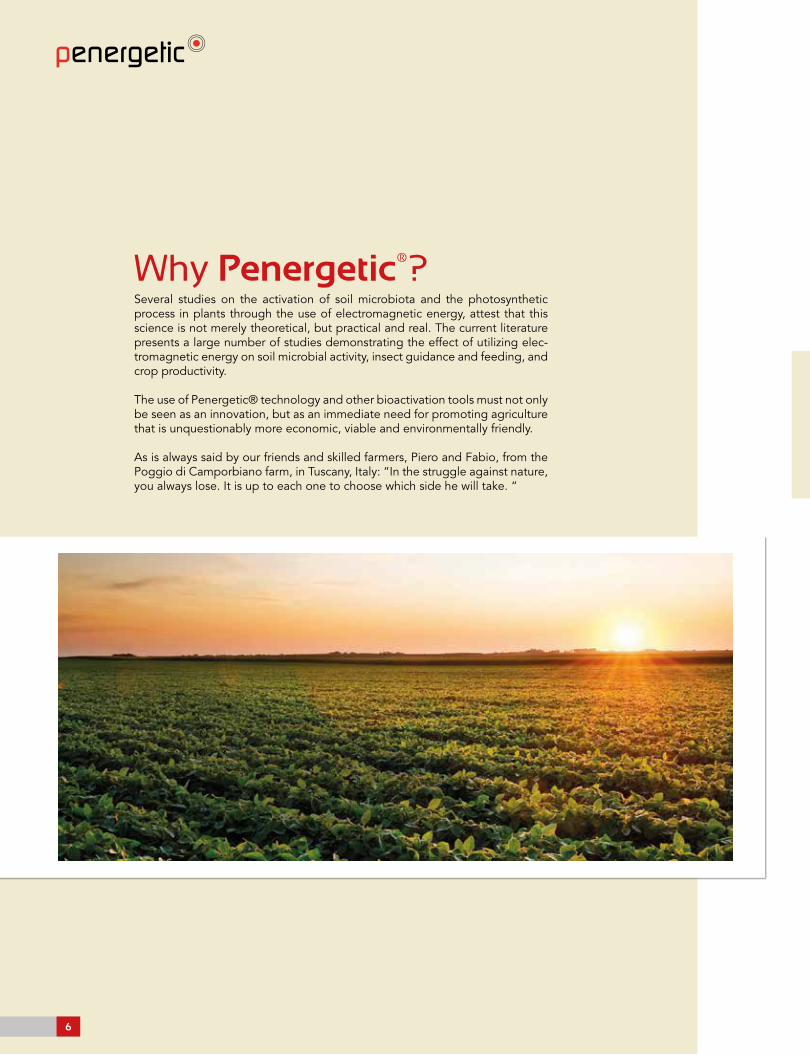
Several studies on the activation of soil microbiota and the photosynthetic process in plants through the use of electromagnetic energy, attest that this science is not merely theoretical, but practical and real. The current literature presents a large number of studies demonstrating the effect of utilizing elec-tromagnetic energy on soil microbial activity, insect guidance and feeding, and crop productivity.
The use of Penergetic® technology and other bioactivation tools must not only be seen as an innovation, but as an immediate need for promoting agriculture that is unquestionably more economic, viable and environmentally friendly.
As is always said by our friends and skilled farmers, Piero and Fabio, from the Poggio di Camporbiano farm, in Tuscany, Italy: “In the struggle against nature, you always lose. It is up to each one to choose which side he will take. “
Why Penergetic®?
6

The practical realization of the need to maintain high biological activity in agricultural lands was the result of a natural maturation of the industry. Dissatisfaction with the current chemical model stimulated agronomists, technicians, researchers, businesses and producers to seek answers for the following questions, among others:
1. Why are crops increasingly vulnerable to pests and diseases, as well as climatic variability, even though there have been a vast number of tech-nological and genetic advances?
2. Why is there an increasingly common lack of correlation between in-creased amounts of fertilizer and increased productivity?
3. Why do the results of soil and leaf analyses often seem to lack an expla-nation for what we actually see in clinical examinations of crops?
The Penergetic® Technology for the Bioactivation of Agroecosystems
Reductionist and Cartesian approaches have been unable to meet the current demands of the agri-cultural sector and society as a whole. The best answers encountered for these questions so far, arise from biological studies related to a systemic understanding of the natural processes involved in agricultural production.
A multitude of serious scientific work conducted in agricultural systems around the world point in the same direction: the dominant agricultural model dramatically reduces system life in quantity, di-versity and activity. This reduction increasingly makes the system hostage to external inputs, since they reduce the natural forces working to keep it sustainable and productive.
Antônio Teixeira
7
On the other hand, the agro-ecological concepts serve well to demon-strate that by preserving and enhancing life and diversity of the soil-plant system, we obtain better results for all those involved because:1. The profits of the producer improve2. The quality of the food improves3. The impact on the environment decreasesTherefore, the current challenge is: how do we preserve, enhance and harmonize organisms in this multi-species living system called the crop?
Currently, the sector of agricultural inputs manufacturers around the world is searching for the solutions. All of them bet on products. The products launched on the market in recent years are numerous, in order to meet this urgent need. When analyzing the modes of action and the effects produced by them, we can see different strategies, such as:1. Providing the system with live microorganisms in hopes that they will establish and reproduce more than the existing ones;2. Replacing mineral fertilizers with organic fertilizers or organominerals in order to provide nutrients for plants less aggressively;3. Providing organic substances, such as acids, enzymes, amino acids, extracts algae, etc., in order to stimulate the system’s life
The research, in turn, works to test different management practices to reach the same goal: increasing the system’s life.Below we highlight two of them:1. Management combining crops, livestock and forests;2. Those that use sequences of different crop, managing cocktail cover plants.
In this context of management that seeks to increase the life of the soil-plant system, we highlight the use of the Penergetic® technology, as-sociated with the management of cover crops, as the most promising alternative until now. The tropical farming systems are much more dependent on microorgan-isms and biomass production than the cold climate ones. The big differ-ence between Penergetic® and other technologies is the fact that Pener-getic® promotes increased life naturally and enduringly.
Penergetic® activates the biological systems, harmonizing the environ-ment with its electromagnetic field, rather than throwing external organ-isms into a system unable to maintain them. After all, trying to increase life, without understanding the reasons that led to its decline, does not seem to be the best strategy. The Penergetic® technology is therefore a coherent strategy to bioacti-vate soil-plant systems. The best effects have been observed when it is combined with other actions consistent with the proposed objective.
Reduce that which is destroying the system lifecycle, and increase that which is encouraging growth: this seems to be the key for better days in food production.
8

Always based on agronomic principles, but clearly understanding soil fertility far be-yond its chemistry, what challenges us is the awareness that it is possible to make a more economic, sustainable, intelligent and rational agriculture. What challenges us is understanding thoroughly that agricultural production systems we work with consist of a large natural and fragile structure, which needs balance and moderation in all production processes.
What challenges us?The Penergetic® technology brings to the market a unique opportunity to pro-duce more at a lower cost and in a sus-tainable and safe manner. We invite you to take a look at some of the official re-sults obtained from the use of this tech-nology in its various aspects.
9
Penergetic® K as Bioactivator of Microorganism Growth in vitro
INTRODUCTION
In a state of equilibrium, the soil is in-habited by a number of microorganisms that affect its fertility (STAMFORD et al., 2005) by providing biological, physical and chemical transformations that pro-mote agricultural sustainability (SOT-TERO, 2003). Fungi of the genus Tricho-derma sp. are microorganisms that occur naturally in diverse types of soil and are considered to be biostimulators of root growth and to aid in the solubilization and absorption of nutrients (HARMAN, 2000; HARMAN et al., 2004). According to Delgado et al. (2010), some of the species of this genus also are able to make nutrients from the rizosphere avail-able thus reducing the need for fertilizer. The GL growth medium was developed to identify microorganisms capable of
Ricardo Bemfica Steffen – Agricultural Engineer, PhD in Soil Science, Post-doctorate in Soil Science/ UFSM.Gerusa Pauli Kist Steffen - Agricultural Engineer, PhD in Soil Science, Researcher for Fepagro Florestas, Santa Maria/ RS.Joseila Maldaner - Biologist, PhD in Vegetal Physiology.Cléber Witt Saldanha – Forest Engineer, PhD in Physiology
increasing phosphorus availability to plants through processes of phosphorus mineralization and solubilization. OBJECTIVE
The objective of this study was[AP1] to evaluate the effect of adding[AP2] Pen-ergetic® K on the development of three isolates of Trichoderma sp. in GL me-dium containing insoluble phosphorus (inorganic phosphate precipitate).
METHODOLOGY
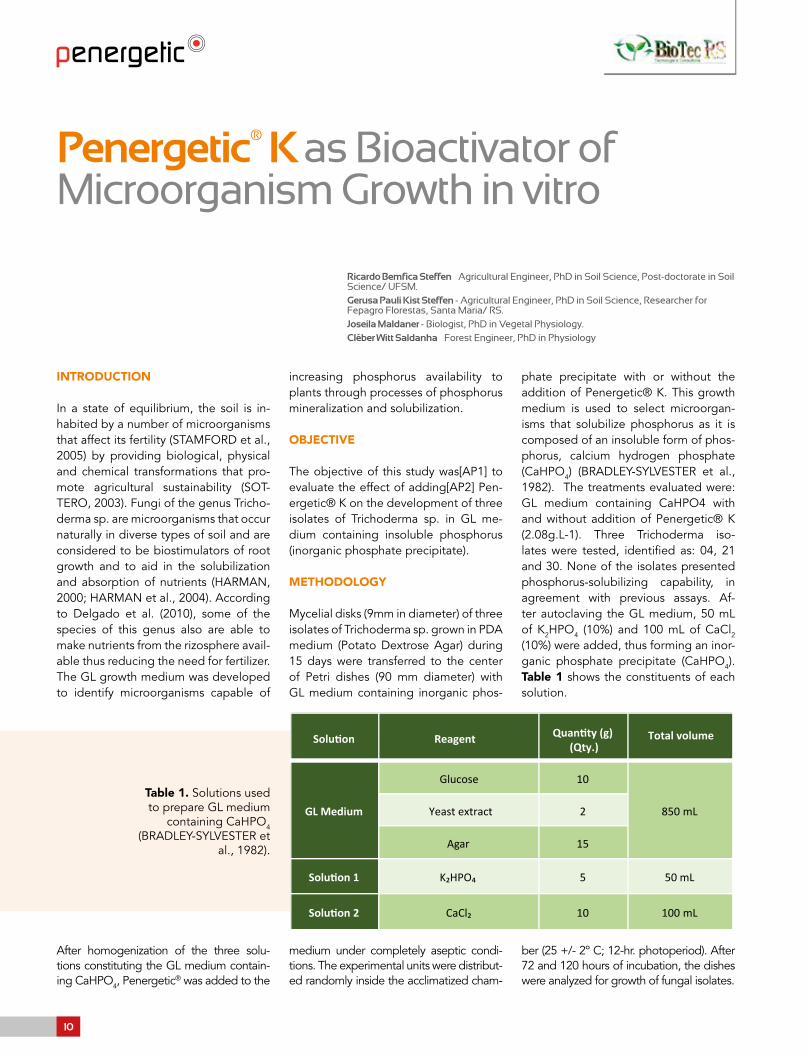
Mycelial disks (9mm in diameter) of three isolates of Trichoderma sp. grown in PDA medium (Potato Dextrose Agar) during 15 days were transferred to the center of Petri dishes (90 mm diameter) with GL medium containing inorganic phos-
After homogenization of the three solu-tions constituting the GL medium contain-ing CaHPO4, Penergetic® was added to the
Table 1. Solutions used to prepare GL medium
containing CaHPO4 (BRADLEY-SYLVESTER et
al., 1982).
phate precipitate with or without the addition of Penergetic® K. This growth medium is used to select microorgan-isms that solubilize phosphorus as it is composed of an insoluble form of phos-phorus, calcium hydrogen phosphate (CaHPO4) (BRADLEY-SYLVESTER et al., 1982). The treatments evaluated were: GL medium containing CaHPO4 with and without addition of Penergetic® K (2.08g.L-1). Three Trichoderma iso-lates were tested, identified as: 04, 21 and 30. None of the isolates presented phosphorus-solubilizing capability, in agreement with previous assays. Af-ter autoclaving the GL medium, 50 mL of K2HPO4 (10%) and 100 mL of CaCl2 (10%) were added, thus forming an inor-ganic phosphate precipitate (CaHPO4). Table 1 shows the constituents of each solution.
Solution Reagent Quantity (g) (Qty.)
Total volume
GL Medium
Glucose 10
850 mLYeast extract 2
Agar 15
Solution 1
Solution 2
K₂HPO₄ 5 50 mL
CaCl₂ 10 100 mL
medium under completely aseptic condi-tions. The experimental units were distribut-ed randomly inside the acclimatized cham-
ber (25 +/- 2º C; 12-hr. photoperiod). After 72 and 120 hours of incubation, the dishes were analyzed for growth of fungal isolates.
10

RESULTS
Relevant visual differences were ob-served in relation to the growth of the
Based on the results observed in the growth of isolates of Trichoderma sp. after 72 hours of incubation, it was found that both the growth and myce-lial sporulation of isolates grown in the presence of Penergetic® K were significantly higher than that obser-ved in isolates grown in the absence of the product (Figures 1 and 2). The increases in growth and sporulation of isolates grown in medium with Pener-
three fungal isolates, grown in medium with Penergetic® K, in comparison to those grown without it. After 72 hours of incubation, the isolates n. 4 and 21
Com Penergec
Sem Penergec
Figure 1. In vitro growth of fungal isolates of Tricho-derma sp. (n. 4 and 21) in GL medium containing CaHPO4 with and without addition of Pener-getic® K after 72 hours of incubation.
Figura 2. In vitro growth of three fungal isolates of Trichoderma sp. (n. 4, 21 and 30) in GL growth medium containing CaHPO4 with and without the addition of Penergetic® K after 120 hours of incubation.
Com Penergetic®
Com Penergetic®
Sem Penergetic®
Sem Penergetic® Com Penergetic® Sem Penergetic®
getic® K were maintained over time, since even after 120 hours of incuba-tion, the isolates grown in the absence of Penergetic® K presented growth and sporulation notably inferior, pro-bably due to the reduced supply of essential nutrients for their develop-ment, which in this case is phosphorus.
CONCLUSION
The addition of Penergetic® K to the GL growth medium containing calcium hydrogen phosphate increased growth and sporulation of fungal isolates of the genus Trichoderma sp. in vitro.
presented a visibly superior growth rate when grown in medium with Pen-ergetic® K (Figure 1).
With Penergetic®
With Penergetic®
With Penergetic® With Penergetic®
Without Penergetic®
Without Penergetic®
Without Penergetic®Without Penergetic®
After 120 hours of incubation, isolate n. 30 also presented in growth and sporulation due to the addition of Penergetic® K in the growth medium (Figure 2).
11

Effects of Penergetic® P application on leaf chlorophyll content in soybean and tomato plants
INTRODUCTION
Relative leaf chlorophyll content is the parameter most used to indicate the level of leaf nitrogen (N) levels in order to determine whether top dressing is needed. This method is based on the positive correlation between chlorophyll content and N content in plants (SORATTO et al, 2006;. Barbosa Filho et al, 2008, 2009). Chlorophyll content is im-portant to the extent that it determines the pho-tosynthetic potential of the plant by controlling the amount of solar radiation that the leaf absorbs (BLACKBURN, 2007; HATFIELD et al., 2008). One possibility for quick and non-destructive quantita-tive determination of chlorophyll content, based on its spectral signatures, is the use of chlorophyll meters, which are active sensors of the intensity of the color green in the leaves and operate by com-bining transmittance and absorbance properties of chlorophylls (SHADCHINA and Dmitrieva, 1995;
Blackburn, 2007). Indirect readings taken by the portable chlorophyll me-ter correspond to the relative chlorophyll content in the leaf (Takebe and Yoneyama, 1989; Chapman and Barreto 1997). Chlorophyll content may be altered by various factors, such as stressful conditions, nitrogen fertili-zation or application of alternative bioinductors.
OBJECTIVE
The objective was to verify whether foliar application of Penergetic® P changes chlorophyll content in the leaves of soybean and tomato plants in a greenhouse.
METHODOLOGY
The experiment was conducted in a greenhouse utilizing soybean and tomato plants grown in plastic cups containing the commercial substrate Carolina Soil (Figure 1). Twenty-seven days after sowing, five plants of each crop received Penergetic® P solution applied to the aerial part at a dose of 1.9 g of Penergetic® P per L of water. Each plant received 2.5 mL of the solution, applied using a manual sprayer.
Treatments were with and without Penergetic® P application and five replicates per treatment were used for each plant species (soybean and tomato). The plants were kept in a greenhouse for seven days. A daily reading of chlorophyll
Figure 1: Soybean (A) and tomato plants (B) 27 days after sowing, grown in plastic
cups containing the commercial substrate Carolina Soil.
content was taken at the same hour with a ClorofiLOG CFL 1030 chlo-rophyll meter (Falker, 2008). Readings were conducted at one point of the foliar limb from the first pair of fully expanded leaves from the apical meristem, sampling one plant in each repetition.
Ricardo Bemfica Steffen – Agricultural Engineer, PhD in Soil Science, Post-doctorate in Soil Science/ UFSM.Gerusa Pauli Kist Steffen - Agricultural Engineer, PhD in Soil Science, Researcher for Fepagro Florestas, Santa Maria/ RS.Joseila Maldaner - Biologist, PhD in Vegetal Physiology.Cléber Witt Saldanha – Forest Engineer, PhD in Physiology
12
RESULTS
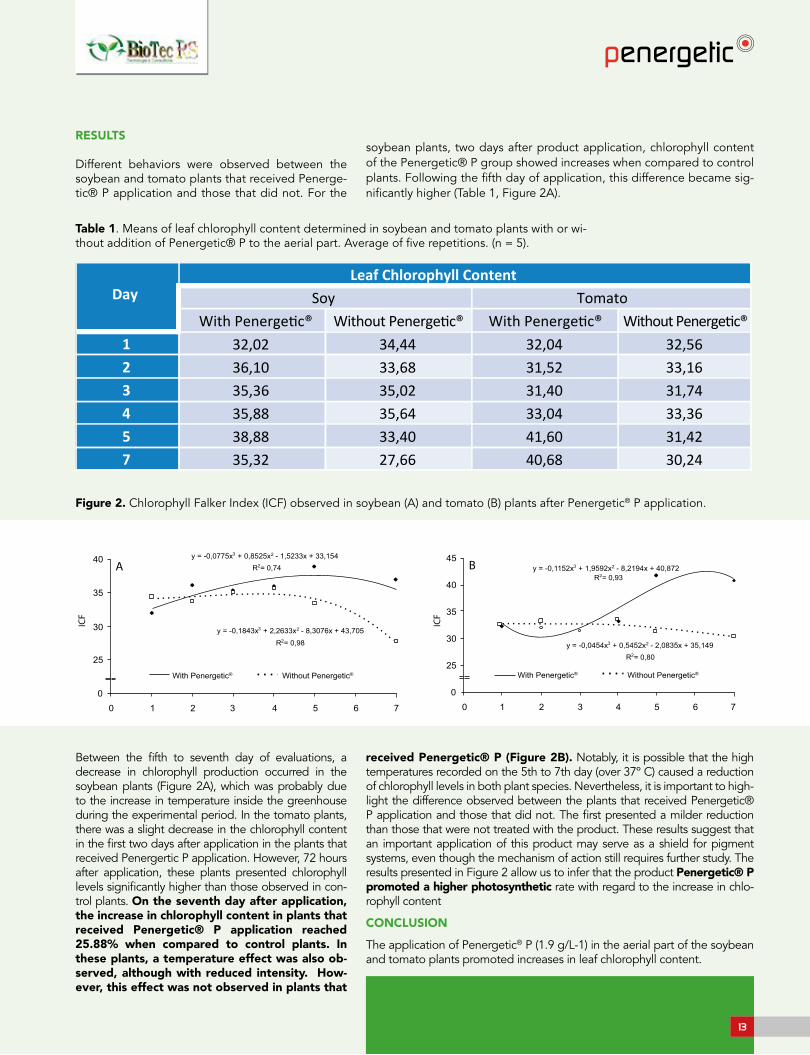
Different behaviors were observed between the soybean and tomato plants that received Penerge-tic® P application and those that did not. For the
Between the fifth to seventh day of evaluations, a decrease in chlorophyll production occurred in the soybean plants (Figure 2A), which was probably due to the increase in temperature inside the greenhouse during the experimental period. In the tomato plants, there was a slight decrease in the chlorophyll content in the first two days after application in the plants that received Penergertic P application. However, 72 hours after application, these plants presented chlorophyll levels significantly higher than those observed in con-trol plants. On the seventh day after application, the increase in chlorophyll content in plants that received Penergetic® P application reached 25.88% when compared to control plants. In these plants, a temperature effect was also ob-served, although with reduced intensity. How-ever, this effect was not observed in plants that
soybean plants, two days after product application, chlorophyll content of the Penergetic® P group showed increases when compared to control plants. Following the fifth day of application, this difference became sig-nificantly higher (Table 1, Figure 2A).
received Penergetic® P (Figure 2B). Notably, it is possible that the high temperatures recorded on the 5th to 7th day (over 37º C) caused a reduction of chlorophyll levels in both plant species. Nevertheless, it is important to high-light the difference observed between the plants that received Penergetic® P application and those that did not. The first presented a milder reduction than those that were not treated with the product. These results suggest that an important application of this product may serve as a shield for pigment systems, even though the mechanism of action still requires further study. The results presented in Figure 2 allow us to infer that the product Penergetic® P promoted a higher photosynthetic rate with regard to the increase in chlo-rophyll content
CONCLUSION
The application of Penergetic® P (1.9 g/L-1) in the aerial part of the soybean and tomato plants promoted increases in leaf chlorophyll content.
DayLeaf Chlorophyll Content
Soy TomatoWith Penergetic® Without Penergetic® With Penergetic® Without Penergetic®
1 32,02 34,44 32,04 32,562 36,10 33,68 31,52 33,163 35,36 35,02 31,40 31,744 35,88 35,64 33,04 33,365 38,88 33,40 41,60 31,427 35,32 27,66 40,68 30,24
ICF
40
35
30
25
00 1 2 3 4 5 6 7
A3 2y = -0,0775x + 0,8525x - 1,5233x + 33,154
2R = 0,74
3 2y = -0,1843x + 2,2633x - 8,3076x + 43,7052R = 0,98
With Penergetic® Without Penergetic®
ICF
3 2y = -0,1152x + 1,9592x - 8,2194x + 40,8722R = 0,93
With Penergetic® Without Penergetic®
45
30
00 7
B
40
35
1 2 3 4 5 6
25
3 2y = -0,0454x + 0,5452x - 2,0835x + 35,1492R = 0,80
Table 1. Means of leaf chlorophyll content determined in soybean and tomato plants with or wi-thout addition of Penergetic® P to the aerial part. Average of five repetitions. (n = 5).
Figure 2. Chlorophyll Falker Index (ICF) observed in soybean (A) and tomato (B) plants after Penergetic® P application.
13

INTRODUCTION
The commercial product Penergetic is a soil and plant bioactivator with potential to promote increased positive effects on plant vitality, with a balance between soil/plant, by optimizing the use of added fertilizers or existing fertility in the soil. It operates by releasing fixed phosphorus un-available to plants and promotes the rebalancing of microorganisms by providing greater energy in the photosynthetic process. Previous studies in coffee farming have been published with positive results in the reduc-tion of the amount of inputs applied to soils of average to high fertility, indicating that Penergetic® promotes better use of already existing fertil-ity and natural resources.
METHODOLOGY
The study was performed from December 2013 to July 2014 (6 months) in the city of Araguari (Mato Grosso state), in the Izidoro Bronzi experimental field, belonging to the Araguari Association of Coffee Growers. Pots were arranged in a greenhouse covered with polypropylene mesh, with 50% of shade and sprinkler irrigation with 70.0 L h -1 flow (MATIELLO et al., 2010). The following treatments evaluated were:
T1 – Virgin savanna soil (VSS/SVC);
T2 - Virgin savanna soil with Penergetic® P and K (VSSP/SVCP);
T3 - Virgin savanna soil with single superphosphate (VSSSS/SVCSS);
T4 - Virgin savanna soil with single superphosphate plus Penergetic® P and K (VSSSSP/SVCSSP);
T5 - Virgin savanna soil with phosphate from Araxá (VSSPA/SVCFA);
T6 - Virgin savanna soil with phosphate from Araxá plus Penergetic® P and K (VSSPAP/SVCFAP);
T7 - Virgin savanna soil with cattle manure (VSSCM/SVCEC);
T8 - Virgin savanna soil with cattle manure plus Penergetic® P and K (VSSCMP/SVCECP);
T9 - Virgin savanna soil with single superphosphate and cattle manure (SVCSSE);
T10 - Virgin savanna soil with single superphosphate and cattle manure plus Penergetic® P and K (VSSSSCMP/SVCSSECP);
T11 - Virgin savanna soil with phosphate from Araxá and cattle manure (VVSPACM/SVCFAEC);
T12 - Virgin savanna soil with phosphate from Araxá and cattle manure plus Penergetic® P and K (VVSPACMP/SVCFAECP);
T13 - Soil from crops cultivated for 10 years (CS/SLC);
T14 - Soil from crops cultivated for 10 years with Penergetic® P and K (CSP/SLCP);
T15 - Soil from crops cultivated for 10 years with cattle manure (CSCM/SLCEC);
T16 - Soil from crops cultivated for 10 years with cattle manure plus Penergetic® P and K (CSCMP/SLCECP).
The evaluated treatments were arranged in a com-pletely randomized fashion, with four repetitions totaling 64 experimental units. Each unit consisted of a a pot containing three plants. Twenty-liter pots (perforated plastic buckets) were filled with sub-strate in accordance to the treatments evaluated. In each pot, three plants of the cultivar Catuaí Ver-melho IAC 144 were planted, each with three pairs of leaves and bare roots to avoid interference from the seedlings’ original substrate. In all pots, 25 g of potassium chloride were applied. The top nitrogen fertilization was carried out with ammonium sulfate and urea in accordance with Procafé MAPA foun-dation recommendations, in effect for the region, which were followed for all other crop and phyto- sanitary procedures as well.
Management of water resources was in accordance with Santinato & Fernandes 2012, maintaining 80% field capacity in the pots. Penergetic K was applied via soil at a dose of 600 g / ha and Penergetic P was applied via leaf, divided into three applications at
Associação dosCafeicultoresde Araguari
Effect of the Bioactivators Penergetic® P e Penergetic® K on the vegetative development of the coffee tree in cultivated and bare soil, in association with phosphate fertilizers and cattle manure.
14
a dose of 200 g / ha in months 1, 3 and 5. Single superphosphate and Araxá phosphate were applied at doses of 300 g pot-1 (1.5t / ha) and 500 g pot-1 (2.5 t / ha). Cattle manure was applied at a dose of 2.0 L per pot, corresponding to 5.0 t / ha.
The treatments were evaluated six months after planting for plant biometry, dry matter, nutritional parameters and soil fertility. The data were submitted to analysis of variance and, when significant, to Tukey’s test, both at a significance level of P < 0.5. The results are shown in the Figures below.
RESULTS
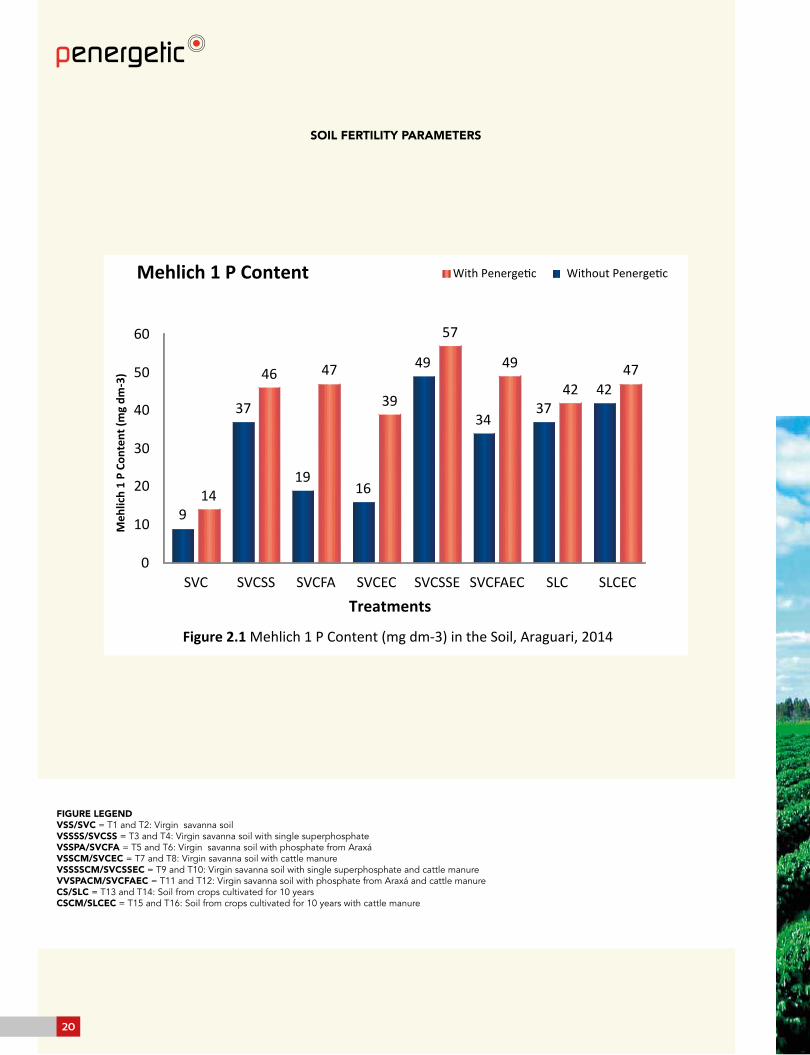
Biometric and dry matter variables presented significant differen-ces in the analysis of variance and Tukey’s test, as can be seen in Figures 1.1 and 1.8. All treatments that utilized Penergetic® presented higher results when compared to the control and other treatments, regardless of the substrate used. The highest levels of biometric parameters were found in treatments 4, 8, 12, 14 and 16. Penergetic® treatments presented mean increases of 18, 17, 10, 21, 8 and 49% for plant height, canopy diameter, stem diameter, root length, branch number and leaf number, respecti-vely. It is important to note that even with the low natural fertility of savanna soils and in the absence of any phosphate fertilization, Penergetic promoted increases in all of the biometric parameters evaluated. The results were higher in the soils that received orga-nic and phosphate fertilization. With regard to soil fertility parame-ters, there was a higher content of Al+3 and m% in the treatments with no Penergetic. This occurred because Penergetic acts in the release of Ca+2 and Mg+2 present in the soil, mainly in the soil fer-tilized with cattle manure. Ca+2 and Mg+2 are released gradually and form compounds with aluminum, thus neutralizing it. This also affects m% and V%, with an increased base saturation in the Penergetic® treatments. Penergetic®. Application brought about an increase in phosphorus content and availability, as shown in Figure 2.1. P is the main nutrient for coffee tree crop develop- ment, mainly due to its role in the formation and expansion of the root system and the increases in biometric parameters were probably due to its increased supply. The greatest difference be-tween treatments with and without Penergetic® was found in the virgin savanna soil fertilized with Araxá phosphate, which presen-ted approximately 28% of citrate soluble P2O5 and low efficiency in the supply of phosphorus when compared to other sources (MALAVOLTA et al., 2006). Penergetic added to Araxá phosphate potentialized its efficiency, allowing greater release of P2O5.
CONCLUSION
It can be concluded that Penergetic acts to release nutrients, such as Ca, Mg and P, from the soil or mineral and organic fertilizers, making greater quantities available to plants. The more efficient utilization of nutrients brought about by the use of Penergetic leads to improved growth in plants.
Associação dosCafeicultoresde Araguari
15

GRAPHICS BIOMETRIC PARAMETERS
36,2
46,845
47,4
45,2
49,9
4748,8
34,5 3536,7
43,8
39,938,9
37,9
42,8
30
40
50
SVC SVCSS SVCFA SVCEC SVCSSE SVCFAEC SLC SLCECTreatments
With Penergetic Without Penergetic
Figure 1.1 Coffee plant height in cm, Araguari, 2014
Plan
t hei
ght (
cm)
Biometric Parameters
0,720,8
0,88 0,89 0,91 0,89 0,880,92
0,56
0,66
0,78 0,790,89
0,83 0,810,86
0,3
0,6
0,9
1,2
SVC SVCSS SVCFA SVCEC SVCSSE SVCFAEC SLC SLCECTreatments
With Penergetic Without Penergetic
Figure 1.2 2 Coffee plant stem diameter in cm, Araguari, 2014
Ste
m d
iam
ete
r (c
m)
Stem diameterFI
GU
RE
LE
GE
ND
V
SS/S
VC
= T
1 an
d T
2: V
irgin
sav
anna
soi
lV
SSSS
/SV
CSS
= T
3 an
d T
4: V
irgin
sav
anna
soi
l with
sin
gle
sup
erp
hosp
hate
V
SSPA
/SV
CFA
= T
5 an
d T
6: V
irgin
sav
anna
soi
l with
pho
spha
te fr
om A
raxá
V
SSC
M/S
VC
EC
= T
7 an
d T
8: V
irgin
sav
anna
soi
l with
cat
tle m
anur
e V
SSSS
CM
/SV
CSS
EC
= T
9 an
d T
10: V
irgin
sav
anna
soi
l with
sin
gle
sup
erp
hosp
hate
and
cat
tle m
anur
e V
VSP
AC
M/S
VC
FAE
C =
T11
and
T12
: Virg
in s
avan
na s
oil w
ith p
hosp
hate
from
Ara
xá a
nd c
attle
man
ure
CS/
SLC
= T
13 a
nd T
14: S
oil f
rom
cro
ps
culti
vate
d fo
r 10
yea
rsC
SCM
/SLC
EC
= T
15 a
nd T
16: S
oil f
rom
cro
ps
culti
vate
d fo
r 10
yea
rs w
ith c
attle
man
ure
16

40,6
48,951 50,9 51,7
48 48,3
51,9
36,4
41,6
38,7
43,8 4441,6 41
45,8
30
40
50
SVC SVCSS SVCFA SVCEC SVCSSE SVCFAEC SLC SLCECTreatments
With Penergetic Without Penergetic
Figure 1.3 Coffee plant canopy diameter in cm, Araguari, 2014
Cano
py d
iam
eter
(cm
)Canopy diameter
34,335,3
37
32,2
35,334 34,2 34
25
2928
32,7
36
28,8 28,3
30,3
20
25
30
35
SVC SVCSS SVCFA SVCEC SVCSSE SVCFAEC SLC SLCEC
Treatments
With Penergetic Without Penergetic
Figure 1.4 Coffee plant main root length in cm, Araguari, 2014
Mai
n ro
ot le
ngth
(cm
)
Main root length
GRAPHICS BIOMETRIC PARAMETERS
17

24,5
49,1
55,953,3 52,8 51,9 49,6 49
17,1
39,2
31,235,3 36,7
32,1 33,6 33,2
0
10
20
30
40
50
60
SVC SVCSS SVCFA SVCEC SVCSSE SVCFAEC SLC SLCECTreatments
With Penergetic Without Penergetic
Figure 1.6 Coffee plant leaf number, Araguari, 2014
Leaf
num
ber i
n co
ffee
plan
ts
Leaf number
9,610,1 10,1
10,7
11,5
10,610,3
10,8
7,2
9,59,9
10,510,1 10
9,710,1
6
7
8
9
10
11
12
SVC SVCSS SVCFA SVCEC SVCSSE SVCFAEC SLC SLCECTreatments
With Penergetic Without Penergetic
Figure 1.5 Coffee plant branch number, Araguari, 2014
Bran
ch n
umbe
r in
coffe
e pl
ants
Branch number
GRAPHICS BIOMETRIC PARAMETERS
18

16,4
20
14,9 14,5
20,7 21,3 20,9 21,8
14,8 1513,2 13,7 14,8
16,414,9
16,7
0
5
10
15
20
25
SVC SVCSS SVCFA SVCEC SVCSSE SVCFAEC SLC SLCEC
Treatments
With Penergetic Without Penergetic
Figure 1.7 Coffee plant base branch length, Araguari, 2014
Base
bra
nch
leng
th in
coff
ee p
lant
s
Base branch length
750
948839 918
1006922 967 913977
14371579 1644
18671784
17041784
0
200
400
600
800
1000
1200
1400
1600
1800
2000
SVC SVCSS SVCFA SVCEC SVCSSE SVCFAEC SLC SLCEC
Treatments
With Penergetic Without Penergetic
Figure 1.8 Coffee plant Total Dry Matter in grams, Araguari, 2014
Tota
l Dry
Matt
er (g
) in
coffe
e pl
ants
Total Dry Matter
GRAPHICS BIOMETRIC PARAMETERS
19
SOIL FERTILITY PARAMETERS
9
37
1916
49
3437
42
14
46 47
39
57
49
4247
0
10
20
30
40
50
60
SVC SVCSS SVCFA SVCEC SVCSSE SVCFAEC SLC SLCECTreatments
With Penergetic Without Penergetic
Figure 2.1 Mehlich 1 P Content (mg dm-3) in the Soil, Araguari, 2014
Meh
lich
1 P
Cont
ent (
mg
dm-3
)
Mehlich 1 P Content
FIGURE LEGEND VSS/SVC = T1 and T2: Virgin savanna soilVSSSS/SVCSS = T3 and T4: Virgin savanna soil with single superphosphate VSSPA/SVCFA = T5 and T6: Virgin savanna soil with phosphate from Araxá VSSCM/SVCEC = T7 and T8: Virgin savanna soil with cattle manure VSSSSCM/SVCSSEC = T9 and T10: Virgin savanna soil with single superphosphate and cattle manure VVSPACM/SVCFAEC = T11 and T12: Virgin savanna soil with phosphate from Araxá and cattle manure CS/SLC = T13 and T14: Soil from crops cultivated for 10 yearsCSCM/SLCEC = T15 and T16: Soil from crops cultivated for 10 years with cattle manure
20
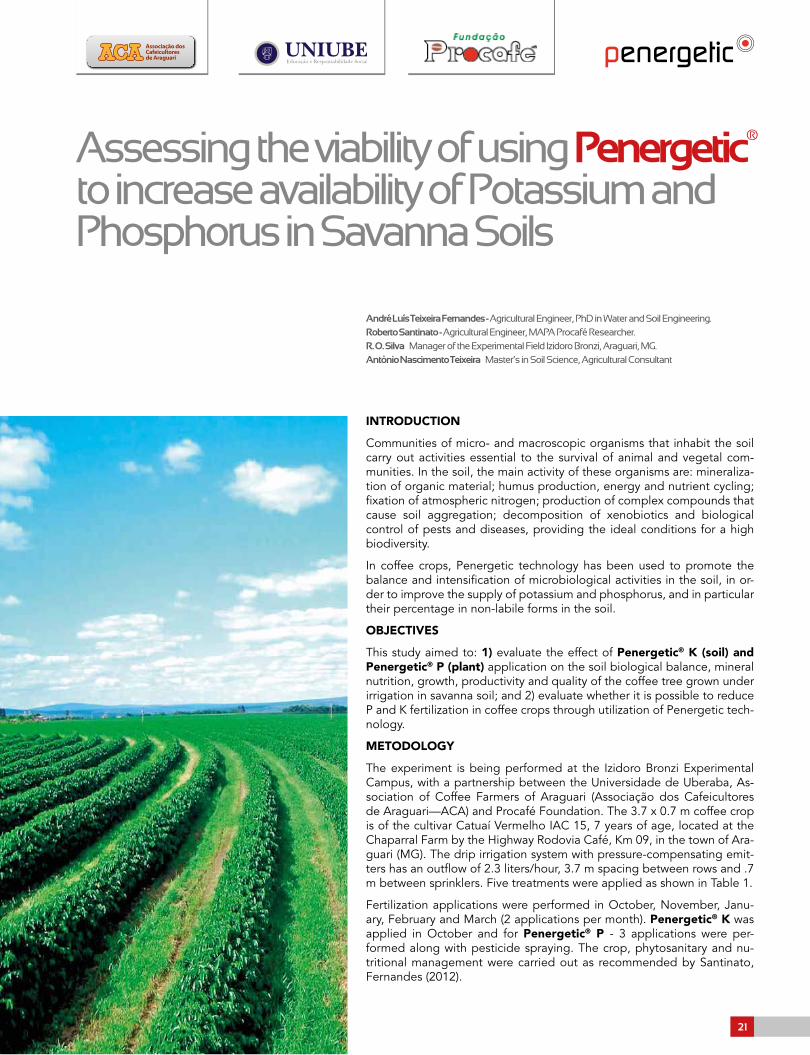
INTRODUCTION
Communities of micro- and macroscopic organisms that inhabit the soil carry out activities essential to the survival of animal and vegetal com-munities. In the soil, the main activity of these organisms are: mineraliza-tion of organic material; humus production, energy and nutrient cycling; fixation of atmospheric nitrogen; production of complex compounds that cause soil aggregation; decomposition of xenobiotics and biological control of pests and diseases, providing the ideal conditions for a high biodiversity.
In coffee crops, Penergetic technology has been used to promote the balance and intensification of microbiological activities in the soil, in or-der to improve the supply of potassium and phosphorus, and in particular their percentage in non-labile forms in the soil.
OBJECTIVES
This study aimed to: 1) evaluate the effect of Penergetic® K (soil) and Penergetic® P (plant) application on the soil biological balance, mineral nutrition, growth, productivity and quality of the coffee tree grown under irrigation in savanna soil; and 2) evaluate whether it is possible to reduce P and K fertilization in coffee crops through utilization of Penergetic tech-nology.
METODOLOGY
The experiment is being performed at the Izidoro Bronzi Experimental Campus, with a partnership between the Universidade de Uberaba, As-sociation of Coffee Farmers of Araguari (Associação dos Cafeicultores de Araguari—ACA) and Procafé Foundation. The 3.7 x 0.7 m coffee crop is of the cultivar Catuaí Vermelho IAC 15, 7 years of age, located at the Chaparral Farm by the Highway Rodovia Café, Km 09, in the town of Ara-guari (MG). The drip irrigation system with pressure-compensating emit-ters has an outflow of 2.3 liters/hour, 3.7 m spacing between rows and .7 m between sprinklers. Five treatments were applied as shown in Table 1.
Fertilization applications were performed in October, November, Janu-ary, February and March (2 applications per month). Penergetic® K was applied in October and for Penergetic® P - 3 applications were per-formed along with pesticide spraying. The crop, phytosanitary and nu-tritional management were carried out as recommended by Santinato, Fernandes (2012).
Associação dosCafeicultoresde Araguari
André Luís Teixeira Fernandes - Agricultural Engineer, PhD in Water and Soil Engineering.Roberto Santinato - Agricultural Engineer, MAPA Procafé Researcher.R. O. Silva – Manager of the Experimental Field Izidoro Bronzi, Araguari, MG.Antônio Nascimento Teixeira – Master’s in Soil Science, Agricultural Consultant
Assessing the viability of using Penergetic® to increase availability of Potassium and Phosphorus in Savanna Soils
21

TREA
TMEN
T
TREATMENT/PRODUCTIVITY (SACS/HA)
20092010
20102011
20112012
20122013
20132014 AVERAGE PR %
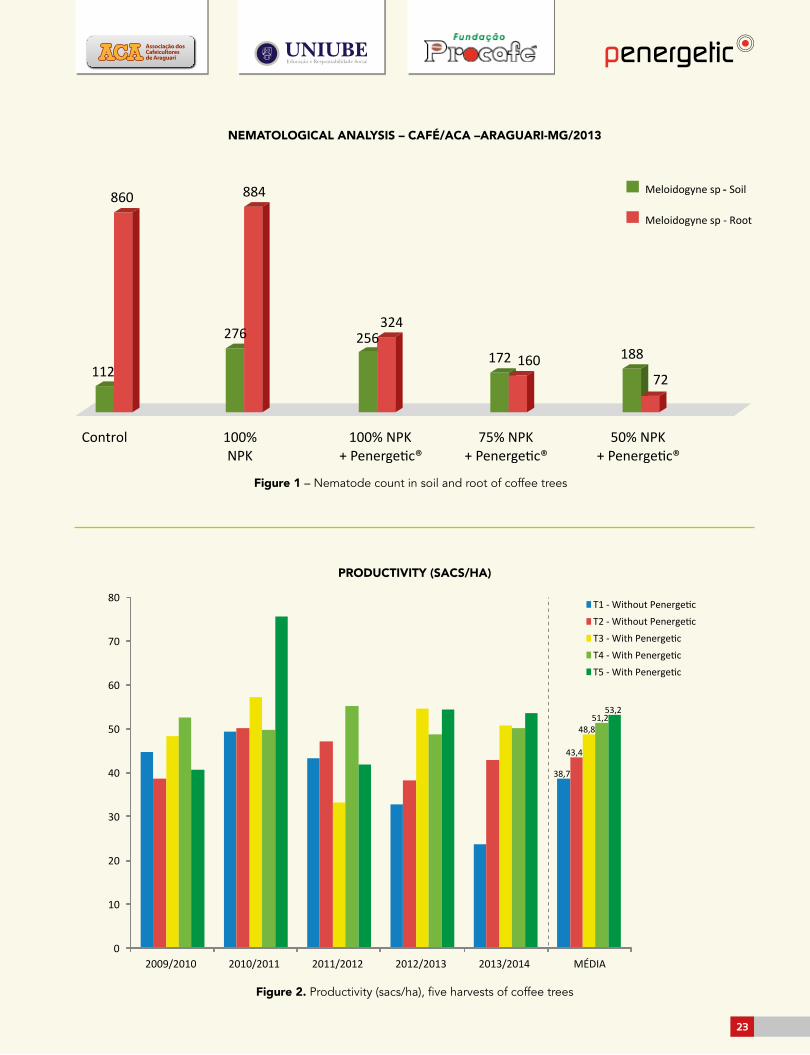
T 1 44,7 49,3 43,2 32,7 23,6 38,7 100%
T 2 38,6 50,1 47,1 38,2 42,8 43,4 + 12
T 3 48,4 57,1 33,2 54,6 50,7 48,8 + 26
T 4 52,5 49,8 55,1 48,7 50,1 51,3 + 32
T 5 40,7 75,6 41,9 54,4 53,5 53,2 + 37
Number of Nematodes
Treatments
T 1 T 2 T 3 T 4 T 5
Meloidoginesp.
Soil
Soil
Soil
112 276 256 172 188
Root
Root
Root
860 884 326 160 72
Pratylenchussp.
- - - - -
- - - 04 -
Rotylenchulusreniformis
- 04 - - 04
- - - - -
Associação dosCafeicultoresde Araguari
CONCLUSION
It can be concluded that after 5 harvests, the utiliza-tion of Penergetic technology is viable for coffee tree nutrition, as it allows a reduction of fertilizer needed and an increase in productivity. The mean increase in productivity over the five harvests, when compared to standard nutritional management, was 10 additio-nal sacs/ha/year, with a 50% reduction in the quantity
of NPK recommended. With regard to biological markers, when compared to the control group and standard fertirrigation group, the Penergetic tre-atments promoted increases of 16 and 36 % in microbial biomass, greater colonization of mycorrhiza in coffee roots, with values of 10.6 and 22%, and greater number of mycorrhizal spores, with 10 and 19/50 mL in the soil, as well as lower incidence of nematodes in coffee plant roots.
Table 3. Nematode count in soil and coffee plant roots. Laboratory of Nematology -
EPAMIG - Analysis 81/2013
Table 2. Harvest of different treatments, in additional sacs per hectare, five harvests, Izidoro Bronzi Experimental Field, Araguari/MG
Table 1. Description of treatments at Izidoro Bronzi Experimental Field
TREATMENT DESCRIPTION
T1 Standard Control (conventional drip, no PK fertilizations, standard nitrogen fertilization)
T2 Standard top-dressing via fertirrigation (100% recommended NPK)
T3 Standard top-dressing via fertirrigation (100% recommended NPK)+ Penergetic® K and P.
T4 Standard top-dressing via fertirrigation (75% recommended NPK) + Penergetic® K and P.
T5 Standard top-dressing via fertirrigation (50% recommended NPK) + Penergetic® K and P.
22
Control 100% NPK
100% NPK + Penerge
75% NPK + Penerge
50% NPK + Penerge
Meloidogyne sp - Soil-
Meloidogyne sp - Root
112
276 256172 188
860 884
324
16072
38,7
43,4
48,851,2
53,2
0
10
20
30
40
50
60
70
80
2009/2010 2010/2011 2011/2012 2012/2013 2013/2014 MÉDIA
T1 - Without Penergetic
T2 - Without Penergetic
T3 - With Penergetic
T4 - With Penergetic
T5 - With Penergetic
NEMATOLOGICAL ANALYSIS – CAFÉ/ACA –ARAGUARI-MG/2013
PRODUCTIVITY (SACS/HA)
Associação dosCafeicultoresde Araguari
Figure 1 – Nematode count in soil and root of coffee trees
Figure 2. Productivity (sacs/ha), five harvests of coffee trees
23

Ricardo Bemfica Steffen - Agricultural Engineer, PhD in Soil Science, Post-doctorate in Soil Science/ UFSM.Zaida Inês Antoniolli – PhD in Mycorrhizal Molecular Aspects, Professor Department of Soil Sciences / UFSM.Rodrigo Josemar Seminoti Jacques – PhD Soil Science, Professor Department of Soil Sciences/ UFSM.Edicarla Trentin - Agricultural Engineer, Master’s Student in Soil Sciences / UFSM.Gerusa Pauli Kist Steffen - Agricultural Engineer, PhD in Soil Science, Researcher for Fepagro Florestas, Santa Maria/ RS.
Effect of Penergetic® P and Penergetic® K in the stimulation of mycorrhization in soybean roots
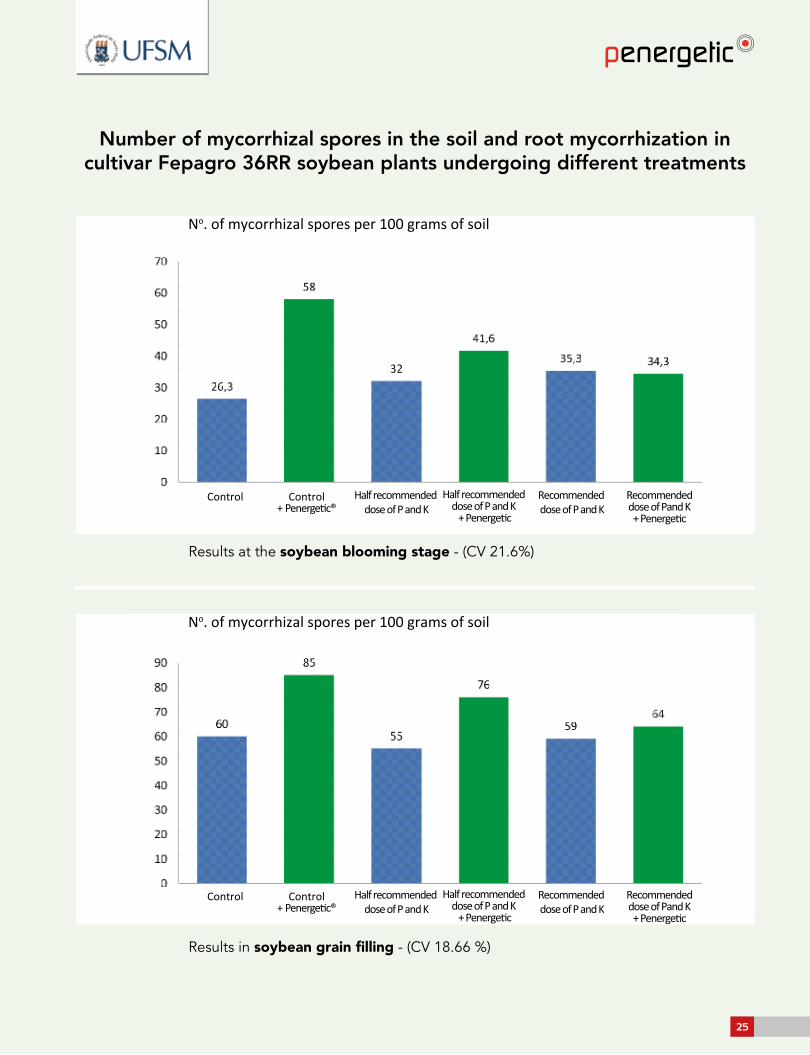
Among the biological relationships established in the soil ecosystem, symbiosis between plants and heterotrophic microorganisms, leading to the establishment of mycorrhiza, is important due to the benefits it pro-vides to the vegetal product. Mycorrhiza are considered to be the greatest ecological and economic expression of symbiosis between soil fungi and superior plant roots, whereby a mutualistic relationship between the plant root and the fungus provides the plant with a greater area for absorption of water and nutrients, such as phosphorus, nitrogen and potassium, and some non-fungistatic micronutrients due to the extension of its hyphae in the soil. The objective of this work was to evaluate the effect of Pener- getic P and K on the mycorrhization rate of soybean plants under green-house conditions. Five-L pots were filled with 4 kg of soil, with the follow-ing treatments: 1) control; 2) control with Penergetic application; 3) P2O5
and K2O applied at half the recommend dose; 4) P2O5 and K2O at half the recommend dose, plus Penergetic; 5) P2O5 and K2O at the recommended dose; 6) P2O5 and K2O at the recommended dose, plus Penergetic. Pen-ergetic K was applied to the soil seven days before the soybean was sown and Penergetic P was applied to the leaf at V3 and R1 phases. During crop blooming, mycorrhiza were identified and counted in the soil of each treatment, using the wet sieving and decanting method (GERDEMANN and NICHOLSON, 1963) and centrifugation in sucrose (JENKINS, 1964). The spores obtained were arranged on slides for microscopic identifica-tion of species based on morphological features (INVAM, 2001). During the grain filling phase, the percentage of mycorrhizal colonization was assessed, using the methodology proposed by Koske and Gemma (1989) for root whitening and evaluated using the intersect method proposed by Giovanetti and Mosse (1980). Greater numbers of spores and diversity of genera were observed in the treatments with Penergetic application, except in the treatment that utilized the recommended dose of P2O5 and K2O, where the P2O5 content may have led to a reduction in the presence of spores in the soil. With regard to mycorrhization, Penergetic promoted increases of 29.41%, 27.86% and 7.84% in root colonization, when com-pared to control treatments, half of the dose and recommended dose of P2O5 and K2O, respectively. The results allow us to conclude that Pener-getic technology promoted increases in the number of mycorrhizal spores in the soil and in the percentage of root mycorrhization in soybean roots.
24
MICORRIZAÇÃO
Control Control+ Penerge c®
Half recommended dose of P and K
Recommended dose of P and K
Recommended dose of Pand K
+ Penergetic
Half recommended dose of P and K
+ Penergetic
Control Control+ Penerge c®
Half recommended dose of P and K
Recommended dose of P and K
Recommended dose of Pand K
+ Penergetic
Half recommended dose of P and K
+ Penergetic
No. of mycorrhizal spores per 100 grams of soil
Results at the soybean blooming stage
No. of mycorrhizal spores per 100 grams of soilControl Control+ Penerge c®
Half recommended dose of P and K
Recommended dose of P and K
Recommended dose of Pand K
+ Penergetic
Half recommended dose of P and K
+ Penergetic
Control Control+ Penerge c®
Half recommended dose of P and K
Recommended dose of P and K
Recommended dose of Pand K
+ Penergetic
Half recommended dose of P and K
+ Penergetic
No. of mycorrhizal spores per 100 grams of soil
Results at the soybean blooming stage
No. of mycorrhizal spores per 100 grams of soil
Control Control+ Penerge c®
Half recommended dose of P and K
Recommended dose of P and K
Recommended dose of Pand K
+ Penergetic
Half recommended dose of P and K
+ Penergetic
Control Control+ Penerge c®
Half recommended dose of P and K
Recommended dose of P and K
Recommended dose of Pand K
+ Penergetic
Half recommended dose of P and K
+ Penergetic
No. of mycorrhizal spores per 100 grams of soil
Results at the soybean blooming stage
No. of mycorrhizal spores per 100 grams of soil
Number of mycorrhizal spores in the soil and root mycorrhization in cultivar Fepagro 36RR soybean plants undergoing different treatments
Results at the soybean blooming stage - (CV 21.6%)
Results in soybean grain filling - (CV 18.66 %)
25

Effect of Penergetic® P and Penergetic® K in the suppression of damage caused by nematodes in soybean crops
Ricardo Bemfica Steffen - Agricultural Engineer, PhD in Soil Science, Post-doctorate in Soil Science/ UFSM.Gerusa Pauli Kist Steffen - Agricultural Engineer, PhD in Soil Science, Researcher for Fepagro Florestas, Santa Maria/ RS.Zaida Inês Antoniolli - PhD in Mycorrhizal Molecular Aspects, Professor Department of Soil Sciences / UFSM.Rodrigo Josemar Seminoti Jacques - PhD Soil Science, Professor Department of Soil Sciences/ UFSM.Edicarla Trentin - Agricultural Engineer, Master’s Student in Soil Sciences / UFSM.Juliane Schmitt - Biologist, Master’s student in Soil Sciences/UFSM. Andressa de Oliveira Silveira - Post-doctorate in Soil Sciences, Department of Sanitary and Environmental Engineering/ UFSM
Their wide geographic distribution, easy dissemination and interaction with other phytopathogenic organisms place nematodes among the main patho-gens responsible for crop damage. Currently, the nematode species Prat-ylenchus brachyurus (Godfrey), which causes root lesions, is one of the main threats to soybean productivity in the Southeast and Central West regions of Brazil. Because of the complexity involved in its control, manage-ment practices for phytonematodes should include stimulation of soil micro-biota to promote competition between organisms in the rhizosphere. Penergetic® P and K, composed of energized bentonite clay, aims to activate soil microbiota, optimizing interactions between edaphic organisms. This work aimed to evaluate the effects of Penergetic P and K application on soybean damage caused by P. brachyurus. In a greenhouse, 5-L plastic pots were sown with soybean cultivar Fepagro 36RR, inoculated with 1750 P. brachyurus eggs and juveniles. Nine treatments were evaluated: 1) control without nematode inoculation; 2) control with nematode inoculation but without Penergetic ap-plication; 3) control with nematode inoculation and Penergetic application; 4) recommended dose of P2O5 and K2O without nematode inoculation; 5) recommended dose of P2O5 and K2O with nematode inoculation but without Penergetic application; 6) recommended dose of P2O5 and K2O with nematode inoculation and with Penergetic® application; 7) half the recommended dose of P2O5 and K2O without nematode inoculation; 8) half the recommended dose of P2O5 and K2O with nematode inoculation but without Penergetic applica-tion; 9) half the recommended dose of P2O5 and K2O with nematode inocula-tion and with Penergetic application. Penergetic K was applied to the soil 7 days before soybean sowing and Penergetic P was applied to the leaf at V3 and R1 phases. During the crop cycle, the use of Penergetic reduced the typical symptoms of damage caused by P. brachyurus in soybean. At the end of the crop cycle, the presence of phytonematode in the control treatment resulted in a 13% reduction in the number of beans and a 15% reduction in the grain weight per plant, regardless of Penergetic application. In the fertilization treatments (recommended dose or half dose), the utilization of Penergetic re-duced the damage caused P. Brachyurus, demonstrating its efficiency as a tool in the management of phytonematodes in soybean crops.
26

Control Control+ Penerge c®
Half recommended dose of P and K
Recommended dose of P and K
Recommended dose of Pand K
+ Penergetic
Half recommended dose of P and K
+ Penergetic
Control Control+ Penerge c®
Half recommended dose of P and K
Recommended dose of P and K
Recommended dose of Pand K
+ Penergetic
Half recommended dose of P and K
+ Penergetic
Number of phytonematodes per gram of root
Number of phytonematodes per gram of root
Control Control+ Penerge c®
Half recommended dose of P and K
Recommended dose of P and K
Recommended dose of Pand K
+ Penergetic
Half recommended dose of P and K
+ Penergetic
Control Control+ Penerge c®
Half recommended dose of P and K
Recommended dose of P and K
Recommended dose of Pand K
+ Penergetic
Half recommended dose of P and K
+ Penergetic
Number of phytonematodes per gram of root
Number of phytonematodes per gram of root
Number of phytonematodes penetrated into soybean plant roots, cultivar Fegagro 36RR, under different treatments
Results for soybean grain-fill with inoculation of Pratylenchus brachyurus
Results for soybean blooming with inoculation of Pratylenchus brachyurus
27
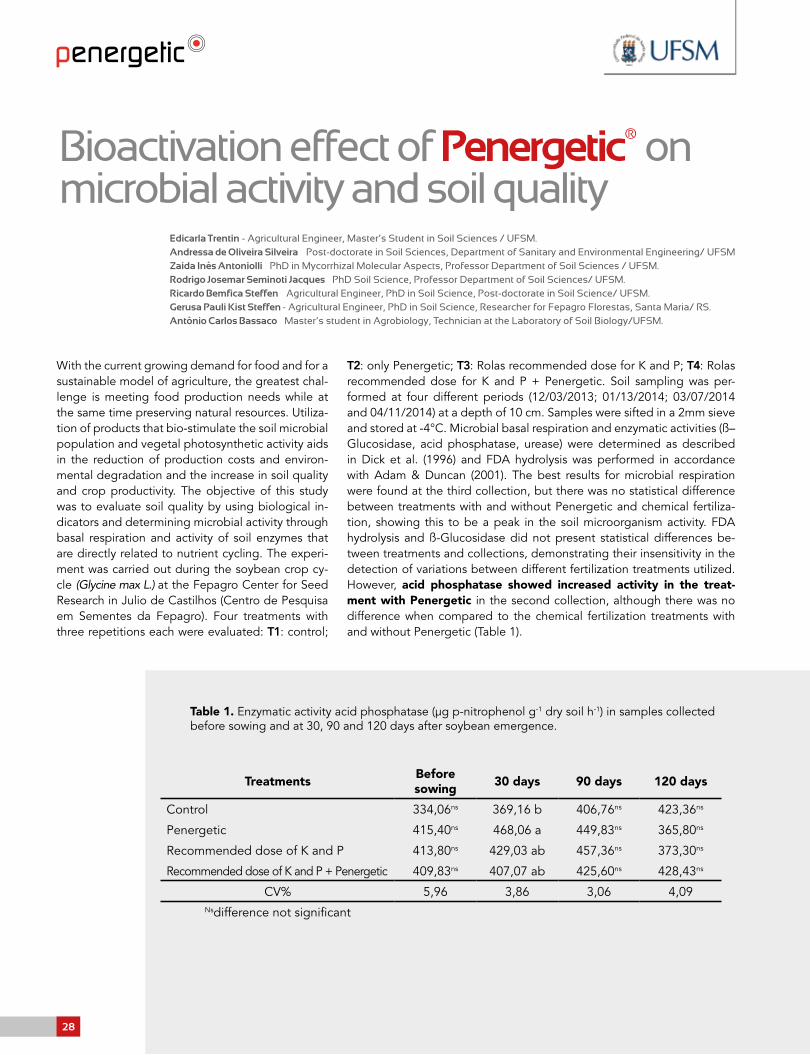
Bioactivation effect of Penergetic® on microbial activity and soil quality
With the current growing demand for food and for a sustainable model of agriculture, the greatest chal-lenge is meeting food production needs while at the same time preserving natural resources. Utiliza-tion of products that bio-stimulate the soil microbial population and vegetal photosynthetic activity aids in the reduction of production costs and environ-mental degradation and the increase in soil quality and crop productivity. The objective of this study was to evaluate soil quality by using biological in-dicators and determining microbial activity through basal respiration and activity of soil enzymes that are directly related to nutrient cycling. The experi-ment was carried out during the soybean crop cy-cle (Glycine max L.) at the Fepagro Center for Seed Research in Julio de Castilhos (Centro de Pesquisa em Sementes da Fepagro). Four treatments with three repetitions each were evaluated: T1: control;
Table 1. Enzymatic activity acid phosphatase (µg p-nitrophenol g-1 dry soil h-1) in samples collected before sowing and at 30, 90 and 120 days after soybean emergence.
T2: only Penergetic; T3: Rolas recommended dose for K and P; T4: Rolas recommended dose for K and P + Penergetic. Soil sampling was per-formed at four different periods (12/03/2013; 01/13/2014; 03/07/2014 and 04/11/2014) at a depth of 10 cm. Samples were sifted in a 2mm sieve and stored at -4°C. Microbial basal respiration and enzymatic activities (ß– Glucosidase, acid phosphatase, urease) were determined as described in Dick et al. (1996) and FDA hydrolysis was performed in accordance with Adam & Duncan (2001). The best results for microbial respiration were found at the third collection, but there was no statistical difference between treatments with and without Penergetic and chemical fertiliza-tion, showing this to be a peak in the soil microorganism activity. FDA hydrolysis and ß-Glucosidase did not present statistical differences be-tween treatments and collections, demonstrating their insensitivity in the detection of variations between different fertilization treatments utilized. However, acid phosphatase showed increased activity in the treat-ment with Penergetic in the second collection, although there was no difference when compared to the chemical fertilization treatments with and without Penergetic (Table 1).
Edicarla Trentin - Agricultural Engineer, Master’s Student in Soil Sciences / UFSM.Andressa de Oliveira Silveira – Post-doctorate in Soil Sciences, Department of Sanitary and Environmental Engineering/ UFSMZaida Inês Antoniolli – PhD in Mycorrhizal Molecular Aspects, Professor Department of Soil Sciences / UFSM.Rodrigo Josemar Seminoti Jacques – PhD Soil Science, Professor Department of Soil Sciences/ UFSM.Ricardo Bemfica Steffen – Agricultural Engineer, PhD in Soil Science, Post-doctorate in Soil Science/ UFSM.Gerusa Pauli Kist Steffen - Agricultural Engineer, PhD in Soil Science, Researcher for Fepagro Florestas, Santa Maria/ RS.Antônio Carlos Bassaco – Master’s student in Agrobiology, Technician at the Laboratory of Soil Biology/UFSM.
Treatments Before sowing 30 days 90 days 120 days
Control 334,06ns 369,16 b 406,76ns 423,36ns
Penergetic 415,40ns 468,06 a 449,83ns 365,80ns
Recommended dose of K and P 413,80ns 429,03 ab 457,36ns 373,30ns
Recommended dose of K and P + Penergetic 409,83ns 407,07 ab 425,60ns 428,43ns
CV% 5,96 3,86 3,06 4,09Nsdifference not significant
28
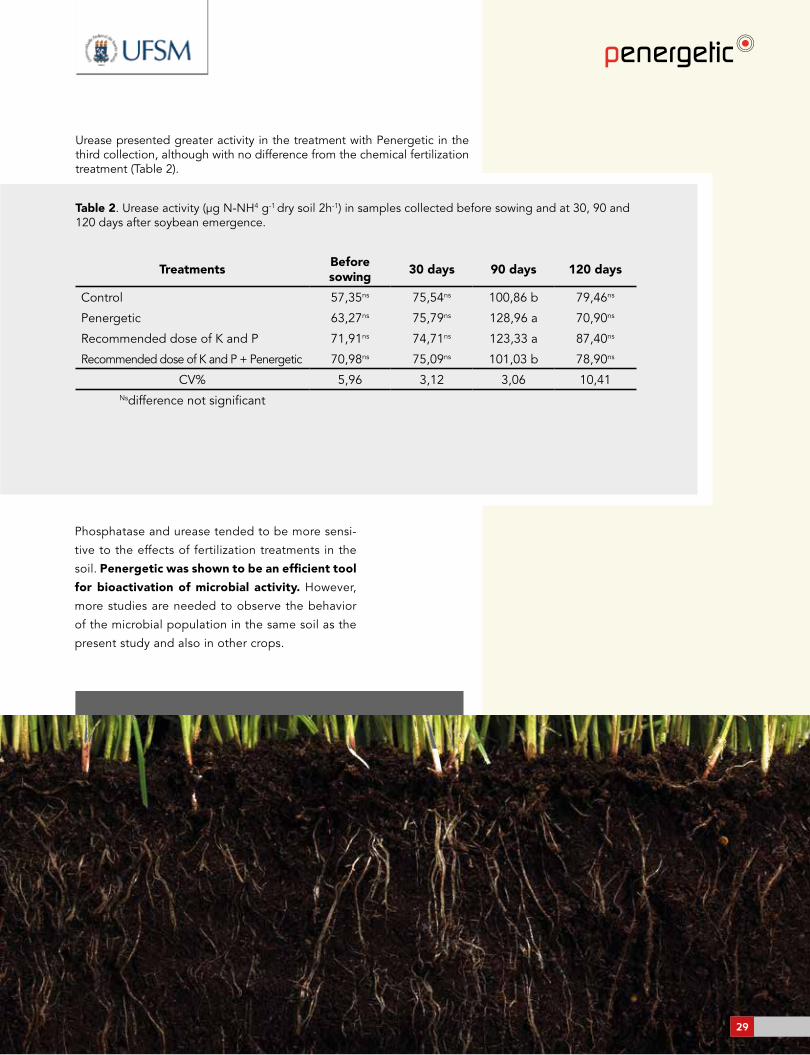
Urease presented greater activity in the treatment with Penergetic in the third collection, although with no difference from the chemical fertilization treatment (Table 2).
Table 2. Urease activity (μg N-NH4 g-1 dry soil 2h-1) in samples collected before sowing and at 30, 90 and 120 days after soybean emergence.
Phosphatase and urease tended to be more sensi-
tive to the effects of fertilization treatments in the
soil. Penergetic was shown to be an efficient tool
for bioactivation of microbial activity. However,
more studies are needed to observe the behavior
of the microbial population in the same soil as the
present study and also in other crops.
Treatments Before sowing 30 days 90 days 120 days
Control 57,35ns 75,54ns 100,86 b 79,46ns
Penergetic 63,27ns 75,79ns 128,96 a 70,90ns
Recommended dose of K and P 71,91ns 74,71ns 123,33 a 87,40ns
Recommended dose of K and P + Penergetic 70,98ns 75,09ns 101,03 b 78,90ns
CV% 5,96 3,12 3,06 10,41Nsdifference not significant
29
Biological activity and
persistence of crop residues deposited on
the surface of soil treated
withPenergetic®
Gerusa Pauli Kist Steffen - Agricultural Engineer, PhD in Soil Science, Researcher for Fepagro Florestas, Santa Maria/ RS.Ricardo Bemfica Steffen – Agricultural Engineer, PhD in Soil Science, Post-doctorate in Soil Science/ UFSM.Edicarla Trentin - Agricultural Engineer, Master’s Student in Soil Sciences / UFSM.Zaida Inês Antoniolli – PhD in Mycorrhizal Molecular Aspects, Professor Department of Soil Sciences / UFSM.Rodrigo Josemar Seminoti Jacques – PhD Soil Science, Professor Department of Soil Sciences/ UFSM.
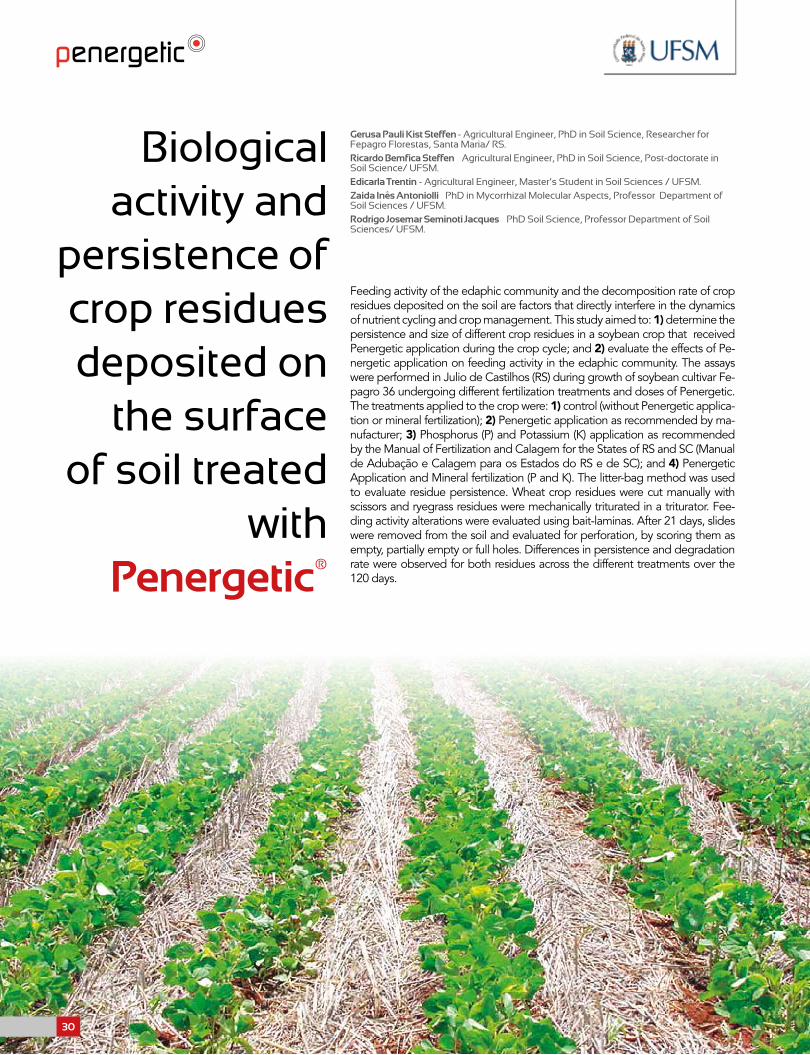
Feeding activity of the edaphic community and the decomposition rate of crop residues deposited on the soil are factors that directly interfere in the dynamics of nutrient cycling and crop management. This study aimed to: 1) determine the persistence and size of different crop residues in a soybean crop that received Penergetic application during the crop cycle; and 2) evaluate the effects of Pe-nergetic application on feeding activity in the edaphic community. The assays were performed in Julio de Castilhos (RS) during growth of soybean cultivar Fe-pagro 36 undergoing different fertilization treatments and doses of Penergetic. The treatments applied to the crop were: 1) control (without Penergetic applica-tion or mineral fertilization); 2) Penergetic application as recommended by ma-nufacturer; 3) Phosphorus (P) and Potassium (K) application as recommended by the Manual of Fertilization and Calagem for the States of RS and SC (Manual de Adubação e Calagem para os Estados do RS e de SC); and 4) Penergetic Application and Mineral fertilization (P and K). The litter-bag method was used to evaluate residue persistence. Wheat crop residues were cut manually with scissors and ryegrass residues were mechanically triturated in a triturator. Fee-ding activity alterations were evaluated using bait-laminas. After 21 days, slides were removed from the soil and evaluated for perforation, by scoring them as empty, partially empty or full holes. Differences in persistence and degradation rate were observed for both residues across the different treatments over the 120 days.
30

A greater degradation rate was observed at 90 days. Residue size influenced residue persistence in the field. Triturated ryegrass straw persisted less, indicating a greater degradation rate. At 120 days, there was a greater degradation rate in the treatment with Penergetic alone (Treatment 2), while the greatest degradation in wheat residues occurred in Treatments 2 and 3. There were signifi-cant differences between treatments with regard to activity of organisms inhabiting the surface soil layer (0-8 cm; Figure 1).
Table 1. Persistence in wheat and ryegrass straw residues at 30, 60, 90 and 120 days after
soybean emergence using litter-bag method. Mean of 5
repetitions.
Figure 1. Feeding activity of organisms in soybean crop soil, evaluated using bait-lamina method at 0-8cm depth. Mean of 30 repetitions.
10,83
70,42
18,75 20,93
65
14,17
32,76
59,91
7,33
15,42
34,58
50
CONTROL PENERGETIC® RECOMMENDED P RECOMMENDED P + PENERGETIC®
% F
EEDI
NG
ACT
IVIT
Y
80
70
60
50
40
30
20
10
0
EMPTY PARTIALLY EMPTY FILLEDFEEDING ACTIVITY
The control plots presented a higher percentage of filled holes (34.58%), indicating less biological activity. The plots treated with Penergetic alone presented the greatest percentage of partially empty holes (70.42%). The treatment with fertilizers (P and K) and Penergetic pre-sented the greatest soil biological activity, shown by the smallest per-centage of filled holes (7.33%) and the greatest percentage of emp-ty holes (32.76%) in comparison to the other treatments. Penergetic in association with soil fertilization contributed to biological and mi-crobiological activity, reducing surface residue persistence.
1Ground straw. 2 Cut straw.
3Means followed by the same letter in the column did not differ by Tukey’s test at 10%
probability.
ns difference not significant.
Treatments
Persistence of Straw
Ryegrass straw
30 60 90 120
Control 95,23 a3 84,27 b 69,34 ab 72,08 a
Penergetic 95.62 a 86,02 a 67,69 b 66,75 c
Recommended dose of K and P 94,43 ab 84,58 b 71,14 a 70,16 b
Rec. dose of K and P + Penergetic 92,91 b 85,61 a 71,00 a 72,17 a
CV% 26.14 24,54 18,21 17,45
Wheat Straw
Control 97.76ns 87,58 a 73,49 a 74,15 a
Penergetic 97,56ns 84,58 b 68,56 b 69,74 b
Recommended dose of P 97,15ns 83,84 b 70,30 b 65,34 c
Rec. dose of K and P + Penergetic 93,88ns 84,56 b 73,89 a 69,96 b
CV% 21,13 16,70 20,05 18,32
31

Effect of Penergetic® P and Penergetic® K on mycorrhization and phytonematode penetration in wheat roots
Zaida Inês Antoniolli – PhD in Mycorrhizal Molecular Aspects, Professor Department of Soil Sciences / UFSM.Rodrigo Josemar Seminoti Jacques – PhD Soil Science, Professor Department of Soil Sciences/ UFSM.Ricardo Bemfica Steffen – Agricultural Engineer, PhD in Soil Science, Post-doctorate in Soil Science/ UFSM.Gerusa Pauli Kist Steffen - Agricultural Engineer, PhD in Soil Science, Researcher for Fepagro Florestas, Santa Maria/ RS.Edicarla Trentin - Agricultural Engineer, Master’s Student in Soil Sciences / UFSM.Juliane Schmitt – Biologist, Master’s student in Soil Sciences/UFSM. Antônio Carlos Bassaco – Master’s student in Agrobiology, Technician at the Laboratory of Soil Biology/UFSM.
INTRODUCTION
Mycorrhiza are mutualistic associations between some fungi in the soil and a wide variety of plants. In addition to greater absorption of nutri-ents, mycorrhizal symbiosis provides plants with other benefits, such as: increased efficiency in nodulation and biological fixation of nitrogen; im-mobilization of heavy metals; optimization of water use; improvements in soil structure; and reduction of biotic and abiotic stresses.
OBJECTIVE
The present work aimed to determine the effect of Penergetic techno-logy, either in association with chemical fertilization or not, on mycorrhiza-tion and phytonematode penetration in wheat plant roots.
METHODOLOGY
The experiment was performed in a greenhouse at the Soil Depart-ment of UFSM, Santa Maria, RS, using dystrophic red latosol collected from the municipality of Catuípe, RS. Four thousand grams of soil were conditioned in 5 L polyethylene pots. Penergetic was applied at doses and timepoints recommended by the manufacturer. Crop fertilization was performed in accordance with the Manual of Fertilization and Lim-ing (Manual de Adubação e Calagem) and cultivar Quartzo wheat was sown on 07/23/2014, by placing 15 seeds into each pot. Ten days after emergence, pots were adjusted to 10 plants per pot. The experiment consisted of 6 treatments with 4 repetitions each, arranged in an entirely randomized fashion:
T1 = Control
T2 = Penergetic.
T3 = Half recommended dose NPK
T4 = Half recommended dose NPK + Penergetic..
T5 = Recommended dose NPK, Manual of Fertilization
T6 = Recommended dose NPK + Penergetic.
The treatments were carried out in the presence and absence of nematodes inoculated in the previ-ous soybean crop. During crop blooming, the roots of 5 plants per repetition were collected to deter-mine the percentage of mycorrhizal colonization and penetration. Means were compared by Tukey’s test at 5% probability using SISVAR.
RESULTS
Mycorrhizal colonization
The mycorrhization percentage in wheat roots was affected by the addition of phosphorus to the soil and by the utilization of Penergetic, although sig-nificant differences were not observed (Table 1).
Table 1. Percentage of mycorrhizal colonization in blooming wheat
plant roots undergoing different treatments and grown in a
greenhouse in the presence or absence of phytonematode
Pratylenchus brachyurus.
Treatments Without With
T1 - Control 80,00 aA 70,00 nsB
T2 - Penerge ® 73,75 abB 86,25 nsA
T3 - Half Recommended NPK 62,50 abA 61,25 nsA
T4 - Half Recommended NPK + Penergetic® 76,25 aA 76,25 nsA
T5 - Recommended NPK 41,25 bB 60,00 nsA
T6 - Recommended NPK + Penergetic® 55,00 abB 66,25 nsA
CV% 12,27 9,52
ns difference not significant
Means followed by the same lowercase letter in the same column and uppercase letter in the rows do not
differ by Tukey’s test at 5% probability.
32

In contrast, the presence of nematodes in the soil did not affect mycor-rhization in roots. Mean mycorrhizal colonization was 78%, 69% and 56%, respectively for the no-phosphorus, half dose and recommended dose treatments. In the comparison of treatment pairs, Penergetic technology increased mean colonization percentage by 13%, except in the Con-trol and Penergetic without nematode groups.
Phytonematode penetration
Penergetic reduced penetration of the nematode Pratylenchus brachy-urus in wheat roots, except in the Recommended dose of NPK treatment (Figure 1). In the comparison between the Control and Penergetic treatments, there was a 54% reduction in nematode penetration and in comparison to the Half Recommended Dose of NPK treatment, there was a 43% reduction due to Penergetic application. Based on these results, it is possible that Penergetic results in greater activity of microorganisms in the rizosphere, which in turn creates a biological barrier, protecting the root from pathogenic attack.
CONCLUSIONS
Penergetic application increased mycorrhizal colonization in wheat plants by 13%, even when the soil was fertilized with the recommended or half of the recommended dose of phosphorus, although the differences were not significant. For most of the treatments, Penergetic reduced the pen-etration of Pratylenchus brachyurus nematodes in wheat roots by 50%. The results indicate that use of Penergetic P and K may stimulate mycorrhiza-tion and reduce phytonematode penetration in wheat roots.
41,67
19,33
44,33
25,25
36,5
41
Control Penerge Half Recommended
NPK
Halfrec. NPK +
Penerge
RecommendedNPK
RecommendedNPK +
Penerge
Figure 1 - Penetration by number of Pratylenchus brachyurus nematodes
33

Effect of Penergetic® P and Penergetic® K on soil microorganism activity in wheat crop
INTRODUCTION
Conventional agriculture is characterized by the adoption of large quanti-ties of chemical inputs, with no concern for their environmental impacts. When used inappropriately and continuously, fertilizers and pesticides impact not only the pedosphere, but the planet’s entire ecosystem. Much effort has been given toward innovations to substitute expensive and degrading inputs with more efficient, less expensive and less aggressive ones. Among these, Penergetic is recommended to increase photosyn-thetic efficiency (Penergetic P) and optimize decomposition of organic matter by activating soil microorganisms (Penergetic K). In order to evalu-ate this input in crops it is important to use microbiological markers, since Penergetic aims to activate microorganisms.
OBJECTIVEThe present study aimed to determine the effect of Penergetic applica-tion, associated to chemical fertilization or not, on soil microorganism ac-tivity in a wheat crop, using the following microbiological markers: basal respiration; C content; N and P in the microbial mass; and enzymatic ac-tivity of ß-glucosidase, acid phosphatase and urease.
METHODOLOGYWheat cultivation, Quartzo cultivar (medium-cycle), was carried out in the period between June 2014 and November 2014 at the Fepagro Center for Seed Research (Centro de Pesquisa em Sementes da Fundação Estad-ual de Pesquisa Agropecuária—FEPAGRO), in Julio de Castilhos/RS, un-der the direction of Dr. Madalena Boeni. Official recommendations from the Technical Information for Wheat and Triticale (Informações Técnicas para Trigo e Triticale) were followed: 170Kg seeds / ha, in a direct sowing system in dystrophic red latosol with 7 x 50 m plot, randomly arranged in three blocks with six treatments:
T1 = Control;
T2 = Penergetic;
T3 = Recommended NPK according to the Fertilization Manual;
T4 = Recommended NPK according to the Fertilization Manual + Penergetic;
T5 = 30Kg P2O5;
T6 = 30Kg P2O5 + Penergetic
The recommended fertilization treatments, select-ed in accordance with the soil fertility analysis and accounting for a mean wheat productivity of 4 t / ha, consisted of 60 Kg / ha P2O5; and 40 Kg / ha
K2O. All treatments received 20 Kg / ha N at sow-ing and 80 Kg / ha N in the topping in the form of urea: 60% of the dose at stages V3 - V4, early tiller-ing (07/18/2014); and 40% at V7, early elongation (08/07/2014). During the experiment, 4 soil samples were collect-ed for microbiological analyses: at approximately 30 (07/22/2014), 60 (08/29/2014), 90 (09/25/2014) and 120 (10/23/2014) days after sowing. All results were submitted to analysis of variance (ANOVA), using Sisvar software, and means were compared using Tukey’s test at 5% probability (P<0.05).
RESULTS
Basal soil respiration
Soil basal respiration is proportional to aerobic mi-croorganism activity in the soil, which for the most part, degrades the organic matter, utilizing O2 as the final electron acceptor, releasing CO2. It is therefore assumed that the greater the production of CO2 in the soil, the greater the microorganism activity. The greatest respiration rate of microorganisms in the soil occurred at 60 days after sowing, at which time Penergetic stimulated soil microbial activity, as can be seen in the comparison be-tween the control and Penergetic treatments. This tendency was observed until the end of the ex-periment, although without significant differences. The greatest C-CO2 production occurred in the Penergetic treatment at 60 days. At 90 and 120 days after sowing, all of the Penergetic treatments presented higher levels of basal respiration than their treatment pairs without Penergetic, however, without significant differences, demonstrating the tendency of this technology to stimulate soil mi-crobial activity.
Zaida Inês Antoniolli – PhD in Mycorrhizal Molecular Aspects, Professor Department of Soil Sciences / UFSM.Rodrigo Josemar Seminoti Jacques – PhD Soil Science, Professor Department of Soil Sciences/ UFSM.Ricardo Bemfica Steffen – Agricultural Engineer, PhD in Soil Science, Post-doctorate in Soil Science/ UFSM.Gerusa Pauli Kist Steffen - Agricultural Engineer, PhD in Soil Science, Researcher for Fepagro Florestas, Santa Maria/ RS.Edicarla Trentin - Agricultural Engineer, Master’s Student in Soil Sciences / UFSM.Juliane Schmitt – Biologist, Master’s student in Soil Sciences/UFSM. Antônio Carlos Bassaco – Master’s student in Agrobiology, Technician at the Laboratory of Soil Biology/UFSM.
34

Table 1. Acid phosphatase activity (μg p-nitrophenol g-1 dry soil h-1) in samples collected at 30, 60, 90 and 120 days after wheat was sown.
Treatments 30 days 60 days 90 days 120 days
Control 595,91 b 618,04 ns 635,02 ns 574,50 ab
Penerge ® 637,76 a 678,23 ns 678,60 ns 643,77 a
Recommended NPK 566,32 c 707,17 ns 593,09 ns 547,89 b
Rec. NPK + Penerge ® 624,75 ab 693,64 ns 666,77 ns 546,48 b
30 kg de P2O5 545,24 c 609,26 ns 616,24 ns 543,48 b
30 kg de P2O5 + Penerge ® 643,39 a 634,79 ns 552,84 ns 631,65 ab
CV % 1,72 8,48 9,30 5,59ns not significant
Soil microbial biomass
Microbial biomass is an indicator of C, N and P stores, which are rapidly cycled in the soil. C content in soil microbial biomass was higher at 60 days as well as in the treatment with 30 kg P2O5 + Penergetic at all collection points. There was a small, though not significant, increase in the C-content in the Penergetic treatment when compared to the Control at 30 and 60 days. The Recommended NPK treatments were not signifi-cantly different at any of the timepoints evaluated. Conversely, the 30kg P2O5 + Penergetic treatment presented increased C content at all time points and significant increases at 30 and 90 days. N content in the microbial biomass showed the same tendency as C, where the 30kg P2O5 + Penergetic treatment resulted in higher N content than the other treatments at all timepoints. Despite the lack of significant differences in most of the comparisons, Penergetic application resulted in in-creased P content in soil microbial biomass.
Soil enzymatic activity
The greater the activity of a-glucosidase, the greater the degradation of soil residues by microorganisms. The highest ß–glucosidase activity was also found at 60 days. Phosphatases catalyze the hydrolysis of or-ganic phosphorus to inorganic phosphorus (PO4
-2), making it available to plants. Quantification of its activity may provide an index of the minera-lization of phosphorus in soils. At 30 days after sowing, all treatments with Penergetic presented significantly increased phosphatase activ-ity in comparison to treatments without Penergetic (Table 1).
35
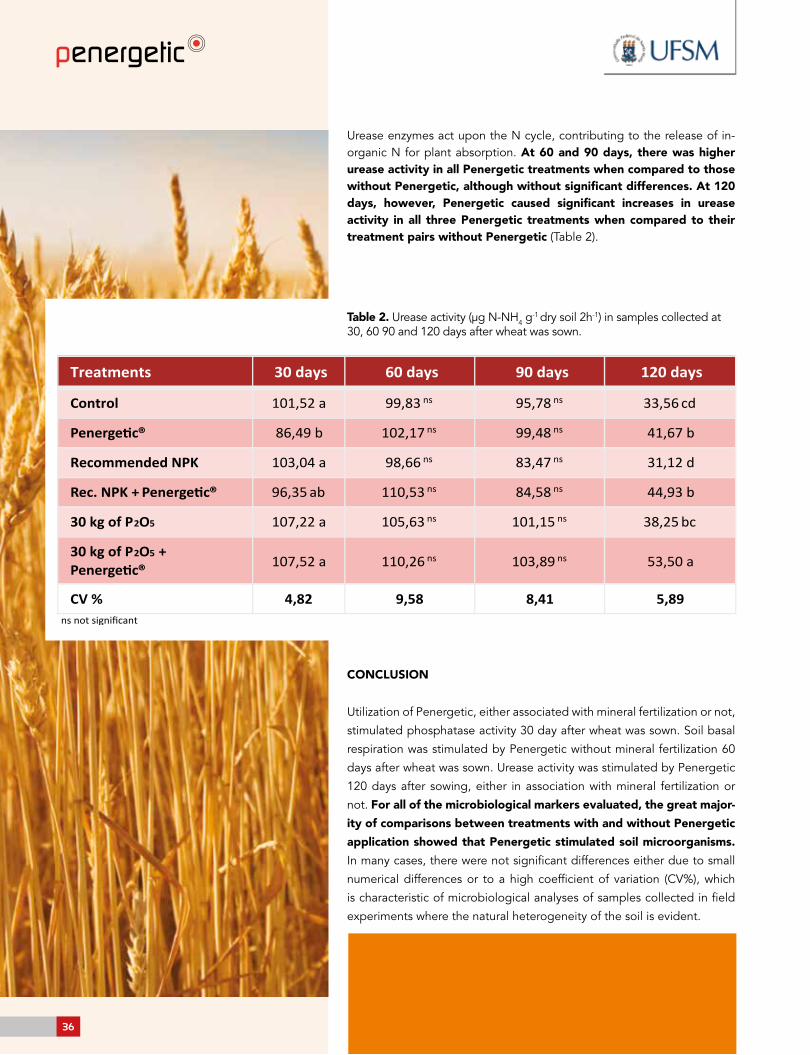
CONCLUSION
Utilization of Penergetic, either associated with mineral fertilization or not,
stimulated phosphatase activity 30 day after wheat was sown. Soil basal
respiration was stimulated by Penergetic without mineral fertilization 60
days after wheat was sown. Urease activity was stimulated by Penergetic
120 days after sowing, either in association with mineral fertilization or
not. For all of the microbiological markers evaluated, the great major-
ity of comparisons between treatments with and without Penergetic
application showed that Penergetic stimulated soil microorganisms.
In many cases, there were not significant differences either due to small
numerical differences or to a high coefficient of variation (CV%), which
is characteristic of microbiological analyses of samples collected in field
experiments where the natural heterogeneity of the soil is evident.
Table 2. Urease activity (μg N-NH4 g-1 dry soil 2h-1) in samples collected at
30, 60 90 and 120 days after wheat was sown.
Treatments 30 days 60 days 90 days 120 days
Control 101,52 a 99,83 ns 95,78 ns 33,56 cd
Penerge ® 86,49 b 102,17 ns 99,48 ns 41,67 b
Recommended NPK 103,04 a 98,66 ns 83,47 ns 31,12 d
Rec. NPK + Penerge ® 96,35 ab 110,53 ns 84,58 ns 44,93 b
30 kg of P2O5 107,22 a 105,63 ns 101,15 ns 38,25 bc
30 kg of P2O5 + Penerge ® 107,52 a 110,26 ns 103,89 ns 53,50 a
CV % 4,82 9,58 8,41 5,89ns not significant
Urease enzymes act upon the N cycle, contributing to the release of in-organic N for plant absorption. At 60 and 90 days, there was higher urease activity in all Penergetic treatments when compared to those without Penergetic, although without significant differences. At 120 days, however, Penergetic caused significant increases in urease activity in all three Penergetic treatments when compared to their treatment pairs without Penergetic (Table 2).
36
Effect of Penergetic® P and Penergetic® K on production components of wheat grown in the presence or absence of nematodes
INTRODUCTIONWheat is the second most produced ce-real in the world, following corn, with a production of 712.7 million tons in the 2013/2014 harvest. The wheat crop has a high potential for expansion, consid-ering the enormous national market for its commercialization. Penergetic is a product recommended for optimiz-ing the decomposition of soil organic matter by activation of microorgan-isms (Penergetic K) and for increasing the photosynthetic efficiency in plants (Penergetic P), making it capable of providing improved wheat productiv-ity due to increased plant nutrition and decreased susceptibility to phytopatho-gens.
OBJECTIVETo evaluate the effect of Penergetic technology on production components of wheat cultivated in the presence and absence of Pratylenchus spp phytone-matodes, which cause root lesions.
METHODOLOGYThe experiment was carried out in a greenhouse at the Soil Department atUFSM, Santa Maria/RS. Distrophic Red Latosol, which was used in an experi-ment with Penergetic in a soybean crop in the 2013/2014 harvest, was collected from Catuípi, RS. Penergetic was applied at doses and timepoints recommended by the manufacturer. Fertilization was performed according to the Manual for Fertilization and Liming (Manual de Adubação e Calagem). Wheat culti-var Quartzo was sown on 07/23/2014, placing 15 seeds per pot and after ten days, adjusting to 10 plants per pot. The experiment consisted of six treatments with four repetitions each, arranged in
an entirely randomized fashion.
T1 = Control
T2 = Penergetic
T3 = Half recommended dose NPK
T4 = Half recommended dose NPK + Penergetic
T5 = Recommended dose NPK, Manual of Fertilization
T6 = Recommended dose NPK + Penergetic
The inoculum consisted of pure popu-lations of Pratylenchus brachyurus ob-tained from species-specific isolation, performed at the Agrolab/GO. Five plants were collected at two different stages, blooming and maturation, to evaluate production components: stem diameter, plant height (from the stem to the ear, without aristas), dry phytomass of the aerial part, number of grains and dry mass of grains. The data were analyzed using analysis of variance and means were compared using Tukey’s test at 5% probability with SISVAR soft-ware.
RESULTSDuring blooming, Penergetic showed a tendency to reduce stem diameter in plants grown in the absence of nema-todes, with a significant difference be-tween the Control and Penergetic treat-ments. In the presence of nematodes, Penergetic led to an increase in stem in all of the comparisons between treat-ments with and without Penergetic, with a significant difference between the Control and Penergetic treatments. The utilization of Penergetic tended to increase aerial part phytomass of wheat
plants in blooming, both in the pres-ence and absence of phytonematodes. It is noteworthy that Penergetic was able to impede the effects of nematodes in the reduction of aerial phytomass, al-though without presenting statistical differences, since significant reductions in phytomass were only observed in the treatments without Penergetic. In all comparison between treatments with and without Penergetic, there was a tendency toward increased number and mass of grains in plants grown with Pen-ergetic application, both in the pres-ence or absence of nematodes. In the grain mass, for all treatments without Penergetic, except for the Half recom-mended NPK treatment, the presence of nematodes significantly reduced the number and mass of grains per plant. However, in the presence of Penergetic there were no significant differences between plants grown with and without nematodes, demonstrating the protec-tive effect of Penergetic in the reduction of harmful effects of phytonematodes in wheat plants.
CONCLUSIONSUtilization of Penergetic technology, in association with mineral fertilization or not, tended to increase plant height and phytomass in wheat plants during blooming and in the number and mass of grains, both in the presence and ab-sence of phytonematodes, however without significant differences. Phyto-nematodes caused significant reduc-tions in height, phytomass, number and mass of grains only in wheat plants grown without Penergetic application; Penergetic minimized the harmful ef-fects of Pratylenchus nematodes on production components of wheat.
Zaida Inês Antoniolli - PhD in Mycorrhizal Molecular Aspects, Professor Department of Soil Sciences / UFSM.Rodrigo Josemar Seminoti Jacques - PhD Soil Science, Professor Department of Soil Sciences/ UFSM.Ricardo Bemfica Steffen - Agricultural Engineer, PhD in Soil Science, Post-doctorate in Soil Science/ UFSM.Gerusa Pauli Kist Steffen - Agricultural Engineer, PhD in Soil Science, Researcher for Fepagro Florestas, Santa Maria/ RS.Edicarla Trentin - Agricultural Engineer, Master’s Student in Soil Sciences / UFSM.Juliane Schmitt - Biologist, Master’s student in Soil Sciences/UFSM. Antônio Carlos Bassaco - Master’s student in Agrobiology, Technician at the Laboratory of Soil Biology/UFSM.
37
Effect of Penergetic® Technology on decomposition rate in ryegrass (Lolium multiflorum Lam.) crop residues
INTRODUCTION
Organisms and microorganisms in the soil are the main agents of biochemical activity in agricul-
tural systems and are directly involved in all biological processes that provide cycling and make
nutrients from organic residues available to plants (González et al., 2001). Therefore, practices
that provide biostimulation of these agents benefit nutrient cycling and crop productivity. This
work aimed to determine the effect of using Penergetic technology, associated to different
levels of fertilization, on the decomposition rate of ryegrass crop residues in a wheat crop.
MATERIAL AND METHODS
The decomposition rate of ryegrass crop residues was determined during the growth a Quartzo
cultivar wheat crop using the decomposition bag (Thomas & Asakawa, 1993) or litter bag meth-
odology (Rezende et al., 1999; Amado et al., 2002). The assay was performed at Fepagro Se-
mentes in Júlio de Castilhos (RS). Six field treatments and one natural control treatment were
evaluated: T1 = control without fertilizer; T2 = control + Penergetic; T3 = phosphorus and po-
tassium as recommended by CQFS-RS/SC; T4 = phosphorus and potassium as recommended
by CQFS-RS/SC + Penergetic.; T5 = 30 Kg P2O5; T6 = 30 Kg P2O5 + Penergetic.; T7 = natural
forest; 250g / ha Penergetic K and P were applied to the wheat. The litter bags were made
of voile fabric (20x10 cm) and filled with approximately 25g of ryegrass crop residues. These
residues were collected from the field, dried at room temperature and triturated in a silage mill
and then distributed randomly on the soil of the experimental plots. During the period of 110
days, five litter bags were removed from each treatment and three bags were removed from
the natural forest at timepoints of 0, 30, 60, 90 and 110 days. To evaluate mass loss, the mate-
rial was externally washed to remove particles of soil and impurities and then dried in an oven
with forced aeration at 65º C until reaching constant weight. The bags were then weighed on
an analytical balance to determine progressive mass loss of the residues.
RESULTS AND DISCUSSION
Persistence of the ryegrass crop residues decreased over the course of the 110-day evaluation
period, with the highest decomposition rate occurring at 60 days, at which time there was a
greater mass loss of residues. Higher rates of persistence of straw in the field indicate a lower
decomposition rate (Table 1).
Gerusa Pauli Kist Steffen - Agricultural Engineer, PhD in Soil Science, Researcher for Fepagro Florestas, Santa Maria/ RS.Ricardo Bemfica Steffen – Agricultural Engineer, PhD in Soil Science, Post-doctorate in Soil Science/ UFSM.Joseila Maldaner - Biologist, PhD in Vegetal Physiology.Rosana Matos de Morais – Biologist, PhD in Plant Science - UFSMCléber Witt Saldanha – Forest Engineer, PhD in Physiology
38
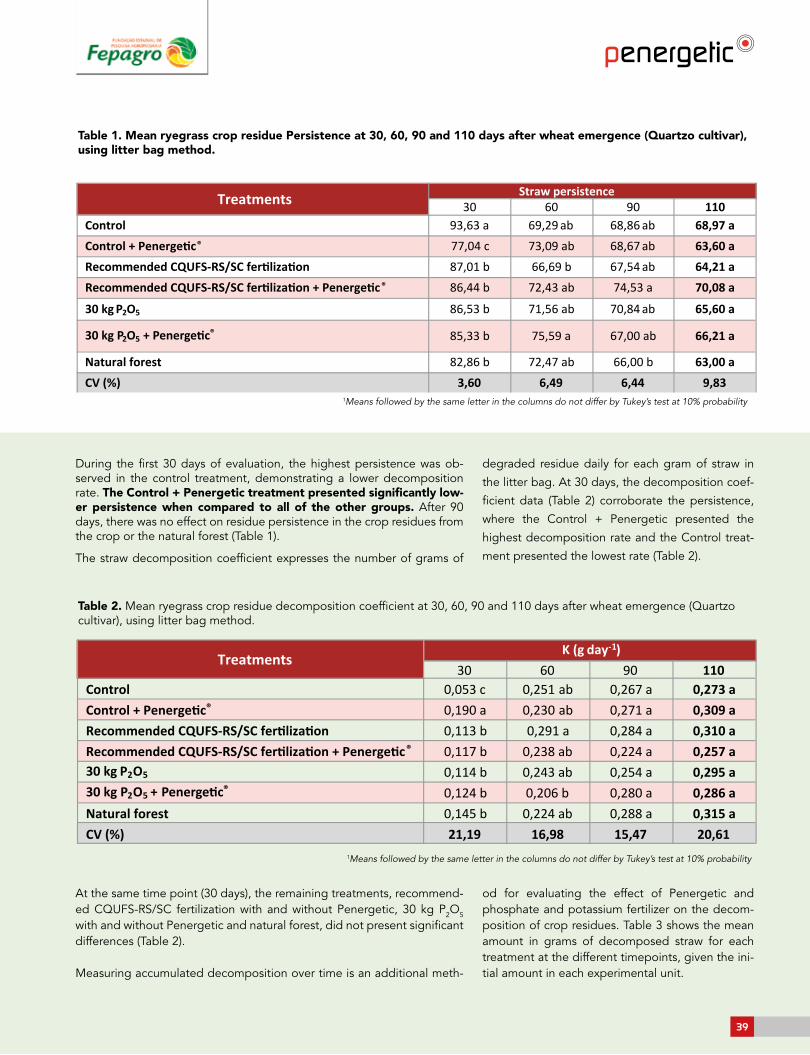
During the first 30 days of evaluation, the highest persistence was ob-served in the control treatment, demonstrating a lower decomposition rate. The Control + Penergetic treatment presented significantly low-er persistence when compared to all of the other groups. After 90 days, there was no effect on residue persistence in the crop residues from the crop or the natural forest (Table 1).
The straw decomposition coefficient expresses the number of grams of
degraded residue daily for each gram of straw in
the litter bag. At 30 days, the decomposition coef-
ficient data (Table 2) corroborate the persistence,
where the Control + Penergetic presented the
highest decomposition rate and the Control treat-
ment presented the lowest rate (Table 2).
Table 1. Mean ryegrass crop residue Persistence at 30, 60, 90 and 110 days after wheat emergence (Quartzo cultivar), using litter bag method.
Table 2. Mean ryegrass crop residue decomposition coefficient at 30, 60, 90 and 110 days after wheat emergence (Quartzo cultivar), using litter bag method.
Treatments Straw persistence30 60 90 110
Control 93,63 a 69,29 ab 68,86 ab 68,97 aControl + Penergetic 77,04 c 73,09 ab 68,67 ab 63,60 aRecommended CQUFS-RS/SC fertilization 87,01 b 66,69 b 67,54 ab 64,21 aRecommended CQUFS-RS/SC fertilization + Penergetic 86,44 b 72,43 ab 74,53 a 70,08 a
30 kg P2O5 86,53 b 71,56 ab 70,84 ab 65,60 a
30 kg P2O5 + Penerge ®
®
®
85,33 b 75,59 a 67,00 ab 66,21 a
Natural forest 82,86 b 72,47 ab 66,00 b 63,00 aCV (%) 3,60 6,49 6,44 9,83
TreatmentsK (g day-1)
30 60 90 110Control 0,053 c 0,251 ab 0,267 a 0,273 aControl + Penergetic® 0,190 a 0,230 ab 0,271 a 0,309 aRecommended CQUFS-RS/SC fertilization 0,113 b 0,291 a 0,284 a 0,310 aRecommended CQUFS-RS/SC fertilization + Penergetic® 0,117 b 0,238 ab 0,224 a 0,257 a30 kg P2O5 0,114 b 0,243 ab 0,254 a 0,295 a30 kg P2O5 + Penerge ® 0,124 b 0,206 b 0,280 a 0,286 aNatural forest 0,145 b 0,224 ab 0,288 a 0,315 aCV (%) 21,19 16,98 15,47 20,61
1Means followed by the same letter in the columns do not differ by Tukey’s test at 10% probability
1Means followed by the same letter in the columns do not differ by Tukey’s test at 10% probability
At the same time point (30 days), the remaining treatments, recommend-ed CQUFS-RS/SC fertilization with and without Penergetic, 30 kg P2O5 with and without Penergetic and natural forest, did not present significant differences (Table 2).
Measuring accumulated decomposition over time is an additional meth-
od for evaluating the effect of Penergetic and phosphate and potassium fertilizer on the decom-position of crop residues. Table 3 shows the mean amount in grams of decomposed straw for each treatment at the different timepoints, given the ini-tial amount in each experimental unit.
39

At 30 days, the application of Penergetic to the soil increased the decom-position rate in surface ryegrass crop residues. Although it was numeri-cally higher, the mean accumulated decomposition rate of the Control + Penergetic treatment was not significantly different from that found in the natural forest, which was utilized as a natural control treatment to gauge the biological and edaphoclimatic conditions in an environment with little anthropic interference, where we expected to find the highest residue de-composition rates (Table 3).
The Control treatment presented the lowest accumulated decomposition at 30 days, showing lower biological activity of organisms and microorga-nisms involved in vegetal decomposition on the soil surface. Conversely, the treatments with mineral fertilization, either with or without Penergetic, presented intermediate mean accumulated decomposition: significantly lower than the Control + Penergetic and significantly higher than the Con-trol treatment (Table 3).
These results suggest that there was an isolated effect of Penergetic on surface biological activity of the agricultural system, directly affecting nu-trient cycling, which may positively impact soil quality. Although it was less significant, it was also possible to observe a positive effect of the addition of mineral fertilizers (phosphorus and potassium), both in isolation and in combination with Penergetic, on the activity of biota and microbiota in-volved in the decomposition of surface residues, when compared to the Control treatment (Table 3).
As was observed for the decomposition coefficient, there were no signi-ficant differences between the treatments in relation to accumulated de-composition of ryegrass residues at 90 days (Table 3).
CONCLUSION
Application of Penergetic to a wheat crop raised the decomposition rate of ryegrass crop residues on the soil, decreasing the persistence of surface straw in the first 30 days.
Table 3. Mean accumulated ryegrass crop residue decomposition at 30, 60, 90 and 110 days after wheat emergence (Quartzo cultivar), using litter bag method.
Decomposition (g)30 60 90 110
1,59 c 7,52 ab 8,01 a 8,20 a5,69 a 6,90 ab 8,13 a 9,27 a3,38 b 8,72 a 8,51 a 9,29 a3,50 b 7,15 ab 6,71 a 7,71 a3,42 b 7,30 ab 7,63 a 8,84 a3,73 b 6,18 b 8,40 a 8,58 a
4,34 ab 6,73 ab 8,63 a 9,46 a21,13 17,37 16,58 20,54
Treatments
ControlControl + PenergeticRec. CQUFS-RS/SC fertilizationRec. CQUFS-RS/SC fertilization + Penergetic30 kg P2O5
2 530 kg P O + Penerge ®
Natural forestCV (%)
1Means followed by the same letter in the columns do not differ by Tukey’s test at 10% probability.
40

Gerusa Pauli Kist Steffen - Agricultural Engineer, PhD in Soil Science, Researcher for Fepagro Florestas, Santa Maria/ RS.Ricardo Bemfica Steffen – Agricultural Engineer, PhD in Soil Science, Post-doctora-te in Soil Science/ UFSM.Joseila Maldaner - Biologist, PhD in Vegetal Physiology.Rosana Matos de Morais – Biologist, PhD in Plant Science - UFSMCléber Witt Saldanha – Forest Engineer, PhD in PhysiologyBreno Bevilaqua Heinz - Forest Engineer, Master’s student in Agrobiology.
ABSTRACT
Soil biological activity is a key to maintaining production sustainability in agriculture. This work aimed to evaluate the effects of mineral fertilization (phosphatase and potassium) and Penergetic technology on soil bioactivation in crops by evaluating food consumption of fauna and edaphic microorganisms. The assays were carried out in soybean (summer) and wheat (winter) crops treated with different methods of fertilization, with or without addition of Pener-getic. The 4 treatments evaluated were: T1 = Control without fertilizers; T2 = Control + Pen-ergetic; T3 = Phosphorus and Potassium fertil-ization; T4 = Phosphorus and Potassium fertil-ization + Penergetic. Penergetic K (Kompost) and P (Pflanzen) were applied to both crops at 250g / ha. The bait-lamina method was used to evaluate feeding consumption in experimen-tal plots. The laminas remained in the soil for 21 days and were evaluated for percentage of empty, partially empty and full holes at two soil layers:0-8 and 8-16 cm deep, receiving scores for feeding activity pattern. Principal compo-nents analysis (PCA) was carried out as well as scores for feeding activity, crop productivity and basal respiration. Penergetic in combina-tion with phosphate and potassium fertiliza-tion promoted a significant increase in feeding activity of fauna and microorganisms present in the 0-8 cm deep layer of soil in a soybean crop.
Key words: Soil biology, bioactivation, feeding consumption.
Feeding activity of soil microorganisms and fauna in crops using different management practices
41
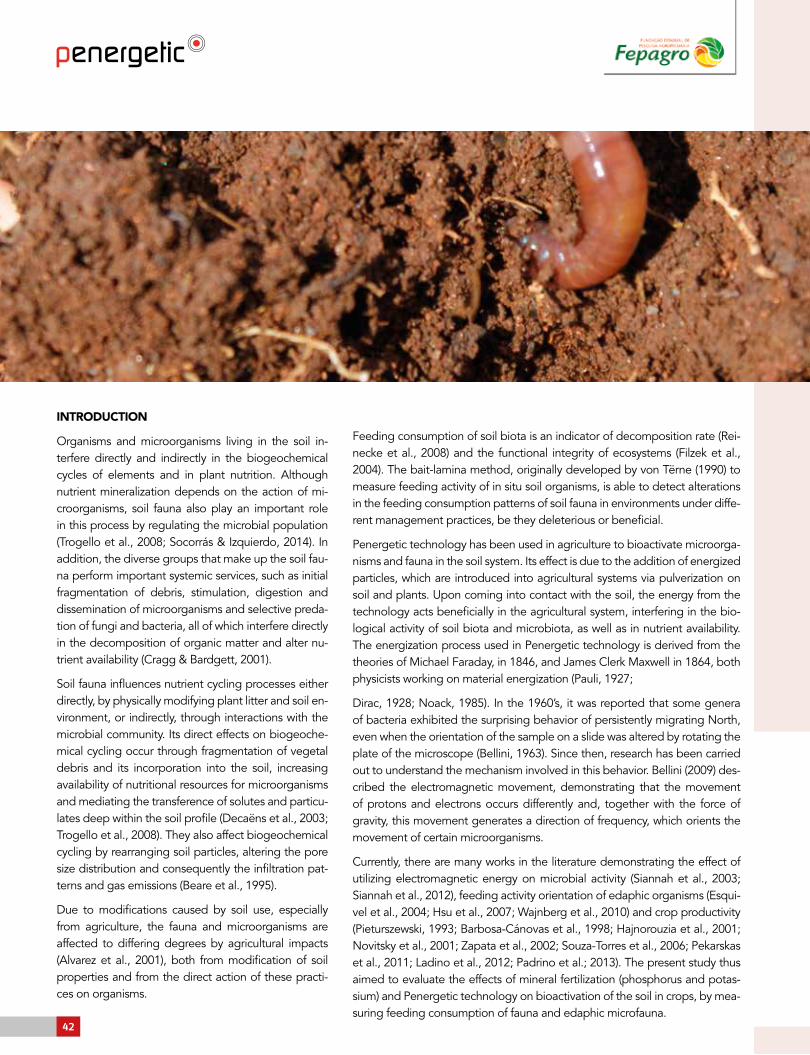
INTRODUCTION
Organisms and microorganisms living in the soil in-terfere directly and indirectly in the biogeochemical cycles of elements and in plant nutrition. Although nutrient mineralization depends on the action of mi-croorganisms, soil fauna also play an important role in this process by regulating the microbial population (Trogello et al., 2008; Socorrás & Izquierdo, 2014). In addition, the diverse groups that make up the soil fau-na perform important systemic services, such as initial fragmentation of debris, stimulation, digestion and dissemination of microorganisms and selective preda-tion of fungi and bacteria, all of which interfere directly in the decomposition of organic matter and alter nu-trient availability (Cragg & Bardgett, 2001).
Soil fauna influences nutrient cycling processes either directly, by physically modifying plant litter and soil en-vironment, or indirectly, through interactions with the microbial community. Its direct effects on biogeoche-mical cycling occur through fragmentation of vegetal debris and its incorporation into the soil, increasing availability of nutritional resources for microorganisms and mediating the transference of solutes and particu-lates deep within the soil profile (Decaëns et al., 2003; Trogello et al., 2008). They also affect biogeochemical cycling by rearranging soil particles, altering the pore size distribution and consequently the infiltration pat-terns and gas emissions (Beare et al., 1995).
Due to modifications caused by soil use, especially from agriculture, the fauna and microorganisms are affected to differing degrees by agricultural impacts (Alvarez et al., 2001), both from modification of soil properties and from the direct action of these practi-ces on organisms.
Feeding consumption of soil biota is an indicator of decomposition rate (Rei-necke et al., 2008) and the functional integrity of ecosystems (Filzek et al., 2004). The bait-lamina method, originally developed by von Tërne (1990) to measure feeding activity of in situ soil organisms, is able to detect alterations in the feeding consumption patterns of soil fauna in environments under diffe-rent management practices, be they deleterious or beneficial.
Penergetic technology has been used in agriculture to bioactivate microorga-nisms and fauna in the soil system. Its effect is due to the addition of energized particles, which are introduced into agricultural systems via pulverization on soil and plants. Upon coming into contact with the soil, the energy from the technology acts beneficially in the agricultural system, interfering in the bio-logical activity of soil biota and microbiota, as well as in nutrient availability. The energization process used in Penergetic technology is derived from the theories of Michael Faraday, in 1846, and James Clerk Maxwell in 1864, both physicists working on material energization (Pauli, 1927;
Dirac, 1928; Noack, 1985). In the 1960’s, it was reported that some genera of bacteria exhibited the surprising behavior of persistently migrating North, even when the orientation of the sample on a slide was altered by rotating the plate of the microscope (Bellini, 1963). Since then, research has been carried out to understand the mechanism involved in this behavior. Bellini (2009) des-cribed the electromagnetic movement, demonstrating that the movement of protons and electrons occurs differently and, together with the force of gravity, this movement generates a direction of frequency, which orients the movement of certain microorganisms.
Currently, there are many works in the literature demonstrating the effect of utilizing electromagnetic energy on microbial activity (Siannah et al., 2003; Siannah et al., 2012), feeding activity orientation of edaphic organisms (Esqui-vel et al., 2004; Hsu et al., 2007; Wajnberg et al., 2010) and crop productivity (Pieturszewski, 1993; Barbosa-Cánovas et al., 1998; Hajnorouzia et al., 2001; Novitsky et al., 2001; Zapata et al., 2002; Souza-Torres et al., 2006; Pekarskas et al., 2011; Ladino et al., 2012; Padrino et al.; 2013). The present study thus aimed to evaluate the effects of mineral fertilization (phosphorus and potas-sium) and Penergetic technology on bioactivation of the soil in crops, by mea-suring feeding consumption of fauna and edaphic microfauna.
42
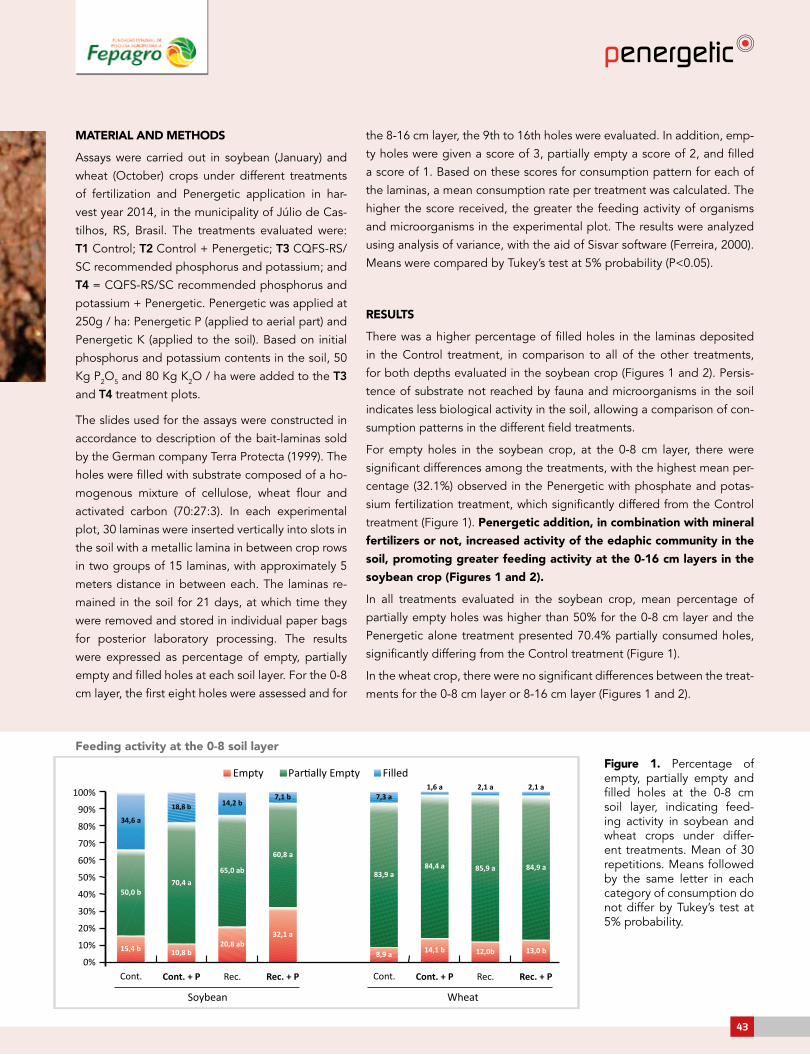
MATERIAL AND METHODS
Assays were carried out in soybean (January) and
wheat (October) crops under different treatments
of fertilization and Penergetic application in har-
vest year 2014, in the municipality of Júlio de Cas-
tilhos, RS, Brasil. The treatments evaluated were:
T1 Control; T2 Control + Penergetic; T3 CQFS-RS/
SC recommended phosphorus and potassium; and
T4 = CQFS-RS/SC recommended phosphorus and
potassium + Penergetic. Penergetic was applied at
250g / ha: Penergetic P (applied to aerial part) and
Penergetic K (applied to the soil). Based on initial
phosphorus and potassium contents in the soil, 50
Kg P2O5 and 80 Kg K2O / ha were added to the T3
and T4 treatment plots.
The slides used for the assays were constructed in
accordance to description of the bait-laminas sold
by the German company Terra Protecta (1999). The
holes were filled with substrate composed of a ho-
mogenous mixture of cellulose, wheat flour and
activated carbon (70:27:3). In each experimental
plot, 30 laminas were inserted vertically into slots in
the soil with a metallic lamina in between crop rows
in two groups of 15 laminas, with approximately 5
meters distance in between each. The laminas re-
mained in the soil for 21 days, at which time they
were removed and stored in individual paper bags
for posterior laboratory processing. The results
were expressed as percentage of empty, partially
empty and filled holes at each soil layer. For the 0-8
cm layer, the first eight holes were assessed and for
the 8-16 cm layer, the 9th to 16th holes were evaluated. In addition, emp-
ty holes were given a score of 3, partially empty a score of 2, and filled
a score of 1. Based on these scores for consumption pattern for each of
the laminas, a mean consumption rate per treatment was calculated. The
higher the score received, the greater the feeding activity of organisms
and microorganisms in the experimental plot. The results were analyzed
using analysis of variance, with the aid of Sisvar software (Ferreira, 2000).
Means were compared by Tukey’s test at 5% probability (P<0.05).
RESULTS
There was a higher percentage of filled holes in the laminas deposited
in the Control treatment, in comparison to all of the other treatments,
for both depths evaluated in the soybean crop (Figures 1 and 2). Persis-
tence of substrate not reached by fauna and microorganisms in the soil
indicates less biological activity in the soil, allowing a comparison of con-
sumption patterns in the different field treatments.
For empty holes in the soybean crop, at the 0-8 cm layer, there were
significant differences among the treatments, with the highest mean per-
centage (32.1%) observed in the Penergetic with phosphate and potas-
sium fertilization treatment, which significantly differed from the Control
treatment (Figure 1). Penergetic addition, in combination with mineral
fertilizers or not, increased activity of the edaphic community in the
soil, promoting greater feeding activity at the 0-16 cm layers in the
soybean crop (Figures 1 and 2).
In all treatments evaluated in the soybean crop, mean percentage of
partially empty holes was higher than 50% for the 0-8 cm layer and the
Penergetic alone treatment presented 70.4% partially consumed holes,
significantly differing from the Control treatment (Figure 1).
In the wheat crop, there were no significant differences between the treat-
ments for the 0-8 cm layer or 8-16 cm layer (Figures 1 and 2).
Figure 1. Percentage of empty, partially empty and filled holes at the 0-8 cm soil layer, indicating feed-ing activity in soybean and wheat crops under differ-ent treatments. Mean of 30 repetitions. Means followed by the same letter in each category of consumption do not differ by Tukey’s test at 5% probability.
Feeding activity at the 0-8 soil layer
34,6 a
50,0 b
15,4 b 10,8 b
70,4 a
18,8 b 14,2 b
65,0 ab
20,8 ab32,1 a
60,8 a
7,1 b 7,3 a
83,9 a
8,9 a 14,1 b 12,0b
85,9 a
2,1 a 2,1 a
84,9 a
13,0 b
84,4 a
1,6 a100%
90%
80%
70%
60%
50%
40%
30%
20%
10%
0%Cont. Cont. + P
Soybean Wheat
Rec. Rec. + P Cont. Cont. + P Rec. Rec. + P
Empty Partially Empty Filled
43
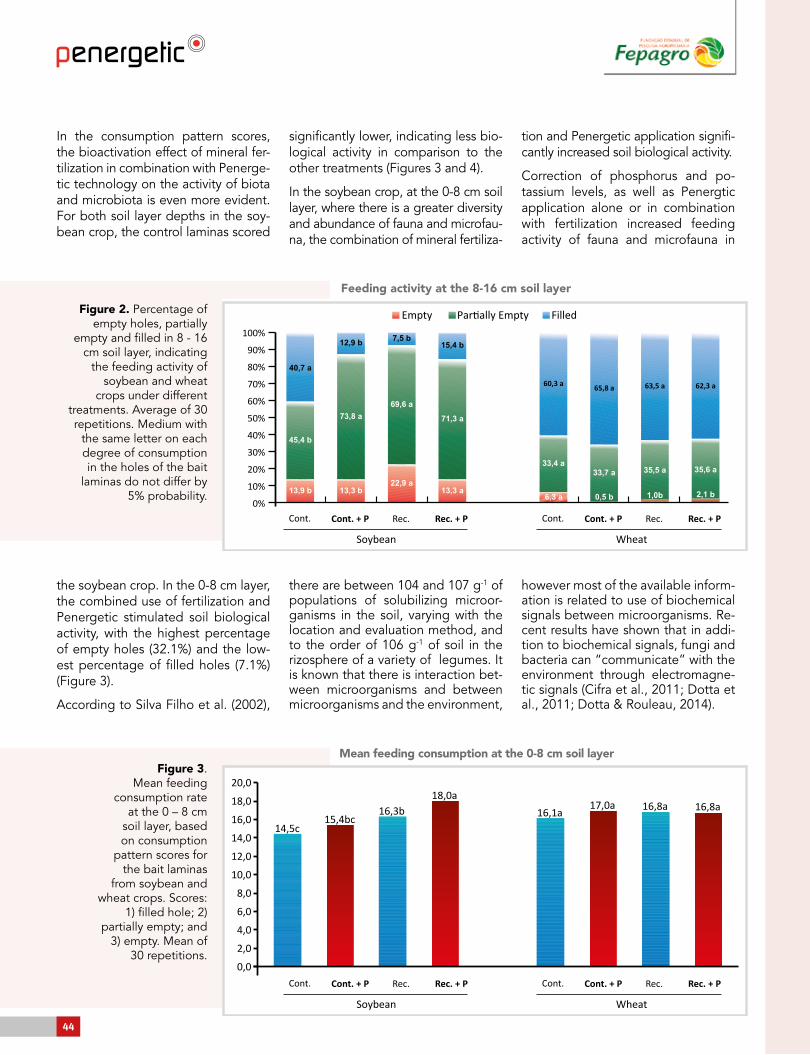
In the consumption pattern scores, the bioactivation effect of mineral fer-tilization in combination with Penerge-tic technology on the activity of biota and microbiota is even more evident. For both soil layer depths in the soy-bean crop, the control laminas scored
Figure 2. Percentage of empty holes, partially
empty and filled in 8 - 16 cm soil layer, indicating
the feeding activity of soybean and wheat
crops under different treatments. Average of 30 repetitions. Medium with
the same letter on each degree of consumption in the holes of the bait
laminas do not differ by 5% probability.
Figure 3. Mean feeding
consumption rate at the 0 – 8 cm
soil layer, based on consumption
pattern scores for the bait laminas
from soybean and wheat crops. Scores:
1) filled hole; 2) partially empty; and
3) empty. Mean of 30 repetitions.
100%
90%
80%
70%
60%
50%
40%
30%
20%
10%
0%
40,7 a
45,4 b
13,9 b 13,3 b
73,8 a
12,9 b 7,5 b
69,6 a
22,9 a13,3 a
71,3 a
15,4 b
60,3 a
33,4 a
6,3 a 0,5 b 1,0b
35,5 a
63,5 a 62,3 a
35,6 a
2,1 b
33,7 a
65,8 a
Cont. Cont. + P
Soybean Wheat
Rec. Rec. + P Cont. Cont. + P Rec. Rec. + P
Empty Partially Empty Filled
20,0
18,0
16,0
14,0
12,0
10,0
8,0
6,0
4,0
2,0
0,0
14,5c15,4bc
16,3b18,0a
16,1a17,0a 16,8a 16,8a
Cont. Cont. + P
Soybean Wheat
Rec. Rec. + P Cont. Cont. + P Rec. Rec. + P
significantly lower, indicating less bio-logical activity in comparison to the other treatments (Figures 3 and 4).
In the soybean crop, at the 0-8 cm soil layer, where there is a greater diversity and abundance of fauna and microfau-na, the combination of mineral fertiliza-
tion and Penergetic application signifi-cantly increased soil biological activity.
Correction of phosphorus and po-tassium levels, as well as Penergtic application alone or in combination with fertilization increased feeding activity of fauna and microfauna in
the soybean crop. In the 0-8 cm layer, the combined use of fertilization and Penergetic stimulated soil biological activity, with the highest percentage of empty holes (32.1%) and the low- est percentage of filled holes (7.1%) (Figure 3).
According to Silva Filho et al. (2002),
there are between 104 and 107 g-1 of populations of solubilizing microor-ganisms in the soil, varying with the location and evaluation method, and to the order of 106 g-1 of soil in the rizosphere of a variety of legumes. It is known that there is interaction bet- ween microorganisms and between microorganisms and the environment,
however most of the available inform- ation is related to use of biochemical signals between microorganisms. Re-cent results have shown that in addi-tion to biochemical signals, fungi and bacteria can “communicate” with the environment through electromagne-tic signals (Cifra et al., 2011; Dotta et al., 2011; Dotta & Rouleau, 2014).
Feeding activity at the 8-16 cm soil layer
Mean feeding consumption at the 0-8 cm soil layer
44

Figure 4. Mean feeding consumption rate at the 8-16 cm soil layer, based on consumption pattern scores for the bait laminas from soybean and wheat crops. Scores: 1) filled hole; 2) partially empty; and 3) empty. Mean of 30 repetitions.
18,0
16,0
14,0
12,0
10,0
8,0
6,0
4,0
2,0
0,0
13,8b
16,0a17,0a
15,8a 15,3a 15,6a 15,9a 16,0a
0%Cont. Cont. + P
Soybean Wheat
Rec. Rec. + P Cont. Cont. + P Rec. Rec. + P
The absence of a significant effect observed for the fertilization and Pener-getic treatment in the wheat crop (Figures 1-4) may be related to the climatic conditions in the region where the study was carried out, characterized by temperatures below 10˚ C in the winter (Lima et al., 2013), which may have inhibited soil biological activity.
It is important to underline the fact that there is a demand for new models of agriculture capable of producing quality foods with reduced application of chemical inputs, aiming at reduced production costs and environmental pro-tection. The issue of dependence and excessive use of mineral fertilizers has been discussed for decades, along with the search for alternatives that can guarantee agricultural sustainability (Costa, 2002). Mineral fertilization costs have increased steadily and phosphate reserves are being consumed at an accelerated pace, jeopardizing this practice in the near future.
Proposals for new technologies are imperative, aiming to improve the quality of agricultural systems, to benefit crop productivity and the survival of organis-ms and microbiota present in these systems. Biostimulation of the life present in the soil contributes to agricultural sustainability and directly affects cycling of organic matter, contributing to the reduction of external nutrients needed in crops.
CONCLUSION
Fauna and microorganism feeding activity at 0-8 and 8-16 cm layers was in-tensified by use of Penergetic, in isolation or in combination with phosphate and potassium fertilization in the soybean crop. In the winter crop, soil feeding activity was similar.
Mean feeding consumption at the 8-16 cm soil layer
45
BILIOGRAPHIC REFERENCES
ALVAREZ, T.; FRAMPTON, G. K.; GOULSON, D. Epigeic Collembola in wheat hunter organic, integrated and conventional farm management regimes. Agriculture Ecosystems and Environment, v. 83, p. 95-110, 2001.
BARBOSA-CÁNOVAS, G. V.; POTHAKAMURY, U. R.; PALOU, E.; SWANSON, B. G. Oscillating Magnetic fields for food processing. En: Nonthermal preservation of foods. Marcel Dekker, Inc., 1998; p. 113-138.
BEARE, M. H.; COLEMAN, D. C.; CROSSLEY Jr., D. A.; HENDRIX, P. F.; ODUM, E. P. A hierarchical approach to evaluating the significance of soil biodiversity to biogeochemical cycling. Plant and Soil, v. 170, p. 5-22, 1995.
BELLINI, S. Further studies on “magnetosensitive bacteria”. Chinese Journal of Oceanology and Limnology. v. 27, n. 1, p. 6-12, 2009.
COSTA, M. B. B. da. Sustentabilidade e manejo dos recursos naturais. In: Anais do Seminário sobre Gestão Sustentável dos Solos Agrícolas. Curitiba: UFPR/Departamento de Solos e Engenharia Agrícola/Projeto Solo Planta, 2002. p. 1-10.
CIFRA, M.; FIELDS, J. Z.; FARHADI, A. Electromagnetic cellular interactions. Progress in Biophysics e Molecular Biology, v. 105, p. 223-246, 2011.
DECAËNS, T. et al. Impacto del uso de la tierra en la macrofauna del suelo de los Llanos Orientales de Colômbia. In: JIMÉNEZ, J. J.; THOMAS, R. J. (Ed.). El arado natural: las comunidades de macroinvertebrados del suelo en las savanas neotropicales de Colombia. Cali :Centro Internacional de Agricultura Tropical, 2003. p. 21-45. Publicación CIAT, n. 336.
DIRAC, P. A. M. The Quantum Theory of the Electron. Proceedings of the Royal Society of London. Series A , V. 117, n 778, p. 610–624, 1928.
DOTTA, B. T.; BUCKNER, C. A.; CAMERON, D.; LAFRENIE, R. M.; PERSINGER, M. A. Biophoton emissions from cell cultures: biochemical evidence for the plasma membrane as the primary source, General Physiology and Biophysic, v. 30, p. 301-309, 2011.
DOTTA, B. T.; ROULEAU, N. Y. Electromagnetic Fields as Structure-Function Zeitgebers in Biological Systems:Environmental Orchestrations of Morphogenesis and Consciousness. Frontiers in Integrative. Neuroscience. V. 8, n. 84. doi:10.3389/fnint.2014.00084.
ESQUIVEL, D. M. S.; WAJNBERG, E.; CERNICCHIARO, G. R.; ALVES, O. C. Comparative magnetic measurements of migratory ant and its only termite prey. Journal of Magnetism and Magnetic Materials, v. 278, p. 117-121, 2004.
FERREIRA D. F. Manual do sistema SISVAR para análises estatísticas. Lavras: Universidade Federal de Lavras, 2000. 66p.
FILZEK, P. D. B.; SPURGEON, D. J.; BROLL, G.; SVENDSEN, C.; HANKARD, P. K.; PAREKH, N.; STUBBERUD, H. E.; WEEKS, J. M. Metal Effects on soil invertebrate feeding: measurements using the bait-lamina method. Ecotoxicology, v. 13, p. 807-816, 2004.
HAJNOROUZIA, A.; VAEZZADEHA, M.; GHANATIB, F.; JAMNEZHADA, H.; NAHIDIANB, B. Growth promotion and a decrease of oxidative stress in maize seedlings by a combination of geomagnetic and weak electromagnetic fields, Journal of Plant Physiology, v. 168, p. 1123-1128, 2001.
HSU, C. Y.; KO, F. Y.; LI, C. W.; FANN, K.; LUE, J. T. Magnetoreception System in Honeybees (Apis mellifera). PLoS One, v, 2, n. 4, p. 395, 2007.
LADINO, E. A. H.; OSORIO, J. L. T.; LOPEZ, L. B. Estudio del Efecto de la estimulación magnética de semillas de Leucaena leucocephala (Lam.) de Wit. Tecno Lógicas, v. 29, p. 33-47, 2012.
LIMA, O. de; MELLONI, R.; MELLONI, E. G. P. Antropização da zona de amortecimento da reserva biológica serra dos Toledos (Itajubá-MG) e seu efeito na qualidade do solo. Cerne, Lavras, v. 19, n. 3, p. 373-381, jul./set. 2013.
NOACK, C. Bemerkungen zur Quantentheorie des Bahndrehimpulses. Physikalische Blätter. V. 41, n. 8, p. 283–285, 1985.
NOVITSKY, Y. I.; NOVITSKAYA, G. V.; KOCHESHKOIVA, T. K.; NECHIPORENKO, G. A.; DOBROVOLSKII, M. V. Growth of green onions in a weak permanent magnetic field, Russian Journal of Plant Physiology, v. 48, p. 709-715, 2001.
PADRINO, M. V. C.; RAMÍREZ, E. M.; GARCÍA, M. F. Tratamiento magnético como técnica estimulante de la germinación de semillas de soja. Ingeniería de Recursos Naturales y del Ambiente, v. 12, p. 119-127, 2013.
PAULI, W. Zur Quantenmechanik des magnetischen Elektrons, Zeitschrift für Physik Bd. V. 43, p.601, 1927.
PEKARSKAS, J.; VILKENYTE, L.; SILEKIENE, D.; CESONIENE, L.; MAKARENKOS, N. effect of organic nitrogen fertilizers provita and fermentator Penergetic® k winter wheat and on soil quality. Environmental Engineering, Lithuania, 2011.
PIETURSZEWSKI, S. Effect of magnetic biostimulation of wheat, Seeds Science Technology, v. 21, p. 621-626, 1993.
REINECKE, A. J.; ALBERTUS, R. M. C.; REINECKE, S. A.; LARINK, O. The effects of organic and conventional management practices on feeding activity of soil organisms in vineyards. African Zoology, v. 43, p. 66-74, 2008.
SIANNAH, S. M. M. D.; MORLA, A. G.; SOFIA, M. C.; PULLES, D. C. Growth of Trichoderma reesei on static and dynamic solid substrate fermentation under electromagnetic fields, In: New Horizon on Biotechnology, Roussos, S.; Soccol, C. R; Pandey, A.; Augur, C.; (eds.). Kluwer Academic Publisher, 57-62, 2003.
SIANNAH, M. M. D. MANRIQUE, C. M.; RICARDO, F. S.; FURIGO Jr., A. Análisis de factibilidad de la aplicación del campo electromagnético alproceso de producción de Trichoderma reseei. Investigación y Saberes, v. 1, n. 3, p. 61-64, 2012.
SILVA FILHO, G. N.; NARLOCH, C.; SCHARF, R. Solubilização de fosfatos naturais por microrganismos isolados de cultivos de Pinus e Eucalyptus de Santa Catarina. Pesquisa Agropecuária Brasileira, v. 37, n. 6, p. 847-854, 2002.
SOCARRÁS, A.; IZQUIERDO, I. Evaluación de sistemas agroecológicos mediante indicadores biológicos de la calidad del suelo: mesofauna edáfica. Pastos y Forrajes. V.37, N.1, p. 47-54, 2014.
SOUZA-TORRES, A. D.; GARCIA, D.; SUEIRO, L.; GILART, F.; PORRAS, E.; LICEA, L. Pre-sowing magnetic treatments of tomato seeds increase the growth and yield of plants, Bioelectromagnetics, v. 7, p. 247-257, 2006.
TER BRAAK, C. J. F.; SMILAUER, P. CANOCO reference manual and user’s guide to Canoco for Windows: Software for canonical community ordination (version 4). New York: Microcomputer Power, 1998.
TROGELLO, E.; TROGELLO, A. G.; SILVEIRA, E. R.; Avaliação da Fauna do Solo em Diferentes Sistemas de Cultivo, Milho Orgânico e Milho em Plantio Direto. Revista Brasileira de Biociências, Porto Alegre, v. 6, supl. 1, p. 25-26, set. 2008.
WAJNBERG, E.; ACOSTA-AVALOS, D.; ALVES, O. C.; OLIVEIRA, J. F.; SRYGLEY, R.; ESQUIVEL, D. M. S. Magnetoreception in eusocial insects: an update. Journal of the Royal Society Interface, v. 7, (Suppl 2), p. 207-225, 2010.
ZAPATA, J.; MORENO, G.; MÁRQUEZ, E. Efectos de los campos magnéticos sobre el crecimiento de saccharomyces cerevisiae. Interciência, v. 27, n. 10, p. 544-550, 2002.
46

Effect of soil bioactivation on suppression of damage caused by Pratylenchus brachyurus in soybean
Brazil is the largest exporter and second largest producer of soybeans in the world. Currently, production in Brazil is led by the states of Mato Grosso, Paraná, Rio Grande do Sul and Goiás, which produce 82.0% of the country’s soybean supply. According to the Brazilian Ministry of Agriculture, soybean production in 2020/2021 is estimated at 86.5 million tons (MAPA, 2011). Approximately 25 pathogens are of economic importance to this crop and the impact of phytonematodes has been of growing importance to the productive system in Brazil, possible preventing soybean growth in some areas (GRIGOLLI; ASMUS, 2014).
Currently, the control of phytopathogens is based on use of inputs that can guarantee productivity and reduce the damage caused by these organisms in roots. However, this practice could lead to environmental contamination (I). Thus, there has been increased pressure to reduce the use of chemical products in agriculture. According to Sediyama et al. (2014), there is a current retrogression in pest control programs, with increased intensity and dosage of pest-control products in crops, leading to undesirable consequences from an economic and environmental standpoint. With the selection of individuals resistant to pesticides, increasingly aggressive inputs have been used with increasingly undesirable consequences. In soybean crops, new pests arise at each harvest and their control has been increasingly inefficient.
Gerusa Pauli Kist Steffen - Agricultural Engineer, PhD in Soil Science, Researcher for Fepagro Florestas, Santa Maria/ RS.Joseila Maldaner - Biologist, PhD in Vegetal Physiology.Zaida Inês Antoniolli – PhD in Mycorrhizal Molecular Aspects, Professor Department of Soil Sciences / UFSM.Rodrigo Josemar Seminoti Jacques – PhD Soil Science, Professor Department of Soil Sciences/ UFSM.Edicarla Trentin - Agricultural Engineer, Master’s Student in Soil Sciences / UFSM.Ricardo Bemfica Steffen – Agricultural Engineer, PhD in Soil Science, Post-doctorate in Soil Science/ UFSM.
47

Among phytopathogens responsible for damage in soybean crops, phytonematodes of the Pratylenchus spp. genera, which cause root lesions, are of special importance, due to their high capacity to adapt to diverse agrosystems and the speed and ease with which they disseminate in crops. It is essential that new pest-control alternatives be evaluated for their efficiency to control these phytoparasites. The aim of this work was to evaluate the effect of Penergetic® P and K on the penetration of phytonematodes in soybean roots.
The penetration of Pratylenchus brachyurus was evaluated in soybean cultivar Nidera 5909. The plants were grown in 3L plastic pots with soil in a greenhouse.
The treatments evaluated were: 1) Contol; 2) Penegetic® application without fertilizer; 3) Phosphorus (P) and Potassium (K) as recommended by CQFS-RS/SC (2004); and 4) Penergetic application in combination with Phosphorus (P) and Potassium (K) as recommended by CQFS-RS/SC (2004). Penergetic was applied according to technical recommendations: Penergetic K (250 g ha-1) was applied to the soil before sowing and Penergetic P (250 g ha-1) was applied to aerial part at stage V3 (125 g ha-1) and 15 days after the first application (125 g ha-1).
The inoculum was composed of pure populations, obtained from species-specific isolation. Inoculum preparation was performed by trituration of roots according to Hussey and Barker (1973) and modified by Boneti and Ferraz (1981). 5 mL of a solution containing 1750 juveniles of P. brachyurus, which was distributed in 3 holes of approximately 2 cm in depth, located around each plant. After 30 days, during the period of blooming, the number of phytonematodes in the roots was counted using the root staining method of Byrd et al. (1983). The roots were then placed on two glass slides under a microscope at 40X increase for counting. The data were analyzed using analysis of variance and Tukey’s test with SISVAR software (FERREIRA, 2000).
Use of Penergetic® P and K decreased the number of phytonematodes penetrated in the roots of soybean, both at 30 days after emergence and during blooming. Since the plants were grown in a greenhouse, protected from biotic and abiotic stresses, the results demonstrate a susceptibility of soybean to the attack of these phytonematodes as well as the efficiency of the different products used to control these organisms. This decrease is related to two factors: a) a smaller number of phytonematodes penetrated in the root system; and b) reduced multiplication of these organisms in the soil, demonstrating a delaying effect on the nematode cycle within the root and smaller source of inoculum in the soil.
Figure 1. Number of Pratylenchus brachyurus
nematodes penetrated in the roots of soybean at 30 days after emergence (DAE) and
during blooming.
168 b157 b
302 a267 a 248 b257 b
366 a378 a
050
100150200250300350400
Control Control + Penergetic CQFS-RS/SCFertilization
CQFS-RS/SCFertilization+ Penergetic
Phty
onem
atod
es p
er g
ram
of r
oot
30 DAE Blooming
48
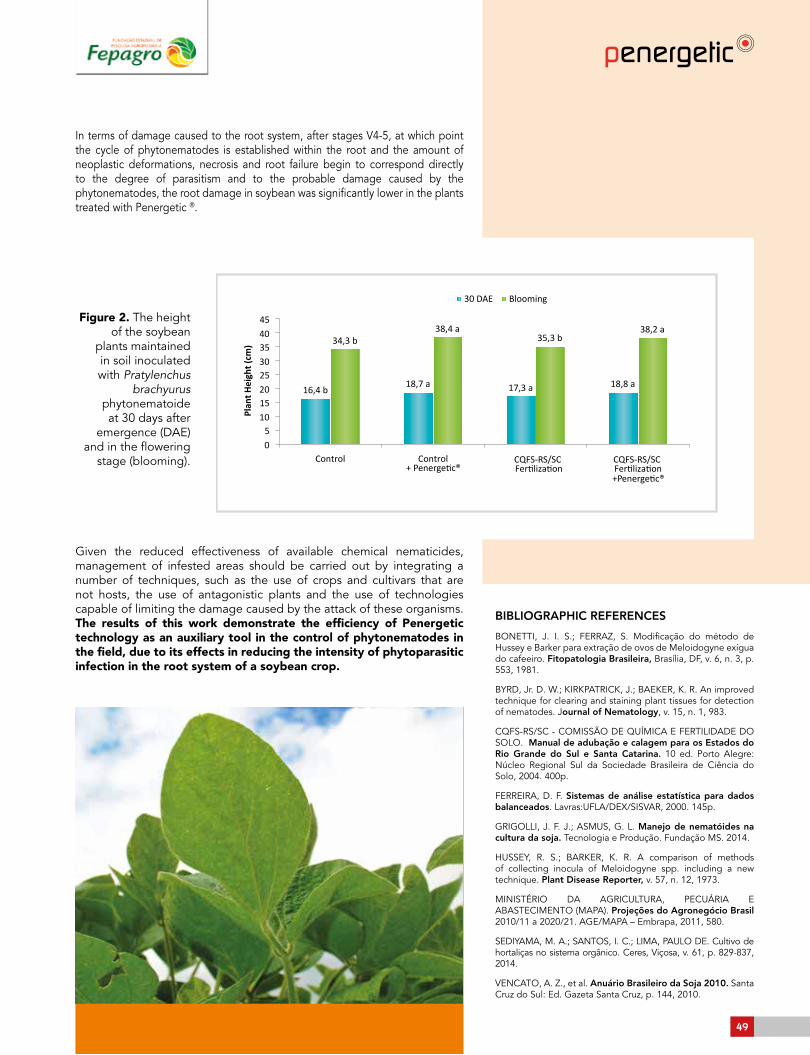
Figure 2. The height of the soybean
plants maintained in soil inoculated with Pratylenchus
brachyurus phytonematoide at 30 days after
emergence (DAE) and in the flowering
stage (blooming).
16,4 b 18,8 a17,3 a18,7 a
35,3 b34,3 b38,2 a38,4 a
05
1015202530354045
Pla
nt
He
igh
t (c
m)
30 DAE Blooming
Control ControlFertilization+ PenergeCQFS-RS/SC
FertilizationCQFS-RS/SC
+Penerge
In terms of damage caused to the root system, after stages V4-5, at which point the cycle of phytonematodes is established within the root and the amount of neoplastic deformations, necrosis and root failure begin to correspond directly to the degree of parasitism and to the probable damage caused by the phytonematodes, the root damage in soybean was significantly lower in the plants treated with Penergetic ®.
Given the reduced effectiveness of available chemical nematicides, management of infested areas should be carried out by integrating a number of techniques, such as the use of crops and cultivars that are not hosts, the use of antagonistic plants and the use of technologies capable of limiting the damage caused by the attack of these organisms. The results of this work demonstrate the efficiency of Penergetic technology as an auxiliary tool in the control of phytonematodes in the field, due to its effects in reducing the intensity of phytoparasitic infection in the root system of a soybean crop.
BIBLIOGRAPHIC REFERENCES
BONETTI, J. I. S.; FERRAZ, S. Modificação do método de Hussey e Barker para extração de ovos de Meloidogyne exígua do cafeeiro. Fitopatologia Brasileira, Brasília, DF, v. 6, n. 3, p. 553, 1981.
BYRD, Jr. D. W.; KIRKPATRICK, J.; BAEKER, K. R. An improved technique for clearing and staining plant tissues for detection of nematodes. Journal of Nematology, v. 15, n. 1, 983.
CQFS-RS/SC - COMISSÃO DE QUÍMICA E FERTILIDADE DO SOLO. Manual de adubação e calagem para os Estados do Rio Grande do Sul e Santa Catarina. 10 ed. Porto Alegre: Núcleo Regional Sul da Sociedade Brasileira de Ciência do Solo, 2004. 400p.
FERREIRA, D. F. Sistemas de análise estatística para dados balanceados. Lavras:UFLA/DEX/SISVAR, 2000. 145p.
GRIGOLLI, J. F. J.; ASMUS, G. L. Manejo de nematóides na cultura da soja. Tecnologia e Produção. Fundação MS. 2014.
HUSSEY, R. S.; BARKER, K. R. A comparison of methods of collecting inocula of Meloidogyne spp. including a new technique. Plant Disease Reporter, v. 57, n. 12, 1973.
MINISTÉRIO DA AGRICULTURA, PECUÁRIA E ABASTECIMENTO (MAPA). Projeções do Agronegócio Brasil 2010/11 a 2020/21. AGE/MAPA – Embrapa, 2011, 580.
SEDIYAMA, M. A.; SANTOS, I. C.; LIMA, PAULO DE. Cultivo de hortaliças no sistema orgânico. Ceres, Viçosa, v. 61, p. 829-837, 2014.
VENCATO, A. Z., et al. Anuário Brasileiro da Soja 2010. Santa Cruz do Sul: Ed. Gazeta Santa Cruz, p. 144, 2010.
49

Effects of Penergetic® technology on seed germination and chlorophyll content in soybean plants
Joseila Maldaner - Biologist, PhD in Vegetal Physiology.Gerusa Pauli Kist Steffen - Agricultural Engineer, PhD in Soil Science, Researcher for Fepagro Florestas, Santa Maria/ RS.Cléber Witt Saldanha – Forest Engineer, PhD in Physiology.Rosana Matos de Morais – Biologist, PhD in Phytotecnia.Ricardo Bemfica Steffen – Agricultural Engineer, PhD in Soil Science, Post-doctorate in Soil Science/ UFSM.
Brazil is currently the second largest producer of soybean in the world. The increased productive capacity in soybean production in Brazil is linked to scientific advances and availability of technologies in the production sector. Over the last 40 years, the worldwide soybean production increased by over 500%. In addition, lifestyle changes in countries such as China and the increasing demand for raw material to produce biodiesel suggest the continued growth in worldwide production. Vencato et al. (2010) estimate that soybean production in Brazil will increase by 40% by 2020, surpassing the U.S. in production and becoming the largest producer of
this oil seed. However, in order to achieve this projection, it is urgent to provide technologies that can sustain this production level. According to the U.S. Department of Agriculture, Brazil exports and produces 26.5 and 31.3% of the worldwide supply of soybean, respectively.
According to Freitas (2011), increased soybean production has always been associated with scientific advances and availability of technologies. Included among these advances are mechanization, the creation of highly productive cultivars adapted to diverse regions and the development of technologies for crop management and pest management, since pests and diseases are responsible for a significant portion of the annual losses.
In this context, the adoption of innovative products that reduce the use of economically and environmentally costly inputs may be a viable strategy
50

for achieving more sustainable productive systems without reducing crop productivity. Penergetic is noteworthy among these products as it utilizes electromagnetic energy to optimize photosynthetic efficiency in plants (Penergetic P). Pekarskas et al. (2011), evaluating the effect of Penergetic application in winter crops, reported increased wheat productivity and quality. Jankauskiene and Surviliene (2009), evaluating effect of different products on germination in garden crops, reported that Penergetic P increased seed vigor in tomato, radish, cucumber and beet. The same authors, evaluating Penergetic P powder on beet seedlings, reported greater absorption of active photosynthetic radiation, higher electron transmission rate and increased dry matter accumulation.
According to Motta et al. (2000), guaranteeing better crop performance depends essentially on seed quality, characterized by germination and vigor, which is determined by capacity of a seed lot to establish normal seedlings in field conditions.
Relative chlorophyll content is the parameter most evaluated to assess leaf nitrogen levels (N) in order to predict the level of fertilization needed. Chlorophyll content is important because it determines the photosynthetic potential of a plant through its control of the amount of solar radiation a leaf absorbs (HATFIELD et al., 2008).
The present work aimed to evaluate the effect of Penergetic P on soybean seed germination and photosynthetic process at the vegetative phase.
For the germination test, cultivar Nidera 5909 soybean seeds were treated with 0, 2, 2.5 and 3 grams Penergetic P per Kg of seed, with four
repetitions of 25 seeds each. Germitest paper, in roll form, was moistened with distilled water at a proportion of 2 ½ the weight of the paper and the material was maintained at 25 ˚C. Germination was counted on the fifth day after assay installation.
Chlorophyll content was evaluated under field conditions, using cultivar Nidera 5909 and two treatments: Control and Penergetic P at a dose of 250 g / ha. Chlorophyll content was evaluated before application (Stage V3) and at stages V4, V6 and R1, in 12 plants per treatment.
The data for germination and chlorophyll content were analyzed using analysis of variance and Tukey’s test at 5% probability.
Use of Penergetic P as a soybean seed treatment significantly increased germination and root growth (Figure 1), with concentrations of 2.5 and 3 grams per Kg seed, providing significantly higher germination in comparison to the other treatments. The longest root length was found at the dose of 3 grams of Penergetic, while 2 grams and 2.5 grams were superior to the Control treatment.
Figure 1. Germination percentage and root length in soybean at different doses of Penergetic P via seed treatment.
96 b98 ab 99 a 100 a
70
75
80
85
90
95
100
0 2 2,5 3
Dose of Penergetic P (g/kg seed) Dose of Penergetic P (g/kg seed)
Germ
inati
on (%
)
35,3 c
72,5 b 74,2 b
93,61 a
0102030405060708090
100
0 2 2,5 3
Root
leng
th (m
m)
51

BIBLIOGRAPHIC REFERENCES
CARVALHO, M.A.F.; SILVEIRA, P. M. de; SANTOS, A. B. dos. Utilização do Clorofilômetro para Racionalização da Adubação Nitrogenada nas Culturas do Arroz e do Feijoeiro. Comunicado Técnico 205 - Embrapa, ISSN 1678-961X Santo Antônio de Goiás, 2012.FREITAS, M. de C. M. de. A cultura da soja no Brasil: o crescimento da produção brasileira e o surgimento de uma nova fronteira agrícola. Enciclopédia Biosfera, Goiânia, v.7, n.12; 2011.
HATFIELD, J. L.; GITELSON, A.A.; SCHEPERS, J. S. Application of spectral remote sensing for agronomic decisions. Agronomy Journal, v. 100 (Supplement): p. 117-131, 2008.
JANKAUSKIENE, J.; SURVILIENE, E. Influence of growth regulators on seed germination energy and biometrical parameters of vegetables. In: Scientific works of the Lithuanian institute of horticulture and Lithuanian University of Agriculture. Sodininkystė ir Daržininkystė. V. 28, N. 3, 2009.
MOTTA, I.S.; BRACCINI, A.L.B.; SCAPIM, C.A.; GONÇALVES, A.C.A.; BRACCINI, M.C.L.; ÁVILA, M.R. Qualidade fisiológica de sementes de soja provenientes de diferentes épocas de semeadura. Revista Brasileira de Sementes, v. 22, p.257-267, 2000.
SILVA, R.V.M.M.; ROSSIELLO, R.O.P. MORENZ, M.J.F.; BARBIERI JUNIOR, E.; GOMES, R.L.T. CAMARGO FILHO, S.T. Uso de clorofilometro na avaliação da adubação nitrogenada e potássica no capim Tifton 85. Revista Brasileira de Saúde e Produção Animal, v.12, n.3, p. 828-839, 2011.
PEKARSKAS, J.; VILKENYTE, L.; SILEKIENE, D.; CESONIENE, L.; MAKARENKOS, N. effect of organic nitrogen fertilizers provita and fermentator Penergetic® k winter wheat and on soil quality. Environmental Engineering, Lithuania , 2011.
VENCATO, A. Z., et al. Anuário Brasileiro da Soja 2010. Santa Cruz do Sul: Ed. Gazeta Santa Cruz, p. 144, 2010.
Penergetic P increased chlorophyll content, determined by chlorophyll meter, from application of the product until the R1 stage, presenting a quadratic response for this variable (Figure 2). This data is important due to the positive correlation between chlorophyll content and N content in the plant. N is an inductor of metabolic processes, with effects on absorption of macro and micronutrients and on allocation of matter and energy by plants (SILVA et al., 2011).
Figure 2. Falker chlorophyll content measured in soybean plants under different treatments.
35
40
45
50
1 2 3 4 5 6 7 8 9
Without Penergetic Application 250g/ha - 125g + 125g
Ch
loro
ph
yll c
on
ten
t
V1 V3 V4 Vn R1 R2 R3 R4 - 5
52
Evaluation of Penergetic® P and Penergetic® K in temperate climate fruit trees
Alessandra Vendrameto Martinsª- Eng. Agrônoma.
INTRODUCTIONThe productivity and fruit quality of an orchard re-sult from the interaction of several factors, espe-cially the genetic potential and the environment (management of the soil and nutrients and water balance). The maximum production and optimum fruit quality are achieved when the nutritional status of the plant is ideal. In many agricultural situations this condition is fulfilled by the annual supply of fertilizers and soil acidity correction. The nutritional aspect is particularly important for the fruit, due to the influence mineral elements have on their qual-ity. Fruit trees are highly responsive to the addition of fertilizers. In many cases fertilization, and conse-quently the nutritional condition of crops, may af-fect not only productivity, but the size and weight of the fruit, color, appearance, taste, aroma, post-harvest storage, resistance to pests and diseases, among others. The bioactivation or biological ac-tivation in plants is a positive interference that pro-vides support to help them reach their productive potential, enabling plants to fully convert sunlight, water and nutrients into grains, fruit, fibers, cellu-lose, etc., facilitating their association with the soil and its microorganisms. This will result in a healthier and more robust and vigorous plant.
OBJECTIVEThe objective of this study is to evaluate the performance of products Penergetic® K and Penergetic® P in the bioactivation of the soil and cv Kampai peach plants.
METHODOLOGYThe experiment is being conducted on the property of Mr. Alberto Nascimento in the district of Campos de Holambra, municipality of Paranapanema, Sao Paulo state, in a 4 year-old Peach cv Kampai farm. Two treatments were applied, and the fertilizer is
composed of 100kg / ha of potassium nitrate, 100kg / ha of urea and 150 kg / ha of KCl divided into two applications. The treatments:Control: Standard local production treatment.Treatment 1: 600 g/ha Penergetic® K and 600 g/ha Penergetic® P. Penergetic® K was applied in a single dose on 6/26/2014, and applica-tions of the Penergetic® P was applied in three separate applications: 06/18/2014; 07/02/2014 and 07/20/2014. The following evaluations were carried out: fruit shelf life and firmness (lbs), Brix (soluble solids) chemical analysis of the fruits and productivity.
RESULTSThe first soil analysis prior to conducting the experiment was carried out on 06/04/2014. At the end of the experiment, a new analysis to measure the total P level before and after the application of Penergetic® will be performed. For the evaluation shelf life, the fruits were visually observed (Figures 1 and 2) and firmness was evaluated with the help of a penetrom-eter. In addition, brix and fruit size were evaluated. Evaluations were made on the day of harvest and 3, 5, 7 and 10 days after harvest. For chemical analysis of the fruits, 15 fruits from each treatment were collected and sent to the laboratory. The analysis of the treated area showed levels of elements, such as potassium, calcium, manganese, among others, to be higher than those of the Control. For the evaluation of crop productivity, the fruits of three plants were counted and the mean of the three plants for each treatment was obtained. Afterwards, approximately 30 fruits from each treatment were collected and weighed in order to obtain mean yield per plant. The results were: 238 fruits per plant in the control, and 306 fruits per plant from the Treatment with Penergetic® K and Penergetic® P, a mean production increase of 68 fruits per plant with Penergetic® ap-plication. The mean weight in grams per fruit also presented differences: 85 grams in the control, and 88 grams in the Penergetic® treatment, even when the treated area showed a higher number of fruits per plant, its av-erage weight was also higher. Production performance parameters in the Penergetic® treatment increased by 33% when compared to the control.
CONCLUSIONSIn conclusion, plants treated with Penergetic presented larger fruits and significantly higher productivity than those of the Control, with a 33% increase in mean weight per fruit when compared to the Control.
53

FIGURE 1. SHELF LIFE OF PEACHES FROM THE 1ST HARVEST
FIGURE 2. SHELF LIFE OF PEACHES FROM THE 2ND HARVEST
54

The use of soil and plant bioactivator with and without mineral fertilizer in soybean and its relationship to nutritional bioavailability and production components
Soybean (Glycine max L.) is of great importance to Brazilian agricultural activity, ranking second place among the main products worldwide, both in area and production value. The soils in which soybeans are grown usually have a high phosphoros fixation capacity (Q), which makes use of primary fertilizer efficient (Motomiya et al., 2004). Since the rate of absorption and transport of inorganic phosphorus (Pi) by roots is greater than its diffusion rate in the ground, a depletion zone is formed, resulting in depletion of P in the rhizosphere. In this way, the plant develops mechanisms to capture this element beyond that area, through associations or mutualistic symbioses among fungi and roots, which are denominated mycorrhiza
Ivair André Nava -Agricultural Engineer , Doctor in AgronomyEloir Paulo Gris - Agricultural Engineer ,
(MOREIRA & Siqueira, 2002). The so-called modern soil management techniques have been greatly decreasing the diversity and number of mycorrhiza in the field, resulting in declines in resilience and stability of agro-ecosystems (JEFFRIES et al., 2003). In this respect, manufacturers of commercial products have been promoting the survival of these organisms, which target the stabilization of mycorrhiza in the soil and the decreased use of phosphate fertilizers, which are currently called plant and soil bioactivators.
55

Considering the importance of the fertilization of soybean for productivity gains and the complexity of the application and availability of P in the soil-plant system in tillage, this study aims to evaluate the use of a soil and commercial plant bioactivator in the presence and in the absence of fertilizer in the base as well as the nutritional bioavailability and production yield of soybean components. The experiment was conducted under field conditions in no tillage system in straw in the city of Palotina, Paraná state, during the period October 2014 to February 2015. The soil was classified as Oxisol type 3 and the chemical and particle size analysis are presented in Table 01. Four treatments were implanted, taking into account need for P in soybean crops (EMBRAPA SOY, 2010) and Penergetic application as a commericial bioactivator, as follow:
T1 (+F+BI): 100% of phosphorus + 100% of bioactivator;T2 (+F-BI): 100% of phosphorus + 0% of bioactivator;T3 (-F+BI): 0% of phosphorus + 100% of bioactivator;T4 (-F-BI): 0% of phosphorus + 0% of bioactivator.
Glyphosate-resistant Cultivar TMG 7363® was used, placing 14 seeds per meter and applying the formulated fertilizer 07-36-10 (N2, P2O5, K2O) at 400 kg / ha. Each treatment area was 36 m2. Penergetic® K was applied before sowing at a dose of 300 g / ha and Penergetic® P was applied twice: at 28 days after emergence (DAE), in V5 growth stage (150 g / ha.), and at 39 DAE, in R1 (150 g / ha.). After 86 DAE we performed leaf collection for analysis of leaf tissue: 25 leaves from the middle third of the plant in the R5.3 growth stage. The following macronutrients were determined: Phosphorus (P), nitrogen (N), potassium (K), calcium (Ca), Magnesium (Mg) and Sulfur (S) and the micronutrients Copper (Cu), Zinc (Zn), Manganese (Mn), Boron (B) and Iron (Fe).
At 115 DAE harvest took place, in which yield components were determined: number of pods per plant (NPP); number of grains per pod (NGP) and 100 grain-weight (M100); correcting grain moisture to 13%. The experimental design was completely randomized (DIC), with four treatments and three replications. The data were submitted to F test (Fisher) with analysis of variance (ANOVA), at 1% and 5% significance level, and means were compared by Tukey’s test at 5% probability.
The results of the ANOVA for the macronutrients of the leaf tissue revealed a significant effect for P and N at 5% probability (0.01 ≤ p <0.05) and for the element K at 1% probability (p <0.01 ). For other
elements there were no significant differences (Table 02). Considering the development stage in which the leaves were collected (R5.3), several elements are transferred to the grains, having reduced their levels in leaf tissue (HALL, 1998). For P, it was observed that the highest average was expressed by T3 treatment (-F + BI), which suggests that the full use of bioactivator without basic fertilization favored the increase of the element, although it was not statistically different from T2 (+ F-BI) and T4 (-F-BI), or from T1 (+ F + BI), which presented the lowest mean.
In the absence of P in the base fertilization, the commercial bioactivator managed to maintain the mean level of this nutrient, although this was due to the fact that the soil was able to provide P satisfactorily, from the availability that was already in the field, as determined by soil analysis (Table 01). Soybeans have potential to provide high yields even under low or no phosphorus fertilization, especially when there is a residual effect from previous fertilizations, as long as the availability of P in soil is above levels considered to be critical (LANTAMANN et al., 1996), which event occurred in this experiment.
Yet when plants absorb P at rates that exceed the growth demand, some processes act in order to prevent the accumulation of toxic concentrations of P (Shachtman et al., 1998). Considering these facts, the treatment T1 (+ F + BI), which presented the lowest mean, could be linked to this regulation of P in the plant.
ANOVA revealed that there were no statistical differences by the F test (p ≥ 0.05) for leaf tissue micronutrients. This may be explained when we observe the levels of micronutrients found in the soil, as as can be seen in Table 01: all the elements are within the ideal parameters, enabling their delivery to the plant during its cycle (EMBRAPA SOJA, 2010).
Analysis of yield components (Table 3) revealed that the NPP and M100 variables presented significant differences by the F test at 5% probability (0.01 ≤ p <0.05) whereas for the variable NGP there were no significant differences by the test F (p ≥ 0.05). In the evaluation of M100, it was noted that the treatments T2 (+ F-BI) and T3 (-F + BI) presented superior means when compared to the others, but were not statistically different from T1 (+ F + BI). The T4 treatment (-F-BI) presented the lowest mean, but did not differ from T1 (+ F + BI). This leads us to conclude that the use of both mineral P and the use of bioactivator, individually, were able to raise the grain mass.
Is worth mentioning that the initial P level in the soil was 24.60 mg dm-3 (Table 1), a high content according to Embrapa Soja (2010). Therefore, it is concluded that for leaf P the use of the commercial bioactivator was similar to that of mineral fertilizer. For micronutrients, there were no significant results. Yield components indicated that the bioactivator provided results equivalent to mineral fertilization, although these data refer to a single harvest. However, there should also be similar evaluations with other cultivars and fertility conditions, mainly in soil with limited P in order to complement the results found in this experiment.
56

BIBLIOGRAPHICAL REFERENCES
CARVALHO, M.A.F.; SILVEIRA, P. M. de; SANTOS, A. B. dos. Utilização do Clorofilômetro para Racionalização da Adubação Nitrogenada nas Culturas do Arroz e do Feijoeiro. Comunicado Técnico 205 - Embrapa, ISSN 1678-961X Santo Antônio de Goiás, 2012.FREITAS, M. de C. M. de. A cultura da soja no Brasil: o crescimento da produção brasileira e o surgimento de uma nova fronteira agrícola. Enciclopédia Biosfera, Goiânia, v.7, n.12; 2011.
HATFIELD, J. L.; GITELSON, A.A.; SCHEPERS, J. S. Application of spectral remote sensing for agronomic decisions. Agronomy Journal, v. 100 (Supplement): p. 117-131, 2008.
JANKAUSKIENE, J.; SURVILIENE, E. Influence of growth regulators on seed germination energy and biometrical parameters of vegetables.
In: Scientific works of the Lithuanian institute of horticulture and Lithuanian University of Agriculture. Sodininkystė ir Daržininkystė. V. 28, N. 3, 2009.
MOTTA, I.S.; BRACCINI, A.L.B.; SCAPIM, C.A.; GONÇALVES, A.C.A.; BRACCINI, M.C.L.; ÁVILA, M.R. Qualidade fisiológica de sementes de soja provenientes de diferentes épocas de semeadura. Revista Brasileira de Sementes, v. 22, p.257-267, 2000.
SILVA, R.V.M.M.; ROSSIELLO, R.O.P. MORENZ, M.J.F.; BARBIERI JUNIOR, E.; GOMES, R.L.T. CAMARGO FILHO, S.T. Uso de clorofilometro na avaliação da adubação nitrogenada e potássica no capim Tifton 85. Revista Brasileira de Saúde e Produção Animal, v.12, n.3, p. 828-839, 2011.
PEKARSKAS, J.; VILKENYTE, L.; SILEKIENE, D.; CESONIENE, L.; MAKARENKOS, N. effect of organic nitrogen fertilizers provita and fermentator Penergetic® k winter wheat and on soil quality. Environmental Engineering, Lithuania , 2011.
VENCATO, A. Z., et al. Anuário Brasileiro da Soja 2010. Santa Cruz do Sul: Ed. Gazeta Santa Cruz, p. 144, 2010.
pH P K+ Ca2+ Al3+ H++Al3+ SB CTCH2O mg dm-3
51,2123,838,311,116,66,06,4256,5SandSiltClaynMnZuCeFV
%88,8644,3286,750,9142,789,0149,9615,86 324,17
P, K+, S(SO4)-2 = Mehlich-I. Al+3, Ca+2 e Mg+2 = KCl 1 N.
Mg2+
----------------------------------- cmolc dm-3 ----------------------------------0
S(SO4)-2
-----------------------mg dm-3-------------------- ----------------- % ---------------
Treatments P * N * K ** Ca ns Mg ns S ns
T1(+F+BI) 3,76 b 31,26 b 18,33 a 17,48 a 1,53 a 4,48 aT2(+F-BI) 4,13 ab 31,56 b 16,96 b 16,68 a 1,28 a 4,94 aT3(-F+BI) 4,39 a 31,92 b 18,33 a 16,28 a 1,40 a 4,72 aT4(-F-BI) 4,00 ab 37,24 a 15,98 b 16,29 a 1,62 a 4,82 aMean 4,07 32,99 17,4 16,68 1,46 4,74CV (%) 5,28 5,89 2,41 3,81 9,11 8,77
---------------------------------------- g Kg-1 ------------------------------------------
The averages followed by the same letter in the same column do not differ statistically. Tukey’s test was applied at 5% probability; ns - not significant; ** - Significant at 1% probability by F test (Fischer);* - Significant at 5% probability by F test; CV - Coefficient of variation.
Treatments NPP* NGLns M100* (g)T1(+F+BI) 47,27 a 2,32 a 11,32 abT2(+F-BI) 38,30 ab 2,50 a 11,52 aT3(-F+BI) 47,17 a 2,54 a 11,62 aT4(-F-BI) 34,15 b 2,25 a 09,94 bMean 41,72 2,4 11,09CV (%) 14,51 8,02 6,6
NPP - number of pods per plant; NGP - number of grains per pod and M100 - mass of 100 grains. The means followed by the same letter in the same column do not differ statistically. Tukey’s test was applied at 5% probability; ns - not significant; * - Significant at 5% probability by F test (Fischer). CV - Coefficient of variation.
Table 1. Soil Analysis Results
Table 2. Result of macronutrients in plant tissue
Table 3. Results of production components analysis
57

Phosphate fertilizer adjustment using Penergetic® technology in soybeans
Currently, world agricultural production founded upon the use of high amounts of inputs related to fertilization of crops and control of pests and diseases, resulting in increased environmental pollution and rising costs of production. In Brazil, a country with great competitiveness in international agribusiness, this situation is no different.
In the search for alternative sustainable agriculture, Oliveira et al. (2014) reported that many of the advances made by Brazilian agribusiness are due to the widespread use of fertilizers and pesticides, which are necessarily imported in large quantities in order to keep up with the demand of Brazilian agriculture. Also, according to the researcher, the safety and sustainability of Brazilian agribusiness are threatened by the availability and susceptibility of these inputs to the prices of the international market. In addition, there is growing pressure to achieve higher productivity in a more sustainable way to provide the growing population with food and energy.
Reports published by FAO and UNESCO cite countries such as Brazil as potential exporters of food in the coming years, due to the country’s soil and climatic conditions and area. However, we must ask ourselves at what cost? Currently 53% of the phosphorus and 93% potassium used in Brazilian agriculture, in various crops, are mainly imported from countries like Russia and China, in the case of phosphates and Russia and Canada in the case of potash fertilizers. According to projections, the dependence on imports of these fertilizers will increase significantly by 2025.
Research carried out in China (the largest producer and consumer of phosphate fertilizer) showed that only excess fertilizers used by Chinese farmers in recent years would supply all the demand for phosphate fertilizers in Western Europe and half the demand of African countries (Sattari et al. , 2015). MacDonald et al. (2010) determined that the phosphorus surplus in world agriculture exceeds 13 kg per hectare per year. Bouwman et al. (2010) in a review on nutrient losses and demand for mineral fertilizers in agriculture, demonstrated that between the years 1950-2000, the phosphorus surplus added to soils was 11 million tons. The same study indicates that by the year 2050 if the global agriculture does not adopt mitigation measures, the surplus will increase by approximately 54%.
In 2013, during the 7th International match Workshop, held in Sweden, research areas were defined aiming to: 1) optimize the management of phosphorus in the world modifications; 2) determine soil phosphorus transport routes for surface
and subsurface waters; 3) intensify the monitoring, modeling and communication regarding phosphorus used in agriculture; 4) determine the importance of organic farming systems to match management; 5) identify appropriate measures to reduce phosphorus losses and 6) implement mitigation strategies to reduce losses and the use of phosphorus. In this sense, the adoption of alternative and innovative products that result in reducing the use of high economic and environmentally costly inputs, represents a viable strategy for producers that are seeking to adopt more sustainable production systems without reducing crop yields. In this sense, this study aimed to evaluate the possibility of adjusting phosphorus fertilization, using Penergetic® technology in soybeans.
The tests consisted of side by side plantations/crops in 28 properties in the South of Brazil, 18 properties in the Southeast and 11 properties in the Midwest region in the agricultural year 2013/2014, in addition to 100 properties in the South of Brazil, 17 properties in the Southeast, 9 properties in the Midwest region in the agricultural year 2014/2015. The treatments were: 1) local producer’s standard (standard NPK) and 2) use of Penergetic® technology with adjustment of phosphate fertilizer based on analysis of the fertility of the evaluated soil in each property, according to the NPK formulations for each region. Potassium fertilization was standardized in the areas and in treatments, being used in coverage in the form of potassium chloride. Penergetic® K (250 g ha-1) was applied to the soil during desiccation in pre-sowing and Penergetic® P (250 g ha-1) was applied to the leaf in two stages, 125 g in the V3 stage and 125 g 15 days after the first application.
The control of pests, diseases and weeds was performed according to the technical indications for the crop, being identical in side by side plots. During the
Ricardo Bemfica Steffen – Agricultural Engineer, PhD in Soil Science, Post-doc-torate in Soil Science/ UFSM.Carlos Ernesto Machado – Agricultural EngineerJéssica Guimarães Santana dos Reis – Agricultural Engineer
58
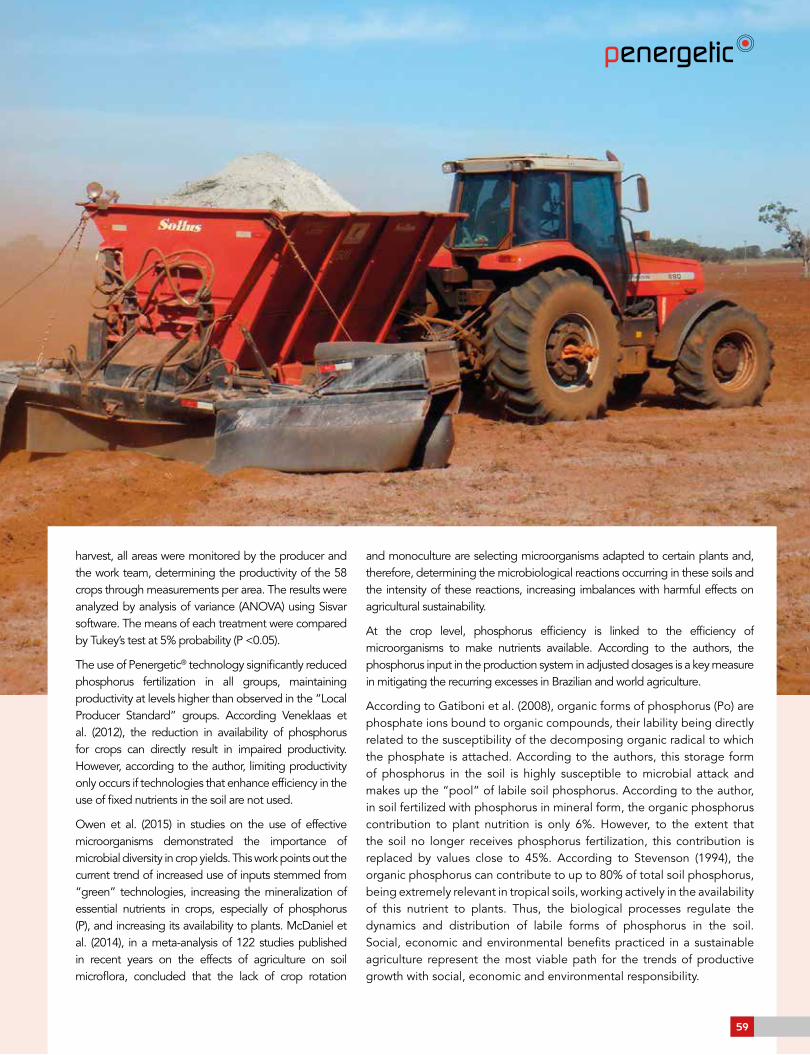
harvest, all areas were monitored by the producer and the work team, determining the productivity of the 58 crops through measurements per area. The results were analyzed by analysis of variance (ANOVA) using Sisvar software. The means of each treatment were compared by Tukey’s test at 5% probability (P <0.05).
The use of Penergetic® technology significantly reduced phosphorus fertilization in all groups, maintaining productivity at levels higher than observed in the “Local Producer Standard” groups. According Veneklaas et al. (2012), the reduction in availability of phosphorus for crops can directly result in impaired productivity. However, according to the author, limiting productivity only occurs if technologies that enhance efficiency in the use of fixed nutrients in the soil are not used.
Owen et al. (2015) in studies on the use of effective microorganisms demonstrated the importance of microbial diversity in crop yields. This work points out the current trend of increased use of inputs stemmed from “green” technologies, increasing the mineralization of essential nutrients in crops, especially of phosphorus (P), and increasing its availability to plants. McDaniel et al. (2014), in a meta-analysis of 122 studies published in recent years on the effects of agriculture on soil microflora, concluded that the lack of crop rotation
and monoculture are selecting microorganisms adapted to certain plants and, therefore, determining the microbiological reactions occurring in these soils and the intensity of these reactions, increasing imbalances with harmful effects on agricultural sustainability.
At the crop level, phosphorus efficiency is linked to the efficiency of microorganisms to make nutrients available. According to the authors, the phosphorus input in the production system in adjusted dosages is a key measure in mitigating the recurring excesses in Brazilian and world agriculture.
According to Gatiboni et al. (2008), organic forms of phosphorus (Po) are phosphate ions bound to organic compounds, their lability being directly related to the susceptibility of the decomposing organic radical to which the phosphate is attached. According to the authors, this storage form of phosphorus in the soil is highly susceptible to microbial attack and makes up the “pool” of labile soil phosphorus. According to the author, in soil fertilized with phosphorus in mineral form, the organic phosphorus contribution to plant nutrition is only 6%. However, to the extent that the soil no longer receives phosphorus fertilization, this contribution is replaced by values close to 45%. According to Stevenson (1994), the organic phosphorus can contribute to up to 80% of total soil phosphorus, being extremely relevant in tropical soils, working actively in the availability of this nutrient to plants. Thus, the biological processes regulate the dynamics and distribution of labile forms of phosphorus in the soil. Social, economic and environmental benefits practiced in a sustainable agriculture represent the most viable path for the trends of productive growth with social, economic and environmental responsibility.
59

BIBLIOGRAPHICAL REFERENCES
GATIBONI, L.C.; KAMINSKI, J.; RHEINHEIMER, D.S.; BRUNETTO, G. Fósforo da biomassa microbiana e atividade de fosfatases ácidas durante a diminuição do fósforo disponível no solo. Pesquisa Agropecuária Brasileira, v. 43, n. 8, p. 1085-1091, 2008.
McDaniel, M. D.; Tiemann, L. K.; Grandy, A. S. Does agricultural crop diversity enhance soil microbial biomass and organic matter dynamics? A meta-analysis. Ecological Applications, v. 24, p.560–570, 2014.
OLIVEIRA, A. L. M. de.; COSTA, K. dos R.; FERREIRA, D. C.; MILANI, K. M. L.; SANTOS, O. J. A. P. dos.; SILVA, M. B.; ZULUAGA, M. Y. A. Aplicações da biodiversidade bacteriana do solo para a sustentabilidade da agricultura. Biochemistry and Biotechnology Reports, v.3, n.1, p. 56-77, 2014.
OWEN, D.; WILLIAMS, A. P.; GRIFFITH, G. W.; WITHERS, P. J. A. Use of commercial bio-inoculants to increase agricultural production through improved phosphrous acquisition. Applied Soil Ecology, v. 86, p. 41-54, 2015.
STEVENSON, F.J. Húmus chemistry: gênesis, composition, reactions. New York: J. Wiley, 496p, 1994.
WHITELAW, M.A. Growth promotion of plant inoculated with phosphate solubilizing fungi. Advances in Agronomy, v. 69, p. 99-151, 2000.
8070605040302010
0
9,72
Penergetic® technology
Local Producer’s Standard
Penergetic® technology
Local Producer’s Standard
Penergetic® technology
Local Producer’s Standard
53,81
16,63
58,81
26,15
73,05Average dose application P2O5 (season 2013/2014)
P 2O5 A
pplic
ation
(kg/
ha)
Southern Region Southeastern region Midwestern region
Figure 1. Average dose application P2O5 in the South, Southeast and Midwest in trials side by side between Penergetic® technology and local producer’s standard fertilization. (Harvest 2013/2014).
3506,8
3151,15
3509,63230 3313,8
3139,8
4000
3500
3000
2500
2000
1500
Prod
uctiv
ity (k
g / h
a)
Average Soybean Productivity (season 2013/2014)
Penergetic® technology
Local Producer’s Standard
Penergetic® technology
Local Producer’s Standard
Penergetic® technology
Local Producer’s Standard
Southern Region Southeastern region Midwestern region
Figure 2. Average productivity of soybeans in the South, Southeast and Midwest in trials side by side with Penergetic® technology and local producer’s standard fertilization. (Harvest 2013/2014).
75
60
45
30
15
0
14,2
65,9
31,8
70,4
18,9
61,6
Penergetic® technology
Local Producer’s Standard
Penergetic® technology
Local Producer’s Standard
Penergetic® technology
Local Producer’s Standard
P 2O5 A
pplic
ation
(kg/
ha)
Southern Region Southeastern region Midwestern region
Average dose application P2O5 (season 2014/2015)
Figure 3. Average dose application of P2O5 in the South, Southeast and Midwest in trials side by side between Penergetic® technology and local producer’s standard fertilization (Harvest 2014/2015).
44284218
3660 3480
40623834
50004500400035003000250020001500
Prod
uctiv
ity (k
g / h
a)
Average Soybean Productivity (season 2014/2015)
Penergetic® technology
Local Producer’s Standard
Penergetic® technology
Local Producer’s Standard
Penergetic® technology
Local Producer’s Standard
Southern Region Southeastern region Midwestern region
Figure 4. Average productivity of soybeans in the South, Southeast and Midwest in trials side by side with Penergetic® technology and local producer’s standard fertilization (Harvest 2014/2015).
60
Effect of Penergetic® P and Penergetic® K on soybean production
Tarcísio Cobucci, Doutor em Fitotecnia/Integração Assessoria Agrícola
INTRODUCTION
Crops’ need for phosphorus is generally lower than that for potassium (K) and nitrogen (N), however, the amount applied is typically higher (Vieira, 2006). This is due to the high P fixation rate in tropical soils, mainly caused by precipitation with Fe and Al, reaction with hydrated oxides of these metals and reaction with silicate clays. Because of this, phosphorus utilization in crops varies from 5% to 25% (Malavolta, 1980). In this sense, there may be elevated levels of phosphorus in the soil without increased availability to plants. Thus, the development of technologies that provide greater availability of phosphorus for plants could provide a reduction in the amount of phosphate fertilizers applied to the soil, causing economic and environmental gains, since these fertilizers are produced from non-renewable mineral reserves (Pelá et al., 2009).
The Penergetic® technology consists of the application of Penergetic® K and P products, using bentonite clay and / or calcium carbonate as vehicles, which are subjected to the application of electric and magnetic fields (Brito et al., 2012). These products, according to the manufacturer, are used as a soil bioactivator (Penergetic® K, applied to the soil), which increases and balances the microbiological activity in the soil, and a plant bioactivator (Penergetic® P), which provides more energy to the photosynthetic process and facilitates beneficial plant-microbe interactions (Penergetic®, 2013). There are already promising results from the use of these products in wheat (Pekarskas, 2012;. Kadziuliene et al, 2005), vegetables (Jankauskiene et al., 2009), common bean (Brito et al, 2012.) and potato (Jakiene et al., 2008).
OBJECTIVE
This study aimed to evaluate the effects of Penergetic® K and Penergetic® P in soybean production, as well as to validate the recommendations of phosphorus and potassium fertilization in the field.
61
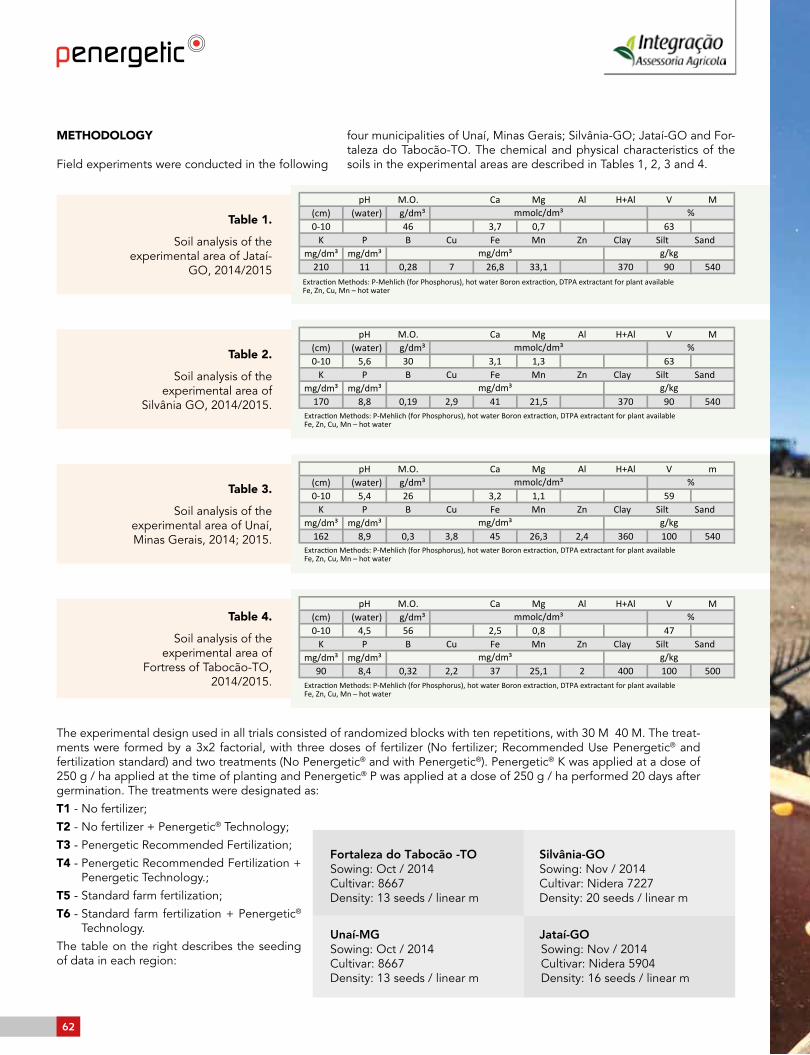
Table 4.
Soil analysis of the experimental area of
Fortress of Tabocão-TO, 2014/2015.
pH M.O. Ca Mg Al H+Al V M(cm) (water) g/dm³0- 748,05,2655,401
K P B Cu Fe Mn Zn Clay Silt Sandmg/dm³ mg/dm³
90 8,4 0,32 2,2 37 25,1 2 400 100 500
%³md/clomm
gk/g³md/gm
Extraction Methods: P-Mehlich (for Phosphorus), hot water Boron extraction, DTPA extractant for plant available Fe, Zn, Cu, Mn – hot water
Table 1.
Soil analysis of the experimental area of Jataí-
GO, 2014/2015
pH M.O. Ca Mg Al H+Al V M(cm) (water) g/dm³0- 367,07,36401
mg/dm³ mg/dm³210 11 0,28 7 26,8 33,1 370 90 540
%³md/clomm
gk/g³md/gm
Extraction Methods: P-Mehlich (for Phosphorus), hot water Boron extraction, DTPA extractant for plant available Fe, Zn, Cu, Mn – hot water
K P B Cu Fe Mn Zn Clay Silt Sand
Table 2.
Soil analysis of the experimental area of
Silvânia GO, 2014/2015.
pH M.O. Ca Mg Al H+Al V M(cm) (water) g/dm³0- 363,11,3036,501
K P B Cu Fe Mn Zn Clay Silt Sandmg/dm³ mg/dm³
170 8,8 0,19 2,9 41 21,5 370 90 540
%³md/clomm
gk/g³md/gm
Extraction Methods: P-Mehlich (for Phosphorus), hot water Boron extraction, DTPA extractant for plant available Fe, Zn, Cu, Mn – hot water
Table 3.
Soil analysis of the experimental area of Unaí, Minas Gerais, 2014; 2015.
pH M.O. Ca Mg Al H+Al V m(cm) (water) g/dm³0- 951,12,3624,501
K P B Cu Fe Mn Zn Clay Silt Sandmg/dm³ mg/dm³
162 8,9 0,3 3,8 45 26,3 2,4 360 100 540
%³md/clomm
gk/g³md/gm
Extraction Methods: P-Mehlich (for Phosphorus), hot water Boron extraction, DTPA extractant for plant available Fe, Zn, Cu, Mn – hot water
METHODOLOGY
Field experiments were conducted in the following
four municipalities of Unaí, Minas Gerais; Silvânia-GO; Jataí-GO and For-taleza do Tabocão-TO. The chemical and physical characteristics of the soils in the experimental areas are described in Tables 1, 2, 3 and 4.
The experimental design used in all trials consisted of randomized blocks with ten repetitions, with 30 M 40 M. The treat-ments were formed by a 3x2 factorial, with three doses of fertilizer (No fertilizer; Recommended Use Penergetic® and fertilization standard) and two treatments (No Penergetic® and with Penergetic®). Penergetic® K was applied at a dose of 250 g / ha applied at the time of planting and Penergetic® P was applied at a dose of 250 g / ha performed 20 days after germination. The treatments were designated as:
T1 - No fertilizer;
T2 - No fertilizer + Penergetic® Technology;
T3 - Penergetic Recommended Fertilization;
T4 - Penergetic Recommended Fertilization + Penergetic Technology.;
T5 - Standard farm fertilization;
T6 - Standard farm fertilization + Penergetic®
Technology.
The table on the right describes the seeding of data in each region:
Unaí-MG
Fortaleza do Tabocão -TOSowing: Oct / 2014Cultivar: 8667Density: 13 seeds / linear m
Sowing: Oct / 2014Cultivar: 8667Density: 13 seeds / linear m
Sowing: Nov / 2014Cultivar: Nidera 5904Density: 16 seeds / linear m
Sowing: Nov / 2014Cultivar: Nidera 7227Density: 20 seeds / linear m
Silvânia-GO
Jataí-GO
62
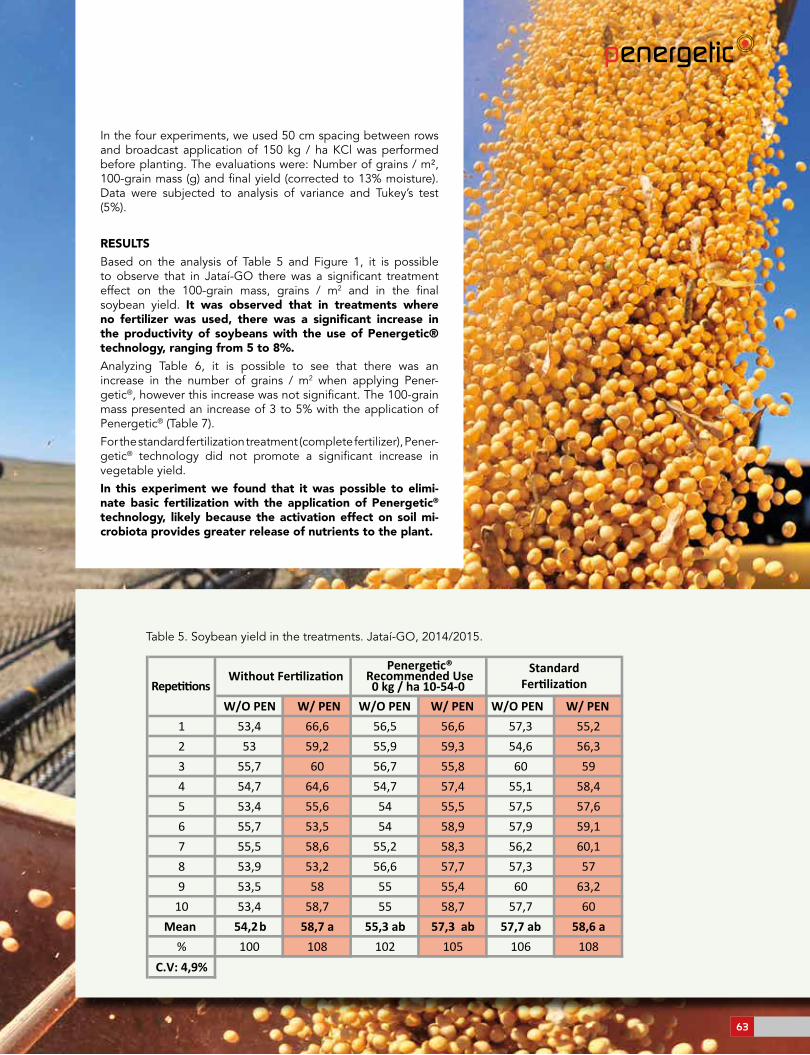
In the four experiments, we used 50 cm spacing between rows and broadcast application of 150 kg / ha KCl was performed before planting. The evaluations were: Number of grains / m², 100-grain mass (g) and final yield (corrected to 13% moisture). Data were subjected to analysis of variance and Tukey’s test (5%).
RESULTS
Based on the analysis of Table 5 and Figure 1, it is possible to observe that in Jataí-GO there was a significant treatment effect on the 100-grain mass, grains / m2 and in the final soybean yield. It was observed that in treatments where no fertilizer was used, there was a significant increase in the productivity of soybeans with the use of Penergetic® technology, ranging from 5 to 8%.
Analyzing Table 6, it is possible to see that there was an increase in the number of grains / m2 when applying Pener-getic®, however this increase was not significant. The 100-grain mass presented an increase of 3 to 5% with the application of Penergetic® (Table 7).
For the standard fertilization treatment (complete fertilizer), Pener- getic® technology did not promote a significant increase in vegetable yield.
In this experiment we found that it was possible to elimi-nate basic fertilization with the application of Penergetic® technology, likely because the activation effect on soil mi-crobiota provides greater release of nutrients to the plant.
1 53,4 66,6 56,5 56,6 57,3 55,22 53 59,2 55,9 59,3 54,6 56,33 55,7 60 56,7 55,8 60 594 54,7 64,6 54,7 57,4 55,1 58,45 53,4 55,6 54 55,5 57,5 57,66 55,7 53,5 54 58,9 57,9 59,17 55,5 58,6 55,2 58,3 56,2 60,18 53,9 53,2 56,6 57,7 57,3 579 53,5 58 55 55,4 60 63,2
10 53,4 58,7 55 58,7 57,7 6054,2Mean b 58,7 a 55,3 ab 57,3 ab 57,7 ab 58,6 a
% 100 108 102 105 106 108C.V: 4,9%
RepetitionsWithout Fertilization
Penergetic®Recommended Use0 kg / ha 10-54-0
StandardFertilization
W/O PEN W/ PEN W/O PEN W/ PEN W/O PEN W/ PEN
Table 5. Soybean yield in the treatments. Jataí-GO, 2014/2015.
63
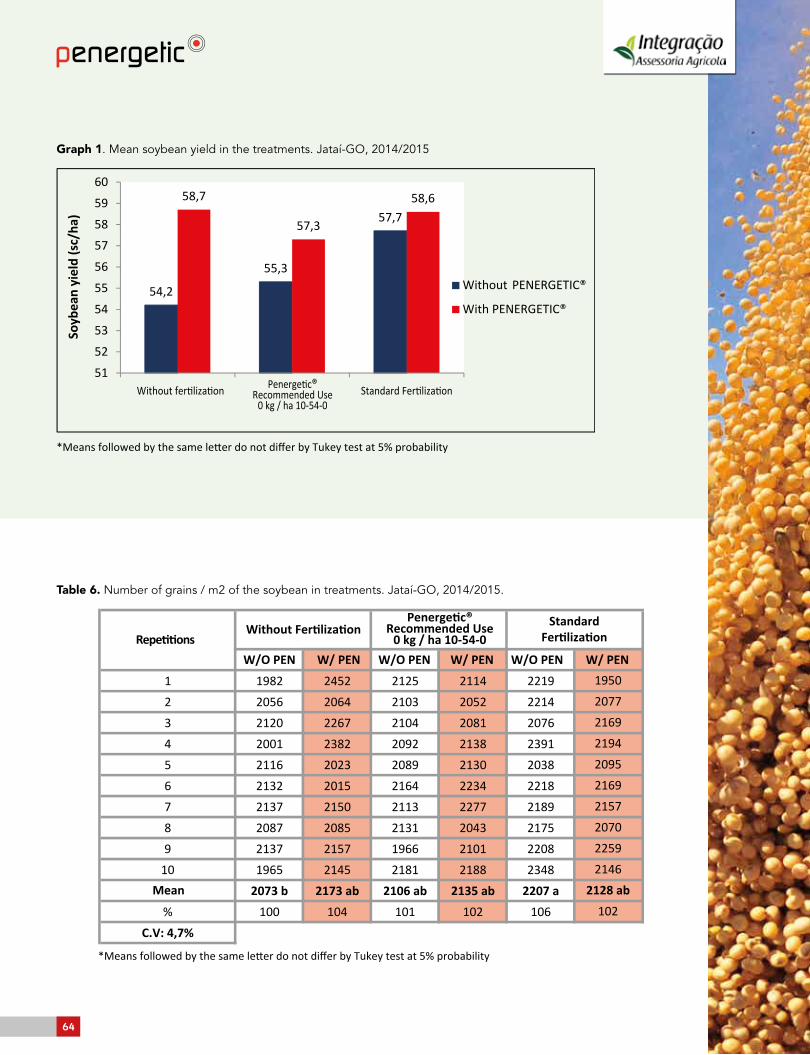
*Means followed by the same letter do not differ by Tukey test at 5% probability
54,2
55,3
57,7
58,7
57,3
58,6
51
52
53
54
55
56
57
58
59
60
Without fertilization Penergetic®Recommended Use
0 kg / ha 10-54-0Standard Fertilization
Soyb
ean
yiel
d (s
c/ha
)
With PENERGETIC®
Without
PENERGETIC®
Graph 1. Mean soybean yield in the treatments. Jataí-GO, 2014/2015
1 1982 2452 2125 2114 22192 2056 2064 2103 2052 22143 2120 2267 2104 2081 20764 2001 2382 2092 2138 23915 2116 2023 2089 2130 20386 2132 2015 2164 2234 22187 2137 2150 2113 2277 21898 2087 2085 2131 2043 21759 2137 2157 1966 2101 2208
10 1965 2145 2181 2188 23482073 b 2173 ab 2106 ab 2135 ab 2207 a
% 100 104 101 102 106C.V: 4,7%
*Means followed by the same letter do not differ by Tukey test at 5% probability
102
22592146
2128 ab
216921572070
216921942095
19502077
Without Fertilization
Mean
RepetitionsW/O PEN W/ PEN W/O PEN W/ PEN W/O PEN W/ PEN
Penergetic®Recommended Use
0 kg / ha 10-54-0Standard
Fertilization
Table 6. Number of grains / m2 of the soybean in treatments. Jataí-GO, 2014/2015.
64
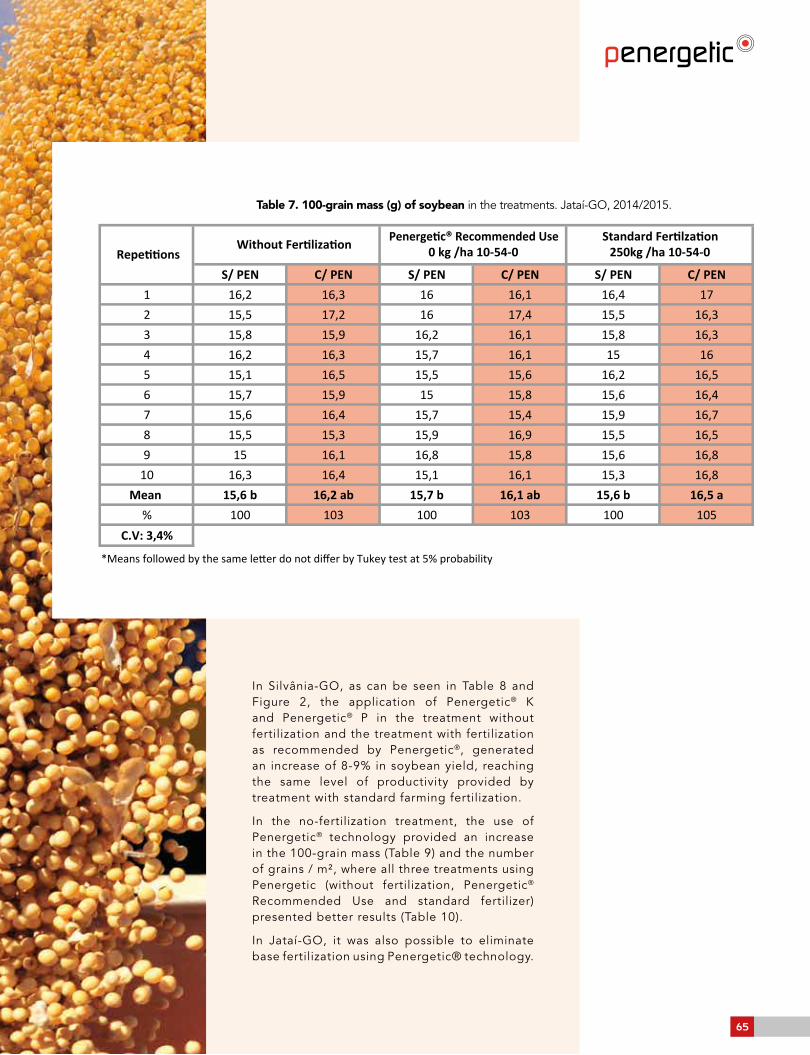
Table 7. 100-grain mass (g) of soybean in the treatments. Jataí-GO, 2014/2015.
S/ PEN C/ PEN S/ PEN C/ PEN S/ PEN C/ PEN1 16,2 16,3 16 16,1 16,4 172 15,5 17,2 16 17,4 15,5 16,33 15,8 15,9 16,2 16,1 15,8 16,34 16,2 16,3 15,7 16,1 15 165 15,1 16,5 15,5 15,6 16,2 16,56 15,7 15,9 15 15,8 15,6 16,47 15,6 16,4 15,7 15,4 15,9 16,78 15,5 15,3 15,9 16,9 15,5 16,59 15 16,1 16,8 15,8 15,6 16,8
10 16,3 16,4 15,1 16,1 15,3 16,8Mean 15,6 b 16,2 ab 15,7 b 16,1 ab 15,6 b 16,5 a
% 100 103 100 103 100 105C.V: 3,4%
RepetitionsWithout Fertilization Penergetic® Recommended Use
0 kg /ha 10-54-0Standard Fertilzation
250kg /ha 10-54-0
*Means followed by the same letter do not differ by Tukey test at 5% probability
In Silvânia-GO, as can be seen in Table 8 and Figure 2, the application of Penergetic® K and Penergetic® P in the treatment without fertilization and the treatment with fertilization as recommended by Penergetic®, generated an increase of 8-9% in soybean yield, reaching the same level of productivity provided by treatment with standard farming fertilization.
In the no-fertilization treatment, the use of Penergetic® technology provided an increase in the 100-grain mass (Table 9) and the number of grains / m², where all three treatments using Penergetic (without fertilization, Penergetic® Recommended Use and standard fertilizer) presented better results (Table 10).
In Jataí-GO, it was also possible to eliminate base fertilization using Penergetic® technology.
65

1 56,8 63 59,2 59,8 63,9 62,92 52,5 60,7 57,3 59,5 65,3 63,33 58,5 59,5 60,2 66,3 63,1 65,64 59,3 63,2 56,4 60,4 62,6 59,35 58,9 66,7 56,2 60,6 57,3 65,56 56 59,5 58,8 59,2 63,9 62,17 58,1 61,1 54,1 60,8 61,8 61,48 54,6 64,4 59 63 68,1 62,29 54,5 56,4 58,4 58,8 64 67,1
10 55,9 60,1 59 62,6 67,9 62,656,5 c 61,4 ab 57,8 bc 61,1 ab 63,7 a 63,2 ab
% 100 109 102 108 113 112C.V: 4,3%
*Means followed by the same letter do not differ by Tukey test at 5% probability
100 kg 5-37-00
300 kg 5-37-00Without fertilization
Mean
RepetitionsW/O PEN W/ PEN W/O PEN W/ PEN W/O PEN W/ PEN
Penergetic® Recommended Use Standard Fertilization
Table 8. Soybean yield (sc / ha) by treatment. Silvânia-GO, 2014/2015.
Graph 2. Average soybean yield in the treatments. Silvânia-GO, 2014/2015.
56,557,8
63,7
61,4 61,1
63,2
52
54
56
58
60
62
64
66
(100 kg/ha 05-37-00) (300 kg/ha 5-37-00)
Without fertilization Penergetic®
Recommended Use Standard Fertilization
Soyb
ean
yiel
d (s
c/ha
)
With PENERGETIC®
Without PENERGETIC®
66

1 17,9 18,7 18,6 17,4 19,2 182 17,7 18,6 18,6 18,3 19,6 18,13 18,3 18,4 18,6 18,1 19,3 18,74 19,1 18,4 17,6 18,4 18,4 18,35 17,7 18,4 18,4 17,4 17,9 18,56 18,2 17,8 17,9 17,5 18,5 18,77 17,6 18,8 19,6 17,8 18,3 18,88 17,6 18,5 18,6 17,5 18,9 18,89 17,6 18,7 18,4 18,5 19,6 18,8
10 17,1 18,5 18,5 17,9 18,5 1917,8 b 18,4 ab 18,4 ab 17,8 b 18,8 a 18,5 a
% 100 103 103 100 105 104C.V: 4,4%
*Means followed by the same letter do not differ by Tukey test at 5% probability
100 kg 5-37-00 300 kg 5-37-00Without Fertilization
Mean
RepetitionsW/O PEN W/ PEN W/O PEN W/ PEN W/O PEN W/ PEN
Penergetic® Recommended Use Standard Fertilization
1 1906 2015 1906 1998 2002 20992 1777 1956 1847 1946 1995 21053 1921 1945 1941 2195 1961 21114 1863 2063 1925 1971 2043 19505 1993 2177 1828 1951 1918 21296 1844 2002 1971 2031 2077 19957 1978 1947 1654 2046 2026 19598 1861 2088 1908 2162 2166 19899 1860 1808 1903 1907 1954 2143
10 1966 1954 1919 1994 2208 19721897 b 1996 ab 1880 b 2020 a 2035 a 2045 a
% 100 105 99 106 107 108C.V: 2,5%
*Means followed by the same letter do not differ by Tukey test at 5% probability
100 kg 5-37-00 300 kg 5-37-00Without fertilization
Mean
RepetitionsW/O PEN W/ PEN W/O PEN W/ PEN W/O PEN W/ PEN
Penergetic® Recommended Use Standard Fertilization
Table 9. 100-grain mass of soybean in the treatments. Silvânia-GO, 2014/2015.
Table 10. Number of grains / m2 of soybean in the treatments. Silvânia-GO, 2014/2015
67

In the municipality of Fortaleza do Tabocão, in Tocantins state, as shown in Table 12 and Chart 4, the application of Penergetic® promoted a 3% increase in soybean yield in the treatment without fertilization. This result did not differ
statistically from the treatment with standard fertilization used by the farm.
The highest yield was achieved with the fertilizer adjusted according to Penergetic recommendations and application of Penergetic® technology, yielding 53.5 SC / ha (Table 12 - Chart 4).
In the experiment performed in Unaí, Minas Gerais, as shown in Table 11 and Figure 3, the application of Penergetic® promoted a 7% increase in soybean yield in the treatment without fertilization, which was not statistically different from the result for standard fertilization.
1 50,2 54,5 53 58,3 55,2 54,82 45,7 51,5 48,4 60,8 49,1 54,53 45,1 54,8 47,7 58 51,8 58,34 50,4 49,6 51,7 53,2 51,7 635 49,3 48,6 47,3 55,2 49,3 51,26 51,4 51,6 54,4 55,1 47,4 56,57 47,5 54,3 51,1 58,3 55,7 51,38 46,7 51,4 52 62 59,7 55,99 51,2 52,4 50,7 54 54,4 56,2
10 49,5 51 49,7 55,8 50,2 57,348,7 d 51,9 cd 50,6 cd 57,0 a 52,4 bc 55,8 ab
% 100 107 104 117 108 115C.V: 5,3%
*Means followed by the same letter do not differ by Tukey test at 5% probability
100 kg 5-37-00 300 kg 5-37-00Without Fertilization
Mean
RepetitionsW/O PEN W/ PEN W/O PEN W/ PEN W/O PEN W/ PEN
Penergetic® Recom.Use Standard Fertilization
Table 11.
Soybean yield (sc / ha)
by treatment. Unaí- MG, 2014/2015
48,7
50,6
52,451,9
5755,8
44
46
48
50
52
54
56
58
Withoutfertilization
Penergetic® Rec. Use(150 kg/ha 0-24-0)
(380 kg/ha 0-24-0)
Without PENERGETIC®
With PENERGETIC®
Standard Fertilization
Soyb
ean
yiel
d (s
c/ha
)
The best result for soybean yield was obtained in the treatment where the fertilizer was adjusted according to Penergetic® recommendations for use and a combination of Penergetic® K and Penergetic® P was used (Table 11 - Chart 3).
Graph 3. Average soybean yield in the treatments.
Unaí-MG, 2014/2015
68

W/O PEN W/ PEN W/O PEN W/ PEN W/O PEN W/ PEN 1 45,6 47,8 52,3 54,6 54,3 54,72 47,4 48,8 53,2 53,4 50,6 57,43 51,4 52,6 50,4 56,4 53,1 52,44 50,6 50,7 51,3 48,7 48,5 53,65 47,6 53,7 49,7 49,9 53,2 54,86 48,7 49,1 48,7 53,5 54,9 55,97 51 53,6 52,4 54,3 56,4 52,48 52,6 48,6 55,3 50,9 50,3 50,49 49,9 53,4 51,4 55,3 52,4 48,9
10 51,2 51,5 50,8 58,3 53,6 50,349,6 b 51,0 ab 51,6 ab 53,5 a 52,7 a 53,1 a
% 100 103 104 108 106 107C.V: 4,5%
0 kg /ha 10-54-0 250kg /ha 10-54-0
*Means followed by the same letter do not differ by Tukey test at 5% probability
Without Fertilization
Mean
RepetitionsPenergetic® Recom.Use Standard Fertilization
Table 12.Soybean yield
(sc / ha)
by treatment. Unaí- MG, 2014/2015
Graph 4. Average soybean yield in the
treatments. Fortaleza do Tabocão, Tocantins,
2014/2015.49,6
51,6
52,7
51
53,553,1
47
48
49
50
51
52
53
54
(0 kg/ha 10-54-0) (250 kg/ha 10-54-0)
Without fertilization Penergetic®
Recommended Use Standard Fertilization
Soyb
ean
yiel
d (s
c/ha
)
With PENERGETIC®
Without PENERGETIC®
CONCLUSIONS
The use of Penergetic® technology promoted increases of between 6 and 8% in soybean yields in the mean of the four experiments.This increase in productivity is directly related to the increase in the num-ber of grains / m2, as well as the increase of the grain mass, also observed with the use of Penergetic® K and Penergetic® P.
In all the sites studied, the use of Penergetic® technology combined with an adjustment in the base fertilization, promoted a reduction in the use of fertilizers, without significant losses in soybean production, in comparison to pro-ductivity levels obtained with standard farm fertilizing.
69

70