42
Taking Control of Your Managed Care Destiny AJAS 2017 April 3, 2017

Taking Control of Your Managed Care Destiny
AJAS 2017 April 3, 2017

All Roads Lead to Managed Care
• Medicare Advantage
• Special Needs Plans
• Dual Demos
• Medicaid Managed LTC
• Medicare FFS – ACOs
– Bundling
– PPS Reform
– Value-Based Purchasing / IMPACT Act
– Unified PAC Assessment & Payment
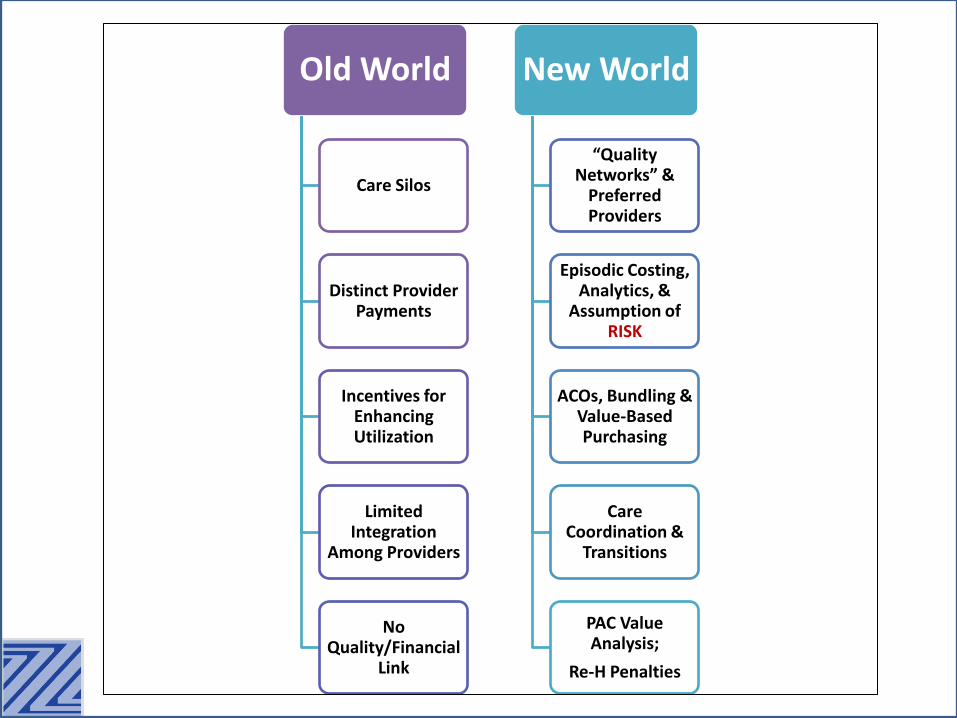
Old World
Care Silos
Distinct Provider Payments
Incentives for Enhancing Utilization
Limited Integration
Among Providers
No Quality/Financial
Link
New World
“Quality Networks” &
Preferred Providers
Episodic Costing, Analytics, &
Assumption of RISK
ACOs, Bundling & Value-Based Purchasing
Care Coordination &
Transitions
PAC Value Analysis;
Re-H Penalties

PAC is “Hot”
• As such a small part of the total Medicare spend, why is there so much attention on post-acute / SNF care? – Our profit margins are very high relative to other
sectors
– We have a payment system that does not align well with cost (predictive power)
– We have the most cost variability of any sector
– Patient placement has been arbitrary with little correlation to outcomes (patient choice)
– The system is ripe for “Rationalization”

The Future of LTC?
• My thoughts (global market trends):
– Healthcare will remain a “local business”
– Divestiture from large national chains as they experience management challenges and struggle under highly leveraged transactions
– Many facilities, especially new players, will suffer under highly leveraged purchases
– Strong “Regional” operators
– Acceleration of “Boutique” post-acute care

The Future of LTC?
• My thoughts (operational issues):
– Significant impact of healthcare reform in some markets, but little impact in others, especially rural
– Risk slowly introduced to LTC providers as payment systems transition
• Management and Scale required to succeed???
– Move toward outsourcing therapy and billing
– Advancements in Analytics and Care Management technology
– Ongoing rate pressure from Government spending constraints
– Major PPS reform followed by adoption of Unified PAC

APM Impact on SNFs
• http://kff.org/report-section/payment-and-delivery-system-reform-in-medicare-report/
• ACOs and Bundles reduce SNF admissions and LOS – In first 2 years, SNF spending decreased by > 20% for ACO population
– Average H LOS for BCPI patients dropped from 3.58 days to 2.96 days
– Hospital readmissions decreased at the 30, 60 & 90-day benchmarks
– Average Medicare costs for each bundled episode of care decreased from $34,249 (year 1) to $27,541 (year 3)
– BCPI Model 2 (hospitals + post-acute) episodes had lower PAC spending than non-BPCI episodes
• Reduction attributable to decrease in use of SNF services and hospital readmission while Home Health increased
• Discharges to rehab facilities fell from 44% to 28%
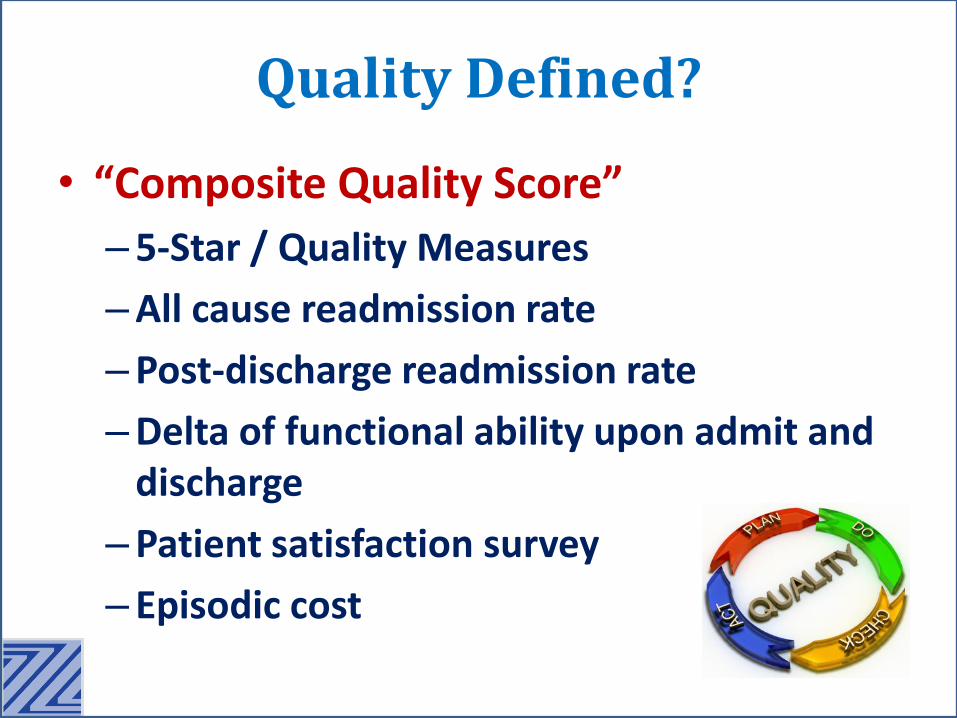
Quality Defined?
• “Composite Quality Score”
–5-Star / Quality Measures
–All cause readmission rate
–Post-discharge readmission rate
–Delta of functional ability upon admit and discharge
–Patient satisfaction survey
– Episodic cost
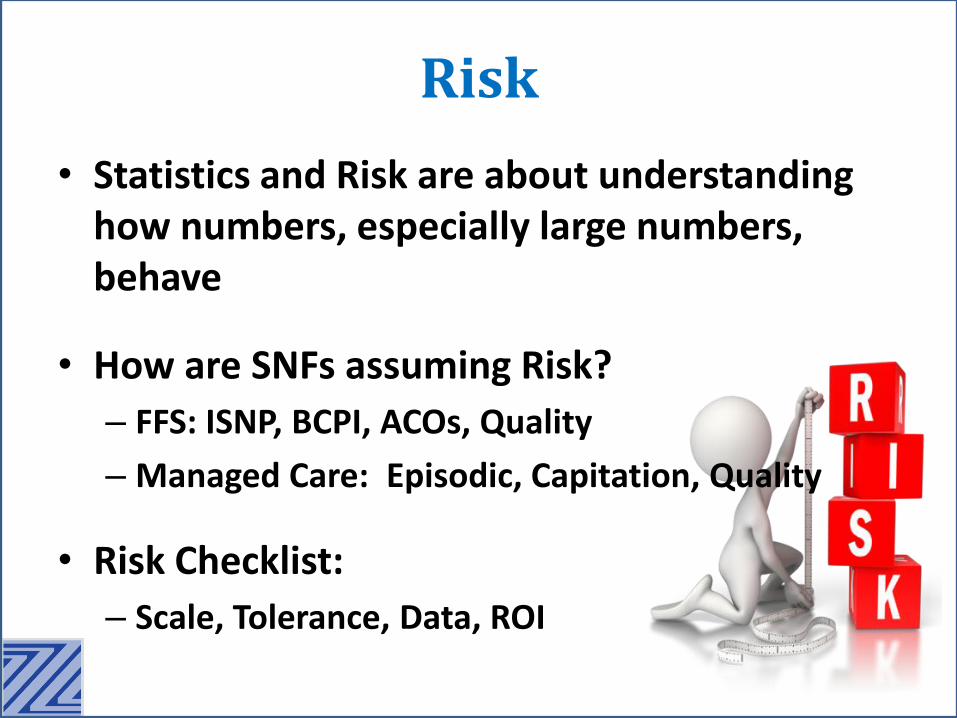
Risk
• Statistics and Risk are about understanding how numbers, especially large numbers, behave
• How are SNFs assuming Risk?
– FFS: ISNP, BCPI, ACOs, Quality
– Managed Care: Episodic, Capitation, Quality
• Risk Checklist:
– Scale, Tolerance, Data, ROI
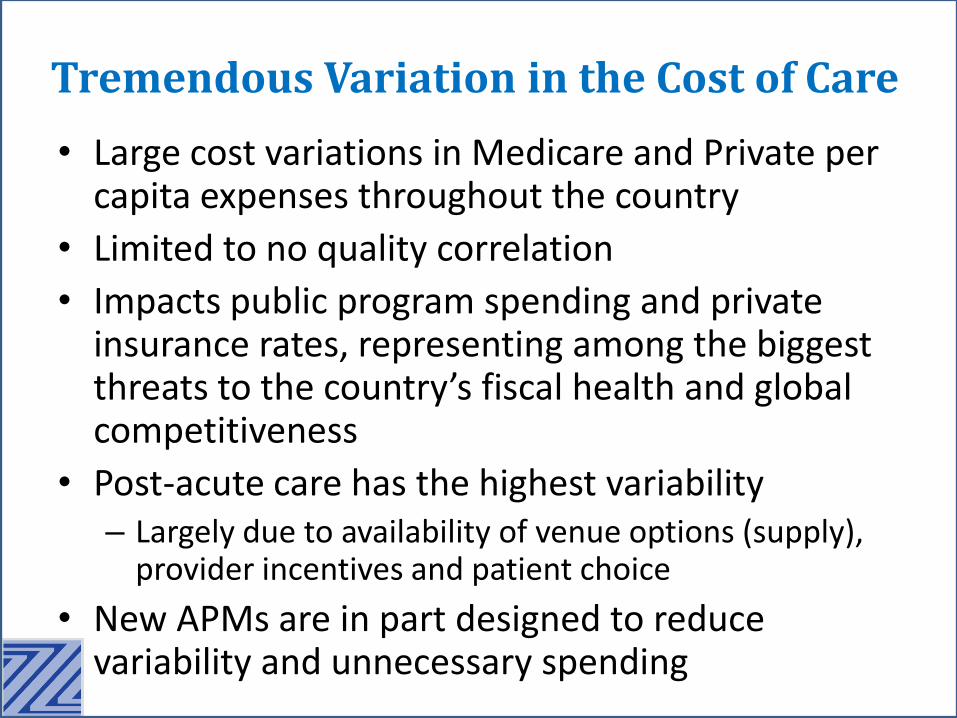
Tremendous Variation in the Cost of Care
• Large cost variations in Medicare and Private per capita expenses throughout the country
• Limited to no quality correlation
• Impacts public program spending and private insurance rates, representing among the biggest threats to the country’s fiscal health and global competitiveness
• Post-acute care has the highest variability – Largely due to availability of venue options (supply),
provider incentives and patient choice
• New APMs are in part designed to reduce variability and unnecessary spending

Medicare v. Private Healthcare Costs
http://www.nytimes.com/interactive/2015/12/15/upshot/the-best-places-for-better-cheaper-health-care-arent-what-experts-thought.html?_r=1


Mapping Medicare Disparities
https://data.cms.gov/mapping-medicare-disparities
The Current PPS is Broken
• Quantity v. Quality
• Utilization v. Diagnosis
• Heavily audited
• Market forces putting downward pressure on utilization
• PPS “refinements” have not addressed key short-comings:
– MDS 3.0 / RUG-IV, Individual Therapy, Therapy Caps, etc.

Medicare FFS SNF Utilization Changes
% Change
Volume Measure 2008 2010 2012 2013 2014 2008 - 2014
Admissions / 1,000 Beneficiaries
73
72
68
67
66 -9.6%
Days / 1,000 Beneficiaries
1,977
1,938
1,861
1,835
1,808 -8.5%
Covered Days / Admission
27.0
27.1
27.4
27.6
27.6 2.2%
Why?? • ACOs • Bundling • Growth of Observation Stays

But There is Good News

Medicare PPS Payment Reform
• Possible implementation 10/1/18???
• 5 payment domains; 4 of which are clinically driven (PT/OT, ST, NTA, Nursing, Overhead)
• Rate combinations: 100k?, 200k?
• Not driven by therapy utilization
• Day weight adjustment
• Budget neutral – “winners” and “losers”
• Will have broad operations impact, most notably on the provision of therapy and medical acuities

Medicare Benchmarking
• Start thinking “Episodic” – National “Episodic” cost (based on
“Standardized” Medicare rates) = $10,919
• https://www.cms.gov/Research-Statistics-Data-and-Systems/Statistics-Trends-and-Reports/Medicare-Provider-Charge-Data/SNF.html
– 2.5M stays in 2013 (21% were multiple admissions per beneficiary)
– CMS breaks down data by provider for individual facility benchmarking to peer group

SNF Average Standardized Payment per Stay
National average = $10,919 Highest average: IN = $12,406, TX = 12,064, CA = $11,862 Lowest average: ND = $8,154, ME = $8,959, AK = $8,854

Claim Analytics
20
Massachusetts General Hospital (MGH)
SNF (#)
Referrals (%)
Referrals ALOS Avg. Rate
Episodic Cost 5 Star Re-Hosp (%)
Spaulding (North End) 323 8.0% 18 $542.57 $9,766 * 22.9%
Leonard Florence Center 222 5.5% 23 $660.39 $15,189 *** 24.2%
Lighthouse Nursing 165 4.1% 30 $638.63 $19,159 **** 22.5%
Eastpointe Rehabilitation 142 3.5% 55 $626.53 $34,459 **** 14.3%
Chelsea Center 103 2.6% 33 $577.92 $19,071 * 25.6%
Brudnick Center 91 2.3% 22 $609.78 $13,415 **** 23.7%
Chelsea Jewish 69 1.7% 34 $631.36 $21,466 ***** 24.5%
Aberjona Nursing 64 1.6% 26 $692.97 $18,017 **** 24.5%
Courtyard Nursing 61 1.5% 40 $601.97 $24,079 *** 23.6%
Don Orione 60 1.5% 64 $498.88 $31,928 ** 16.3%

Cost By Diagnosis
21
Aftercare of Joint Replacement
Skilled Nursing Facility Medicare Payments Total Claims $ Per Claim
TCU at Spaulding Hospital North Shore $246,037 42 $5,858
Newbridge on the Charles $293,974 32 $9,187
Brudnick Center $92,410 21 $4,400
Sherrill House $94,994 19 $5,000
Erickson Living Linden Ponds $99,221 18 $5,512
Woodbriar of Wilmington $66,285 17 $3,899
Marina Bay Nursing $76,497 15 $5,100
Alliance Health of Mass $62,855 13 $4,835
HealthSouth New England $55,890 13 $4,299
EPOCH Senior Health Care of Weston $40,875 11 $3,716
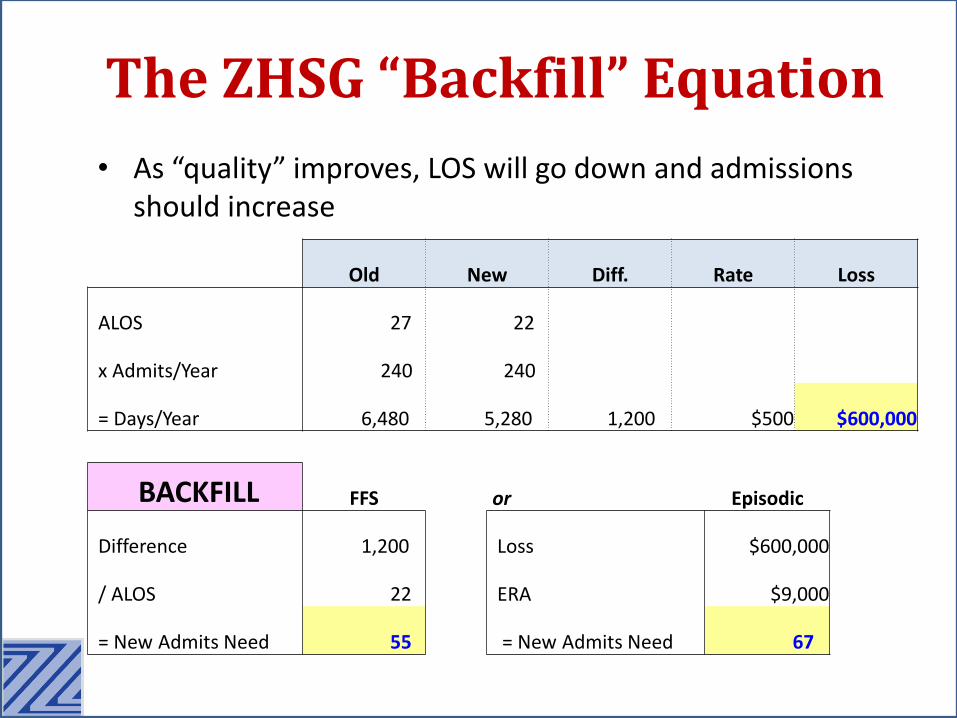
Old New Diff. Rate Loss
ALOS 27 22
x Admits/Year 240 240
= Days/Year 6,480 5,280 1,200 $500 $600,000
BACKFILL FFS
Difference 1,200
/ ALOS 22
= New Admits Need 55
The ZHSG “Backfill” Equation
• As “quality” improves, LOS will go down and admissions should increase
or Episodic
Loss $600,000
ERA $9,000
= New Admits Need 67

Medicare Advantage
• De-facto Medicare Reform?
• Enrollment continues to rise and accelerate
– Health systems aggressively entering the market
– All SNF utilization indicators are lower than FFS
• Site of service, admits/1,000, rate, LOS, collection time
• SNFs often grossly mismanaging the revenue cycle for this population resulting in significant lost revenue


25

PAYMENT
SNF FFS MA %
Diversicare $452 $383 18.0%
Ensign Group $566 $418 35.4% Kindred $570 $450 26.7% Genesis $502 $488 12.1%
MA vs. FFS
26
FFS MA
(100% RUG Rate) MA
(Levels)
Per Diem Rate $500 $500 $350
Receipt of Payment (days) 14 45 45
ALOS (days) 27 14 14
Revenue (per admit) $13,500 $7,000 $4,900

CASE MANAGEMENT
NURSING REHAB BILLING SOCIAL
SERVICES MDS PHARMACY
DISCHARGE PLANNING
MEDICAL RECORDS
ADMISSIONS
MA Management is Fragmented
Admissions MDS Nursing Rehab Social Services Medical Records Billing Discharge Planning
ADMISSIONS
Contract Review, Levels,
Rates, Contract Exclusions, Clinical Criteria
CASE MANAGEMENT?
MCO
MCO

MA Pitfalls
• Old rate structures
• No follow up on incorrectly paid claims (contract/billed/paid rate mismatch)
• Individual therapy minutes (often in excess of level)
• Failure to receive timely prior authorization
• No case management on Rate Exclusions
• Poor management of acuity change between auths
• Denials “gone wild” and not appealed
• No follow up on Part B payments
• Not submitting “Utilization Claims”
• Failure to manage co-pay/bad debt

• SNPs are optional Medicare Adv. programs designed to improve quality & reduce costs for specific populations
– Institutional SNP (ISNP) applies to long-term care / SNFs
• Authorized By Medicare Modernization Act (MMA) of 2003 (would not be impacted by ACA repeal)
• ISNPs enroll only Medicare (A & B) eligible LTC residents (regardless of primary payer)
• Goal is to improve outcomes and reduce costs (esp. hospital admissions) through improved coordination of care management and enhanced clinical protocols
– Use of Nurse Practitioners and emerging care management resources (e.g. TeleHealth, Technology)
Special Needs Plans

2016 ISNP Enrollment Total U.S. 55,439 Source: Kaiser Family Foundation
New York 16,474 29.7% Indiana 753 1.4%
Florida 3,840 6.9% Oregon 748 1.3%
Pennsylvania 3,383 6.1% Delaware 520 0.9%
Connecticut 2,912 5.3% Nevada 514 0.9%
Maryland 2,870 5.2% Missouri 314 0.6%
Colorado 2,772 5.0% New Mexico 301 0.5%
Georgia 2,541 4.6% Alabama 262 0.5%
North Carolina 2,457 4.4% Texas 229 0.4%
California 2,451 4.4% Kansas 228 0.4%
Arizona 2,192 4.0% Virginia 163 0.3%
New Jersey 1,898 3.4% Oklahoma 156 0.3%
Wisconsin 1,828 3.3% Massachusetts 132 0.2%
Washington 1,652 3.0% DC 80 0.1%
Rhode Island 1,599 2.9% Kentucky 79 0.1%
Ohio 1,131 2.0% Michigan 16 0.0%
Illinois 944 1.7% Remaining 20 - 0.0%

• How does contracting work?
• Do all my long-term care patients have to enroll?
• How does enrollment work?
• Do we still bill Medicare for enrolled patients?
• Do only Medicaid primary patients qualify?
• Does ISNP enrollment impact Medicaid CMI?
• How does my Medicare short-term re-hospitalization rate impact my performance?
• How does ISNP enrollment impact my therapy billing and relationship to my contract therapy company?
• Can I have more than one ISNP plan in my facility?
• What if we can’t effectively manage clinically?
The Most Common SNP Questions

The SNP Money Flow
• CMS pays the plan PMPM Premium for each enrolled beneficiary
– For purposes of this webinar, we will use $2,000 per member per month premium as an example
– Plan has overhead, ACA sets minimum spending % (“Medical Loss Ratio” or “MLR”)
– Enrolled residents are no longer “Fee-for-Service”
• PMPM Premium is based on the base rate per County adjusted by Hierarchical Condition Code (“HCC”) scoring per patient
• Goal is to optimize HCC scoring for highest PMPM
• 2017 base is reduced (causing Plan exit in some Counties)
– May be mitigated in part by improved HCC accuracy
• SNF may contract directly with the Plan or through an IPA
– If IPA used, payment may still flow directly to SNF

• How well do I manage clinical changes of my long-term care population?
• What additional resources will I need to reduce hospitalizations of my LTC population?
• Am I prepared to integrate third party clinical judgement into my care model?
• Family demands and expectations?
• What will my physicians think of this program? Am I prepared to “Care in Place” – Am I prepared to do so at “all hours”
– Is my nursing staff up to the challenge?
SNP Clinical Considerations

SNP Financial Considerations
• How much Medicare revenue am I generating from my long-term care population?
• How it works: – All Medicare payments, administration costs, NP, etc. must
be paid by Medicare Advantage plan from PMPM Premium
• Evaluate LTC – hospital admits (“Admits/1,000”) – Part A revenue derived from LTC population – What is my average Part A rate for LTC population?
• Part B therapy (billing, therapy company use, cap issues) & other ancillaries (are they related parties?)
• Medicaid rate – Higher rate makes SNP more attractive because days will
increase as Part A decreases

• Fixed PMPM to SNF for Medicare Part A “replacement” revenue
• Fixed PMPM to SNF for Medicare Part B “replacement” revenue (mostly therapy)
• Small allowances for additional Part B items (e.g. Blood Glucose test)
• Small PMPM for certain quality issues (e.g. immunizations, Survey, etc.)
• “Shared Savings” component: – Calculated as a percentage of remaining Premium after all
costs are deducted, including Plan administration – May include only “Upside” or both Upside and
“Downside” risk – Typically reconciled and paid 2 – 4 times per year
Contemporary ISNP Payment Model

Poor Candidates
Marginal Excellent
Candidates
Many LTC hospitalizations
High % of Part A $ from LTC population
High Part B ancillaries (esp. in-
house therapy)
Low MA rate
Few LTC hospitalizations
Low % of Part A $ from LTC
Low ancillaries/ outsourced therapy
Higher MA rate
The ISNP Equation

SNP EXAMPLE Calculation (all #s per month)
• CMS pays plan: $2,000 PMPM
• Plan pays SNF: $380 PMPM (Part A guaranty)
• Plan pays SNF: $50 PMPM (Part B guaranty)
• Plan pays SNF: $20 PMPM (Other incentives)
• Plan pays other: $850 average PMPM
• Plan admin: $100 PMPM
• Remaining: $600 PMPM
• SNF share (30%): $180 PMPM
• PMPM SNF revenue: $630 PMPM
• Enrollees per month x 100
• TOTAL SNF rev/mo: $63,000
– Compare this to current FFS

• Comparing historical Financial net revenue pre/post-SNP (for SNP population): Part A revenue from LTC population (1): $100,000 Less: Ancillary costs during stay (2): $ 10,000 Less: Additional Medicaid revenue (3): $ 40,000 Net Medicare revenue of LTC pop: $ 50,000 SNP revenue from participation $ 63,000 Net Impact of SNP participation $ 13,000
1. 100 residents, 6.77 average Part A census (200 days/month) at $500/day 2. Average $50/day in ancillary costs (therapy, pharmacy, lab, etc.) 3. Medicaid rate of $200 per day x 200 days Assumes a reduction in LTC hospitalizations required to achieve results from prior slide
SNP EXAMPLE Comparative Calculation

• “Upside / Downside” defined – “Skin in the game”
– Evaluate Risk Tolerance
– Who will manage risk in your facility?
• Change in mindset: Every dollar billed to Medicare for an enrolled patient negatively impacts the SNF’s financial performance – What does this include? EVERYTHING!
• Reinsurance considerations
Shared Savings Implications
• Amount of PMPM “Guaranty”
• Miscellaneous Incentive and Other Payments (e.g. Vaccinations, Blood Glucose, Surveys, etc.)
• “Diversion Days”
• % of Shared Savings; Upside / Downside
• Timeline of Shared Savings and Payment Schedule
• Options for Nurse Practitioner and Primary Care Physician Payments – Important if you want NP to see non-ISNP enrollees
So Many Variables…

Medicaid Managed Care
• Outlook: Negative to Neutral • Moving aggressively into LTC • Let’s define it
– Insurer risk or administrative pass-through?
– Provider protections
• Where will savings come from? – Get them out / Keep them out!
• How? To where?
– Reduced provider $ = Access problems – Service reduction?
• “You Can’t Manage a Medicaid Day”
• Total savings will not materialize unless the Medicare AND Medicaid benefit is managed

• Understand your local market
• Benchmark your outcomes
• Analyze your “value-profile”
• Build referral networks based on quality
• Manage growing MA revenue cycle
• Determine risk-tolerance
• Accept new realities of PAC!


