1 Target-Binding Conditional Carbon Tax & Incentive – Restore the “Liquid Assets” in Tropical Peatland Chris Cheng Chin Hsien Advisor to PM.Haze (People’s Movement to Stop Haze) and Climate Envoy for Oscar M.Lopez Center Abstract This report covers three important topics: i) a new prediction of global warming trend, ii) a general recommendation for NGOs, private sector and government, to collectively strengthen both push and pull factors for the transformation towards low-carbon economy, and iii) detailed discussion and recommendation for addressing the most carbon-intensive industry on the world – tropical peatland drainage and associated peatland fire due to the development of acacia and oil palm plantations on peatland. The new preliminary global warming prediction suggests a 0.48 °C per decade temperature rise in the coming decades, which will require much stronger climate change mitigation effort to be in place. Ideally, combination of transformational solutions should include the five characters: i) incentive for low-carbon, ii) enforcement with science-based targets, iii) no (significant) cost to collaborators, iv) simple & transparent, and v) potential to create global norm. A target-binding conditional carbon tax & incentive is recommended to fill in the gaps of existing carbon related initiatives. By applying the idea of conditional carbon tax & incentive, a paludiculture incentive programme for peatland restoration together with conditional tax for unretired acacia and oil palm plantation on peatland is recommended to transform the most carbon intensive industry. Stronger Eco-certification organisations and NGO divestment movement are also recommended, in order to drive the national, regional and international policies addressing the tropical peatland problem. A preliminary economic assessment is provided for converting the acacia and oil palm plantation to paludiculture farm with or without tax and incentive, for interested governments’ consideration and further negotiation. This report may be the first attempt in the world holistically covering climate science, NGO movements, private and government policies, with detailed discussion and recommendation regarding the drainage of tropical peatland. Key words: Climate change, global warming, acacia, oil palm, peatland
Transcript
1
Target-Binding Conditional Carbon Tax & Incentive
– Restore the “Liquid Assets” in Tropical Peatland
Chris Cheng Chin Hsien
Advisor to PM.Haze (People’s Movement to Stop Haze) and Climate Envoy for Oscar M.Lopez Center
Abstract
This report covers three important topics: i) a new prediction of global warming trend, ii) a general recommendation for NGOs, private sector and government, to collectively strengthen both push and pull factors for the transformation towards low-carbon economy, and iii) detailed discussion and recommendation for addressing the most carbon-intensive industry on the world – tropical peatland drainage and associated peatland fire due to the development of acacia and oil palm plantations on peatland.
The new preliminary global warming prediction suggests a 0.48 °C per decade temperature rise in the coming decades, which will require much stronger climate change mitigation effort to be in place. Ideally, combination of transformational solutions should include the five characters: i) incentive for low-carbon, ii) enforcement with science-based targets, iii) no (significant) cost to collaborators, iv) simple & transparent, and v) potential to create global norm. A target-binding conditional carbon tax & incentive is recommended to fill in the gaps of existing carbon related initiatives. By applying the idea of conditional carbon tax & incentive, a paludiculture incentive programme for peatland restoration together with conditional tax for unretired acacia and oil palm plantation on peatland is recommended to transform the most carbon intensive industry.
Stronger Eco-certification organisations and NGO divestment movement are also recommended, in order to drive the national, regional and international policies addressing the tropical peatland problem. A preliminary economic assessment is provided for converting the acacia and oil palm plantation to paludiculture farm with or without tax and incentive, for interested governments’ consideration and further negotiation.
This report may be the first attempt in the world holistically covering climate science, NGO movements, private and government policies, with detailed discussion and recommendation regarding the drainage of tropical peatland.
Key words: Climate change, global warming, acacia, oil palm, peatland
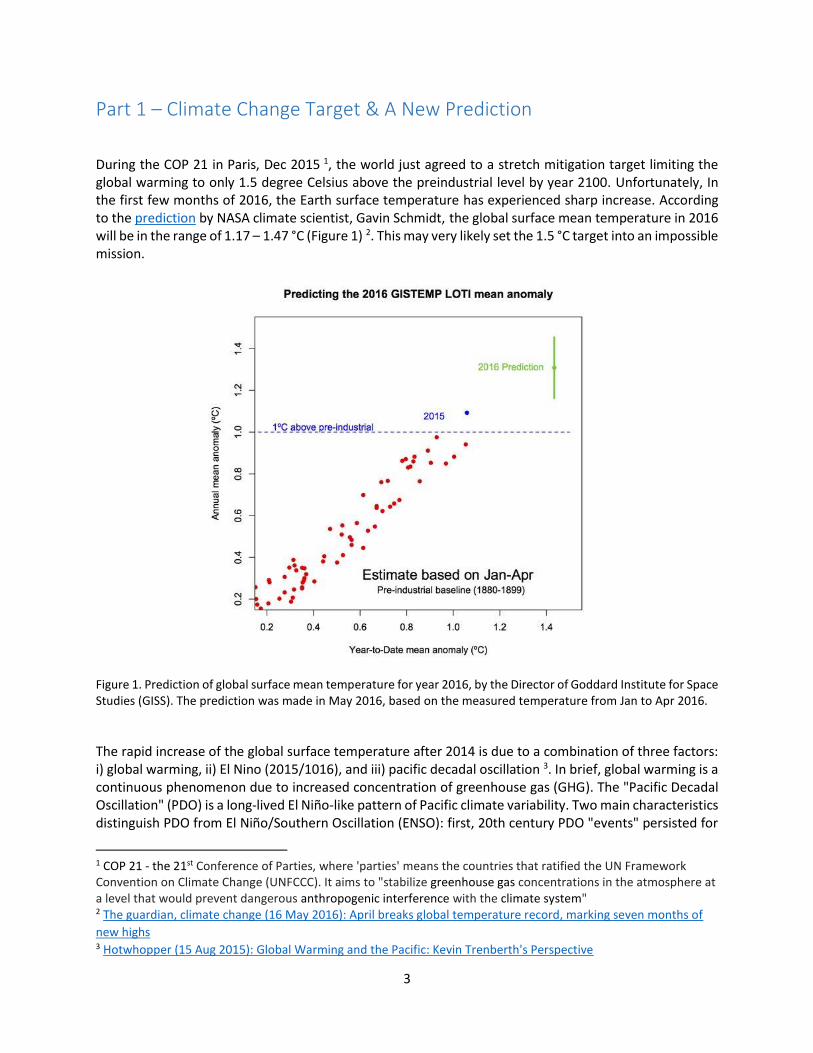
During the COP 21 in Paris, Dec 2015 1, the world just agreed to a stretch mitigation target limiting the global warming to only 1.5 degree Celsius above the preindustrial level by year 2100. Unfortunately, In the first few months of 2016, the Earth surface temperature has experienced sharp increase. According to the prediction by NASA climate scientist, Gavin Schmidt, the global surface mean temperature in 2016 will be in the range of 1.17 – 1.47 °C (Figure 1) 2. This may very likely set the 1.5 °C target into an impossible mission.
Figure 1. Prediction of global surface mean temperature for year 2016, by the Director of Goddard Institute for Space Studies (GISS). The prediction was made in May 2016, based on the measured temperature from Jan to Apr 2016.
The rapid increase of the global surface temperature after 2014 is due to a combination of three factors: i) global warming, ii) El Nino (2015/1016), and iii) pacific decadal oscillation 3. In brief, global warming is a continuous phenomenon due to increased concentration of greenhouse gas (GHG). The "Pacific Decadal Oscillation" (PDO) is a long-lived El Niño-like pattern of Pacific climate variability. Two main characteristics distinguish PDO from El Niño/Southern Oscillation (ENSO): first, 20th century PDO "events" persisted for
1 COP 21 - the 21st Conference of Parties, where 'parties' means the countries that ratified the UN Framework Convention on Climate Change (UNFCCC). It aims to "stabilize greenhouse gas concentrations in the atmosphere at a level that would prevent dangerous anthropogenic interference with the climate system" 2 The guardian, climate change (16 May 2016): April breaks global temperature record, marking seven months of
new highs 3 Hotwhopper (15 Aug 2015): Global Warming and the Pacific: Kevin Trenberth's Perspective
20-to-30 years, while typical ENSO events persisted for 6 to 18 months; second, the climatic fingerprints of the PDO are most visible in the North Pacific/North American sector, while secondary signatures exist in the tropics - the opposite is true for ENSO.
The obvious trend of global warming starts together with the first warm-phase of PDO in the 20th century. Last century, there are only 2 warm-cool cycles of the PDO, and in 2014 the world just transitioned into the 3rd PDO warm phase since 20th century 4 (Figure 2).
Figure 2. The annual mean and 5-year running mean temperature from NASA 5, with warm phase (orange) and cool phase (blue) of PDO highlighted. The gradients of temperature-increase (dark green line) for the 1st and 2nd warm-cool PDO cycles since 20th century are estimated, and the gradient for the current PDO cycle is also predicted (red arrow). The prediction is based on a straight line between the temperature in 2014 (transition year) and in 2016 (after minusing ~ 0.2 °C of El Nino effect).
Figure 2 tries to split the effect of global warming, El Nino, and PDO. Warm and cool phases of each PDO are highlighted in orange and blue colours, respectively. The gradient of temperature increase over decade across each PDO warm-cool cycle is estimated (dark green lines) to reflect the effect of global
4 Pacific Decadal Oscillation (PDO), National Centre for Environmental Information. The monthly update of PDO index shows the transition of PDO phase in 2014 5 Global temperature figures by Colombia University, with data sources from NASA GISS temperature web pages
warming. For annual spikes, e.g. year 1997 and year 2006, indicate the El Nino years, and the trend is highlighted by the upper dashed lines. The lower dashed lines highlighted the trend for La Nina years.
Figure 2 also tries to predict the future trend of global warming in the coming decades (red arrow). The projection is based on the predicted global mean temperature in 2016 (~ 1.3°C above pre-industrial), a 0.2 °C effect of El Nino to global mean temperature in year 2016 (which is often the case after 1950), and the onset of current PDO warm-phase from year 2014.
Figure 2 also suggests the El Nino and La Nina effects for the upper projection of the current PDO, indicated by the two red dashed lines. The US’s National Oceanic and Atmospheric Administration (NOAA) forecast the fall and winter in 2016 and 2017 will likely be in La Nina 6. The lower red dashed line in Figure 2 suggests the annual mean temperature for year 2017 under La Nina impact to be close to 1.1 °C above preindustrial condition. This prediction will be refined by the actual temperature reading of year 2017 and 2018 with La Nina impact during the current PDO warm phase.
Based on this projection (~0.48 °C rise per decade), the 1.5 °C target may be broken before 2025, or even just in the next El Nino event. The 2°C target may be broken before 2035, or during an El Nino before 2030. Assuming a 35-year long PDO, we may be facing a 3-degree warmer world by the mid-century. Since we are still adding more greenhouse gases into the atmosphere, this trend may even accelerate further, leading us towards a six-degree warmer world with mass extinction by end of this century 7.
Although the projection in Figure 2 is not robust enough, by comparing the temperature trend between each PDO cycle, it is quite obvious that the trend of global warming is accelerating 8. This echoes with some other scientists’ new findings 9 10. However, these new findings were only published after the 5th assessment report (AR5) by Intergovernmental Panel on Climate Change (IPCC) in 2013 and 201411. As the IPCC AR5 was the scientific basis of policy discussion at intergovernmental level such as COP 20 and COP 21, the earlier planned climate actions may be based on over-optimistic prediction.
Figure 3a and 3b are taken from IPCC AR5 (The Physical Science Basis) 12, with questions (in red) and new projection (red arrow) added based on the discussion above. As we are experiencing record high
6 National Oceanic and Atmospheric Administration (NOAA) (30 May 2016): ENSO: Recent Evolution, Current Status and Predictions. 7 To understand what each degree of warming means in 2 minutes, this short trailer may be the best. However, the prediction presented is still highly debatable. For the prediction of sea level rise, the recent study published in Nature (2016) may be more representable. 8 The comparison between PDO cycles: i) the temperature rise in the warm phase gets steeper; ii) the temperature trend in cool phase was slightly downward in the 20th century, but switched to mild temperature rise in the previous cool phase. 9 Byron A. Steinman, Science, 347, 6225, 988 (2015): Atlantic and Pacific multidecadal oscillations and Northern Hemisphere temperatures 10 HNGN (21 Mar 2016): Climate Change Accelerating At 'Unprecedented' Rate 11 IPCC 5th Assessment report @ http://www.ipcc.ch/report/ar5/index.shtml 12 IPCC AR5 (The Physical Science Basis) Chapter 12: Long-term Climate Change: Projections, Commitments and Irreversibility, Figure 12.46
temperature and accelerating global warming now, the IPCC projection may be over-optimistic. Figure 3b shows the IPCC accepted required emission trajectory for reaching the 2°C target (dark blue line and black band), but we may probably need a much more stringent reduction target if the new projection in this report comes true.
Figure 3. The coloured solid lines denote the four IPCC AR5 scenarios. According to IPCC, pathways in the darkest three bands likely stay below 2°C, 3°C, 4°C by 2100, respectively, while those in the lightest grey band are higher than that. The global temperature relative to pre-industrial in (a) corresponds to the emission pathways over the 21st century in (b). This IPCC prediction data was based on Rogelj et al. (2011). However, the red dot in (a) denotes the temperature we are experiencing in 2016, which is higher than all the IPCC projection scenarios. The red arrow in (a) indicates the projection in this report. Even with the most stringent emission reduction trajectory in (b), the world may still be heated more than 2°C by end of this century (or as early as 2030-2035).
To have better global warming prediction and mitigation planning in the future, some questions need to be addressed:
i) Detailed understanding about the interaction with ocean – More than 90% of heat trapped on the Earth is stored in the ocean 13. But how long can oceans continue to absorb Earth’s excess heat 14?
ii) What is the best way to get the world to cut emission fast? This will be discussed in Part 2 with example of detailed recommendation in Part 3 below.
iii) If we are really heading a ~0.48 °C rise per decade, large scale geoengineering solution is probably unavoidable. What will be the best solution?
13 Skeptical Science: Where is Global Warming Going 14 Cheryl Katz, Environment 360 (30 Mar 2015): How Long Can Oceans Continue to Absorb Earth’s Excess Heat?
Part 2 – Transform the Carbon Intensive Companies with Target-Binding Conditional Carbon Tax and Incentive
To make money for living, there are thousands of ways. Why do we still keep our money and business with carbon intensive practices (measured by emission per revenue or other matrix)? What is the best way to get the world to transform the carbon intensive industries / companies? Even if we follow IPCC’s optimistic recommendation, there is no doubt that carbon intensive practices have to stop as soon as possible (e.g. coal-fired power plants should no longer be built and have to retire). Such transformation requires massive switch of business and investment from the carbon intensive practices to low-carbon practices, but it often faces resistance from the carbon-intensive industries. A common hurdle for such transformation is the feel of difficulty in profit making and economic growth if the business move away from existing carbon-intensive practices. A best solution to overcome such hurdle should probably possess the below characteristics with both strong pull and push factors:
i) (Pull Factor) Incentive for low-carbon practices – therefore a positive momentum can be created for the transformation
ii) (Push Factor) Strong enforcement with science-based emission reduction target – therefore the world may have chance to really reduce the emission sufficiently fast
iii) (Ideal Push Factor) No (significant) cost to collaborative companies and countries – therefore companies and countries will be more willing to participate
iv) (Generic Factor) Simple and transparent – therefore the administration cost can be minimised and the problems about hidden emission can be avoided
v) (Generic Factor) Potential to create social and commercial norm at global level – therefore everyone can collaborate strategically to accelerate the emission cut globally
There are several types of government & corporate policies, as well as initiatives by non-governmental organisations (NGOs) in the world, trying to transform the carbon-intensive industries and incentivize low-carbon economy. Examples are divestment movement 15, carbon tax 16with focus on the push factor; crowdfunding17, climate bond 18, international aid or funds 19 that focus on the pull factor; and carbon trading 20 that covers both push and pull factors (theoretically). Table 1 evaluates them with the ideal five characteristics:
15 Fossil Free divestment campaign is a global movement to demand institutional divestment from carbon-intensive fossil fuel companies. The movement has secured commitment from 526 institutions, such as Norwegian Sovereign Wealth Fund, World Council of Churches. The approximated value of divestment is about US$ 3.4 trillion. There are also divestments from deforestation companies, e.g. Norway fund drops 11 firms over deforestation and Norway government commits to zero deforestation. 16 Failure examples of carbon tax include British Columbia’s carbon tax, Australia’s carbon tax 17 About 10 billion plus funding for renewable projects were collected through crowdfunding in 2011-2015, stated in the renewable crowdfunding map. 18 Climate bond initiative aims to issue US$100 billion of bonds for climate change projects a year. Its Climate Bonds Certification is backed by the Climate Bond Standards Board, with $34 trillion assets under management represented. 19 Examples of international aids and funds are the USAid, REDD+ fund. 20 Failure examples of carbon trading include EU emission trading systems (ETS), New Zealand ETS
Table 1. Evaluation of several initiatives tackling on the flow of money from carbon-intensive to low-carbon practices. * For carbon tax and trading, their characters on “enforcement with science-based targets” are rated partially, mainly because the targets are usually not science-based.
Unfortunately, none of existing policy or initiative covers all ideal characteristics. More ideal characteristics can be covered if several pull-factor focused initiatives and push-factor focused policy are implemented together. For example, developed countries can provide more incentives through climate bond, international aid, and crowdfunding for developing countries that implement carbon tax to their carbon intensive industries. Divestment movement can complement the push factors externally especially to carbon-intensive companies operate in countries with no or weak push-factor focused policies. However, there are still missing gaps: i.e. science-based target and no (significant) cost to collaborators. A target-binding conditional carbon tax linked to carbon incentive lever may be able to fill such gaps.
Carbon tax that are applied to companies at annual basis regardless the progress of companies’ transformation journey. Once the companies are taxed, it will be a direct cost to companies. This may create unnecessary fluctuation to companies who are willing to transform. Besides, if only a few countries implement carbon tax, the tax may just drive carbon-intensive companies moving to other countries with weak or no push-factored policies.
These problems may not be too difficult to fix. Carbon tax scheme can be designed to tax based in a 3-5 years of accumulated carbon emission and an assigned science-based emission reduction target for this period. The tax should be conditional and applies only to uncollaborative companies who fail to achieve the emission reduction targets within this buffering timeframe. While carbon-incentive schemes (the pull factor-focused solutions) should be applied concurrently to support the transformation of
9
collaborative companies. The buffering timeframe and incentive-scheme allow companies to reduce the risk and improve profitability opportunity for the transformation. As a result, there will be stronger cases for these carbon-intensive companies transforming their business instead of moving to other countries. An example will be given in Part 3.2.
Besides, during the 3-5 years buffering time-frame the world may try establishing another global consensus on top of the recently signed Paris agreement 21. The target-binding carbon tax & incentive with 3-5 year buffering time in fact may be an ideal fit to the Intended Nationally Determined Contributions submitted by countries around the world. If there is a global agreement to adopt this target-binding conditional carbon tax, there will be no place for carbon-intensive companies to move to.
In addition, the carbon tax revenue received from the developed countries ideally should be managed at United Nation or regional level, so that the fund may be better channeled to the needy (developing) countries for climate mitigation and adaptation projects.
21 The Guardian (25 Apr): Paris climate deal: countries with about half of global emissions to join this year
Part 3 – Restore the “Liquid Assets” in Tropical Peatland
3.1 Carbon Intensity of Drained Peatland for Acacia and Oil Palm
Carbon intensity, measured by emission per (associated) revenue, is a good indicator showing the impact to climate change of certain company or industry versus its economic benefit. Transforming the carbon-intensive companies towards low-carbon may not come with economic cost.
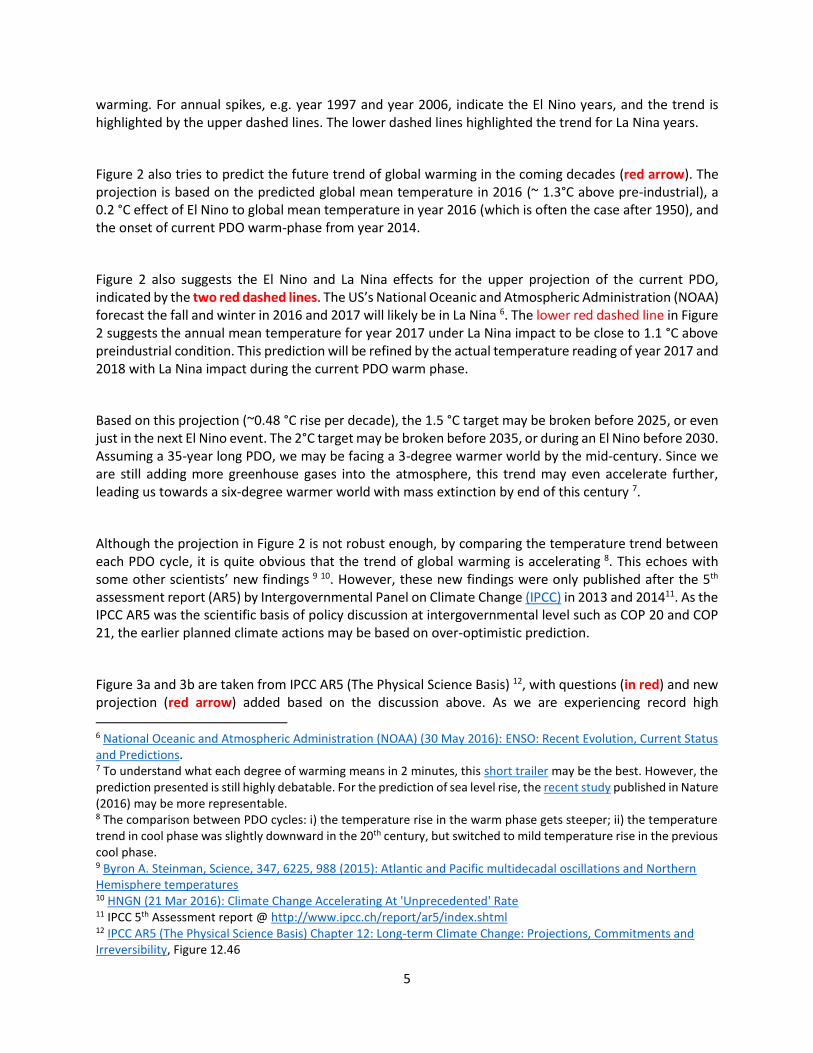
Two of most carbon intensive industries on the world are growing acacia (for paper) and oil palm on tropical peatland. The carbon intensity (ton CO2e / million US$) is around 17,500 to 44,000 for growing acacia on peatland, and 6,500 to 23,200 for growing oil pam on peatland. Comparing to coal-fired power plant with carbon intensity ~10,000 to 15,000, oil palm plantation on peatland is about as polluting, and acacia plantation is significantly more polluting even in the absence of fire (Table 2).
Peat swamp is formed through accumulation of partially decomposed biomass under swampy and anaerobic condition. For growing plants that cannot live with the wet swampy conditions, peatlands are drained and become dry with exposure to the air. This dry peat biomass is very flammable and it possesses high risk of smoldering fire which can result in the transboundary haze, especially in Southeast Asia. Even in the absence of peatland fire, the air in dry tropical peatland stimulates decomposition of the partially decayed plant biomass, resulting in emission of significant amount of greenhouse gas (GHG). The emission from peat decomposition is associated to the level of peat drainage (ground water table depth from the surface) and the peat soil temperature 22. The lower the water table depth and the warmer the peat soil are; the faster decomposition of peat will be.
Acacia crassicarpa, a widely grown species in Indonesia peatland for paper production, requires rather dry and drained condition for its growth. It is hence the key species driving greenhouse gas emission from Indonesian peatland. Oil palm is able to grow in wetter condition. However, for better productivity and maintenance, certain level of peat drainage is also a common practice.
It is important to highlight that pulpwood plantations and oil palm plantations on mineral soil can be environmentally friendly. First of all, there will be no issue about the peat decomposition. Second, the risk of fire is much lower on mineral soil too: As shown in Table 3, the intensity of fire-hotspot on peatland and mineral soil for industrial tree planting concessions (Hutan Tanaman Industri, HTI), oil palm concessions, Roundtable on Sustainable Palm Oil (RSPO) certified oil palm concessions, logging concessions, and other use (usually unmanaged and prone to illegal land-clearance for oil palm 23). In particular, HTI for pulpwood has the highest hotspot intensity on peatland. This may be partially due to its most severe peatland drainage.
22 J. Jauhiainen et. al., Biogeosciences (2012): Carbon dioxide emissions from an Acacia plantation on peatland in Sumatra, Indonesia. 23 Eyes on the Forest (Apr 2016): No One is Safe - Illegal Indonesian palm oil spreads through global supply chains despite global sustainability commitments and certification
Fire-free Total emission with Fire Fire-free Total emission with Fire
High revenue
Low revenue
Low (2013)
High (2014)
Extreme (2015)
High revenue
Low revenue
Low (2013)
High (2014)
Extreme (2015)
Emission per hectare oil palm plantation (ton
CO2e/ ha/ year) 40 40 48 71 83
Emission per hectare acacia plantation (ton
CO2e/ ha/ year) 73 73 83 122 165
Yield (ton palm oil / ha) 5 4 4 4 4
Yield (m3 acacia wood / ha / year)
23.2 18.4 20.8 20.8 20.8 Yield (ton palm kernel
oil / ha) 0.6 0.5 0.5 0.5 0.5
Yield (ton palm kernel cake / ha)
0.6 0.6 0.6 0.6 0.6
Market Price (US$/ ton palm oil)
1,000 500 700 700 700
Market Price (US$/ m3 acacia wood)
180 180 180 180 180 Market Price (US$/ ton
palm kernel oil) 1,500 800 1,300 1,300 1,300
Market Price (US$/ ton palm kernel cake)
400 50 200 200 200
Associated revenue per hectare (US$/ ha/ year)
6,140 2,430 3,570 3,570 3,570 Associated revenue
per hectare (US$/ ha/ year)
4,176 3,312 3,744 3,744 3,744
Emission per associated revenue (ton CO2e/
million US$) 6,515 16,461 13,445 19,888 23,249
Emission per associated revenue
(ton CO2e/ million US$) 17,481 22,041 22,169 32,585 44,071
Images of drained peatland for oil palm
(left), acacia (middle), and peat-fire causing
transboundary haze in 2015 (right)
Allegheny * (worst S&P 500 coal fired utility
company) 15,142
Average coal power plant (Indonesia tariff) ^
~10,000
Table 2. Yellow highlighted: Factors affecting the carbon intensity (CO2e / million US$) from growing oil palm and Acacia crassicarpa on tropical peatland in Indonesia, and the brief calculation. The emission does not include above ground deforestation. Red highlighted: Comparison of carbon intensity, carbon intensity between growing acacia, oil palm on tropical peatland and coal-fired power plant / company. Photos are taken from internet. Source of information: Carbon intensity estimate for oil palm and acacia (refer to Appendix A). Coal-fired plants: * TruCost (2015): Carbon Risks And Opportunities In The S&P 500, ^ estimated from emission factor (1 ton CO2e / MWh, 50th percentile lifecycle emission intensity, IPCC (2011): Annex II: Methodology. In IPCC: Special Report on Renewable Energy Sources and Climate Change Mitigation (ref. page 10)) and Indonesia’s electricity tariff in June 2015.
In addition to the peat drainage and peat decomposition, active fire prevention is also important to prevent landscape fire that leads to transboundary haze in Southeast Asia and significant greenhouse gas emission. Apparently, RSPO concessions and logging concessions are better protected from fires.
As Acacia crassicarpa on peatland is a more severe problem than oil palm, this report looks further into the fire-hotspot and carbon intensity of large pulpwood companies in Indonesia. Table 4 preliminarily categorises large pulp & paper companies with more than 1000 km2 concessions in Indonesia based on
the estimated carbon intensities (carbon emission per revenue from plantation wood). Companies with less than 3% concession area on peat and less than 10 MODIS hotspot detections per 100 km2 for three consecutive years are classified as potentially leading companies, and are coloured in green. The assumptions behind the estimate of carbon intensities from both fires and peat decomposition are described in the footnote, with details in Appendix A.
Hotspot Intensity = number of MODIS hotspot (>25% confidence level) per 100 km2
Year HTI
concessions Oil Palm
concessions RSPO
concessions* Logging
concessions Other Use
On Peatland
2013 17 14 2 1 8
2014 49 31 10 4 20
2015 63 30 20 7 34
Mean 43 25 11 4 21
On mineral Soil
2013 2.7 2.0 0.3 0.8 -
2014 4.6 3.8 0.7 1.0 -
2015 9.3 5.9 2.0 2.2 -
Mean 5.6 3.9 1.0 1.3 - Table 3. Indonesia’s hotspot intensity for industrial tree planting concessions (HTI), oil palm concessions, RSPO concessions, logging concessions, and other use, on peatland and on mineral soil. For the methodology, please refer to Appendix A: * Georeferenced formatted RSPO concessions are not available; hence the RSPO peat area and hotspot intensity may be with certain error (likely < 30%).
Calon Areal Iuphhk-Ht, a very large pulpwood company with 10,500 km2 concession area in Indonesia, is potentially one of leading examples, although further effort to reduce the hotspot intensity is encouraged. Risjadson Group & Inhutani IV joint venture seems to be the best performing large pulpwood company, with less than 842 ton CO2e emission per million US$ wood revenue. This is even better than the average S&P 500 24 basic resource companies which has about 1600 ton CO2e emission per million US$ wood revenue (TruCost 2015).
Table 4 also highlights lagging companies in red. They are selected if the hotspot intensity is higher than 20 per km2 for at least a year during the past three years, or if the estimated carbon intensity is larger than 12,000 ton CO2e emission per million US$ wood revenue for year 2015.
In general, the lagging companies have significant concession area on peatland and hence the estimated carbon intensities are high. Two exceptions are Marubeni Corp - Inhutani V joint venture and PT. Permata Wana Timur Lestari, where the peatland only take up 0.2% and 3.3% of their entire concession area. Their emission mainly came from fires within concession, although detailed hotspot investigation and re-assessment of their carbon intensity are needed.
24 S&P 500 companies refer to the 500 mid-large cap companies listed in Dow Jones and comprised in the S&P 500 stock market index. In the TruCost 2015 report, the emissions in the Basic Resources sector are second-highest relative to revenue. Examples of Basic Resources companies are steel and paper manufacturers.
Table 4. The historical hotspot and hotspot intensity for large pulp and paper companies with concession area larger than 1000 km2, and the estimate of their carbon emission and intensity. Color-coding: lagging companies are coloured in red; moderate companies are in yellow; and potentially leading companies are in green. Assumptions: i) 50% of concession is planted for wood production, in both peatland and mineral soil; ii) US$ 3,744 per hectare plantation per year revenue from the sale of wood; iii) 73 tons CO2e emission per hectare plantation on peat per year, due to the oxidative decomposition of drained peat; iv) 14551 tons of CO2e emission per MODIS hotspot detection (>25% confidence level) in Indonesia in year 2015; and v) change of above ground carbon stock is not included. For details of assumptions, please refer to Appendix A. The “less <” signs for some companies are suggested since land-fires on mineral soil concessions are likely lower than 14551 tons per MODIS hotspot detection.
14
3.2 Restore the “Liquid Assets” (Water & Livelihood) in Tropical Peatland
Due to the urgency for climate change and haze mitigation, there is no reason to replant acacia or even oil palm on peatland. These tropical peatlands should be rewet at the end of the economic life-cycles for acacia and oil palm. Especially for acacia, in order to achieve a carbon intensity of average S&P 500 basic resource company (~1600 ton CO2e / million US$) no more than 8.2% of the company’s entire plantation area can be remained as acacia peatland plantation, even in a fire-free scenario (based on the assumptions used for Table 4).
Other wet-peatland-friendly economic activities should be considered in order to establish incentive for restoring and protecting the wet peatland. Water and community livelihood are the 2-in-1 important “liquid assets” for peatland restoration. The importance of switching acacia to other peatland friendly economic wood species, such as jelutung and gelam (Melaleuca cajuputi), has been mentioned by peatland restoration agency, NGOs like Wetland International 25 , research institution like Center for International Forestry Research (CIFOR) 26 and many others. Unfortunately, this is often ignored or termed as long-term research projects 27 by companies. In fact, even if most degraded and fire-risking peatlands are in cultivation areas 28, the resistance from private sector 29 may remain as a barrier for rewetting peat domes at landscape level. For example, if pulpwood companies are unwilling to retire their acacia on peatland, the challenge in rewetting the neighbouring peatland will remain and some community-based wetland livelihood can be affected 30.
3.2.1 The Roles of NGOs and Environmental Certification Organisations
NGOs and environmental certification organisations are usually the pioneers pushing the transformation movement before governmental policies kick in. For pulp & paper industry, this report recommends environmental certification organisations, such as Forest Stewardship Council (FSC), Programme for the Endorsement of Forest Certification (PEFC), Indonesian Ecolabelling Institute (LEI) certification, and Singapore Green Label Scheme (SGLS), to proactively discuss with the leading pulpwood companies with plantations on mineral soils, for more robust assessment and application of eco-certification, and not to certify any acacia plantations on peatland. Similar recommendation applies to palm oil certification organization RSPO. it should proactively engage legal oil palm plantation owners on mineral soils and confirm if they can be qualified as low carbon palm oil plantations. RSPO should also
25 Nazir Foead, Jakarta Globe (28 May 2016): Five Steps to Restore Indonesia's Degraded Tropical Peatlands; and Wetland International Report (2016): Will Asia Pulp & Paper Default on its “zero deforestation” commitment?, box 4.1 page 47. 26 Henrry Purnomo, Forest News (26 Aug 2015): Political Economy of fire and haze: Moving to long-term solutions 27 Asia Pulp & Paper Group (APP) (21 Apr 2016): Statement on PT OKI Pulp & Paper Mills (OKI) 28 Straits Time (18 Apr 2016), Taking the hot seat in war on haze. Mr Nazir said his agency had already mapped 2.26 million ha of priority areas. Of these, about 1.9 million ha are in cultivation areas, with 25 per cent on community lands. 29 The Jakarta Post (11 Mar 2016): Firms tell BRG to stay out of plantations 30 Oka Karyanto et. al. 15th International Peat Congress @ Sarawak Malaysia (Aug 2016): Farming on undrained Peatland in Riau, Indonesia: Implication for Sustainability. In page 7 and Figure 6, it illustrates how community-based sago production on undrained peatland in Tohor village was affected by the peat drainage for pulpwood plantation.
consider not certifying any new planting or replanting of oil palm on peat land. These certification organisations may even take a stronger roles transforming companies beyond plantation level. Companies with significantly large acacia or oil palm plantation on peatland, or with high carbon intensity (e.g. those highlighted red in Table 4) should be entirely out of consideration for eco-certifications until they manage to transform their business with supporting evidences.
Figure 4 illustrates the recommendation to eco-certification organisations with building blocks for sustainable agriculture or forestry practices. The choice of mineral soil or wet-peat friendly species with proper water management should be the basic foundation. A proper fire-prevention programme minimising the potential wild fire 31 is on top of it. With these two levels of foundation, zero deforestation (including no clearing of high carbon stock and high conservation value forests) may then come possible. Only with proper conservation of peatland and forest, there will be room for long-term economic and social sustainability. For example, with foreseeable worsen climate change condition, more severe droughts, fire and even flood are expected.
Figure 4. Recommended building blocks for certifying sustainable agriculture or forestry practices.
31 Jakarta Globe (25 May 2016): Govt Forms Village Task Forces to Prevent Forest Fires, and Jakarta Globe (30 May 2016): Govt, Private Sector in Pilot Project for Fire Prevention Procedures. (more discussion in Appendix B)
Retiring all acacia and oil palms on peatland is definitely challenging. Resistance from companies and even Indonesia government is expected. The pull and push momentum by certification organisations is probably not enough. Stronger pull and push factors are needed.
Since growing acacia on peatland is probably the most carbon-intensive industry in the world, there is perfect reason for boycott or divestment movement against companies with massive acacia plantation on tropical peatland. However, as discussed in Part 2, the aim of this kind of NGO movement is to complement the weak governmental regulation. If there is any collaborative company accepting a legally binding commitment to retire the acacia plantation on peatland within a reasonable timeframe (e.g. 70% retirement within 5 years), the movement can then be considered a success.
Fortunately, Wilmar, a palm oil giant company, may set a big precedent by giving up their peatland areas and support the government and community’s alternative livelihood 32.
3.2.2 The Roles of Governments - Wet Peatland Economics with Conditional Carbon Tax & Incentive
As discussed in Part 2, ideal solution for the transformation needs both strong pull and push factors. Financing the community livelihood and business on wet peatland ecosystem is a key pull factor for peatland restoration. Without the support of actual “liquid asset”, it will be almost impossible to have landscape wide restoration of the “liquid asset” in Indonesia’s tropical peatland.
Table 5 compares briefly the economic perspective of Acacia crassicarpa, gelam (Melaleuca cajuputi), jelutong (Dyera costulata), oil palm, and sago palm, with three scenarios of carbon price (US$0, 10 and 20 per ton CO2e), with assumptions and citations given in Appendix C. Gelam, Jelutong, and sago palm are important economic paludiculture (wetland agriculture) species for peatland restoration.
In general, in the absence of carbon tax and incentive, there is significant risk of economic cost for the pulpwood and oil palm companies converting their plantations into paludiculture farms. This is mainly due to uncertain yield and market price of the new paludiculture products. The target-binding conditional carbon tax and incentive will help companies reduce their risk in the transformation. For example, a 5-year target can be set to retire 70% of Acacia crassicarpa and 70% of oil palms on peatland with age above 20 years old, with new planting of paludiculture species like gelam, jelutong, and sago (detailed discussion in Appendix C). For the conversion of acacia or oil palm to paludiculture species with proper fire-prevention programmes, companies can be rewarded through international funding, e.g. through REDD+ programme 33. However, after this 5 year, the accumulated carbon emission associated to the unretired acacia and oil palm will be taxed if companies fail to achieve the target.
32 David Fogarty, The Straits Time (9 Jun 2016): Restoring peatlands a game changer in anti-haze battle 33 Reducing Emissions from Deforestation and Forest Degradation programme (REDD) and other forms of land-use change (+), is a United Nation programme
Table 5. Economic assessment of crop switching from carbon intensive acacia and oil palm on peatland to paludiculture species, jelutong, gelam, and sago palm.
Three scenarios of conditional carbon tax & incentive are applied – i) zero, business as usual scenario; ii) US$10 / ton, and ii) US$20 / ton. Jelutong and gelam are
compared to the case of switching from acacia due to their closer nature of business and similar duration between new planting and the (beginning of) product
harvesting. For oil palm, it is compared to sago palm since both of them are edible crop, and long lifespan of sago palm (start harvesting after 10-11 years) suits
better to existing oil palm plantations with 25 years of lifespan. In practice, which crop to switch to depends on business decision and land suitability evaluation.
The low / high revenue cases for the paludiculture species are compared to the low / high emission cases of acacia or oil palm. Refer to Appendix C for details.
18
With just a US$10/ton CO2e carbon price applied for both the conditional carbon tax and incentive, the risk of plantation conversion can be significantly reduced and there will be reasonable chance of increased revenue. With a US$20/ton CO2e, it will be an extremely clear signal that acacia will be retired from peatland to avoid the heavy carbon cost and to capture the great opportunity of carbon incentive. However, a high incentive to these carbon incentive companies will be unfair to potential donors.
To simplify the scheme further for easier implementation at policy level, the policy may just need to link the tax and incentive to the plantation area on peatland, without the need to be termed as “carbon price”. For example, instead of keeping the US$10/ton carbon price, the policy can be set to incentivize US$700 every year for each hectare of conversion from acacia to paludiculture with fire-prevention programme; and to charge US$1,000 per hectare per year (or US$5,000 per hectare for 5-year) for unretired acacia plantation on peatland at the end of 5-year policy period, if the company fails to achieve the policy target.
A similar 5-year policy can be applied to oil palm plantations on peatland with oil palm age above 20 years. For example, the conversion can be incentivised by US$350 per hectare per year; while the remained unretired oil palm plantation on peatland are to be charged by US$ 600 x 5 = US$3,000 at the end of the 5-year policy period. As the required information is just the plantation area on peatland, which is more or less readily available, the policy implementation should be rather straight forward and transparent.
Assessing this policy with the ideal characteristics stated in Table 1, it fulfils all the five:
Incentive for low-carbon
Enforcement with science-based targets
No (significant) cost to
collaborators
Simple & Transparent
Potential to create global
norm
Through the learning process in the first 5-year policy period, the economic risk of paludiculture may be reduced. In addition, other value-added processes may be eventually added into the wetland economic structure. For example, fungiculture for mushrooms, biocomposite industry, and food manufacturing industry may minimise agriculture & forestry waste with no significant land area required (refer to Appendix C for discussion on how gelam, jelutong, and sago may have potentials in these three industries, respectively). Hence, after the 5-year policy period, the incentive should be minimised and the tax should be increased for the next policy period.
The only challenge is probably the huge amount of money involved for implementing such policy, and the political will from Indonesia and potential donor countries. This report estimates 34 that about 1.09 million hectares of acacia plantation and 0.24 million hectares of >20 year-old oil palm plantation on peatland. If all of them manage to convert to paludiculture farms within 5 years, it will require about (1.09 million x US700 + 0.24 million x US350) x 5 = 4.24 billion US$ of the incentive.
Nevertheless, the aim of this part 3.22 of the report is to recommend possible policy solution for Indonesia government, as well as other potential donor governments in the region (e.g. Singapore) and around the
34 Based on assumptions of 50% of oil palm and acacia concessions on peatland are planted, and 20% of oil palm plantations are with 20 years old and above. For the detailed assumptions and citations, please refer to Appendix A
world (e.g. Norwegian government). Whether such recommendation will be considered and fine-tuned is subject to further high level negotiation.
20
Conclusion and the Next Step
This report covers three important topics summarised below
I. Part 1 provides a new prediction of global warming trend for coming decades, taking into account the impact of multi-decade long PDO:
The preliminary prediction suggests a 0.48 °C per decade temperature rise in the current PDO cycle, which may last 30-40 years
The 1.5 °C target will probably be broken by the next El Nino event, or the latest before 2025
The 2 °C target will probably be broken by an El Nino event before 2030, or the latest before 2035
A more accurate prediction requires more detailed study and perhaps few more years of observation
II. Part 2 provides a general recommendation for NGOs, private sector and government, to strengthen both push and pull factors to accelerate the transformation towards low-carbon economy. Ideal combination of transformational solutions should include the following characters:
Incentive for low-carbon
Enforcement with science-based targets
No (significant) cost to collaborators
Simple & Transparent
Potential to create global norm
Combination of existing solutions for carbon mitigation around the world is unable to fulfil all the five characteristics, with gaps in “science-based targets” and “no significant cost to collaborators”. A target-binding conditional carbon tax & incentive is able to fill in the gaps.
III. Part 3 provides evaluation and recommendation for transforming the most carbon intensive industry in the world –drainage of tropical peatland for acacia and oil palm industries and the associated risk of peatland fire.
Peatland drainage and peatland fires are more carbon intensive than coal power plants
For acacia plantation on peatland, it is more carbon intensive than coal power plant even in the absence of fire
Eco-certification organisations are recommended not to certify acacia and oil palm plantations on peatland, and to more proactively assess the plantations on mineral soils
21
NGOs are recommended to initiate divestment movement for companies with heavy acacia plantations on tropical peatland
Indonesia government is recommended to use the idea of target-binding conditional carbon tax & incentive. To simplify the policy implementation, it can be based on plantation area instead of carbon emission. That is through a 5-year target-binding conditional tax for unretired acacia and oil palm plantations on peatland, together with incentive for conversion of plantations to paludiculture farms with fire prevention programmes.
A preliminary economic assessment is provided for such conversion with tax and incentive, for interested governments to consider in further negotiation
This report may be the first attempt in the world holistically covering climate science, NGO movements, private and government policies, with detailed discussion and recommendation regarding the drainage of tropical peatland. This is to encourage more discussion among NGOs, researchers, companies, and governments for a collaborative transformation towards low-carbon economy, especially for the Southeast Asia region.
For other parts of the world, with other important issues linked to climate change and sustainable development goals, the author will recommend a sector-based approach with cross-cutting financial incentives. The example in Part 3, the peatland drainage, can be modified for other sectors such as coal industry.
The author is keen to further improve the recommendations and estimates used in this report through a research project and discussion with key stakeholders. His profile and contacts can be viewed through his LinkedIn account 35.
Appendix A – Assumptions & Citation Sources for Estimating the Carbon Intensities of Drained Peatland
A.1 Estimating the Emission
The emission from peat decomposition in acacia and oil palm plantations on peatland
IPCC Tier 1 methods were applied to estimate annual CO2 emissions from peat drainage in Indonesia and Malaysia within plantation areas only. Emission factors for oil palm, Acacia were 40 and 73 ton CO2 /ha /year, respectively, based on guidance provided in Equation 2.3 and Table 2.1 of IPCC Wetlands Supplement (2014).
Caution: This estimate is conservative because it excludes external impact of peat drainage to areas outside the plantation, e.g. emission from drained but unplanted peatland. Besides, there are many other reports suggest higher emission (e.g. 80-100 ton CO2 / ha / year) for peat decomposition from acacia plantation 36 37 38.
The emission from fire
For the emission from fire, we use a simple method correlating the number of hotspots to the emission, based on the correlation by Global Fire Emissions Database (GFED) 39. The number of MODIS hotspot in Indonesia is downloaded through Global Forest Watch open data portal 40. To match the hotspot count shown in Figure A.1, a filter at 25% hotspot confidence level is applied. Emission per hotspot is then estimated, as shown in the below Table.
Year Unfiltered Hotspot
Count Filtered Hotspot
Count Emission from
Figure A.1 Proportional
Emission per Hotspot
2013 40,464 38,064 225,190,000 5,916
2014 87,191 82,030 824,430,000 10,050
2015 139,430 130,938 1,900,000,000 14,511
36 J. Jauhiainen et. al., Biogeosciences (2012): Carbon dioxide emissions from an Acacia plantation on peatland in Sumatra, Indonesia. Jauhiainen comprehensively measured the CO2e emission over several years and suggested 80 ton / ha / yr at a mean water table depth of 0.8m. 37 Rainforest Action Network (RAN) and Japan Tropical Forest Action Network (JATAN) (2010): Asia Pulp & Paper’s Hidden Emissions: Calculating the Real Carbon Footprint of APP’s Paper. :85 tons of CO2/ha/year for drained tropical peatlands under acacia plantations 38 Wetland International (2016): Will Asia Pulp & Paper Default on its “zero deforestation” commitment? This report cited estimate by Hooijer et al.’s (2012), with average CO2e emissions of 100 tons/ha/yr 39 http://www.globalfiredata.org/updates.html 40 Indonesia archived active fires (NASA): http://data.globalforestwatch.org/datasets/de1fe5832831464cbd64aaa8f2d54781_0
Figure A.1. Update by GFED update on November 16, 2015. The grey dots indicate the total annual active fire
observations in Indonesia on the horizontal axis and the corresponding GFED estimates are on the vertical axis with the
years 2006 and 2014 labeled. Each grey dot represents one year between 2003 and 2014. The relation is not perfect
and adds some uncertainty to those that are in these estimates already. The non-linearity is probably related to smoke
obscuration of active fires in high fire years.
Land-use specific emission
The emission from fire and emission from peat decomposition is assumed to be mutually exclusive, since most plantations are protected and most fires occur outside plantation areas, although it can be within the concession areas. Even if fires occur on peatland plantation areas, it can lead to faster peat decomposition after fires too (due to warmer soil in the absence of tree canopy). To simplify the calculation, the total emission linked to specific land use on peatland is by simply adding the emission from peat decomposition and the emission from fires, within the specific land-use concession area.
To estimate the emission from peat decomposition on acacia or oil palm plantation area, we need to determine the “plantation area on peat”. This is derived based on:
i) Concession area
ii) Ratio of plantation to concession area
iii) Concession area on peat
24
iv) Assumption of equal plantation/concession ratio for peatland and mineral soil
For map data used in this report, it was downloaded from global forest watch. The source data on the website may be continuously updated and hence may be slightly different from the downloaded version used in this report.
Industrial tree planting concession (HTI): http://data.globalforestwatch.org/datasets/05c3a7ee17df4f69bf3c4f974a8bece9_0
Indonesia palm oil concession: http://data.globalforestwatch.org/datasets/f82b539b9b2f495e853670ddc3f0ce68_2
Indonesia peatland: http://data.globalforestwatch.org/datasets?q=peat&sort_by=relevance
The plantation to concession ratio is assumed to be 50%. Based on data of year 2011, only 5.2 million ha out of 10.2 million ha of targeted area (presumably the concession area) is planted 41 (about 51%). While the total HTI concession area in this report is about 12.9 million ha, adding to increased uncertainty. For simplicity, we use 50% ratio. This ratio however will only affect the estimate of carbon intensity in Table 4 but not Table 2. Since for Table 2 the emission is based on i) peat decomposition per plantation area where the exact plantation area is not a concern, and ii) hotspot and fire emission from concession area, where plantation area is not considered.
Other Concerns
The above ground biomass loss / gain is not considered, since the Part 3 focus on the emission from maintaining the plantation and conversion of existing plantation to paludiculture farms, instead of expansion of plantation with deforestation. The above ground biomass loss or gain is very likely to be insignificant in this case. In fact, even the above ground carbon loss through deforestation is significantly lower than the long-term and continuous emission from drained peatland 42.
A.2 Estimating the Revenue
The estimate of revenue is rather forward, by multiplying the yield (product per hectare) to the market price of the product. Sources of information are given below.
41 Forest Watch Indonesia (May 2015): The State of Forest Report in Indonesia 42 Based on the 2006 IPCC Guidelines for National Greenhouse Gas Inventories, the biomass of tropical rainforests typically stores between 130 and 240 ton C /ha. Comparing to the limit allowable for above ground forest-plantation conversion at 35 ton C / ha, proposed in the High Carbon Stock Forest Study Report (2012) by Golden Agri-Resources, SMART, The Forest Trust, and Greenpeace, the net above ground emission by converting tropical forest to plantation is about 95 – 205 ton C/ha (i.e. (i.e. 350-750 ton CO2e / ha). Comparing to Table 2, it is about 7-16 years of emission from oil palm on peat with low-fire scenario, much shorter than the 25-year cycle of oil palm plantation; or about 4-9 years emission when it is compared to acacia plantation on peatland with low-fire scenario.
Yield: The low revenue estimate is based on existing information from Malaysia palm oil industry 43. The high revenue estimate is based on 20-25% overall improvement of yield through intensification and further research.
Market Price: The market price fluctuates from time to time 44, but the value chosen in Table 2 and Table 5 should considered reasonable estimate for the purpose of discussion in this report.
Acacia crassicarpa
The yield of Acacia mangium is about 12-19 m3/ha/year [Food and Agriculture Organization, FAO data 45], or 20.5-23.2 m3/ha/year [APP’s data cited by Wetland International 46]. However, Acacia mangium is grown on mineral soil. Based on the same report by Wetland International, the yield of Acacia crassicarpa grown on peatland is about 18.4-19.6 m3/ha/year. For conservative estimate of carbon intensity, the yield of Acacia crassicarpa is assumed to possibly improve to the level of APP-reported yield for Acacia mangium 47. Hence, the range of yield will be 18.4-23.2 m3/ha/year. The average 20.8 m3/ha/year is also used in Table 2 and Table 5.
Based on the recent price on Zauba48, mixed grade of non-FSC certified mixed grade Acacia mangium wood from Malaysia is about INR11,830/m3 (mean value of 1369 m3 trade-record), or US$180/m3. Even-FSC certified Acacia mangium log is only about INR16,000 /m3, or US$ 240/m3. Due to the various environmental problems with growing Acacia crassicarpa on peatland, it is unlikely the wood can obtain FSC certification. This report hence assumes US$180/m3 for the Acacia crassicarpa wood price.
Palm Kernel Oil: http://www.indexmundi.com/commodities/?commodity=palm-kernel-oil&months=60 Palm Kernel Cake: http://www.alibaba.com/product-detail/Palm-kernel-cake_50028736836.html http://www.alibaba.com/product-detail/Palm-Kernel-expeller-PKE-_50017007656.html http://www.alibaba.com/product-detail/Palm-kernel-cake-PKC-_50003874917.html https://www.alibaba.com/trade/search?fsb=y&IndexArea=product_en&CatId=&SearchText=palm+kernel+meal 45 http://www.fao.org/docrep/003/x8423e/X8423E08.htm 46 Wetland International (2016): Will Asia Pulp & Paper Default on its “zero deforestation” commitment?, section 3.2, page 19 47 The report Wetland International (2016): Will Asia Pulp & Paper Default on its “zero deforestation” commitment?, in fact suggested declining trend of the acacia yield due to fungi and diseases. Besides, a conservative estimate of 15% loss from the point of harvest is assumed in that report. In this report, this loss is not included in the calculation and is hence even more conservative. 48 Zauba collects comprehensive India's import and export data.
Appendix B – More Discussion on the Fire Prevention Programmes
The peatland restoration programme by peatland restoration agency (BRG) covers restoration of livelihoods by empowering local communities and indigenous people with peatland friendly species, as well as monitoring the fire-hazards 49. This is similar to the fire-free village programme piloted by APRIL group which covers both fire-free livelihood for local communities and improving fire-suppression capacity with coordination with villagers. The fire-prevention programme at village level has also been adopted and transformed by Indonesia government into hundreds of community-run task forces since late May 2016 50.
RGE / APRIL is a leading company piloting fire-free village programme. Some success has been witnessed. It is also one of very few companies who managed to reduce the 2015 hotspot intensity from the 2014 level (Table 4). However, despite the success its village programme, its 2015 hotspot intensity is still more than double of PT. Mayawana Persada, another peatland intensive pulpwood company, and is almost an order higher than the leading company Risjadson Group/Inhutani IV JV.
Through various discussion with fire-free alliance members and other organisations, alternate fire-free livelihoods and solutions are the key to the success. It will be important to look into wide range of agriculture products (e.g. paludiculture products that are suitable for wet peatland ecosystem).
However, it is still uncertain if the village programme is able to effectively stop illegal land clearance by migrants or unregistered companies. For continuous improvement of village programme, the programme implementer may consider collecting information like village programme boundary, new migrants, illegal land clearance, and fire incidents, through the community officers who work on the ground. In addition, a national level tracking and coordination system is likely needed to assess the success factors among various village programmes. Regular and coordinated progress update by the community officers will be important.
There are various village programmes within and outside concessions, implemented by various stakeholders (e.g. Sinar Mas / APP, RGE / APRIL, and BRG). As the village programme is almost transformed into a national initiative, this report would like to seek collaborative sharing and update among all stakeholders by featuring all the village programmes throughout Indonesia in a common platform, such as the fire free alliance platform. In areas with no internet access, the key information may be shared through sms and centrally compiled for the update at national level.
Assessment and comparison between various village projects across the nation will allow better differentiation of leading villages, collaborative but lagging villages, and problematic villages. Criteria for
49 Nazir Foead, Jakarta Globe (28 May 2016): Five Steps to Restore Indonesia's Degraded Tropical Peatlands. Mr. Nazir is the Head of peatland restoration agency 50 Jakarta Globe (25 May 2016): Govt Forms Village Task Forces to Prevent Forest Fires, and Jakarta Globe (30 May 2016): Govt, Private Sector in Pilot Project for Fire Prevention Procedures.
leading village may be similar to leading company, such as insignificant fire incidents, ideal peatland management, and vibrant livelihood. Villages within or around Gunung Leuser National Park may be good examples. Collaborative villages are those showing significant fire reduction or/and improved peatland management. In general, incentives should be provided to leading and collaborative villages, and stronger law enforcement should be applied to problematic individuals or/and companies within problematic villages.
The village programme can even be transformed into regional and international level, by incorporating sustainable trading mechanism for villagers (e.g. through fair-trade). A community to community trading network among the region, or at least between Singapore and Indonesia, may also be developed to guarantee the demand of products from “sustainable eco-villages”.
In short, village programme is not only a method for plantation companies to work with local community to prevent fires. It is about collaboration among people, private sector, and governments, for our sustainable and haze-free future.
Appendix C – Assumptions & Citation Sources for Estimating the Revenues Converting Acacia and Oil Palm Plantations to Paludiculture Farms
The estimate of revenue of paludiculture farms is highly dependent the yield, market price, and other income from activities beyond the major crop. This report tries the best to provide ranges of initial estimates for various paludiculture farms.
C.1 Jelutong
The main income for planting Jelutong comes from the sale of latex. Based on FAO 51, the initial economic studies indicate that while the annual monetary returns per hectare are higher for oil palm on peat, the return on labour is higher for swamp Jelutung (Income per person per day labour is higher). These results indicate that swamp Jelutung might be a good alternative for smallholders, as their labour inputs are lower. From the same FAO publication and another source of information by Anthony 52 , the following information about the latex yield (per tree) is found:
i. FAO: About 30-50 litres of latex can be tapped per tree per year, much in the way Hevea rubber is tapped, and this can occur for 12 years or more. Overtapping results in the death of the tree.
ii. FAO: Tapping can begin after 5-6 years, although it is recommended that tapping not commence until the tree has a diameter of 30-35cm.
iii. Anthony: Jelutong (Dyera) yields 3.5 kg of coagulated latex per tree per month, which is about 42 kg a year.
Point iii) is quite aligned to point i) and ii), as the density of natural rubber is about 0.91-0.92 kg/l 53. From point i) and ii) we assume a 12 years of a 17-year-production cycle (12+5). this will give us about an average of 19-32 kg latex per year per tree over 17 years.
To estimate the per hectare yield, a recent article by Hesti et. al 54 may give a hint. In two studied natural forest of jelutong, the tree density ranges from 23 to 60 per hectare, depending the rate of wood extraction. This suggests that a density at 60 trees / ha is not a problem if the jelutong plantation is well protected from being logged. This report assumes a 40-60 trees per hectare density.
The market price information for jelutong is not available. However, the price of rubber latex (at 60% dry rubber content, drc) in 2015 and 2016 ranges from US$109 (29 Feb 206) to US$202 (1 Jan 2014) per 100kg.
51 FAO, TECA (Jan 2016): Mutual benefits through the cultivation of Swamp Jelutung (Dyera polyphylla): Preventing
peatland degradation and creating income by an endemic latex producing tree of Southeast Asia (Indonesia, Brunei and Malaysia)
52 Anthony B Cunningham (2001): Applied Ethnobotany: "People, Wild Plant Use and Conservation" page 131 53 http://encyclopedia2.thefreedictionary.com/Natural+Rubber 54 Hesti et. al, Agroforest Syst (2015): Domestication of Dyera polyphylla (Miq.) Steenis in peatland agroforestry
However, Jelutong latex differs from rubber (Hevea brasiliensis) latex, as it has a lower resin content, which affects latex elasticity 55. In the past, the jelutong latex was used for chewing gum, and was also recommended for various industry such as tubings and condoms 56. Due to the lower content of resin, this report assumes the market price for jelutong latex to be around 0.8 – 1.5 US$/kg, about 25% lower than the rubber latex.
The light and bright wood of jelutong supports various industries, such as pencils, wooden toys, ceiling materials and packing cases among others 57. As a result, jelutong wood was quite popular in 1990s with the log price about US$82 per m3 for log, while sawnwood price ranged from US$215 – 710 per m3 58. Figure A.2 tries to provide an estimate of its current price, as compared to other export roundwood around the world (Figure C.1) 59. In this report, unit price of 150-170 per m3 is assumed.
Figure C.1. projection of jelutong wood (log) unit price (brown dashed lines), as compared to other roundwood export unit price around the world. In 1992, its US$82/m3 is at rather high end, and hence it is projected to be about US$150/m3 now.
55 Jayanthy T, Sankanarayanan PE (2005) Measurement of dry rubber content on latex using microwave technique. Measur Sci Rev 5(3):50–54 56 Williams L (1963) Lactiferous plant of economic importance IV jelutong (Dyera sp). Economic Botany, Vol 17, No. 2. New York Botanical Garden Press 57 Middleton D (2004) Dyera. In: Soepadmo E, Saw LG, Chung RCK (eds). Tree flora of Sabar and Sarawak. Vol. 5 2004. Sabah Forestry Department, Forest Research Institute Malaysia, Sarawak Forestry Department. Malaysia. Kuala Lumpur, Malaysia, pp 27–30 58 http://sarawakiana.blogspot.sg/2008/05/jelutong.html 59 Export and Import Unit Price, based on FAO’s data at http://www.unece.org/forests/output/prices.html
Due to its light weight property and the content of resin in the wood, further research for its use in biocomposite material can be explored too. If more application of jelutong latex can be identified in the future, it will help improve its market price.
The growth rate of jelutong may be however much slower than those fast-growing trees chosen for pulpwood production. From the article by Hesti (2015), as well as several studies compiled in Enhancing Sustainability of Forestry Practices on Peatlands (2014)60, the information about its growth rates for diameter and height are available. The volumetric growth rate for jelutong tree can hence be estimated. With multiplication by 40-60 trees per hectare, a wood yield about 2-3 m3/ha/year is obtained.
Marinus et. al 61 highlighted a better growth performance of jelutong in agroforestry system (e.g. fishing and intercropping with rubber in shallow peat, and rambutan, pineapple on deep peat), as compared to mono-cropping system growing only jelutong. The environmental condition for various agroforestry systems also tend to be cooler with more moisture, which will help minimise the peat decomposition. There is no analysis found on the additional economic benefit with the agroforestry system, though it is reasonable to assume additional revenue from the side activities. This report assumes an additional US$100/ ha/ year from the intercrop in the agroforestry system.
The revenue per hectare (non-incentive scenario) will hence be in the range between
19 x 40 x 0.8 + 2 x 150 + 100 = US$ 1,017 / ha, and
19 x 60 x 1.5 + 3 x 170 + 100 = US$ 3,501 / ha.
C.2 Gelam (Melaleuca cajuputi)
The income from growing gelam comes from the sale of wood (suitable for pulp & paper industry), cajuput oil (distilled essential oil extracted from leaves), honey from the flower, substitute for black pepper with the Melaleuca fruit, and even its edible young shoot and an edible mushroom “hed Samet” can be harvested in the gelam forest 62.
With the many uses of produces from gelam forest (or farm), its economic benefit for the local community is also likely higher than the case growing acacia solely for pulpwood industry. Nevertheless, this report tries to estimate the overall revenue from its wood, oil, and honey. The edible fruit, shoot and mushroom, although possess high economic and even scale-up potential, they are not included in the estimate due to the difficulty obtaining yield data.
60 ASEAN, Global Environmental Centre (2014): Enhancing Sustainability of Forestry Practices on Peatlands (2014) 61 Agroforestry of jelutong on peatland: a lesson learned from central Kalimantan, a study compiled in the Enhancing Sustainability of Forestry Practices on Peatlands (2014). 62 Wim Giesen, Euroconsult Mott MacDonald project (2015): Case Study: Melaleuca cajuputi (gelam) – a useful species and an option for paludiculture in degraded peatlands
A 17m3/ha/year yield projection of wood was used by Nguyen (2008) 63 for plantation in Mekong delta, Vietnam. However, Pham Trung Thanh et. al. found the actual annual growth is about 8-10 m3/ha/year, with 20,000 seedlings per ha and a planting space of 0.7 x 0.7m 64. However, there is chance that the growth rate in tropical rainforest may be higher than in Mekong delta, and hence this report assumes the yield from 8-17 m3/ha.
The price of Melaleuca wood is also highly uncertain. Although Nguyen (2008) confirmed it suitable for pulp production, its price can be limited due to its smaller diameter that leads to lower sawn recovery, as well as its higher shrinkage level during the process. The selling price of medium quality Melaleuca dropped from 50 million to 25 million VND (or US$2240 to US$1120) per hectare from 2003 to 2006. Taking into the account of the poorer quality of Melaleuca for pulp production, this reports assumes its price from US$115 – 130 / m3. The resulting wood value per hectare is hence about US$ 115 x 8 to US$17 x 130, or US$920-2210 per hectare, which is rather close to the market price in Vietnam from 2003 to 2006.
Cajuput oil
Kayu putih (Melaleuca cajuputi) oil is used as a medicine for many ailments. It is used internally for the treatment of coughs and colds, and against stomach cramps, colic and asthma. It is used externally for the relief of neuralgia and rheumatism, and for the relief of toothache and earache. The oil repels insects, used as a sedative and relaxant, and is useful in treating worms. Lastly, it is used as a fragrance in soaps, cosmetics, detergents and perfumes, and in flavouring cooking.
Figure C.2 Kayu putih Melaleuca cajuputi oil and balms containing this oil are commonly used throughout Indonesia (Photo from Wim Giesen (2015))
63 Nguyen, Q. T. GTZ Kien Giang Biosphere Reserve Project (2008): Melaleuca Timber. Resource Potential and its Current Use in Kien Giang Province. 64 Pham Trung Thanh et. al. Conservation And Sustainable Use Of Melaleuca Forests On Peatlands And Marsh Areas In Ca Mau Province, Vietnam, a study compiled in the Enhancing Sustainability of Forestry Practices on Peatlands (2014)
Wim Giesen (2015) provided estimate of the revenue from the oil production, based on the plantation in central Java: 9,000 ha of plantation were found to produce about 31 kg of cinerol oil per hectare per year (Doran, 1999), which at a market price of about USD 9.4/kg leads to an average of USD 292/ha.yr for the oil alone. This market price is however significantly lower than the common price range found in Alibaba, ranging US13-32 per kg for minimal order 25kg or above 65. This report hence assumes a price at US$15/kg, resulting a revenue at US$465 per hectare. However, the distillation process for the oil extraction requires at least mid-large area of plantation and professional skill. The low revenue scenario hence does not include this into consideration.
Honey
The potential income from honey may be quite insignificant. Wim Giesen (2015) pointed out that in Song Trem State Forest, the production is about 13-15 ton over 2500 hectares annually, or 5.6 kg/ha/year. There is very limited information about the price of melaleuca honey. From Alibaba there are only two records: US$ 2.45-2.65 /kg and US$ 9-12 /kg 66. Having compared to the price of general raw honey at bulk volume (1 ton minimal order and above), the US$ 2.45-2.65 /kg appears to be more reasonable. This report assumes US$2.6/kg, resulting in US$14.6/ha revenue.
Overall, this report estimates US$935 – 2690 revenue per hectare for gelam paludiculture, from wood, cajuput oil, and honey. However, the highest potential of revenue may come from intensify the cultivation of “hed samet” mushroom. Nuyim (2011) stated that natural Melaleuca cajuputi forest is a natural location for propagating “hed samet” with high market value (see the most likely photo here). There is high potential that the waste from Melaleuca cajuputi farm (e.g. the sawn waste wood chips) can be collected and used for intensive cultivation of hed samet or even other types of edible mushrooms.
C.3 Sago Palm
The sago palm may be the paludiculture species with highest economic potential for Indonesia. Marliati (2014) 67 highlighted the big gaps between existing average yield of sago farms in Indonesia (314 kg dry starch /ha/year), high-yield farms (10 and projected to reach 25 ton dry starch /ha/year with best management), and theoretical maximal yield (70 ton dry starch /ha/yield).
The variety firstly depends on Sago species that usually yield 100-500 kg wet starch per tree, while the highest yield may reach 700 kg dry starch per tree. Secondly it depends on the tree density (how intensive the sago farm is). A felling potential average 102 tree / ha / year was achieved in Maluku. Definitely, there are still many other factors driving the improvement of sago productivity, such as knowledge and skill
65 Type cajeput oil in the product search, or using this link. 66 http://www.alibaba.com/trade/search?fsb=y&IndexArea=product_en&CatId=&SearchText=melaleuca+honey 67 Marliati Ahmad, International Journal on Advanced Science Engineering Information Technology, 4, 3 (2014): Farmer Empowerment to Increase Productivity of Sago (Metroxylon sago spp) Farming
improvement, cultural switch to turn sago starch into a major carbohydrate intake instead of staple food, private sector promotion, and government policy support.
The revenue estimate is rather straight forward: yield x market price. The lower estimate in this report uses values from community-based sago plantation on undrained peatland in Tebingtinggi island, Riau 68, which generates about US$936 / ha / year. However, the less intensive sago farming (~26 sago trees felling / ha / year) is partially because of mixed plantations with high value (timber producing) local tree species for local housing and traditional ship construction such as Tetramerista glabra (punak) and Shorea ulliginosa (meranti bakau). Hence, the actual value per hectare is much higher than US$936/ha/year. The higher estimate is based on 10 ton/ha/year dry starch with a price at US$600/ton from Alibaba 69.
Restoring peatland with sago farm has strategic advantage to Indonesia. According to FAO data, referenced date 27-May-2016, Indonesia is still a net importer of cereals at more than 10 million tons a year with increasing trend in recent years, while there may even be 1.2 million people may face food shortage this year 70.
If Indonesia can achieve 10-15 ton/ha/year yield of dry sago starch, it will just need one million hectare of sago plantations. Besides, Marliati (2014) highlighted that there are already 2.9-million-hectare sago farms in Indonesia, though mostly at low productivity. Hence, improving the sago productivity together with new sago farm for peatland restoration can well resolve the potential food security issue in Indonesia, and turn Indonesia into a net exporter of carbohydrate products.
Having diverse economic activities and various income sources is always a good sign for stable and healthy economy. Palm oil is currently the only major edible product exported from Indonesia. With sago potentially being the next, value-added downstream economic activities such as food manufacturing for the export of food products can be well boosted. As a result, the integrated economic benefit can be far beyond the estimate in Table 5 of this report.
68 Oka Karyanto et. al. 15th International Peat Congress @ Sarawak Malaysia (Aug 2016): Farming on undrained Peatland in Riau, Indonesia: Implication for Sustainability 69 Search “sago flour” or “sago starch”: https://www.alibaba.com/trade/search?fsb=y&IndexArea=product_en&CatId=&SearchText=sago+flour 70 http://www.fao.org/giews/countrybrief/country.jsp?code=IDN