38

Reliability
Donagh Berry
Teagasc, Moorepark, Ireland

Reliability • How confident are we that the published index will not change as more information accumulates
Pedigree – own/genomic – progeny ± correlated traits

Who eats more??

Recent Tully data
Larger animals on average eat more

Multi-trait genetic evaluations

Multi-trait genetic evaluations

Multi-trait genetic evaluations
No feed intake data
Same reliability but with no feed intake data on the right

Recent Tully data
Same live-weight (and predicted feed intake) but actually very different
“curve-benders”

Recent Tully data (Lims)

Recent Tully data (Lims)
Correlation: 0.38 0.60
Variability still exists

Multi-trait genetic evaluations
No feed intake data
Same reliability but the one with actual feed intake data is more
“precise” per individual

Fertility multi- v single trait reliability
Single trait
Mu
lti-
tra
it
Reliability of bulls with no actual
fertility information comes mainly
from correlated traits

Single trait
Mu
lti-
tra
it
Fertility multi- v single trait reliability No progeny with fertility

Fertility multi- v single trait reliability Several thousand progeny with fertility
Single trait
Mu
lti-
tra
it

Fertility multi- v single trait EBVs No genomics
Single trait
Mu
lti
tra
it

Carcass weight – reliability R
ed
uce
d m
od
el (
3 m
on
ths
mo
re d
ata
– n
o g
en
om
ics)
Official August evaluation
Simplification of model
More data
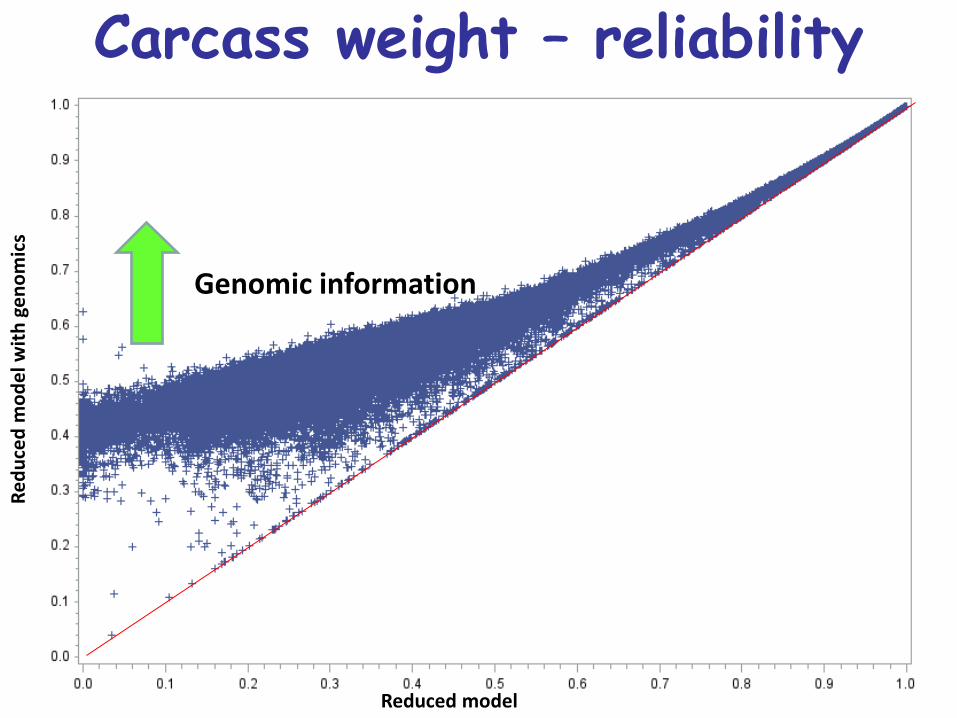
Carcass weight – reliability R
ed
uce
d m
od
el w
ith
ge
no
mic
s
Reduced model
Genomic information

Carcass weight – reliability R
ed
uce
d m
od
el w
ith
ge
no
mic
s
Official August evaluation (full model)
A few animals drop in reliability
CF48 - 46 carcasses DWB - 23 carcasses

Why simpler models? • Best reflection of genetic merit for a trait is data on the trait itself • Feed intake or live-weight??
• Complicated models are more difficult to run and take considerably longer • Computing power becomes an issue
• Carcass eval:
• 45 million 13 million equations
• 15 days 8 days
• Helps identify “curve benders”

Future • Computing
• Memory efficiency
• 16,000 Gb (traditional) 800 Gb (APY)
• 2000 laptops to 100 laptops
• Speed of evaluations
• 28 days 8 days with doubling of genotypes
• Increased efficiency is not synonymous with increased speed

Conclusions • Models changed to be more efficient with minimal loss in information
• Without genomics: drop in reliability and some movement in proofs
• More precise evaluations with genomics

Genomic evaluations research update

Current evaluations
• 6 evaluations for suckler herd
• Beef performance (29 traits: 6 goal traits)
• Calving performance (15 traits: 4 goal traits)
• maternal weaning wt (15 traits: 1 goal)
• fertility (14 traits: 3 goal traits)
• docility (3 traits: 1 goal trait),
• linear (13 traits)

Beef performance evaluation
24

Current test run
•August 2015 evaluation files
• 105,000 genotypes included
• 6 evaluations completed
– Carcass wt (12trt), conformation (9 trt),
feed intake and fat (12 trt), fertility (6 trt),
docility (3 trt) evaluations completed
• Run with 150,000 genotypes and
December evaluation files not
completed yet

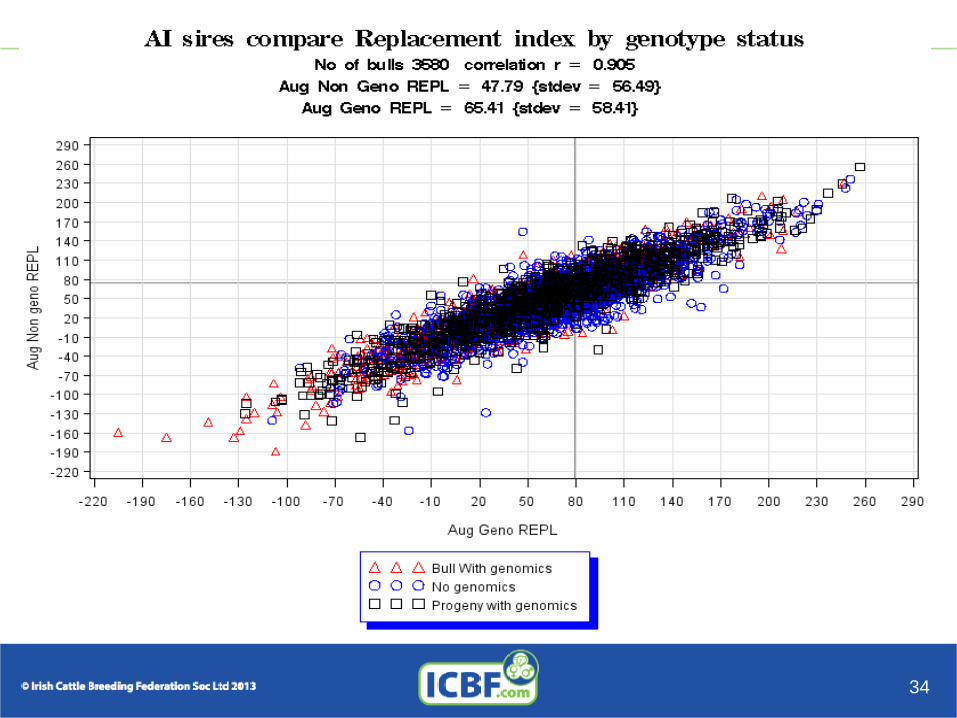
Proportion of Replacement index
with genomics
26

27

28

29

30

31

32

33
34

35

36

Genotyped non AI animals
37

Workplan
• Commencing new round of evaluations
next week
• Update phenotypic and pedigree data
• Update genotype file
• More test results when that run is finished in
late February/ Early March


