1 Working Group: Quality and Impact Working group Task and Finish Group Name: Metrics Document Title: Principles for Metrics – Report and recommendations Date: May 2016 Introduction: Measuring the activity and impact of Library and Knowledge Services (LKS) has never been more important. Concerns with being able to clearly explain our work are brought to the fore in an increasingly competitive environment for securing financial resources. The Knowledge for Healthcare framework reflects the importance of good metrics in checking our progress. Good metrics can support the case for the high quality library services needed to under pin NHS care, research and staff development. However setting good metrics is not straight forward. The Metrics Task and Finish group were asked to examine the literature and identify appropriate methodologies and mechanisms for library metrics and KPIs. The report starts by considering the history of metrics in NHS library management and assessment. It looks at the applicability of metrics within different library and non- library settings. The review draws on a scoping review of the literature to develop its findings and conclusions. Principles for the creation of good metrics are advanced. The “metrics for success” defined in the Knowledge for Health framework, along with others in use in NHS LKS, are reviewed in the light of these principles.
Transcript
1
Working Group: Quality and Impact Working group
Task and Finish Group Name: Metrics
Document Title: Principles for Metrics – Report and recommendations
Date: May 2016
Introduction:
Measuring the activity and impact of Library and Knowledge Services (LKS) has never been more important. Concerns with being able to clearly explain our work are brought to the fore in an increasingly competitive environment for securing financial resources. The Knowledge for Healthcare framework reflects the importance of good metrics in checking our progress. Good metrics can support the case for the high quality library services needed to under pin NHS care, research and staff development. However setting good metrics is not straight forward. The Metrics Task and Finish group were asked to examine the literature and identify appropriate methodologies and mechanisms for library metrics and KPIs. The report starts by considering the history of metrics in NHS library management and assessment. It looks at the applicability of metrics within different library and non-library settings. The review draws on a scoping review of the literature to develop its findings and conclusions. Principles for the creation of good metrics are advanced. The “metrics for success” defined in the Knowledge for Health framework, along with others in use in NHS LKS, are reviewed in the light of these principles.
2
Definitions and terminology The term ‘metric’ is itself open to misunderstanding, because something can be a metric in one context but not in another. To reduce the scope of possible misunderstanding, this report will adopt the following definitions and terminology throughout. Term Definition
Balanced Scorecard The balanced scorecard is a strategic planning and management system that aims to align business activities to the vision and strategy of the organization, improve communication, and monitor performance against strategic goals. It adds strategic non-financial performance measures to traditional financial metrics to give a more 'balanced' view of performance. http://balancedscorecard.org/Resources/About-the-Balanced-Scorecard
Key Performance Indicators
Key Performance Indicators (KPI) are financial and non-
financial metrics used to quantify objectives to reflect
strategic performance of an organisation. http://www.sconul.ac.uk/page/key-performance-indicators
Library Evaluation frameworks An evaluation framework (sometimes called a Monitoring,
Evaluation and Learning framework) provides an overall framework for evaluations across different programs or different evaluations of a single program (e.g. process evaluation; impact evaluation). This can include guidance on data sources and management processes, as well as an overall program theory/logic model.
However sometimes the term 'evaluation framework' is used to refer to a plan for a single evaluation or to an organisational policy.
Metric "A metric is criteria against which something is measured" (Ben Showers (2015) Library Analytics and Metrics) and "a criterion or set of criteria stated in quantifiable terms" (OED)” A metric measures an effect.
Examining the literature A scoping search was completed to inform the review’s work. We also drew on the work of the Task and Finish Groups around Impact and the Library Quality Assurance Framework. The findings of a non exhaustive literature review have been incorporated into this report at appropriate points, and details of the papers found can be found as an appendix. The databases LISA, LISTA, Medline and ERIC were searched further details are in Appendix 1 The Internet was also searched for policy documents or reports in this field. Only articles written since 2000 were included.
Approaches in NHS Library Services
This section considers some of the ways that NHS LKS have addressed quality assurance and performance measurement. In each case there are lessons we can learn when considering the design of future metrics.
HELICON The current NHS Library Quality Assurance Framework (LQAF) builds upon previous quality assurance tools that were used to assess the quality of library services. The Health Libraries and Information Confederation (HELICON) scheme was the first national scheme for the accreditation of libraries in the health sector and it aimed to provide a consistent means of assessing standards. The HELICON scheme consisted of a checklist of assessment criteria against which services were measured. The checklist was designed to be used to assess a wide range of health library and information services including NHS libraries. Libraries were expected to be re-accredited every three years, the interim period allowed effective use of the checklist to plan, implement and demonstrate the impact of service improvements. There were 3 main assessment criteria:
Criteria 2: Resources (finance, staff , IT , accommodation and equipment )
Criteria 3: Stock and services (stock, services, induction & user education )
4
HELICON recognised stages of completion based on achievement against essential criteria and additional graded criteria.
Stage One Standard Accreditation The library service fulfilled the essential criteria AND up to 40% of the graded criteria were marked as Grade 2 (‘excellent’).
Stage Two Accreditation with some areas of excellence The library service fulfilled the essential criteria AND between 40% and 80% of the graded criteria were marked as Grade 2 (‘excellent’).
Stage Three Accreditation with significant evidence of excellence and innovation The library service fulfilled the essential criteria AND 80% or more of the graded criteria were marked as Grade 2 (‘excellent’).
The manager of each library service being assessed submitted a portfolio of evidence. There followed a pre-arranged accreditation visit to the service by an external assessment panel, which included at least one qualified librarian. Assessors met with the library manager, library staff, a group of library users and key managers from the parent organisation. Informal feedback was given at the end of the visit, followed by a formal report to the Chief Executive of the parent organisation, copied to key stakeholders including the Deanery. Benefits
First scheme to assess all NHS LKS against the same criteria.
A rigorous framework with detailed checklist, guidelines and grading scheme
to enable national benchmarking.
Framework designed to demonstrate service improvements and impact.
Visits required attendance of senior stakeholders.
Challenges
The collection and compilation of evidence was laborious; evidence was
mostly printed and displayed in folders.
Assessors needed to include adequate time to view printed evidence during
visits.
Constraints of arranging a private space for assessors to work,
accommodating a large meeting, organising the presentation of evidence and
cost of catering.
Difficulty of assembling all required participants – both for assessors and from
host Trust
5
NHS Library/Knowledge Services Statistical Returns The annual statistical collection is part of the HEE LKSL work programme and each library/knowledge services collects and submits standardised data about their activities for the previous year. Activities reported on include: Library users, PCs, finance, loans, article requests, inter library loans, searches, enquiries, training, induction, current awareness, physical collections, e-resources, and staffing. This data has been collected in some form since 1970s (Ferguson, 2013) and has been collated nationally by:
NHS Regional Librarians Group (RLG) until March 2002
NHS Library and Knowledge Development Network (LKDN) from April 2002
until March 2006
National Library for Health (NLH) from April 2007 until March 2009
Strategic Health Authority Library Leads (SHALL) from April 2009 until March
2013
HEE LKS Leads from April 2013.
Some published reports and data analysis can be located and viewed via the NHS Library and Knowledge Services (2015a) web site. The data collected by the HEE LKS leads is used to benchmark services and establish trends and is currently being used to inform Knowledge for Healthcare projects. A number of reports (income, expenditure, staffing, stock and services) have been produced over the years which collate this data and are available via the member’s area of the NHS Library and Knowledge Services (2015b) web site. Benefits
Data has been collected in a fairly consistent form over a long period and thus
provides a good overview of trends in resource use, funding allocation and
numbers of staff working in the sector.
A review of some of the published reports demonstrates an over 80%
completion rate in many regions and therefore the data provides a fairly
comprehensive picture.
Challenges
A review of some reports indicates that some regions provide more
comprehensive data than others, so there are inconsistencies in coverage.
Some regions have never provided financial data for example, so the picture
is incomplete.
Data may be collected differently by each service and this could deliver
inconsistencies. For example, different approaches to collating information
about enquiries makes it difficult to draw comparisons.
6
Financial data is present to a varying extent. In the case of Higher Education
Libraries serving the NHS there are issues around reporting periods.
Data collection may be subject to interpretation, or be influenced by local
factors. For example, services may define a library user differently, meaning
that data is not comparable from service to service.
7
Library Assurance Quality Framework (LQAF) The LQAF replaced the HELICON scheme as the key measure for assessing the quality of NHS Library/Knowledge services in April 2010. It is a quality assessment tool which aims to apply equally to all NHS services whether a knowledge service, library, resource centre, information unit or an individual specialist. The most recent version of the LQAF is version 2.3, published in May 2014. The self-assessment checklist is completed annually and is supported with evidence of compliance. The LQAF checklist is organised around five core domains, each containing a number of assessment criteria:
Domain 1 Strategic Management
Domain 2 Finance and Service Level Agreements
Domain 3 Human Resources and Staff Management
Domain 4 Infrastructure and Facilities
Domain 5 Library/Knowledge Services Service Delivery and Development
Criteria There are 48 unique criteria in total and each service is assessed on the number of criteria which relates to their service to ensure equitability. For example, if a service does not hold any SLAs, this criterion is marked as non-applicable and the service will be assessed against 47 criteria. For each criterion the service supplies a statement of compliance, evidence and a self-assessed rating. Submission and assessment Submissions are made annually and a score is generated based on the self- assessment. HEE Library and Knowledge Services Leads (LKSL)/ Quality Leads review compliance of services using a selection of the following methods:
Annual random sampling of library/knowledge services.
Annual specific sampling of library/knowledge services against a range of
criteria.
Annual Peer Reviews/Peer Support visits to all library/knowledge services.
Three or four yearly Peer Review visits/Peer Support visits to all
library/knowledge services.
Annual/three or four yearly Peer Reviews visits on an exception reporting
basis.
Benefits
Several years data for a large number of LKS
Enables all NHS Library/Knowledge/Information/Resource services to be
assessed against the same criteria, enabling accurate benchmarking.
Provides a rigorous framework for quality assurance for services.
There is less emphasis on a formal visit and assessment as with HELICON.
8
Challenges
HEE Library and Knowledge Services Lead (LKSL)/ Quality Leads do not use
the same review processes, so services across the country are not measured
in the same way.
Self assessment is subjective and therefore can lead to inconsistencies e.g. 2
services similar in nature will score differently.
Although the LQAF is designed to apply equally to all services, this may not
be the case in practice.
There is less emphasis on a formal visit and assessment as with HELICON,
so there may no longer be the opportunity to meet the Chief Executive.
The amount of evidence needed to demonstrate compliance is a burden for
library teams.
SHALL National Key Performance Indicators In 2011 work was undertaken by the SHALL Library Services Development Group (LSDG) to examine potential national metrics. A set of six national KPI were consulted upon:
KPI1. Percentage of the organisation’s workforce (headcount) which are “active” library users. (Indicates penetration of library service).
KPI2. Percentage of the organisation’s workforce (headcount) which are registered ATHENS users. (Indicates use of e-resources) (E.g., 1000 Athens users in an organisation of 10,000 staff = 10% )
KPI3. Re-current expenditure commitment on library services based on the organisation's workforce (WTE). (Indicates Trust commitment to Library Services). (E.g., £100,000 spent on Library services in a Trust of 10,000 staff = £10 is spent on library services per WTE)
KPI4. Number of information consultancy enquiries per member of staff based on the organisation's workforce (WTE). (Indicates penetration level of Library enquiries on the organisation). (E.g., 400 enquiries in an organisation with 1,000 staff = a penetration level of 0.4)
KPI5. Percentage of the organisation's workforce (headcount) that subscribe to current awareness services. (Indicates penetration level of current awareness services on the organisation).
9
KPI6. Percentage of organisation's workforce (headcount) which have received information skills training in one year. (Indicates penetration of information skills/information literacy training on organisation).
Extensive feedback was received around potential issues with these KPI. Areas of particular concern were the potential for perverse incentives / gaming, lack of meaning, variations / burden of data collection and variation in services being compared.
A set of revised proposals were advanced in 2012 reflecting the feedback and developing picture in quality assurance:
KPI1. Percentage of the organisation’s workforce (headcount) who are registered library members. (Indicates penetration / awareness of the library service). KPI 2. Percentage of the organisation’s workforce (headcount) who have registered as a library member in the last year. (Indicates level of penetration / awareness of the service in the last year) KPI2. Percentage of the organisation’s workforce (headcount) who have used ATHENS in the last year. (Indicates use of e-resources) KPI7. Percentage increase in compliance with the Library Quality Assurance Framework (LQAF) compared with the previous year. (Indicates level of improving quality). The proposed KPI were not implemented at a national level.
10
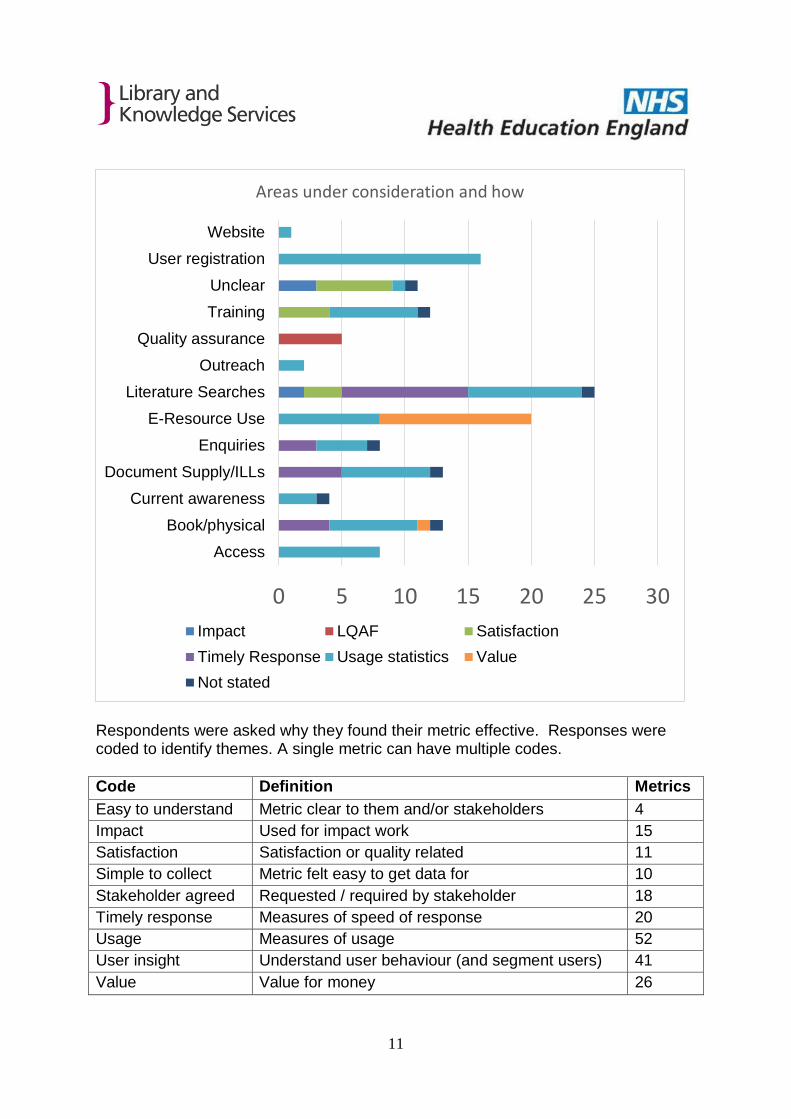
Current approaches – Survey
We carried out a brief survey to support our understanding of how LKS are currently using metrics.
The survey asked people to identify the metrics they are currently using that they felt were most effective. There was space for three metrics but people could offer more by completing a further survey or fewer if they wished. In each case they were asked to name their metric, describe how they collect data and explain why they felt it was effective.
150 responses were received with 47 of these including at least one metric. A total of 117 metrics were suggested in all.
Responses were received from across England and from teams working with primary, acute and mental health staff. The majority of responses came from services based in NHS organisations but local government and higher education were represented.
A wide range of service areas are being examined. Most approaches include usage data either system generated or manually recorded. More complex measures included LQAF and survey tools that included satisfaction measures. Focus for metrics was frequently linked to areas where large inputs of staff time are required or where data is readily available.
11
Respondents were asked why they found their metric effective. Responses were coded to identify themes. A single metric can have multiple codes.
Code Definition Metrics
Easy to understand Metric clear to them and/or stakeholders 4
Impact Used for impact work 15
Satisfaction Satisfaction or quality related 11
Simple to collect Metric felt easy to get data for 10
Stakeholder agreed Requested / required by stakeholder 18
Timely response Measures of speed of response 20
Usage Measures of usage 52
User insight Understand user behaviour (and segment users) 41
Value Value for money 26
0 5 10 15 20 25 30
Access
Book/physical
Current awareness
Document Supply/ILLs
Enquiries
E-Resource Use
Literature Searches
Outreach
Quality assurance
Training
Unclear
User registration
Website
Areas under consideration and how
Impact LQAF Satisfaction
Timely Response Usage statistics Value
Not stated
12
Survey responses showed a mixed level of understanding of metrics. Pure activity measures were offered unqualified. A number of suggestions did not meet the metric definition.
The reluctance to offer metrics showed by the many blank entries was disappointing. Potential causes for these submissions could be the design of the survey (first page asked for demographic questions without showing questions about metrics), the high number of surveys underway for Knowledge for Healthcare and the known reluctance of people to use metrics. John van Loo (in Haines-Taylor and Wilson, 1990) identified seven potential reasons for a poor level returns to the then Regional Librarians Group statistics collection. Many of these are likely still in force such as wariness around sharing figures nationally where they may be stripped of local context, limited collection of such data by librarians and a preference for qualitative measures. Limitations around the quality of electronic resource data were flagged by respondents but cost per download was the single most widely used metric. Cost per download / usage was widely used to support decision making including consideration of activity by different user groups. Examination of electronic usage is taking place via title level data, at publisher collection level and by looking at patterns by staff group using a combination of OpenAthens and publisher supplied data.
Speed of response was felt useful to flag staffing issues and to reassure users. However it was recognised that most deadlines were negotiated and prioritised accordingly.
Service level agreements could be seen driving the adoption of metrics that are readily comprehensible to stakeholders.
The high cost of literature search services makes them a strong focus. Indeed it was notable that many of the aspects targeted reflect the priority areas for examination suggested by van Loo (1990) namely those that are:
* time consuming * space intensive * high cost * affect most users * directly linked to library objectives * well defined and easy to describe * relatively easy to collect * are in areas where library staff have some control to make changes
While incomplete the survey provides a snap shot of current practice.
13
Approaches in other library settings
International Standard A generic approach to considering performance indicators for libraries is available via the 2014 International Standard (ISO 11620:2014 Information and documentation -- Library performance indicators). This starts with careful definitions of terms. Starting from a position where everyone understands the same thing as being an “Active user” or a “loan” is vital to allow any kind of comparison. It is noteworthy that the standard warns that indicators are most useful for comparing over time within the same library and should be used cautiously for comparisons between services. The standard suggests a balanced scorecard approach under four headings:
1. Resources, access and infrastructure (adequacy and availability) 2. Use (activity) 3. Efficiency (costs per use, processing time etc) 4. Potentials and development (use of staff for value added work, staff training
activity) Within this indicators are also categorized as collections, access, facilities, staff and general. The bulk of the document consists of descriptions of 52 indicators that are viewed as being the most useful for libraries in general. As such it offers a valuable resource in identifying potential options for NHS LKS to consider. The standard offers a series of criteria for testing a performance indicator
1. Informative content (provides information for decision making 2. Reliability (produces same result when repeated) 3. Validity (measures what it is intended to measure – though indirect measures
can be valid) 4. Appropriateness (units and methods of measurement appropriate to purpose) 5. Practicality (does not require unreasonable staff or user time) 6. Comparability (the extent to which a score will mean the same for different
services – standard is clear you should only compare similar services) SCONUL Value and Impact Study SCONUL launched a project in this area in the summer of 2014. A decision was made to not run the project to completion but (at January 2016) a collation of materials identified to support this work remains available as a resource https://pinboard.in/t:sconulvalueandimpact/
RLUK Service Standards The Research Libraries UK (RLUK) group is currently working on Service Standards. A set of eight initial service standards have been piloted. Standards took the form of statements such as “We will achieve at least 90% satisfaction rating on Question 16 in the National Student Survey”. Following this pilot the model is shifting towards one of benchmarking. This will remove targets set externally to local circumstances and stakeholder demand. These will be rephrased as metrics that can then be used to examine performance against other similar organisations. One proposal is to have a kite mark for those in the top quartile for a metric. These changes reflect that what is important can vary from organisation to organisation. Service standards should reflect what is required locally to meet user needs. Other
A helpful set of principles for metrics is offered by Ben Showers (2015)
1. Measure what matters 2. Don’t collect things if you are not going to act on them 3. Make as much data available as possible
Approaches in non library settings
The Metric Tide
There has been much debate around the use of metrics in higher education settings from the significant work to deliver the 2014 REF Research Excellence Framework to altmetrics. The Metric Tide report was published by HEFCE in 2015 and explores this developing picture with particular attention to research assessment and management. Issues identified are applicable in NHS LKS. These include the potential for the creation of perverse incentives. Examining the REF results where a peer review system was also in place showed agreement was often poor between expert qualitative conclusions and those suggested by the metrics. They preferred the term indicators “A measurable quantity that ‘stands in' or substitutes for something less readily measurable and is presumed to associate with it without directly measuring it. For example, citation counts could be used as indicators for the scientific impact of journal articles even though scientific impacts can occur in ways that do not generate citations”.
The Metric Tide offered five dimensions for responsible metrics that need little reframing for NHS LKS
15
“Robustness: basing metrics on the best possible data in terms of accuracy
and scope
Humility: recognising that quantitative evaluation should support – but not
supplant – qualitative, expert assessment
Transparency: keeping data collection and analytical processes open and
transparent, so that those being evaluated can test and verify the results
Diversity: accounting for variation by field, and using a range of indicators to
reflect and support a plurality of research and researcher career paths across
the system
Reflexivity: recognising and anticipating the systemic and potential effects of
indicators, and updating them in response.”
National Library of Quality Assurance Indicators
The Health and Social Care Information Centre was tasked by the Health and Social
Care Act 2012 with the creation and maintenance of a National Library of Quality
Assurance Standards. These measures relate to areas of healthcare delivery and
performance (for example Hip fracture incidence) but they publish their tool for
determining if an indicator is of sufficient quality for inclusion in the Library.
The top level of these criteria are applicable to the development of library metrics
1. Relevance (Does it meet user need? Is it actionable?)
2. Accurate and reliable (Quality of data? Is it a good estimate of reality?)
3. Timeliness and Punctuality (How long after the event is data available /
collected?)
4. Accessibility and clarity (How easy is to access the data? How easy is it to
interpret?)
5. Coherence and comparability (Are data from different sources on the same
topic similar? Can it be compared over time?)
6. Trade-offs (Would improving this metric have a negative impact on another?)
7. Assessment of user needs and perceptions (What do stakeholders think?)
8. Performance, cost and respondent burden (How much work is involved in
collection?)
9. Confidentiality and transparency
16
Principles for NHS LKS Metrics
Drawing on our research the working group met to devise a set of principles for NHS
LKS metrics. Our overall grouping of these principles was based on an article by
Markgraf (undated). The result is a set of statements that can be used to test a new
metric under consideration.
A good metric is:
Meaningful
- the metric relates to the goals of the organisation, to the needs of the users and is
reexamined over time for continuing appropriateness.
Actionable
- the metric must be in areas that the LKS can effect. The metric drives changes in
behaviour. The reasons for changes to a metric should be investigated not assumed.
Reproducible
- the metric must be clearly defined in advance of use and transparent. It should be
able to be replicated over time and constructed with the most robust data available.
Collection of data for the metric should not be burdensome to allow repetition when
required.
Comparable
- the metric can be used internally by the LKS over time and externally to benchmark
against similar services. The diversity of services must be respected.
17
Testing the metrics for success
Using the proposed principles we examined the Metrics for success from Knowledge
for Healthcare (these are presented first in their original form italicised and
underlined). Generally the metrics for success take the form of targets rather than
metrics. We would recommend an approach more similar to that being adopted by
RLUK to drive comparison rather than address a target that may not be meaningful.
Increase in use of the refreshed Impact Toolkit: used by 95% of services
Suggested revision - % of LKS declaring full compliance with Impact criterion in
LQAF
The revision reflects a meaningful goal, drives changes to behaviour, uses best data
available without additional effort and can be compared through time. By examining
the evidence presented in support of LQAF compliance the use of the refreshed
Impact Toolkit itself can be examined. The percentage uptake should rise as LKS
Managers find the Toolkit an effective means to meet their local needs to measure
and report impact.
Proportion of library and knowledge services over 90% compliant with NHS Library
Quality Assurance Framework: 98%
Suggested revision - % compliance with LQAF
The shift here is to reflect the need for benchmarking rather than a target applied
across all levels. What the metric tells us and the investigations it drives will vary
according to the stakeholder and organisational circumstances. For LETB Leads the
98% figure may be the area of discussion with HEE but for the LKS Manager there
may be alternate local drivers (for example a target set in the Learning Development
Agreement).
18
Increase the proportion of staff in four target groups (medical and dental; nursing and
midwifery; allied health; scientific and technical) using NHS-funded knowledge
resources and services: by 20%
Across the whole NHS workforce, increase the number of staff using NHS-funded
knowledge resources and services: by 10%
These metrics fail to meet the principles. There are issues with definitions, baseline
data, comparability and reproducibility. It is not possible to construct a nationally
meaningful metric without first creating a set of transparent definitions and baselines.
Suggested revision - % of LKS recording activity / usage data (LQAF 5.3j)
- % of LKS delivering action plans informed by activity / usage data (LQAF 1.2e)
The suggested revision would make use of existing LQAF data and evidence
collection. This could then be strengthened by the development and sharing of
activity related metrics suitable for local use. In some cases these may be assessed
to allow for wider comparison between similar services.
An initial suggestion for a generally applicable metric is:
Number of Active OpenAthens users in period X of resource Y
This would be effective for those resources that are not able to be IP enabled and
where all access is via OpenAthens.
The majority of activity related measures are only going to be useful internally as
variations in service, organisation type / scale and data recording render national
benchmarking challenging. Examples here could include:
Loans by user group over time
Registration (Library or OpenAthens) by user group / organisation over time
Gate counts
Enquiry sample weeks
Other specific examples should be sought and shared.
19
Increase in proportion of knowledge services with clinical/outreach librarians: from
58% to 80%
Suggested revision - % of LKS with full compliance for 5.3H
As with the overall compliance metric the evidence and investigations that spring
from the LQAF return will need to vary according to stakeholder requirements and
local service development. Patterns of development can be considered at a higher
level as role definitions become clearer.
Increase in production and use of nationally-produced horizon scanning bulletins:
25% increase in Year 1; 10% in Years 2 and 3
The meaning of this target is unclear and it is not workable as it stands (for example
the metric combines usage and production in a single percentage). A usable metric
should be defined by the Current Awareness KfH group.
Define and publish core and specialist competencies
This is a working group deliverable.
Double the amount of investment in national, collaborative procurement of e-
resources
While this will be an indicator at national level the baseline needs to be clarified.
The International Standard offers a set of 52 potential metrics within a balanced
scorecard approach. Appendix 2 presents the broad categories that may be useful
when considering areas to try and set metrics.
20
Recommendations
1. The principles for NHS LKS metrics proposed in this report should be adopted
2. Where metrics are introduced they should be framed for comparison rather
than as targets
3. A model metric template based on those in the International Standard should
be created and linked with the refreshed Impact Toolkit
4. Further work should be completed to define terms around metrics to facilitate
meaningful comparison
5. A shared national library of useful metrics should be created using the
template format
21
References
Dugan, R., Hernon, P. and Nitecki, D. A. (2009) Viewing Library Metrics From Different Perspectives: inputs, outputs and outcomes. Oxford, Libraries Unlimited.
Ferguson, L (2013) Overview of National NHS Library/Knowledge Services Income, 2008-09 to 2012-13 [Online] Available at: http://www.libraryservices.nhs.uk/document_uploads/Statistics/NHS_LKS_Income_2008-09_to_2012-13.pdf Date accessed 4.12.2015 Haines Taylor, M. & Wilson, T. (1990) Quality assurance in libraries: the health care sector. Health Education England Library and Knowledge Services Leads (HEE LKSL) (2014) NHS Library Quality Assurance Framework (LQAF) England [Online] Available at: http://www.libraryservices.nhs.uk/document_uploads/LQAF/LQAF_Version_2.3_May_2014_30032.pdf Date accessed: 3/12/2015 Markgraf, D. (unknown) What is a good performance metric? Houston Chronicle. [Online] Available at: http://smallbusiness.chron.com/good-performance-metric-58177.html Date accessed: 18/12/2015 Health & Social Care Information Centre - National Library of Quality Assurance Indicators. [Online] Available at: http://www.hscic.gov.uk/article/5175/Library Date accessed 14/1/2016 NHS Library & Knowledge Services (2015) Library Quality Assurance Framework [Online] Available at: http://www.libraryservices.nhs.uk/forlibrarystaff/lqaf/ Date accessed: 1/12/2015 NHS Library and Knowledge Services (2015a) NHS Library/Knowledge Services
Statistics [Online] Available at:
http://www.libraryservices.nhs.uk/forlibrarystaff/information/statistics.html Date
accessed 4.12.2015
NHS Library and Knowledge Services (2015b) Reports on the collated annual statistics [Online] Available at: http://www.libraryservices.nhs.uk/forlibrarystaff/membersarea/nhsstatistics/nhs_statistics/nationalreports.html Date accessed 4.12.2015 (login required) NHS Library & Knowledge Services (2015) Library Quality Assurance Framework [Online] Available at: http://www.libraryservices.nhs.uk/forlibrarystaff/lqaf/ Date accessed: 1/12/2015 Showers, B. (2015) Metrics: counting what really matters. Cilip Update. Feb. 42-44.
Databases searched: LISA, LISTA, ERIC and HDAS clinical databases The initial search used “NHS or Health” to narrow the field but the Task and Finish Group agreed that the search should be kept as broad as possible> The search keywords were librar*; metrics or measur* Exclusion criteria: Focussing on one aspect of measurement which could not be generalised for example, student staffing on circulation desks Too old to be appropriate for example, measuring electronic resource use pre 2003 COUNTER compliance usage
23
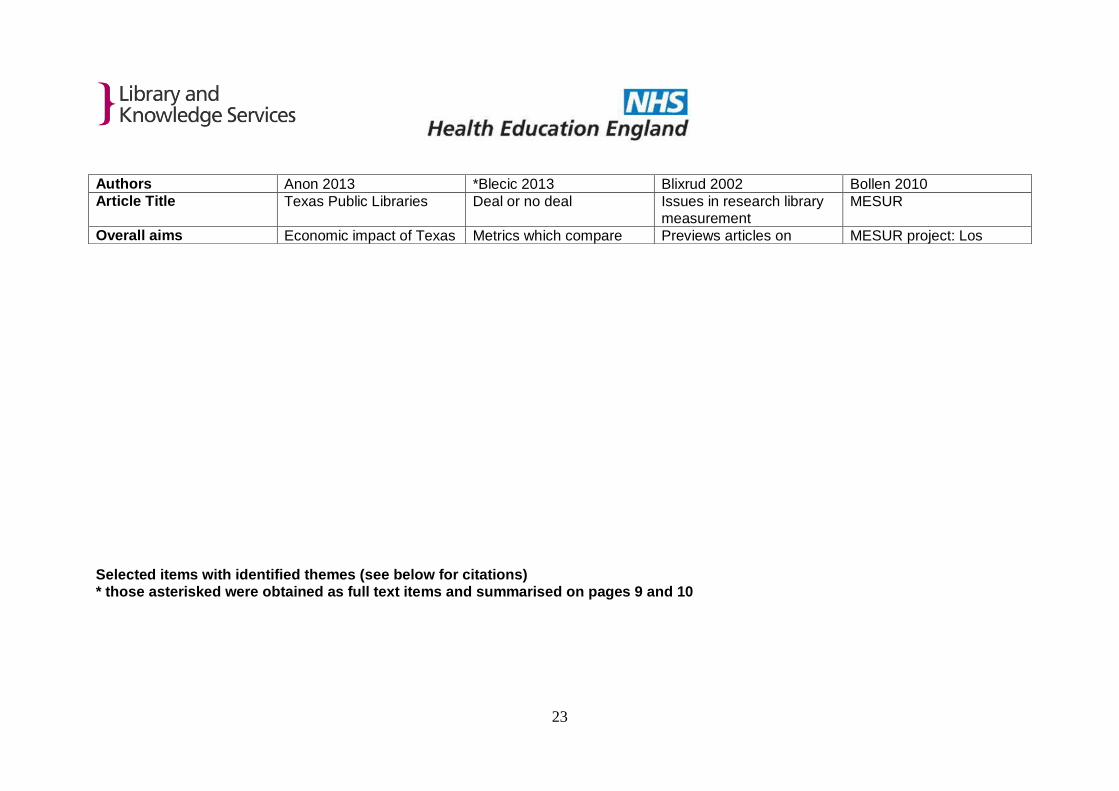
Selected items with identified themes (see below for citations) * those asterisked were obtained as full text items and summarised on pages 9 and 10
Authors Anon 2013 *Blecic 2013 Blixrud 2002 Bollen 2010 Article Title Texas Public Libraries Deal or no deal Issues in research library
measurement MESUR
Overall aims Economic impact of Texas Metrics which compare Previews articles on MESUR project: Los
24
public libraries Big Deal journal packages performance measurement
Alamos laboratory research library’s metrics.
Academic field(s) Public Libraries state wide Academic Libraries Research Libraries Research libraries
Study findings presented by the authors
Expenditure on services compared with what those services brought the community, seen as a good return on investment, included factors such as employment for those people supplying goods to the public libraries.
This paper presents methods to develop metrics that compare Big Deal journal packages and the journals within those packages, Journal selection must also involve informed judgment about a library’s subject coverage needs and alternative sources of access.
Need to balance continuing and emerging realities in library assessment
Measurement of journal usage and citation based analysis to assess scholarly impact
Application to NHS Libraries
A similar wide range of data collection might be applied nationally to show return on investment for the NHS
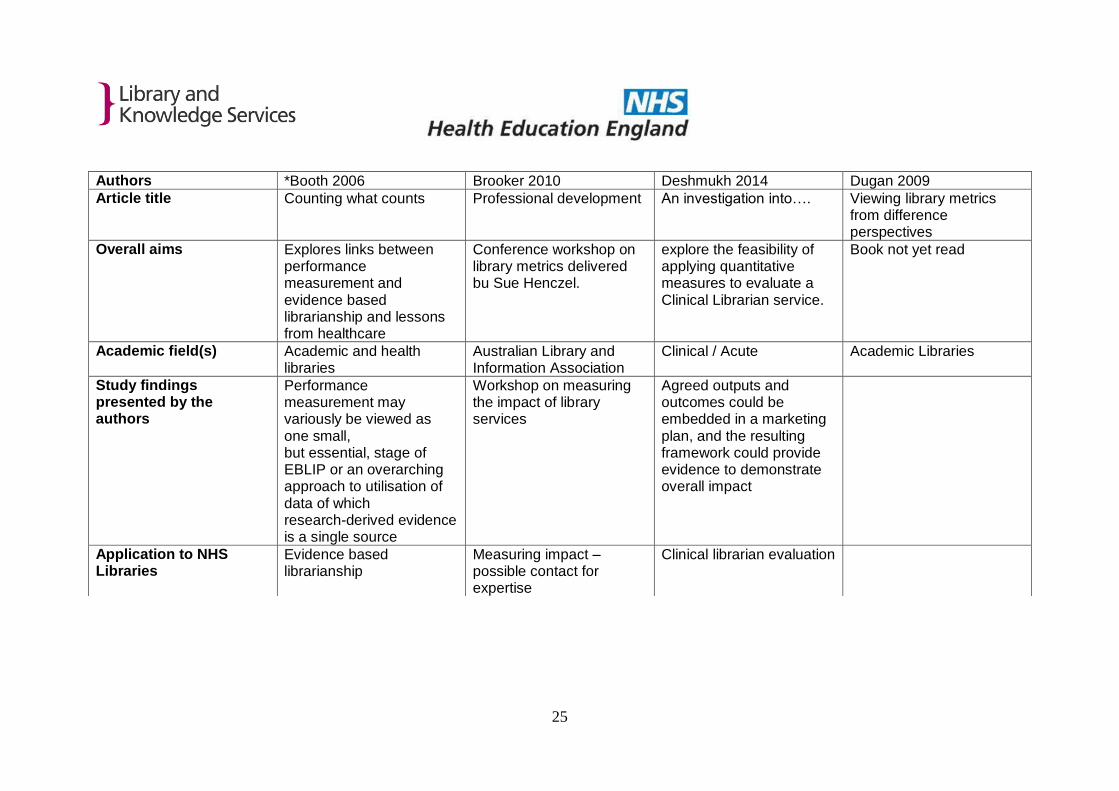
Article title Counting what counts Professional development An investigation into…. Viewing library metrics from difference perspectives
Overall aims Explores links between performance measurement and evidence based librarianship and lessons from healthcare
Conference workshop on library metrics delivered bu Sue Henczel.
explore the feasibility of applying quantitative measures to evaluate a Clinical Librarian service.
Book not yet read
Academic field(s) Academic and health libraries
Australian Library and Information Association
Clinical / Acute Academic Libraries
Study findings presented by the authors
Performance measurement may variously be viewed as one small, but essential, stage of EBLIP or an overarching approach to utilisation of data of which research-derived evidence is a single source
Workshop on measuring the impact of library services
Agreed outputs and outcomes could be embedded in a marketing plan, and the resulting framework could provide evidence to demonstrate overall impact
Application to NHS Libraries
Evidence based librarianship
Measuring impact – possible contact for expertise
Clinical librarian evaluation
26
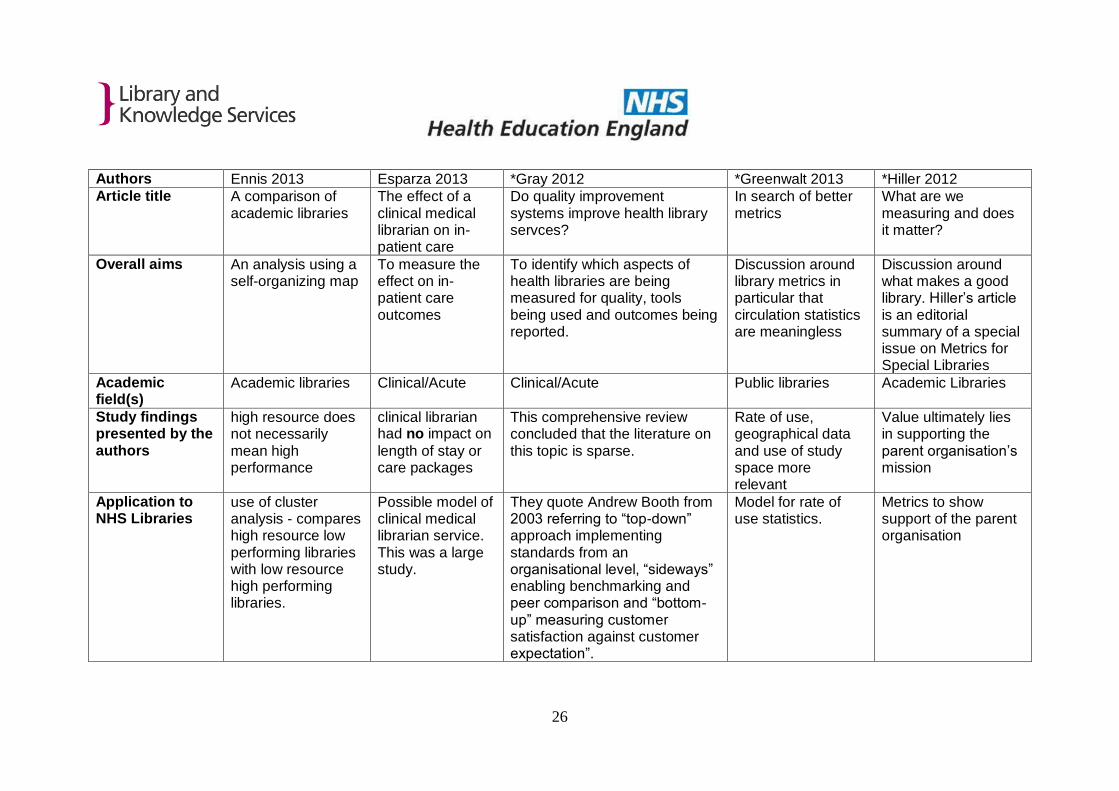
Authors Ennis 2013 Esparza 2013 *Gray 2012 *Greenwalt 2013 *Hiller 2012 Article title A comparison of
academic libraries The effect of a clinical medical librarian on in-patient care
Do quality improvement systems improve health library servces?
In search of better metrics
What are we measuring and does it matter?
Overall aims An analysis using a self-organizing map
To measure the effect on in-patient care outcomes
To identify which aspects of health libraries are being measured for quality, tools being used and outcomes being reported.
Discussion around library metrics in particular that circulation statistics are meaningless
Discussion around what makes a good library. Hiller’s article is an editorial summary of a special issue on Metrics for Special Libraries
Academic field(s)
Academic libraries Clinical/Acute Clinical/Acute Public libraries Academic Libraries
Study findings presented by the authors
high resource does not necessarily mean high performance
clinical librarian had no impact on
length of stay or care packages
This comprehensive review concluded that the literature on this topic is sparse.
Rate of use, geographical data and use of study space more relevant
Value ultimately lies in supporting the parent organisation’s mission
Application to NHS Libraries
use of cluster analysis - compares high resource low performing libraries with low resource high performing libraries.
Possible model of clinical medical librarian service. This was a large study.
They quote Andrew Booth from 2003 referring to “top-down” approach implementing standards from an organisational level, “sideways” enabling benchmarking and peer comparison and “bottom-up” measuring customer satisfaction against customer expectation”.
Model for rate of use statistics.
Metrics to show support of the parent organisation
27
Authors *Hunter 2011 Jackson 2015 Ju 2013 Jurczyk 2014
Article title Can money buy happiness?
University rankings Incorporating nonparametric statistics
What’s the big deal?
Overall aims Analysis of 2007 data In Idaho from LibQUAL+[TM] and the ACRL Library Trends and Statistics database.
Compares the library-related results of two university ranking publications with scores on the LibQUAL+™ survey to identify if this measure of library service quality is related to the ranking
The general goal of this article is to explore how nonparametric statistical techniques could mitigate lack of statistical testing when using the Delphi method of research.
Canadian libraries measurement of Big Deal consortium package on a national scale.
. The results show that users of larger, better funded libraries have higher expectations for information resource availability, but not higher satisfaction scores. Furthermore, the data show no significant correlation between library usage statistics and user satisfaction.
The results suggest that some indicators used to rank universities favor libraries with more highly rated physical facilities, while largely ignoring the impact that other services have on library quality.
The incorporation of the nonparametric statistics into the Delphi method may enhance its rigour as a research method and provide evidence for its reliability and validity
The article establishes the need to consider multiple proxies for journal value in collection evaluation and encourages collaborative evaluation approaches.
Start a new fire Collaborative assessment Value of collections
Overall aims [Slovenian] Description of Slovenian libraries statistical indicators based on ISO 11620
Review of library measurement over two decades.
Collaborative assessment North American academic libraries’ experiences using the Balanced Scorecard to measure performance and show value
A study of Australia’s group of 8 University libraries
Academic field(s) Public libraries Academic Libraries Academic libraries Academic Libraries Study findings presented by the authors
Interactive data portal to create library effectiveness on the basis of selected performance indicators. The main critierion for the selection of indicators was the quality of the statistical data, Also developed to be interactive for gathering and formulation of opinions as it tracks library development and progress.
Measuring libraries’ value in terms of supporting improved undergraduate learning outcomes will lead to increased funding prospects and greater relevancy.
The participating libraries identified ten commonly measured “themes” - key areas of focus present in three out of the four local sites. Themes were: the customer – quality of physical space, customer satisfaction, instruction, document delivery, and collection preservation /discovery; financial health – revenue generation; learning and growth – employee satisfaction and diversity; internal processes – library promotion and assessment of services
Libraries support research and education which in themselves are difficult to assign precise economic value.
Application to NHS Libraries
Method for tracking library development and progress
use of balanced scorecard methodology
Can’t tell from the abstract
29
Authors Murphy 2012 Nicholson 2006 Shupala 2011 Stewart 2010
Article title Implementing the customer contact centre
The basis for bibliomining Measuring academic library efficiency
Whither metrics?
Overall aims To create a valid measurement system for assessing and improving a library’s telephone services
Bibliomining digital library services
Measuring academic library efficiency and alignment with institutional resource utilization priorities using data envelopment analysis: An analysis of institutions of higher education in Texas and their libraries
Assesses the publication impact of practising academic librarians.
Academic field(s) Academic Libraries Digital libraries Academic Libraries Academic libraries Study findings presented by the authors
When implemented effectively, a contact center can efficiently provide service while maximizing customer satisfaction
Review of data mining (but note date of article)
This study identifies variables, processes, populations, data, and relevant Data Envelopment Analysis models
Explores metrics focussing on the prestige of the library and information science journals – looking at the scholarly output and impact of librarians published research.
Article title Closing the gap Proving our value, proving our worth toolkit
Value, impact and the transcendent library
The Metric Tide
Overall aims Review of best practice compared with 2006 and 2010 across six University libraries
Introducing the Texas Library Association Toolkit
Reviews the natural history of library performance measurement and suggests that proof of worth will be measured by the higher-order beneficial effects that libraries deliver
Report of the independent review of the role of metrics in research assessment and management
Academic field(s) Academic Libraries Public libraries Academic Libraries Research institutions
Study findings presented by the authors
Benchmarking of quality assurance practices across member libraries has enabled participants to gain an understanding of the strengths and weaknesses of their own quality assurance arrangements, to establish what constitutes best practice in this field, and to identify and learn from exemplars of best practice amongst their colleagues. The result has been quality assurance improvement and greater “quality maturity”.
Toolkit looks at questions such as “How does what you do or what do you provide save money? Why is your information valuable to the organisation”
A new, higher-order framework for evaluation and performance measurement based on a values scorecard is suggested. The concept of the “transcendent” library is offered as a route to further progress.
Chapter 10 on responsible metrics is of value
Application to NHS Libraries
Comparison of benchmarking over time Example of Toolkit
Example of a values scorecard
31
Results of the scan of selected full text articles looking for principles behind library measurement and attempting to identify metrics: Blecic 2013 Deal or No Deal Principle: best to measure COUNTER metrics by comparing across three years rather than one. Metric: metrics based on SFTAR statistics (Succesful Full-Text Article Request) Demonstrates how to compare one “big deal” with another. Booth 2006 Counting What Counts Principle: Key principles of evidence based practice – the need to identify relevant, significant and answerable questions. Performance measurement focuses on two important contributions: evidence that is user reported and evidence that is librarian observed. Critical of Helicon for measuring what was done rather than why and what for. Evaluate the service by asking 1. Has the service made the anticipated difference? 2 How have I (librarian) performed …am I now a better evidence based practitioner. Evaluation includes selection of the most appropriate frame of evaluation (individual, group or organisation-wide) and the corresponding metric. Metric: measuring outcome through KABO – Knowledge, Attitude, Behaviour, Outcome Gray 2012 Do Quality Improvement Systems Improve Health Library Services?
Principles: One of the implications for practice from this article is that “Many health libraries
utilise improvement systems without translating the data into service changes. Health
libraries should seek to translate resulting data into action planning and report on the
outcomes”.
Metric: no specific metrics identified.
Greenwalt 2013 In Search of Better Metrics
Principle: gathering data about the non-circulation services provided. Identifying patterns in
patron behaviour. Library as third space (Starbucks effect).
Metric: none given but suggests we need new tools which detect patterns that we have not
identified before.
Hiller 2012 What Are We Measuring and Does it Matter?
Principle: Trend is to measure value rather than size. Value metrics tend to be “local” due to
differences in data definition and organisational mission and objectives.
Hunter 2011 Can Money Buy Happiness
Principle Statistics collection flawed as higher expenditure means higher expectation so
customer satisfaction does not necessarily improve.
Metric: comparing library expenditure with usage statistics and patron satisfaction.
Menchaca 2014 Start a New Fire
Principles: Notes the changes in student behaviour using google and other digital resources
on their own, so that the library is no longer the “source” of materials but the “space” where
they can focus and create “habits of mind” which they take forward not just in the classroom
but also for life. (quote from Yeats – education is not the filling of a pail but the lighting of a
fire)
Metric: improved undergraduate learning outcomes - demonstrable improvement in
analysing information and in synthesizing that information into ideas.
32
Literature search references
Anon, 2013. Texas Public Libraries: Economic Benefits and Return on Investment. Texas Library Journal, 89(1), pp.6–13.
Blecic, D.D. et al., 2013. Deal or No Deal? Evaluating Big Deals and Their Journals. College & Research Libraries, 74(2), pp.178–193. Available at: http://eric.ed.gov/?q=library+and+measurement&ff1=dtySince_2011&pg=2&id=EJ1066187 [Accessed September 25, 2015].
Blixrud, J.C., 2002. Issues in Research Library Measurement. Journal of Library Administration, 35(4), pp.3–5. Available at: http://www.researchgate.net/publication/254369468_Issues_in_Research_Library_Measurement [Accessed September 25, 2015].
Bollen, J., 2010. MESUR: A Survey of Usage-based Scholarly Impact Metrics. Against the Grain, 22(4), pp.20 – 26.
Booth, A., 2006. Counting what counts: performance measurement and evidence‐based practice. Performance Measurement and Metrics, 7(2), pp.63–74. Available at: http://www.emeraldinsight.com/doi/abs/10.1108/14678040610679452 [Accessed September 18, 2015].
Brooker, J., 2010. Professional Development. Incite, 31(5), p.7. Available at: http://search.informit.com.au/documentSummary;dn=595864769479998;res=IELHSS [Accessed September 25, 2015].
Dean, C.E. & De Jager, K., 2014. Statistics for electronic resources. South African Journal of Libraries and Information Science, 75(1). Available at: http://sajlis.journals.ac.za/pub/article/view/1277 [Accessed September 25, 2015].
Deshmukh, A. & Roper, T., 2014. An investigation into the feasibility of designing a framework for the quantitative evaluation of the Clinical Librarian service at an NHS Trust in Brighton, UK. Health Information & Libraries Journal, 31(4), pp.314–317. Available at: http://www.ncbi.nlm.nih.gov/pubmed/25443028 [Accessed April 15, 2015].
Dugan, R E, Heernon P and Nitecki, D. 2009 Viewing Library Metrics from Different Perspectives: Inputs, Outputs and Outcomes. California; Libraries Unlimited.
Ennis, D. et al., 2013. A comparison of academic libraries: an analysis using a self‐organizing map. Performance Measurement and Metrics, 14(2), pp.118–131. Available at: http://www.emeraldinsight.com/doi/abs/10.1108/PMM-07-2012-0026 [Accessed September 28, 2015].
Esparza, J.M. et al., 2013. The effect of a clinical medical librarian on in-patient care outcomes. Journal of the Medical Library Association : JMLA, 101(3), pp.185–
33
91. Available at: http://www.pubmedcentral.nih.gov/articlerender.fcgi?artid=3738078&tool=pmcentrez&rendertype=abstract [Accessed September 25, 2015].
Farmer, L., Safer, A. & Leack, J., 2015. Using Analytic Tools with California School Library Survey Data. Evidence Based Library and Information Practice, 10(2), pp.90–107. Available at: http://ejournals.library.ualberta.ca/index.php/EBLIP/article/view/23816/18395 [Accessed September 25, 2015].
Gray, H., Sutton, G. & Treadway, V. 2012. Do Quality Improvement Systems Improve Health Library Services? A Systematic Review. Health Information Libraries Journal, 29 (3) pp180-196
Greenwalt, R.T., 2013. In Search of Better Metrics » Public Libraries Online. Public Libraries Online, 52(2), pp.22–26. Available at: http://publiclibrariesonline.org/2013/05/in-search-of-better-metrics/ [Accessed September 25, 2015].
Guo, S., 2014. Developing effective professional development programs: a case study. New Library World, 115(11/12), pp.537–542.
Hendricks, A., 1999. ASIS Mid-year 1999: Evaluating and Using Networked Information Resources and Services. Library Hi Tech News, 167, pp.9–14.
Hiller, S., 2012. What Are We Measuring, and Does It Matter? Value Has Replaced Size as the Preferred Library Metric, and Value Ultimately Lies in Supporting the Parent Organization’s Mission. Available at: http://www.highbeam.com/doc/1G1-305663049.html [Accessed September 25, 2015].
Hosseini-Ara, Moe; Jones, R., 2013. Overcoming Our Habits and Learning to Measure Impact . Computers in Libraries, 33(5), pp.3–7.
Hunter, B. & Perret, R., 2011. Can Money Buy Happiness? A Statistical Analysis of Predictors for User Satisfaction. Journal of Academic Librarianship, 37(5), pp.402–408. Available at: http://eric.ed.gov/?q=library+and+measurement&ff1=dtySince_2011&id=EJ938489 [Accessed September 25, 2015].
Jackson, B., 2015. University Rankings: How Well Do They Measure Library Service Quality?. portal: Libraries and the Academy, 15(2), pp.315–330. Available at: http://eric.ed.gov/?q=library+and+measurement&ff1=dtySince_2011&id=EJ1059694 [Accessed September 25, 2015].
Ju, B. & Jin, T., 2013. Incorporating Nonparametric Statistics into Delphi Studies in Library and Information Science. Information Research: An International Electronic Journal, 18(3). Available at: http://eric.ed.gov/?q=library+and+measurement&ff1=dtySince_2011&id=EJ1044687 [Accessed September 25, 2015].
34
Jurczyk, E. & Jacobs, P., 2014. What’s the Big Deal? Collection Evaluation at the National Level. portal: Libraries and the Academy, 14(4), pp.617–631. Available at: http://eric.ed.gov/?q=library+and+measurement&ff1=dtySince_2011&pg=2&id=EJ1044234 [Accessed September 25, 2015].
Kodrič-Dačić, E., 2014. Measuring, Monitoring, Evaluating Slovenian Libraries: BibSiSt and e-Razvid. Revija Knjižnica, 58(3). Available at: http://knjiznica.zbds-zveza.si/index.php/knjiznica/article/view/501/481 [Accessed September 25, 2015].
Menchaca, F., 2014. Start a New Fire: Measuring the Value of Academic Libraries in Undergraduate Learning. portal: Libraries and the Academy, 14(3), pp.353–367. Available at: http://eric.ed.gov/?q=library+and+measurement&ff1=dtySince_2011&id=EJ1038115 [Accessed September 25, 2015].
Mengel, E. & Lewis, V., 2012. Collaborative assessment J. Stephen Town, ed. Library Management, 33(6/7), pp.357–364. Available at: http://www.emeraldinsight.com/doi/abs/10.1108/01435121211266131 [Accessed September 28, 2015].
Missingham, R. & Zobec, H., 2012. Value of Collections: A Study of Australia’s Group of 8 University Libraries. Australian Library Journal, 61(3), pp.212–224. Available at: http://eric.ed.gov/?q=library+and+measurement&ff1=dtySince_2011&id=EJ987719 [Accessed September 25, 2015].
Murphy, S.A. & Cerqua, J., 2012. Implementing the Customer Contact Center: An Opportunity to Create a Valid Measurement System for Assessing and Improving a Library’s Telephone Services. portal: Libraries and the Academy, 12(3), pp.299–314. Available at: http://eric.ed.gov/?q=library+and+measurement&ff1=dtySince_2011&id=EJ975874 [Accessed September 25, 2015].
Nicholson, S., 2006. The basis for bibliomining: Frameworks for bringing together usage-based data mining and bibliometrics through data warehousing in digital library services. Information Processing & Management, 42(3), pp.785–804. Available at: http://www.sciencedirect.com/science/article/pii/S0306457305000658 [Accessed April 8, 2015].
Payne, Alexandria; Curtis, J., 2014. StatBase: library statistics made easy. Library Hi Tech, 32(3), pp.546–559.
Pratt, A.D. & Altman, E., 1996. Live By the Numbers, Die By the Numbers. Library Journal, 122(7), pp.48–49. Available at: http://eric.ed.gov/?id=EJ543176 [Accessed September 25, 2015].
35
Shupala, C.M., 2011. Measuring Academic Library Efficiency and Alignment with Institutional Resource Utilization Priorities Using Data Envelopment Analysis: An Analysis of Institutions of Higher Education in Texas and Their Libraries. ProQuest LLC. Available at: http://eric.ed.gov/?q=library+and+measurement&ff1=dtySince_2011&id=ED552128 [Accessed September 25, 2015].
Stewart, C., 2010. Whither Metrics? Tools for Assessing Publication Impact of Academic Library Practitioners. The Journal of Academic Librarianship, 36(5), pp.449–453. Available at: http://www.researchgate.net/publication/248498963_Whither_Metrics_Tools_for_Assessing_Publication_Impact_of_Academic_Library_Practitioners [Accessed September 25, 2015].
Tang, K., 2012. Closing the Gap: The Maturing of Quality Assurance in Australian University Libraries. Australian Academic & Research Libraries, 43(2), pp.102–119. Available at: http://eric.ed.gov/?q=library+and+measurement&ff1=dtySince_2011&pg=2&id=EJ980914 [Accessed September 25, 2015].
Town, J.S., 2010. Value, Impact, and the Transcendent Library: Progress and Pressures in Performance Measurement and Evaluation. Library Quarterly, 81(1), pp.111–125. Available at: http://eric.ed.gov/?q=library+and+measurement&ff1=dtySince_2011&id=EJ917797 [Accessed September 25, 2015].
Wallace, Richard L.; Woodward, Nakia J.; Clamon, T.S., 2014. A mixed-methods analysis of a library-based hand-held intervention with rural clinicians. Health Information and Libraries Journal, 31, pp.215–226.
Wilsdon J et al 2015. The Metric Tide: Report of the Independent Review of the Role of Metrics in Research Assessment and Management. HEFCE DOI: 10.13140/RG.2.1.4929.1363
Young, P.R., 1998. Measurement of Electronic Services in Libraries: Statistics for the Digital Age. IFLA Journal, 24(3), pp.157–160. Available at: http://ifl.sagepub.com/content/24/3/157.extract [Accessed August 2, 2015].
36
Appendix 2 - Areas for Metric Development based on International Standard (non exhaustive)
B.1 Resources
Collection Availability of Physical Stock Access ILL E collections Facilities Space IT facilities Staff Staff numbers B.2 Use Collection Use of Physical stock Use of Online stock Access Users using the physical library User using library services/events Facilities User occupation of the physical library space General User satisfaction User engagement B.3 Efficiency Collection Cost effectiveness of Physical stock Cost effectiveness of Online stock Access Cost effectiveness of ILL Cost effectiveness of processing physical stock Staff Cost effectiveness of staff Effectiveness of staff General Cost per user Cost per visit B.4 Potential and Development Collection E-Collections Staff Staff working on electronic resources Staff CPD Collaborative working General Generated income