16
Taxing Energy Use 2019

Taxing Energy Use 2019

Fuel excise and carbon taxes are simple and cost-effective tools to limit climate change, but the politics of carbon pricing often proves to be challenging.

OECD TAXING ENERGY USE 2019 . 1
Global energy consumption rose strongly in 2018, and so did
energy-related CO2 emissions, which reached a new all-time
high. This is disconcerting, as meeting the goals of the Paris
Agreement will require deep cuts in emissions.
Well-designed systems of energy taxation encourage citizens
and investors to favour clean over polluting energy sources.
Fuel excise and carbon taxes are simple and cost-effective tools
to limit climate change, but the politics of carbon pricing often
proves to be challenging. Taxes on energy use also contribute to
limiting health damage from local pollution, which is a pertinent
policy concern in an urbanising world.
Taxing Energy Use (TEU) 2019 presents a snapshot of where
countries stand in deploying energy and carbon taxes, tracks
progress made, and makes actionable recommendations on
how governments could do better. The report presents new
and original data on energy taxes in OECD and G20 countries,1
and in international aviation and maritime transport. Tax rates
and tax coverage are detailed by country, sector, energy source
and tax type. The use of a common methodology ensures
full comparability of tax rates and structures across countries.
Summary indicators facilitate cross-country comparisons.
1. Colombia has been invited to join the OECD and is finalising its domestic procedures to do so.
Using taxes for climate action
INTRODUCTION

for any fuel, not least coal – the most polluting fossil fuel. The average effective carbon tax rate on coal is close to zero across the 44 OECD countries and Selected Partner Economies (Table 1). Even if emissions trading systems had been included in the analysis, carbon price signals for coal would still be very low almost everywhere (see Box 1).
Diesel and gasoline are the only fuels that are, on average, taxed at a higher rate than the selected low-end estimate of the marginal climate damage of fuel use would suggest (Table 1). The climate damage is, however, likely to be higher than the low-end carbon benchmark of EUR 30 per tonne of CO2. In addition, local air pollution damages from road transport are relatively high, justifying higher tax rates in the sector.
GOVERNMENTS ARE NOT DEPLOYING ENERGY AND CARBON TAXES TO THEIR FULL POTENTIAL
Too many energy users do not pay the energy and carbon taxes needed to curb dangerous climate change, even when comparing carbon price signals against a low-end carbon benchmark of EUR 30 per tonne of CO2. This benchmark is unlikely to reflect the climate damage caused by a tonne of CO2 emitted at present, and will not be sufficient to meet the objectives of the Paris Agreement.
The evidence shows that tax structures are poorly aligned with the pollution profile of energy sources. Overall, taxes are not being used to provide meaningful carbon prices
USING TAXES FOR CLIMATE ACTION
Table 1. Average fuel excise and explicit carbon taxes across 44 OECD countries and Selected Partner Economies, as well as international aviation and maritime transportEmission-weighted average, in EUR per tonne of CO2
(1) Average fuel excise
(2) Average explicit carbon tax
(3=1+2) Average effective carbon tax
Coal and other solid fossil fuels 0.61 0.13 0.73
Fuel oil 3.50 0.46 3.96
Diesel 70.65 3.11 73.76
Kerosene 4.27 0.34 4.61
Gasoline 84.34 1.50 85.83
LPG 10.23 0.89 11.12
Natural gas 4.08 1.19 5.26
Other fossil fuels 0.38 0.31 0.69
Non-renewable waste 0.05 0.02 0.08
Biofuels* 4.52 0.12 4.64
Note: Tax rates applicable on 1 July 2018. The effective carbon tax is the sum of fuel excise taxes (of which the statutory rates are usually expressed in common commercial units, such as litres of gasoline) and explicit carbon taxes (understood as taxes called carbon taxes where statutory rates are typically also expressed in common commercial units or per unit of CO2 emissions). Averages are rounded to the nearest eurocent. Biofuels are marked with an asterisk as CO2 emissions from the combustion of biofuels are considered zero in the greenhouse gas inventories reported under the UNFCCC.
Source: OECD (2019), Taxing Energy Use 2019: Using Taxes For Climate Action.
The average effective carbon tax rate on coal is close to zero across the 44 OECD countries
and Selected Partner Economies.2 . OECD TAXING ENERGY USE 2019

CO2 emissions from energy use in gigatonnes of CO2
Effective carbon tax rate Low-end carbon benchmark (EUR 30/tCO2)
300
240
180
120
60
0
5 10 15 20 25 30
Road emissions Non-road emissions
EUR
per t
onne
of C
O2
OECD TAXING ENERGY USE 2019 . 3
CARBON PRICE SIGNALS ARE FAR TOO WEAK ALMOST EVERYWHERE
Eighty-five percent of energy-related CO2 emissions take place outside the road sector. Taxes only cover 18% of these emissions, leaving a tax of zero for the remaining 82% of non-road emissions. For a mere 3% of non-road emissions, the price signal is at least EUR 30 per tonne of CO2, a low-end benchmark of the climate damage caused by a tonne of CO2.
Only four countries, Denmark, the Netherlands, Norway and Switzerland, tax non-road emissions at more EUR 30 per tonne on average (Figure 2, Panel B). If emissions trading systems had been included in the analysis, the picture would have been less bleak. However, where ETS exists, permits typically trade at less than EUR 30 per tonne of CO2 and cover only a limited share of emissions.
Figure 1. Outside road transport, the bulk of carbon emissions are completely unpriced
Note: Tax rates applicable on 1 July 2018. CO2 emissions are calculated based on energy use data for 2016 from IEA (2018), World Energy Statistics and Balances. Emissions from the combustion of biofuels are included.
Source: OECD (2019), Taxing Energy Use 2019: Using Taxes For Climate Action.
Fuel excise taxes continue to dominate explicit carbon taxes for all fuels (Table 1). In all 44 countries, carbon prices are prinicipally determined by fuel excise taxes in the road sector. In non-road sectors, explicit carbon taxes tend to play a relatively more important role, although there too excise taxes dominate overall.
Fuel excise and carbon taxes are not the only policy instruments that effectively put a price on carbon. Emissions Trading Systems (ETS) equally target CO2 emissions from energy use, and sometimes include other greenhouse gas emissions and different emission sources. Emissions trading systems can be as effective
and efficient as carbon taxes. ETS, analysed in the OECD’s (2018) Effective Carbon Rates report, account for approximately 6% of carbon price signals in OECD and G20 countries.
The extent to which countries choose to price carbon emissions through taxes or ETS varies substantially. The European Union’s ETS, for instance, covers most emissions from electricity generation and in industry, and intra-European flights. Allowances were traded at approximately EUR 25 per tonne of CO2 at the time of writing. Overall, carbon price signals remain insufficient even when considering the impact of emissions trading systems.
Box 1: The composition of carbon price signals
USING TAXES FOR CLIMATE ACTION
At present, only
18% of emissions
outside the
road sector are
effectively taxed.
18%

Israel
United Kingdom
Switzerland
Netherlands
Italy
Finland
Greece
Iceland
Belgium
France
Norway
Germany
Estonia
Ireland
Denmark
Sweden
Slovenia
Portugal
Slovak Republic
Czech Republic
Korea
Austria
Spain
Japan
Latvia
Hungary
South Africa
Luxembourg
Poland
Lithuania
Turkey
New Zealand
Australia
Chile
Mexico
India
Canada
China
Argentina
Colombia
United States
Indonesia
Brazil
Russia
Switzerland
Netherlands
Norway
Denmark
Italy
Iceland
Greece
France
Slovenia
Finland
Lithuania
Austria
Korea
United Kingdom
Ireland
Argentina
Israel
Portugal
Japan
Slovak Republic
Sweden
Germany
Latvia
Turkey
Estonia
Spain
Hungary
Poland
Canada
Colombia
India
Australia
Luxembourg
South Africa
Belgium
Czech Republic
Chile
China
United States
Mexico
New Zealand
Russia
Brazil
Indonesia
EUR per tonne of CO2
Average effective carbon tax in 2018 Average effective carbon tax in 2015 Low-end carbon benchmark (EUR 30/tCO2)
EUR per tonne of CO2
Panel A: ROAD EMISSIONS Panel B: NON-ROAD EMISSIONS
0 0 5 10 15 20 25 30 35 40 45 5030 60 90 120 150 180 210 240 270 300 330
THE CARBON PRICING GAP
Figure 2. Little progress has been made in extending tax-based carbon price signals since 2015
Note: 2018 tax rates as applicable on 1 July 2018. The average effective carbon tax rate in 2015 is expressed in 2018 prices. CO2 emissions are calculated based on energy use data for 2016 from IEA (2018), World Energy Statistics and Balances. Emissions from the combustion of biofuels are included. The scale of the horizontal axis differs between Panel A and Panel B. Note that changes in average effective tax rates over time are also affected by inflation, exchange rate fluctuations, and changes in the composition of the energy mix. In Chile, the average effective carbon tax on non-road emissions is due to the Green Tax. Due to data limitations, the figure does not show the average effective carbon tax rates in 2015 for Argentina, Canada, Colombia, Lithuania, and the United States.
Source: OECD (2019), Taxing Energy Use 2019: Using Taxes For Climate Action.
4 . OECD TAXING ENERGY USE 2019
USING TAXES FOR CLIMATE ACTION

Effective carbon tax rate Low-end carbon benchmark (EUR 30/tCO2)
0
30
60
90
120
0.2 0.4 0.6 0.8 1.0 1.2 1.4 1.6
Aviation
Domestic International Domestic International
Maritime
EUR
per t
onne
of C
O2
OECD TAXING ENERGY USE 2019 . 5
Little progress has been made in extending tax-based carbon price signals. Since 2015, average effective carbon tax rates on non-road emissions increased by more than EUR 10 per tonne of CO2 in only three countries: Denmark, the Netherlands and Switzerland (Figure 2, Panel B).
Carbon price signals are stronger in road transport, mostly because of relatively high fuel excise taxes, but this is a sector where non-climate external costs are also relatively high. The only three countries that do not tax
road emissions at EUR 30 per tonne of CO2 or more are Brazil, Indonesia and the Russian Federation (Figure 2, Panel A).
Emissions from international aviation and maritime transport are not taxed at all. Fuels used in domestic aviation and domestic navigation are sometimes taxed, but rarely reflect a low-end carbon benchmark (Figure 3). Most of these emissions are not subject to emissions trading systems either (see Box 1).
USING TAXES FOR CLIMATE ACTION
Figure 3. Emissions from international aviation and maritime transport are not taxed at all
CO2 emissions from energy use in gigatonne of CO2
Note: 2018 tax rates as applicable on 1 July 2018. CO2 emissions are calculated based on energy use data for 2016 from IEA (2018), World Energy Statistics and Balances.
Source: OECD (2019), Taxing Energy Use 2019: Using Taxes For Climate Action.
Emissions from international aviation and maritime transport are not taxed at all. Fuels used in domestic
aviation and domestic navigation are sometimes taxed, but rarely reflect a low-end carbon benchmark.

6 . OECD TAXING ENERGY USE 2019
An increasing number of jurisdictions levy explicit carbon taxes. The figure below shows all jurisdictions within the 44 countries covered that had an explicit carbon tax in place as at 1 July 2018. Sweden is the country with the highest standard carbon tax rate, followed by Switzerland, Finland and Norway.
Average rates are below standard rates because part of the base is not subject to the tax, exempt or benefits from preferential rates. The coverage of explicit carbon taxes varies substantially across countries for several reasons:
l Many jurisdictions additionally operate emissions trading systems, and often exempt emissions already subject to emissions trading from the explicit carbon tax. Low-carbon tax coverage does not necessarily imply a lack of carbon price signals in general (see Box 1).
l Countries generally do not subject CO2 emissions frombiofuels to explicit carbon taxes (see also, Table 1). This drives down the average explicit carbon tax rate, which is particularlyrelevant for countries such as Sweden that rely more strongly on biofuels to meet their decarbonisation objectives.
l Countries do not always impose carbon taxes on all fossil fuels. Argentina and Mexico, for instance, exempt natural gas, which is generally considered the cleanest fossil fuel.
l Some countries exempt certain energy users from the carbon tax or offer reduced rates or refunds, for reasons ofcompetitiveness or affordability. In principle, better policy instruments are available to address these issues, although targeted compensation, e.g. through lump sum transfers, may be challenging to implement in practice.
Box 2: Even explicit carbon taxes do not cover all energy-related CO2 emissions
Explicit carbon taxes do not cover all energy-related emissionsJurisdictions are ordered by standard rate, showing the jurisdiction with the highest standard rate at the top
Note: Tax rates as applicable on 1 July 2018. CO2 emissions are calculated based on energy use data for 2016 from IEA (2018), World Energy Statistics and Balances. Emissions from the combustion of biofuels are included. Carbon tax rates are converted into EUR using official OECD exchange rates for 2018.
Source: OECD (2019), Taxing Energy Use 2019: Using Taxes For Climate Action.
USING TAXES FOR CLIMATE ACTION
Sweden
Switzerland
Finland
Norway
France
Iceland
Denmark
British Columbia
United Kingdom
Ireland
Alberta
Slovenia
Argentina
Portugal
Latvia
Colombia
Chile
Japan
Mexico
Estonia
0 30 60 90 120
Explicit carbon tax: average rate
SEK 1 150
CHF 96
EUR 62
NOK 500
EUR 44.6
ISK 3 500
DKK 173
CAD 35
GBP 18
EUR 20
CAD 30
EUR 17
USD 10
EUR 7
EUR 5
COP 15 764
USD 5
JPY 289
MXN 46.67
EUR 2
Explicit carbon tax: standard rate
EUR per tonne of CO2

USING TAXES FOR CLIMATE ACTION RAISES REVENUES
OECD TAXING ENERGY USE 2019 . 7
Using taxes for climate action raises revenues – unlike most other climate policy instrumentsThe revenue potential from carbon pricing is considerable. Raising effective carbon taxes to EUR 30 per tonne of CO2 for all energy-related CO2 emissions would generate approximately an additional 1% of GDP worth of tax revenue across the 44 countries covered in TEU, or roughly double current revenues.
Carbon taxes are intended to, and do, reduce emissions, which means declining revenue over time for constant tax rates. This decline is gradual and would be counteracted by rising carbon tax rates, which climate policy calls for. In sum, revenues will eventually decline, but in a matter of decades, not years.
Consequently, revenues from carbon taxes create opportunities for fiscal reform. The most socially productive use of revenues depends on local circumstances, and political economy considerations will help decide between the available options.
Reforms can include modifying the tax mix to foster inclusive growth, e.g. through lowering income taxes; increasing investment in productivity-enhancing areas, e.g. education, health and infrastructure; and decreasing the level of public debt. Revenues can also fund direct transfers to households to mitigate any adverse distributional effects and help households reduce their reliance on carbon-intensive goods and services.These forms of revenue use can mobilise support across various constituencies, including those that do not favour strong climate action.
Using carbon tax revenues for research and development and other climate policy measures is another option, considering that the failure to price in the climate externality is not the only climate-related market failure. This type of revenue use can strengthen support for carbon taxes with constituencies that strongly favour climate action and climate spending, but that doubt the effectiveness of carbon pricing as a behavioural signal.
Even modest carbon taxes raise substantial revenues.
8 . OECD TAXING ENERGY USE 2019
NetherlandsSwitzerland
DenmarkLuxembourg
IsraelItaly
United KingdomGreeceIreland
SloveniaAustria
NorwayFrance
LithuaniaGermany
FinlandPortugalSweden
SpainBelgium
LatviaEstonia
JapanKorea
Slovak RepublicPoland
HungaryTurkey
Czech RepublicMexico
New ZealandAustralia
South AfricaChile
ArgentinaCanadaIceland
ColombiaIndia
United StatesChinaBrazil
IndonesiaRussia
Int. aviationInt. maritime
0 1 2 3 4 5 6 7EUR per GJ
Average explicitcarbon tax
Average fuelexcise tax
Average electricityexcise tax
MANY COUNTRIES TAX ELECTRICITY REGARDLESS OF HOW IT IS GENERATED
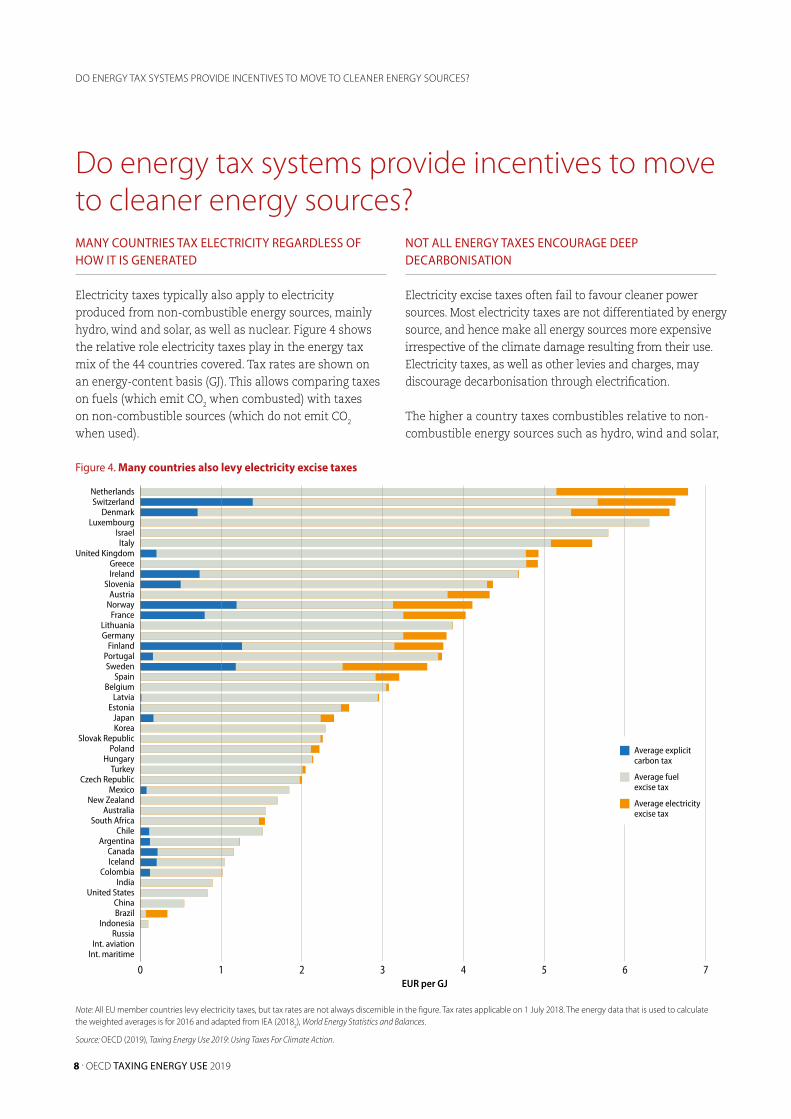
Electricity taxes typically also apply to electricity produced from non-combustible energy sources, mainly hydro, wind and solar, as well as nuclear. Figure 4 shows the relative role electricity taxes play in the energy tax mix of the 44 countries covered. Tax rates are shown on an energy-content basis (GJ). This allows comparing taxes on fuels (which emit CO2 when combusted) with taxes on non-combustible sources (which do not emit CO2 when used).
NOT ALL ENERGY TAXES ENCOURAGE DEEP DECARBONISATION
Electricity excise taxes often fail to favour cleaner power sources. Most electricity taxes are not differentiated by energy source, and hence make all energy sources more expensive irrespective of the climate damage resulting from their use. Electricity taxes, as well as other levies and charges, may discourage decarbonisation through electrification.
The higher a country taxes combustibles relative to non-combustible energy sources such as hydro, wind and solar,
Do energy tax systems provide incentives to move to cleaner energy sources?
DO ENERGY TAX SYSTEMS PROVIDE INCENTIVES TO MOVE TO CLEANER ENERGY SOURCES?
Figure 4. Many countries also levy electricity excise taxes
Note: All EU member countries levy electricity taxes, but tax rates are not always discernible in the figure. Tax rates applicable on 1 July 2018. The energy data that is used to calculate the weighted averages is for 2016 and adapted from IEA (20182), World Energy Statistics and Balances.
Source: OECD (2019), Taxing Energy Use 2019: Using Taxes For Climate Action.

OECD TAXING ENERGY USE 2019 . 9
IcelandSwitzerland
LuxembourgIsrael
SloveniaUnited Kingdom
FranceIrelandGreece
PortugalBelgium
ItalyNorway
LithuaniaSpain
Slovak RepublicSweden
LatviaKorea
New ZealandFinland
HungaryGermany
Czech RepublicTurkey
EstoniaJapan
MexicoAustriaPoland
ChileAustralia
CanadaSouth Africa
ArgentinaColombia
United StatesIndia
ChinaIndonesia
RussiaInt. aviation
Int. maritimeDenmark
BrazilNetherlands
0 1 1 2 2 3 3 4 4 5EUR per GJ
Average effective energytax on combustibles
Average effective energytax on non-combustibles
Combustion surcharge >0
Combustion surcharge <0 (i.e. discount)
the greater is the incentive to switch to these generally cleaner sources. Such differential tax treatment – effectively putting a surcharge on the use of combustible energy sources – can help direct private and public resources towards the development of new clean technologies. A combustion surcharge equally makes it more profitable to switch from vehicles based on an internal combustion engine to electric or hydrogen vehicles.
Overall, most countries encourage switching to cleaner sources by taxing combustibles more than cleaner energy sources such as hydro, wind, and solar. Figure 5 shows, however, that the difference between these two average tax rates varies substantially across countries. The combustion surcharge is largest in Iceland, closely followed by Switzerland.
Figure 5. Most countries tax combustibles more than non-combustibles
Note: The effective energy tax rate is the sum of fuel excise tax, explicit carbon tax, and electricity excise tax. The weighted average tax rates are calculated based on the tax rates applicable on 1 July 2018 and energy use for 2016 that was adapted from IEA (20181), World Energy Statistics and Balances.
Source: OECD (2019), Taxing Energy Use 2019: Using Taxes For Climate Action.

10 . OECD TAXING ENERGY USE 2019
-1 0 1 2 3 4 5Combustion surcharge in EUR per GJ
Carb
on in
tens
ity
of e
nerg
y us
e in
tCO
2 per
TJ
OECD
FRA
LUX
SVN
CHE
ISL
GBR
IRL ISR
GRCLVALTU
DEUJPN
TURCZEAUT
AUSCHL
FINKORSVK
PRT
ITA
BELESP
HUNARG
MEXCOL
USARUS
WAV
WMA IDN
CAN
SWENZL
NOR
INDCHN
DNK
BRANLD
ZAFPOL
EST
Partner economies Predicted carbon intensityInternational aviation & international maritime
economies, energy and carbon taxes are not the only explanatory factors. Against this background, it is worth noting that Iceland and Norway benefit from exceptional endowments with renewable resources (hydropower in both countries and geothermal energy in Iceland).
Countries that levy a higher surcharge on combustibles tend to have a lower carbon-intensity of energy use. Figure 6 shows that there is a negative correlation between the surcharge and a country’s carbon intensity. While tax-induced energy price signals partly explain the observed differences in carbon-intensities across
Figure 6. In countries with a larger combustion surcharge, energy use tends to be less carbon-intensive
Note: Average tax rates are calculated based on the tax rates applicable on 1 July 2018 and energy use data for 2016 that was adapted from IEA (20181), World Energy Statistics and Balances. Energy-related carbon emissions are calculated based on IEA data. Emissions from the combustion of biofuels are included. Average tax rates do not include electricity and heating imports to avoid the double-counting of this energy use. WAV refers to international aviation; WMA to international maritime transport.
Source: OECD (2019), Taxing Energy Use 2019: Using Taxes For Climate Action.
DO ENERGY TAX SYSTEMS PROVIDE INCENTIVES TO MOVE TO CLEANER ENERGY SOURCES?

OECD TAXING ENERGY USE 2019 . 11
Key takeaways1. Strengthening carbon price signals will encourage
citizens and businesses to take the climate costs of their actions into account. They would consume fewer carbon-intensive goods and services, and gradually transition to low- or zero carbon activities. In addition, clean technology firms would see their competitive position vis-à-vis polluting firms improve. Discouraging investments in carbon-intensive assets, such as coal-fired power plants, also reduces the risk of high adjustment costs in the future.
2. Increasing carbon prices first where they currently are lowest makes sense. Coal is a particularly striking case in point as it is presently taxed at some of the lowest rates across all energy users despite its harmful climate and air pollution impacts. Rates are currently zero in international aviation and shipping, and near zero or very low across all users in several countries.
3. Overall, most countries encourage switching to cleaner sources by taxing combustibles more than cleaner energy sources such as hydro, wind, and solar. In some countries, even revenue-neutral electricity tax reforms could strengthen incentives to reduce emissions.
KEY TAKEAWAYS
Most countries encourage switching to cleaner sources by taxing combustibles more than cleaner energy sources such as hydro, wind, and solar.

12 . OECD TAXING ENERGY USE 2019
Teusch, J. and N. Braathen (2019), “Are environmental tax policies beneficial?: Learning from programme evaluation studies”, OECD Environment Working Papers, No. 150, OECD Publishing, Paris,
https://dx.doi.org/10.1787/218df62b-en.
Van Dender, K. (2019), “Taxing vehicles, fuels, and road use: Opportunities for improving transport tax practice”, OECD Taxation Working Papers, No. 44, OECD Publishing, Paris,
https://dx.doi.org/10.1787/e7f1d771-en.
Further reading
Taxing Energy Use 2019 (forthcoming): Using Taxes for Climate Action, OECD Publishing, Paris. https://doi.org/10.1787/058ca239-en.
Effective Carbon Rates 2018: Pricing Carbon Emissions Through Taxes and Emissions Trading, OECD Publishing, Paris, https://dx.doi.org/10.1787/9789264305304-en.
OECD/ITF (2019), Tax Revenue Implications of Decarbonising Road Transport: Scenarios for Slovenia, OECD Publishing, Paris, https://dx.doi.org/10.1787/87b39a2f-en.
OECD/IEA (2019), “Update on recent progress in reform of inefficient fossil-fuel subsidies that encourage wasteful consumption”, https://oecd.org/fossil-fuels/publication/OECD-IEA-G20-Fossil-Fuel-Subsidies-Reform-Update-2019.pdf
Marten, M. and K. van Dender (2019), “The use of revenues from carbon pricing”, OECD Taxation Working Papers, No. 43, OECD Publishing, Paris,
https://dx.doi.org/10.1787/3cb265e4-en.
FURTHER READING

OECD EFFECTIVE CARBON RATES 2018 . c
This document, as well as any data and any map included herein,
are without prejudice to the status of or sovereignty over any
territory, to the delimitation of international frontiers and
boundaries and to the name of any territory, city or area.
The statistical data for Israel are supplied by and under the
responsibility of the relevant Israeli authorities. The use of such
data by the OECD is without prejudice to the status of the Golan
Heights, East Jerusalem and Israeli settlements in the West Bank
under the terms of international law.
You can copy, download or print OECD content for your own use,
and you can include excerpts from OECD publications, databases
and multimedia products in your own documents, presentations,
blogs, websites and teaching materials, provided that suitable
acknowledgment of the source and copyright owner(s) is given.
All requests for public or commercial use and translation rights
should be submitted to [email protected]. Requests for permission to
photocopy portions of this material for public or commercial use shall
be addressed directly to the Copyright Clearance Center (CCC) at
[email protected] or the Centre francais d’exploitation du droit de
copie (CFC) at [email protected].
Images: © shutterstock.com


