TAXING HIDDEN WEALTH:THE CONSEQUENCES OF U.S. ENFORCEMENT INITIATIVES
ON EVASIVE FOREIGN ACCOUNTS
Niels JohannesenPatrick Langetieg
Daniel ReckMax Risch
Joel Slemrod
Working Paper 24366http://www.nber.org/papers/w24366
NATIONAL BUREAU OF ECONOMIC RESEARCH1050 Massachusetts Avenue
Cambridge, MA 02138March 2018
We thank Rosanne Altshuler, John Guyton, Jim Hines, Jeffrey Hoopes, Chis Larsen, Leandra Lederman, Judith Miller, Lisa Rupert, Emmanuel Saez, William Strang, Alex Turk, Danny Yagan, Gabriel Zucman, and seminar participants at the National Tax Association Annual Conference, the University of Michigan, the University of California, Berkeley, Stanford Business School, NYU Law School, and the Columbia Tax Policy Workshop for comments on early drafts. Several people at IRS deserve special acknowledgement for their support of this work. These include Michael Bourque, Jeff Butler, Michael Dunn, Christine Glass, Chris Hess, Davy Leighton, Peter Rose, and Lisa Rosenmerkel for support of the research, as well as Katherine Fox and Clay Swanson for producing excellent internal reports on offshore accounts. We also thank Barry Johnson, Alicia Miller, and Michael Weber for facilitating this project through the Joint Statistical Research Program of the Statistics of Income Division of the IRS. All data work for this project involving confidential taxpayer information was done at IRS facilities, on IRS computers, by IRS employees, and at no time was confidential taxpayer data ever outside of the IRS computing environment. Reck, Risch, and Slemrod are IRS employees under an agreement made possible by the Intragovernmental Personnel Act of 1970 (5 U.S.C. 3371-3376). Niels Johannesen has received financial support for this research from the Danish Council for Independent Research and the Danish National Research Foundation. The views and opinions presented in this paper reflect those of the authors. They do not necessarily reflect the views or the official position of the Internal Revenue Service, Danish National Research Foundation, or the National Bureau of Economic Research. All results have been reviewed to ensure that no confidential information is disclosed.
NBER working papers are circulated for discussion and comment purposes. They have not been peer-reviewed or been subject to the review by the NBER Board of Directors that accompanies official NBER publications.
Taxing Hidden Wealth: The Consequences of U.S. Enforcement Initiatives on Evasive ForeignAccountsNiels Johannesen, Patrick Langetieg, Daniel Reck, Max Risch, and Joel SlemrodNBER Working Paper No. 24366March 2018JEL No. H24,H26
ABSTRACT
In 2008, the IRS initiated efforts to curb the use of offshore accounts to evade taxes. This paper uses administrative microdata to examine the impact of the enforcement efforts on taxpayers’ reporting of offshore accounts and income. Enforcement caused approximately 60,000 individuals to disclose offshore accounts with a combined value of around $120 billion. Most disclosures happened outside offshore voluntary disclosure programs by individuals who never admitted prior noncompliance. The disclosed accounts were concentrated in countries whose institutions facilitate tax evasion. The enforcement-driven disclosures increased annual reported capital income by $2.5-$4 billion corresponding to $0.7-$1.0 billion in additional tax revenue.
Niels JohannesenUniversity of CopenhagenDepartment of Economicsand [email protected]
Daniel ReckUniversity of MichiganEconomics Department238 Lorch Hall, 611 Tappan StreetAnn Arbor, MI [email protected]
Max RischDepartment of EconomicsUniversity of MichiganAnn Arbor, MI [email protected]
Joel SlemrodUniversity of Michigan701 Tappan StreetRoom R5396Ann Arbor, MI 48109-1234and [email protected]
2
1. Introduction
The use of secret offshore accounts to evade tax liabilities is a serious challenge for tax policy. A
prominent set of studies estimates that households around the world hold $6 trillion in offshore
banking centers, which corresponds to about 8% of total household financial wealth (Zucman,
2013). Further, a recent study suggests that offshore wealth, at least in one set of countries, is highly
concentrated at the top of the wealth distribution, and almost never reported to the tax authorities
(Alstadsæter, Johannesen and Zucman, 2017a). The size and concentration of offshore wealth
suggests that improved tax enforcement for offshore income and wealth could generate large
welfare gains, but it is not straightforward to achieve in a world of extremely mobile financial assets
and foreign tax havens with institutionalized financial secrecy.
In response to this challenge, the U.S. government conducted a series of enforcement initiatives
beginning in 2008. First, it compelled a number of tax havens to accept information exchange
agreements under which the Internal Revenue Service (IRS) can request account information about
U.S. taxpayers suspected of tax evasion. Second, it took ad hoc legal measures to force major Swiss
banks, most famously the world’s biggest private bank, UBS, to turn over names and account details
of many of their U.S. customers. Finally, complementing the measures aiming to facilitate detection
of undeclared offshore income, it established a series of programs under which cooperating U.S. tax
evaders who voluntarily disclose their offshore accounts pay reduced penalties and avoid criminal
sanctions. Many countries have pursued very similar policies, combining cross-border exchange of
banking information and incentives to self-declare foreign assets.
This paper uses comprehensive administrative data to estimate compliance responses to the bundle
of U.S. enforcement efforts starting in 2008. From a policy perspective, it is important to know how
effective the global wave of crackdowns on tax havens has been in fostering tax compliance and
raising tax revenue, but the available evidence is scant.1 We analyze data on reported foreign
accounts from Reports of Foreign Bank and Financial Accounts (FBARs), which must be filed
annually by U.S. taxpayers when the total value of their foreign accounts exceeds $10,000. We
1Langenmayr (2015) shows that U.S.-owned deposits in offshore jurisdictions increased in 2009 relative to a synthetic control group and interprets this as evidence that the OVD was associated with an increase in offshore tax evasion. Hanlon, Maydew and Thornock (2015) show that information exchange treaties between the U.S. and offshore tax havens lead to a decrease in portfolio investment from the cooperating tax havens into the U.S., consistent with a decrease in “round-tripping” by U.S. households, but do not discuss whether this reflects an increase in tax compliance or shifting of evasive accounts to non-cooperating tax havens.
3
combine these data on reported foreign accounts with information on participation in Offshore
Voluntary Disclosure (OVD) programs and income reported on tax returns. Combining these data
sets permits us to study the effect of enforcement on account disclosures and income reporting not
only for OVD participants, but also for any individuals who disclosed “quietly,” by reporting a new
foreign account and new income in that account without entering OVD.
We begin by documenting a sharp increase in the number of self-reported foreign accounts that
coincides with the enhanced enforcement efforts. In each of the years 2005 through 2008,
approximately 45,000 U.S. residents filed an FBAR for the first time, disclosing that they owned
foreign accounts. Many of these were presumably taxpayers who simply opened their first foreign
account and duly filed an FBAR. In 2009, the number of first-time FBAR filers more than doubled
to about 105,000 individuals. The steep increase is suggestive that a large number of taxpayers - a
simple difference estimate would be around 60,000 individuals - disclosed previously unreported
foreign accounts in response to the new enforcement policies. Only about 15,000 of the first-time
FBAR filers in 2009 participated in the voluntary disclosure program, suggesting that much of the
compliance response - a simple difference estimate would imply around 45,000 individuals -
occurred in the form of “quiet disclosures” outside of the voluntary disclosure program. We
estimate that the combined value of the accounts disclosed because of the enforcement efforts was
just below $120 billion.
This reading of the trends in FBAR reporting is consistent with patterns in the underlying
microdata. The increase in first-time FBAR filings was disproportionately large for account types
that are a priori more likely to play a role in tax evasion, even for those who did not participate in an
OVD program. First, the increase was much larger for accounts in tax havens, jurisdictions with tax
and secrecy laws favorable to foreign evaders, than in other foreign countries. For instance, the
number of first-time FBAR filings related to accounts in the Cayman Islands grew from about 300
in 2008 to approximately 4,500 in 2009. Second, the increase was more pronounced for large
accounts (above $1 million), which are more likely to serve investment rather than transactional
purposes, than for smaller accounts (below $100,000). Third, there was no comparable increase in
new FBAR filings by taxpayers residing outside of the U.S., who have a clear non-tax motive for
holding a foreign account. New accounts disclosed by existing FBAR filers were also
disproportionately high-value and concentrated in tax havens.
4
Entering OVD required paying back taxes and substantial penalties, but eliminated the risk of more
severe criminal penalties, while disclosing outside OVD allowed a taxpayer to avoid paying back
taxes and penalties at the risk of harsher criminal penalties. We next try to understand the factors
determining whether taxpayers disclosed inside or outside of the voluntary disclosure program.
Under the assumption that the 2009 cohort of first-time FBAR filers would have resembled the
2008 cohort in the absence of expanded enforcement, we identify the characteristics of those
induced to file by enforcement. Our findings support the notion that taxpayers decided to enter
OVD when the risk of detection and prosecution for a quiet disclosure was sufficiently high, as
those using the voluntary disclosure program were more likely to disclose a large account (higher
risk of criminal charges in case of detection), and to disclose an account in Switzerland (higher
detection risk given the concurrent crack-down against Swiss banks).
To measure the effect of the enforcement initiatives on tax compliance, we are ultimately interested
in whether new disclosure of foreign accounts is associated with a resulting increase in reported
taxable income. Here, we turn to the data from income tax returns. We employ an event study
methodology that allows us to quantify the increase in taxable capital income occurring when a
taxpayer discloses foreign accounts for the first time. To account for the underlying trend in
reported income, we include a control group of individuals who filed an FBAR in every year during
our sample period.
Not surprisingly, for individuals participating in the voluntary disclosure program—who have
admitted to non-compliance—we estimate a sharp and substantial increase in reported taxable
capital income after disclosure. More intriguingly, for first-time FBAR filers not participating in
OVD—who have not admitted non-compliance—we also find a substantial increase in capital
income in the first year of filing an FBAR, though with smaller effects than we observe for the
OVD participants.
These results suggest that the unusually large group of first-time FBAR filers in 2009 includes a
significant number of quiet disclosers, who started reporting foreign accounts and the capital income
accruing to these accounts in response to the enforcement initiatives without admitting tax evasion,
explicitly or implicitly. Three additional pieces of evidence support this interpretation. First, other
types of income do not increase following disclosures. Second, the increase in capital income at the
time of the first FBAR filing was not reflected in the third-party reports filed by domestic banks,
5
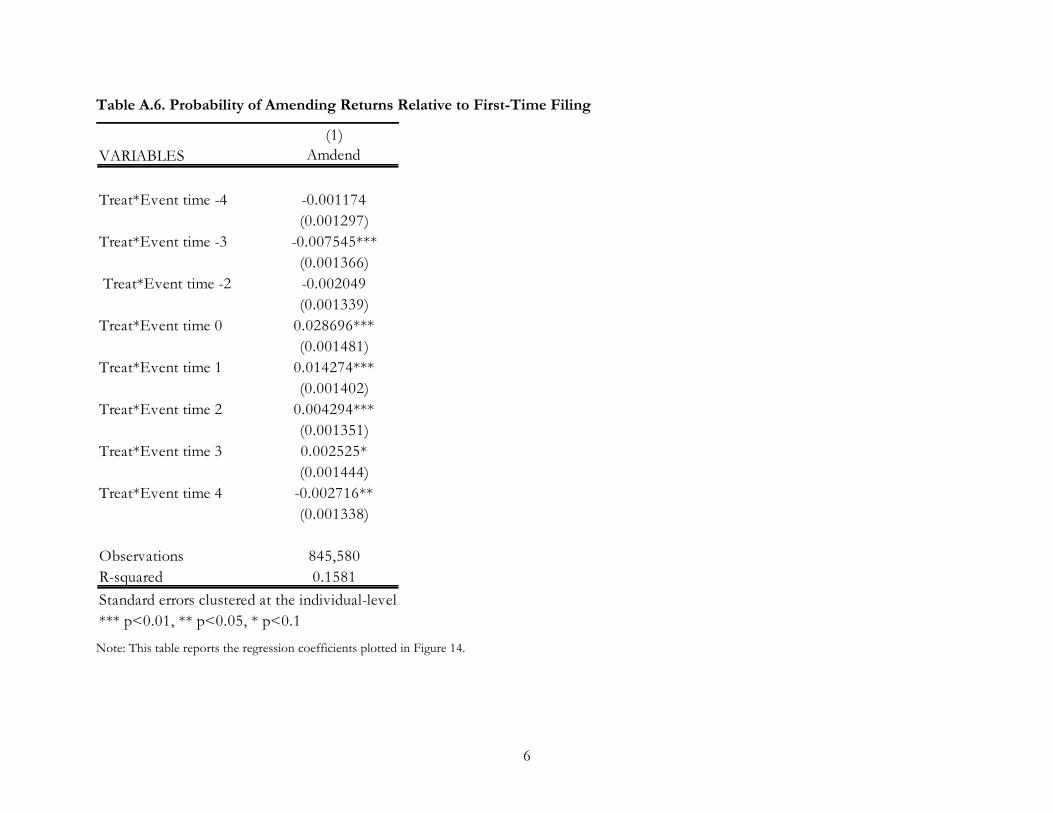
suggesting that the income indeed accrued to foreign accounts. Third, we find that the probability of
filing amended tax returns for previous tax years doubled after a first-time FBAR filing, although
from a low baseline of around 3%. These facts bolster our claim that the effect on capital income
reporting is being driven by quiet disclosures, and rule out most alternative explanations.
Finally, we estimate the total effect of the policy on reported taxable capital income and tax revenue.
Depending on what assumptions we make to handle the issue of heterogeneous treatment effects,
we find that these enforcement initiatives increased capital income reporting by $2.5 to $4 billion
annually, corresponding to $0.7 billion to $1 billion in annual tax revenue. Most of the total effect
comes from quiet disclosers rather than OVD participants, though the dollar amount per individual
is larger for OVD participants.
To put our findings in perspective, it is instructive to compare our estimate of offshore wealth
disclosed in 2009 because of the enforcement efforts, around $120 billion, to a recent estimate of
total offshore wealth owned by U.S. households in roughly the same period, around $1,000 billion
(Alstadsæter, Johannesen and Zucman, 2017b). The growing literature on offshore tax evasion
provides two potential explanations for why the enforcement efforts we study had a modest effect
on tax compliance. One set of studies shows that targeted enforcement policies induce some owners
of offshore accounts to adapt a new evasion strategy, for instance by moving assets to non-
cooperative tax havens (Johannesen and Zucman, 2014; Johannesen, 2014) or by adding layers of
secrecy in the form of anonymous shell corporations (Omartian, 2016). Additionally, a supply-side
theory of offshore tax evasion predicts that increases in enforcement induce only evaders with the
smallest accounts to become compliant (Alstadsæter, Johannesen and Zucman, 2017a).
Our findings also inform current debates about the Foreign Account Tax Compliance Act
(FATCA), a highly ambitious policy seeking to enhance tax enforcement by inducing foreign
financial institutions to report information to the IRS about all accounts held by U.S. taxpayers
beginning in 2015. Many observers have expressed reservations about FATCA, claiming that it
involves significant administrative costs for banks (e.g., Jolly and Knowlton, 2011) and pointing to
the compliance costs faced by U.S. citizens when setting up and maintaining foreign accounts for
fully legitimate purposes (e.g., Jacobs, 2012). In the face of these concerns, the effectiveness of the
enforcement initiatives in deterring evasion is paramount. Our results suggest that the enforcement
policies implemented prior to FATCA had a significant effect on aggregate tax compliance, but may
6
have been limited by a lack of scope, and, thus that stronger policy instruments may be needed to
ensure effective taxation of foreign accounts. Whether FATCA is sufficiently comprehensive to
significantly improve overall tax compliance, especially for very high-wealth individuals, will be an
important task for future research, as data become available.
2. Background: U.S. Enforcement Policy Initiatives Since 2009
For decades, the use of offshore bank accounts for tax evasion was straightforward and involved a
low risk of detection because the banking secrecy of foreign tax havens shielded tax evaders from
investigations by the U.S. tax authorities. Starting in 2008, however, the U.S. government adopted a
range of enforcement initiatives targeting owners of offshore accounts. The carrot-and-stick
approach combined measures to increase the probability of detecting undeclared offshore accounts
and a program providing incentives for tax evaders to voluntarily disclose their foreign assets. This
section provides a summary of these enforcement initiatives.
2.1 Ad hoc legal steps against Swiss banks
When Bradley Birkenfeld, a former employee at the Swiss bank UBS, blew the whistle and revealed
that the bank’s representatives were knowingly assisting U.S. individuals with tax fraud involving
anonymous shell corporations and undeclared Swiss bank accounts, the U.S. government took the
fight against offshore tax evasion to court. At the request of the Department of Justice, a federal
judge in July 2008 authorized the tax authorities to requisition information from UBS about its U.S.
customers without specifying the identities of these customers in advance, a so-called “John Doe
summons.” A few months later, the FBI announced that UBS was under investigation for its role in
tax evasion and several UBS executives, including the head of the wealth management division,
Raoul Weil, were indicted.2
While the criminal case against UBS was settled in February 2009 with the bank agreeing to pay a
fine of $780 million, the civil case about disclosure of customer lists had more far-reaching legal and
political implications. The demand by the U.S. government that UBS provide details about its 52,000
U.S. customers was a direct assault on the Swiss banking secrecy rules, under which UBS was
required to protect the privacy of its customers and its executives would face criminal charges in
2 Mr. Weil was found not guilty.
7
Switzerland if customer lists were shared with the U.S. government. The case was settled in March
2009, when the U.S. and Swiss governments agreed that UBS would reveal the identities of 4,450
customers to the U.S. tax authorities by intermediation of the Swiss Financial Services Authority.
How exactly the 4,450 names were selected from 52,000 U.S. individuals supposedly holding an
account at UBS was never disclosed, but these are widely believed to have been the most egregious,
wealthy tax evaders.3
Apart from the UBS account-holders directly named in the settlement, the outcome of the UBS case
may have induced compliance responses among offshore tax evaders more broadly by
demonstrating that the banking secrecy of foreign tax havens was no longer impenetrable, and
instead could be effectively challenged in courts. Later, the U.S. government took a similar approach
against a number of foreign banks with major wealth management divisions, including the issuance
of John Doe summonses against a number of other foreign banks including HSBC, Credit Suisse
and Wegelin & Co., and the establishment of a program for several Swiss banks to provide
information on U.S. taxpayers.
2.2 Information exchange
At the same time as the U.S. government took ad hoc legal steps against individual banks in tax
havens to obtain information about their customers, it also pursued a broader agenda to improve its
access to tax-relevant information from foreign banks through bilateral information exchange
agreements. In a first step, tax havens were compelled to accept the conventional mode of cross-
border cooperation in tax matters under which tax authorities can request bank information about
specific taxpayers from other countries in tax evasion cases. Many important tax havens had long
rejected this type of cooperation, often with reference to the banking secrecy rules in their domestic
law. However, coordinated political pressure by the United States and other G20 countries,
involving an explicit threat to impose economic sanctions on non-cooperative jurisdictions issued at
the G20 summit held in April 2009, induced virtually every tax haven in the world to agree to the
standard. The U.S. government signed bilateral agreements about information exchange on request
with six tax havens, Switzerland, Luxembourg, Liechtenstein, Malta, Monaco and Panama, during
the period 2008-2010.
3 For example, the IRS commissioner said at the time that “we were never interested in pursuing 52,000 accounts,” and that the 4,450 names gave IRS “access to the accounts we wanted” (DOJ, 2009b).
8
The main limitation of these agreements is that tax authorities can only request bank information
about specific taxpayers, and only in tax evasion cases where they possess sufficient evidence to
assert the relevance of the information requested. In practice, the information exchange agreements
are therefore rarely used and prominent tax experts have argued that the mode of cooperation is
simply too weak to be an effective deterrent of offshore tax evasion (Sheppard, 2009).
In a second step, the U.S. Congress passed a new law inducing foreign banks to provide information
about all accounts owned by U.S. taxpayers to the U.S. tax authorities. This move from occasional
information exchange with foreign jurisdictions under bilateral treaties to systematic reporting by all
foreign banks represents a dramatic change in the tax enforcement efforts with respect to offshore
accounts. The new reporting regime is detailed in the Foreign Account Tax Compliance Act
(FATCA), which was proposed in Congress in October 2009 and signed into law by President
Obama in March 2010. The law contains detailed provisions regarding the steps to be taken by
foreign banks to identify accounts owned by U.S. taxpayers, including cases where accounts are held
through corporate entities. To induce foreign banks to comply with FATCA, a 30% withholding tax
is applied to U.S.-source income paid to non-compliant banks, augmented in virtually every country
by intergovernmental agreements wherein foreign governments agree to collect the relevant
information on U.S. account holders from foreign financial institutions and distribute this
information to the U.S. authorities. While the first reporting of foreign account information under
FATCA was due in 2015, several years after our period of analysis, the prospect of much more
comprehensive third-party reporting of foreign income may have induced compliance responses as
early as 2009 when such legislation was initially being considered by legislators.
2.3 Voluntary disclosure programs
Complementing the initiatives aiming to facilitate detection of undeclared offshore accounts, the IRS
also offered a series of “voluntary disclosure” programs with incentives for offshore tax evaders to
voluntarily declare their foreign assets.4 The first initiative of this kind was the Offshore Voluntary
Disclosure Program, under which participants benefitted from reduced civil penalties and escaped
criminal prosecution. The program was initiated in March 2009, and expired in October 2009. To
apply for participation in the program, taxpayers had to submit a letter to the IRS containing 4 These initiatives are summarized and assessed in Lederman (2012).
9
identifying information and details about their foreign accounts or entities. Once cleared to
participate, the taxpayer had to i) provide copies of previously filed original and amended returns, ii)
submit updated complete and accurate returns for the previous six years, iii) provide information
about previously undisclosed income, including information on financial accounts, institutions and
facilitators, and iv) remit the necessary back taxes and penalties imposed by the OVD Program.
Taxpayers already under investigation for tax evasion were ineligible for the program.
A key feature of the OVD program was the uniform penalty structure under which participants were
liable for unpaid taxes and interest for the previous six years, an “accuracy-related penalty” of 20%
of the total unpaid taxes, and an “offshore penalty” of 20% of the value of the disclosed assets.5 As
the heightened publicity of the reporting requirements for offshore accounts made many taxpayers
aware of their FBAR filing requirement for the first time in 2009, the IRS clarified that individuals
who had been paying all taxes due but had been unaware of their FBAR filing requirement should
not participate in OVD and incur the offshore penalty, but rather they should simply file the
delinquent FBARs (IRS, 2009).
Subsequent to the OVD program, the U.S. offered several other voluntary disclosure programs with
similar terms and conditions: the Offshore Voluntary Disclosure Initiative, in place between
February and September 2011, and the 2012 Offshore Voluntary Disclosure Program, in place from
January 2012 onward. Each subsequent program increased the overall offshore penalty, and
simultaneously introduced lower penalties and an easier disclosure process for less egregious non-
compliance.
The IRS reported that the first voluntary disclosure program, active from March to October 2009,
drew around 15,000 disclosures of offshore accounts and resulted in the collection of $3.4 billion in
back taxes and penalties (IRS, 2011). Including later iterations of OVD programs, these numbers are
45,000 disclosures through the voluntary disclosure programs, resulting in the collection of $6.5
billion in back taxes, interest and penalties (IRS, 2014). These figures differ from the analysis we
5The OVD penalty structure was in lieu of the usual penalty structure for a willful failure to file FBAR, which was the greater of $100,000 or 50 percent of the balance in the account at the time of the violation, for each violation. To ensure that the OVD program in fact reduced the applicable penalty, the tax authorities would compare the OVD penalties to the total penalties applying absent the program, and the discloser would be liable for the lower amount. The civil penalty for non-willful failure to file an FBAR was up to $10,000 per violation.
10
perform here in two ways. First, they do not include taxpayers, known as “quiet disclosers”, who
started reporting their foreign accounts in response to the increased risk of detection without
participating in the voluntary disclosure program. Although this mode of disclosure offers no
protection against criminal charges for tax evasion, it may be perceived as attractive by some evaders
because it avoids the penalties in the voluntary disclosure program. Second, because the IRS figures
combine taxes and penalties and pool payments relating to many tax years, they do not provide
information about voluntary compliance via increased reporting of capital income following
disclosures, nor do they provide annualized information.
3. Conceptual Framework
As a framework for our empirical analysis, next we outline a simple description of the decision
options faced by a potentially non-compliant taxpayer. We use this framework to motivate a number
of empirical strategies that examine the full range of potential effects of the IRS enforcement
initiatives.
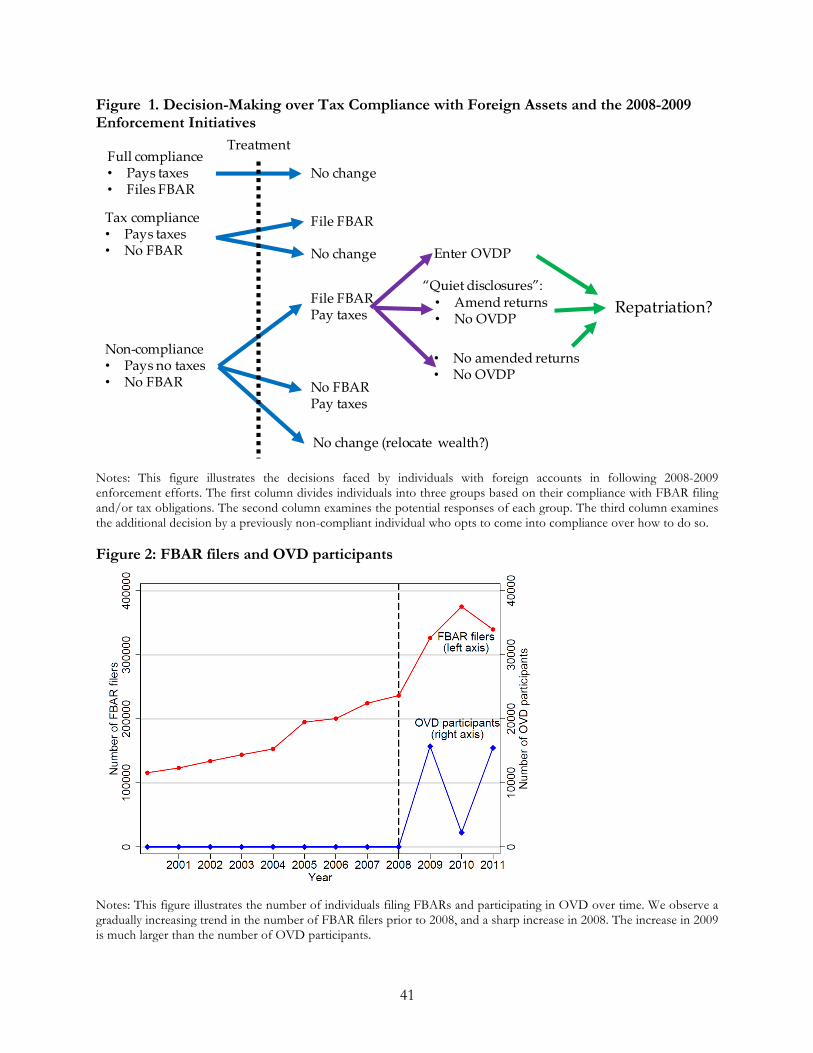
Figure 1 provides a general framework outlining the types of taxpayers who may be affected by the
policy changes, how their behavior may change as a result of a policy initiative, and how we might be
able to use data to identify the range of possible behavioral responses. One should think of the
reasoning presented here as the reduced form of a more complicated structural model that considers
individual characteristics such as risk aversion and personal location, the utility from the personal
use of a bank account for individuals residing in the same country as the account, country
characteristics such as the tax rate and the extent of bank secrecy laws, and enforcement parameters
such as the perceived current and future probability of detection of evasion, penalties for non-
compliance, and the compliance costs of complying with any filing rules. When the government
adopts a new enforcement policy, the last set of parameters changes, which causes some individuals
(generally those previously at the margin of choices) to change their behavior. For example, it might
have been optimal before the John Doe summonses for a particular individual to keep money in a
foreign account and not declare the income for tax purposes, but once the summonses begin the
perceived probability of detection increases enough to change what is optimal behavior. The new
optimal behavior may be to move the money back to the United States and/or declare the capital
income.
11
The treatment embodied by the 2008-2009 policy changes has two components: an increase in
detection risk for income in hidden accounts, and an increase in the salience of penalties for not
filing an FBAR. We divide taxpayers with foreign bank accounts into three groups prior to
treatment. The first group is fully compliant before the enforcement, and thus unaffected by the
treatment. The second group is compliant with their tax obligations, but due to compliance costs or
perhaps simply ignorance of their filing responsibilities, they did not file FBARs prior to 2009. The
treatment may induce these individuals to file an FBAR through increased publicity around the filing
requirements and non-filing penalties.
The third group consists of individuals who are non-compliant with their tax obligations and also do
not file an FBAR.6 Some members of this group might continue to risk detection and not change
behavior at all, especially with regard to accounts in countries where U.S. tax authorities are not yet
able to obtain information from foreign banks. Others could change behavior in response to the
enforcement initiatives but continue to evade tax liability; these account holders could shift the
location of accounts to less cooperative jurisdictions or change the structure of their foreign asset
holdings such that they are even harder to detect. A third likely scenario, that is consistent with our
empirical findings, is that many of these individuals will file an FBAR and start remitting taxes due
on the income in the accounts. These are the responses we investigate in Section 6. Note that
although the express targets of the enforcement crackdown were high-wealth individuals
intentionally hiding wealth abroad, this type of response to enforcement could also occur for
individuals who had unintentionally failed to comply with their tax obligations and/or individuals
with a relatively small amount of unpaid tax. The fact that some individuals with only a small
amount of tax due entered 2009 OVD and were subject to the sizable offshore penalty was the main
motivation for the changes to the OVD penalty structure (retroactively applied) for small accounts
and non-willful noncompliance alluded to the previous section.
In any case, individuals who decide to start complying fully must also decide whether to admit non-
compliance in previous years, either implicitly by filing amended tax returns and late FBARs or
6 One can imagine a fourth group that is compliant with FBAR filing requirements but not with tax obligations. It seems sensible to rule this out ex ante, as admitting the existence of an account to the authorities without remitting taxes on the income in that account would be exceedingly risky.
12
explicitly via the voluntary disclosure programs. Admitting prior non-compliance via the OVD
effectively shields the individual from criminal prosecution for tax fraud, but it exposes the
individual to sizable penalties in addition to the payment of back taxes, most importantly the
offshore penalty, which was 20% of the balance in the foreign account for the initial OVD of 2009
(see the previous section for details on how this penalty evolved over time). Individuals may
therefore risk prosecution and instead disclose their account “quietly,” filing an FBAR and declaring
the income on their tax return without entering the OVD program. Quiet disclosures may be
especially likely when individuals believe that criminal prosecution is unlikely, due for example to
their perception of limited resources of the IRS and/or the probable existence of larger-scale
evaders the IRS might be more likely to prosecute. Some quiet disclosers might not file amended tax
returns and FBARs for prior years, thus remitting no back taxes or penalties. Ultimately, a standard
model of decision-making would predict an individual decides whether to enter the OVD program
or disclose quietly based on the relative risk of criminal prosecution and the relative penalties
associated with each option. Thus, for example, an extremely wealthy, non-compliant individual with
an account at UBS, where enforcement was especially strong, may perceive the risks of disclosing
only quietly to be too large and enter the OVD program, while a less wealthy individual with an
account in the Cayman Islands might disclose quietly.
Our empirical analysis attempts to shed light on how individuals make disclosure decisions. First,
our empirical analysis of FBARs filed by OVD and non-OVD participants will shed light on the
question of how perceived risks and penalties lead individuals either to enter the OVD program or
to disclose quietly. Second, we address the question of the extent to which increased FBAR filing
was associated with increased reporting of the income generated by these accounts on tax returns.
Third, we examine whether taxpayers likely to have disclosed quietly filed amended tax returns for
prior years.
Finally, the enforcement initiatives may eliminate the benefits of continuing to have a foreign
account for many individuals who were not fully compliant with their tax liability obligations prior to
the policy change. These individuals may therefore wish to bring their assets back to the United
States. Most individuals would likely be unable to repatriate the account immediately in 2009: there
was little warning of the impending enforcement crackdown prior to 2009, and FBAR filing
requirements (and bank information-reporting requirements) applied to foreign accounts held at any
13
point in the current tax year. As such, individuals wishing to repatriate could be left with no choice
but to declare the foreign account in 2009. In later years, however, repatriation could lead to a
decrease in the number of foreign accounts in the treatment group and, at the micro level, an
increase in reported capital income from accounts held in domestic financial institutions on the
relevant information reports (Forms 1099).
4. Data
We examine data from the IRS Compliance Data Warehouse (CDW), which provides access to a
wide variety of tax return, enforcement, compliance, and other data. De-identified taxpayer data are
extracted from filed tax returns, enforcement information, and narrative data that sequence taxpayer
history. The individual returns file includes transcribed tax returns for individuals and includes most
taxpayer-filed forms and schedules, plus third–party-filed information documents.
We observe the information reported on Form 1040, the individual income tax return, including
nearly all the line items on the main form and supplemental schedules, as originally filed by the
taxpayer. We also have indicators of whether and when amended 1040 returns were filed, although
we do not have access to line-by-line information from the amended returns.
4.1 Foreign Bank Account Reports (FBARs)
Crucial to our analysis is micro data from the Report of Foreign Bank and Financial Accounts. The
official name of this form is FinCEN Form 114, where FinCEN is short for Financial Crimes
Enforcement Network,7 but it is colloquially known as the FBAR (Foreign Bank Account Report),
and we refer to it as such.8
United States “persons” are required to file an FBAR if the person had a financial interest in or
signature authority over at least one financial account located outside of the United States, and the
aggregate value of all foreign financial accounts exceeded $10,000 at any time during the calendar 7 We also have access to the earlier version of this form, TD Form 90-22.1, which has been required since the Banking Secrecy Act of 1970, and which was superseded as of September 30, 2013 by FinCEN Form 114 (FBAR). 8 The FBAR overlaps to some degree with the Form 8938, which was introduced under FATCA with the filing requirement beginning in 2012. Who must report differs slightly between FBAR and Form 8938, as does the reporting threshold for the total value of assets. Furthermore, Form 8938 asks about the taxable income on foreign accounts, while FBAR does not ask about income. As many of the important provisions of FATCA have only quite recently gone into effect, we do not use data from the Form 8938 here.
14
year reported. As defined by the instructions to the FBAR, a United States person includes “U.S.
citizens; U.S. residents; entities, including but not limited to, corporations, partnerships, or limited
liability companies, created or organized in the United States or under the laws of the United States;
and trusts or estates formed under the laws of the United States.” Extensive rules are designed to
ensure that individuals cannot avoid an FBAR filing requirement for assets they own by holding
them indirectly, for example through a shell corporation in a foreign country. Indirectly held
financial assets are subject to FBAR reporting rules, and are within the purview of the enforcement
crackdown.9
The FBAR is a calendar-year report that during the period of our analysis had to be filed on or
before June 30 of the year following the calendar year being reported. Effective July 1, 2013, the
FBAR must be filed electronically and, as of 2017, the filing date is April 15. The FBAR is not filed
with a federal tax return, and is filed with FinCEN and not the IRS. Unlike the filing of federal tax
returns, there is no provision for requesting an extension of time to file an FBAR.
The filer of an FBAR form is required to report account numbers and identifying information for
the U.S. person who owns the assets in the account (directly or indirectly), including an address and
the maximum value of each account for the year. Prior to 2009, filers were required to report the
account value within various ranges, but beginning in 2009 they were required to report the exact
maximum dollar amount.
4.2 Voluntary disclosure
The final component of our analysis in this paper relies on data regarding participation in the
voluntary disclosure programs (the Offshore Voluntary Disclosure Programs/Initiatives of 2009,
2011, and 2012). Our data on the voluntary disclosure programs consists of whether an individual
participated in one of the voluntary disclosure programs, the date that an IRS official recorded
receiving their application to participate in the program, and the opening and closing dates for the
case. We use the first of these dates to determine when an individual participated in the OVD
program. In some cases processing delays could cause the date of receipt of an application to be well
9 In some cases, individuals may hold assets through networks of accounts and corporations in multiple countries. The FBAR filing requirements essentially require that each account that an individual owns directly or indirectly and in any country be reported individually on the FBAR.
15
after the actual submission of the application, and the opening date of the case can be later still,
which is important to bear in mind when viewing some of the results regarding the timing of OVD
participation and the associated income reporting.
5. Aggregate Data Analysis
5.1 Total FBAR and OVD filings
In this section, we present evidence suggesting that the enforcement efforts in 2009 were associated
with a sizable increase in tax compliance. In particular, we use information on filings of FBARs and
enrollment into the OVD programs to, first, document a sharp increase in disclosures of foreign
wealth in 2009 and, second, show that the increase in disclosures was much stronger for the types of
foreign accounts that are a priori most likely to be used for tax evasion.
Figure 2 shows the number of individuals filing an FBAR (left axis) and the number of individuals
participating in the OVD programs (right axis) in each year over the period 2000-2011. The number
of FBAR filers grew steadily from 125,000 filers in 2001 to around 350,000 filers in 2011. There is a
noticeable jump in the number of FBAR filers between 2004 and 2005, which could be due to the
introduction in 2004 of a penalty for non-willful failure to file an FBAR, and a much larger jump in
2009 coinciding with the enforcement efforts. There were around 15,000 OVD participants in both
2009 and 2011; the two years in the sample period where a voluntary disclosure program was in
place. The fact that we record a positive number of OVD participants in 2010 is attributable to the
processing delays mentioned in Section 4.2.
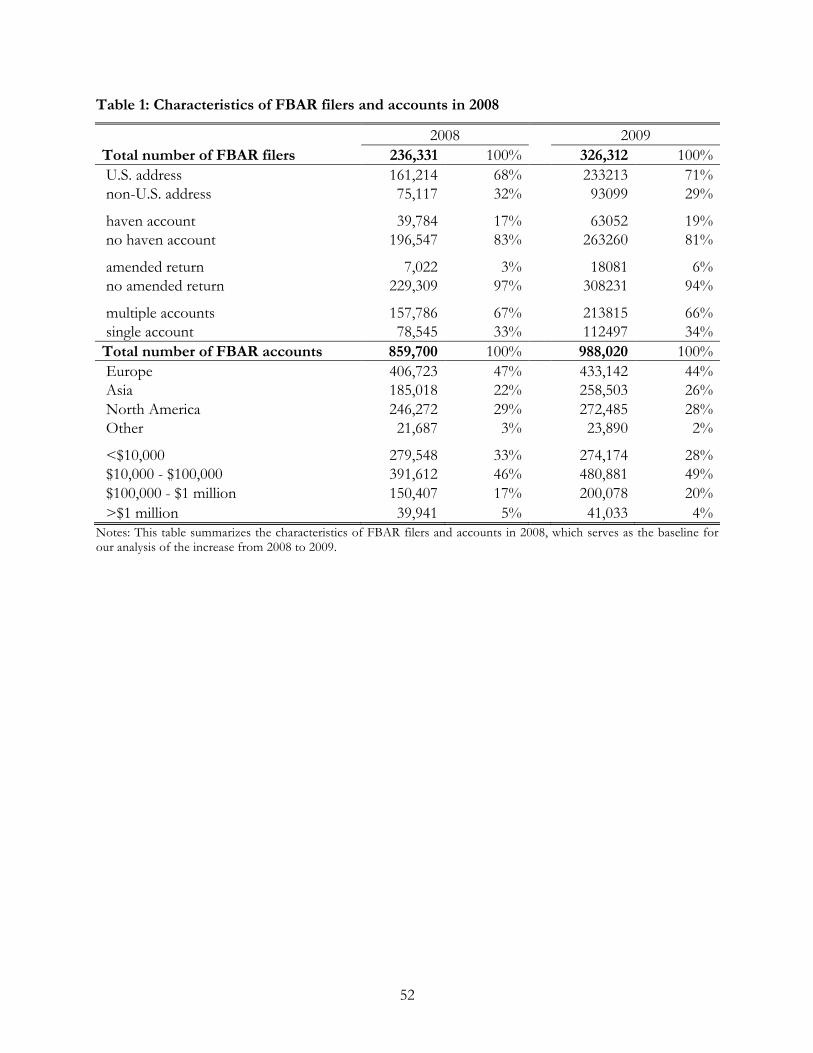
Table 1 provides descriptive statistics on FBAR filers and their foreign accounts in 2008 and 2009,
highlighting several important properties of the sample. First, recall that all U.S. taxpayers with
accounts outside of the U.S. are required to file FBARs, whether they reside in the U.S. or not.
Almost one-third of the FBAR filers were residing outside of the U.S. as indicated by the address
reported on the FBAR. We expect that, conditional on having a foreign account, the probability of
using the account to evade U.S. income taxes is higher among individuals living in the U.S. than
among individuals living in foreign countries simply because the latter have a strong transaction
motive for holding an account in the country where they live. Second, about one-sixth of the FBAR
filers report at least one account in a tax haven, which we define in this paper as the OECD (2000)
16
list of uncooperative tax havens plus Switzerland, Singapore, Hong Kong and Luxembourg. When a
taxpayer discloses a tax haven account, this is arguably more likely to represent an increase in
compliance because tax haven accounts are known to be largely undeclared for tax purposes
(Alstadsæter, Johannesen and Zucman, 2017a). Third, a relatively small fraction of FBAR filers (3%
in 2008) amend FBARs for previous years. Although there may be cases where taxpayers discover
non-deliberate errors on previous years’ FBARs and choose to correct them, the filing of amended
returns is generally a strong indication of new compliance. Finally, the table shows that many FBAR
filers have multiple accounts (67% in 2008) so that the number of reported accounts in 2008 is
almost four times as large as the number of filers. As of 2008, most reported accounts were located
in Europe (47%), North America (29%) and Asia (22%) and most disclosed accounts are relatively
small, with values between $10,000 and 100,000 (46%) being the most frequent range. The analysis
below will devote considerable attention to the change in the nature of FBAR reports around the
time of the enforcement efforts.
5.2 New disclosers of foreign accounts
To detect the effect on tax compliance of the enforcement efforts that began in earnest in 2009, we
construct an annual measure of new disclosers of foreign accounts. The aggregate number of FBAR
and OVD filings reported in Figure 2 do not directly measure this concept. First, the series do not
distinguish between new and continuous FBAR filers. Second, the aggregate FBAR series includes
taxpayers living outside of the U.S. for whom a non-U.S. account is most often not a “foreign”
account but rather is an account in their country of residence, in part to facilitate local transactions.
Third, while OVD participants represent new disclosures by definition, they may or may not be
included in the number of FBAR filers in the year they apply to participate in the OVD; depending
on the precise timing of the application and the processing time at the IRS, the disclosed assets may
be recorded on an FBAR for the first time in the application year or in a later year.
To address these issues, we construct a measure of “new disclosers” of foreign accounts, which
comprises two distinct groups: “OVD filers” in year t who are counted in the year they file an OVD
application regardless of their FBAR filings; and “first-time FBAR filers” in year t who are defined
as tax payers that file an FBAR in year t and did not file an FBAR in years t-1, t-2 and t-3. To avoid
double counting, the latter group excludes taxpayers who participated in an OVD at any time during
17
the sample period. Both groups exclude taxpayers with non-U.S. addresses, who arguably have a
non-evasion-related reason for maintaining a non-U.S. account.
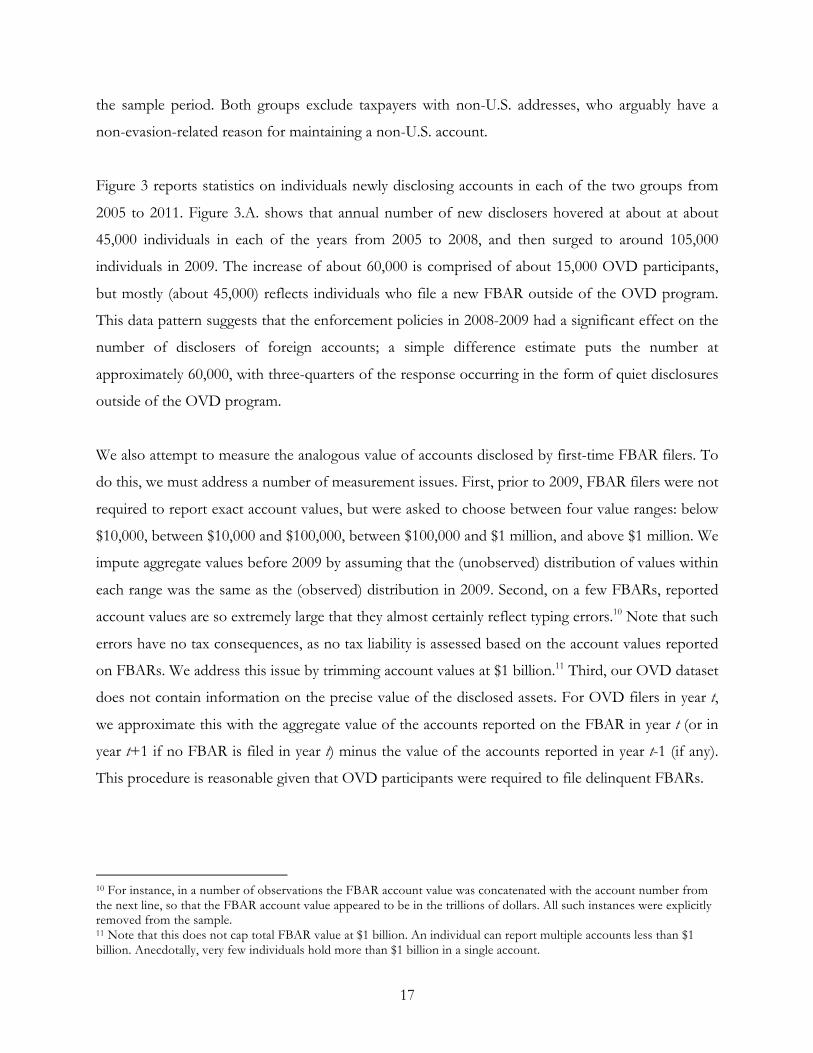
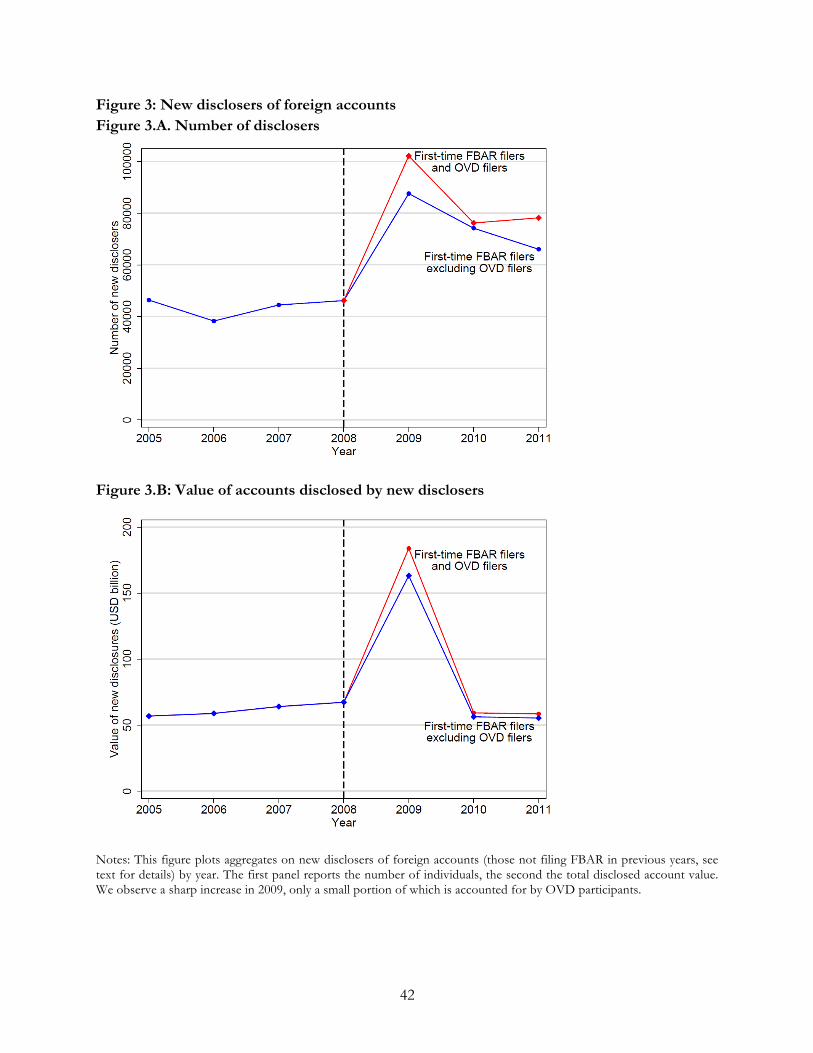
Figure 3 reports statistics on individuals newly disclosing accounts in each of the two groups from
2005 to 2011. Figure 3.A. shows that annual number of new disclosers hovered at about at about
45,000 individuals in each of the years from 2005 to 2008, and then surged to around 105,000
individuals in 2009. The increase of about 60,000 is comprised of about 15,000 OVD participants,
but mostly (about 45,000) reflects individuals who file a new FBAR outside of the OVD program.
This data pattern suggests that the enforcement policies in 2008-2009 had a significant effect on the
number of disclosers of foreign accounts; a simple difference estimate puts the number at
approximately 60,000, with three-quarters of the response occurring in the form of quiet disclosures
outside of the OVD program.
We also attempt to measure the analogous value of accounts disclosed by first-time FBAR filers. To
do this, we must address a number of measurement issues. First, prior to 2009, FBAR filers were not
required to report exact account values, but were asked to choose between four value ranges: below
$10,000, between $10,000 and $100,000, between $100,000 and $1 million, and above $1 million. We
impute aggregate values before 2009 by assuming that the (unobserved) distribution of values within
each range was the same as the (observed) distribution in 2009. Second, on a few FBARs, reported
account values are so extremely large that they almost certainly reflect typing errors.10 Note that such
errors have no tax consequences, as no tax liability is assessed based on the account values reported
on FBARs. We address this issue by trimming account values at $1 billion.11 Third, our OVD dataset
does not contain information on the precise value of the disclosed assets. For OVD filers in year t,
we approximate this with the aggregate value of the accounts reported on the FBAR in year t (or in
year t+1 if no FBAR is filed in year t) minus the value of the accounts reported in year t-1 (if any).
This procedure is reasonable given that OVD participants were required to file delinquent FBARs.
10 For instance, in a number of observations the FBAR account value was concatenated with the account number from the next line, so that the FBAR account value appeared to be in the trillions of dollars. All such instances were explicitly removed from the sample. 11 Note that this does not cap total FBAR value at $1 billion. An individual can report multiple accounts less than $1 billion. Anecdotally, very few individuals hold more than $1 billion in a single account.
18
Figure 3.B shows the aggregate value of the new disclosures calculated in this way, reported
separately for first-time FBAR filers and OVD filers. The value was close to $60 billion in the years
2005-2008 with a slightly increasing trend, in 2009 jumped by a factor of three to $180 billion, and
then returned in 2010 to its pre-2009 level. This data pattern clearly indicates that the enforcement
policies in 2008-2009 had a significant effect on the value of disclosed foreign accounts; a simple
difference estimate comes to about $120 billion, with most of the disclosures occurring outside of
the OVD program.12
5.3 Accounting for other shocks
A potential problem with the simple difference estimator we have been presenting is that the
increase in the number of new disclosers and amount of assets disclosed in 2009 could be at least
partly driven by shocks other than the enforcement initiatives; certainly, the world economy was
experiencing substantial shocks in this period. To assess this possibility, we compare the number of
first-time FBAR filers among taxpayers with addresses in the U.S. to the number of first-time FBAR
filers among taxpayers with addresses outside of the U.S. As noted above, individuals living in
foreign countries have a natural transaction motive for holding an account there, and so presumably
a relatively small share of them use the account for tax evasion. If the large increase for taxpayers
with U.S. addresses was indeed driven by the enforcement policies, we should expect to see a much
smaller relative increase among tax payers with non-U.S. addresses. If the driving factor were instead
other shocks coinciding with the tax enforcement policies, and if these other shocks affected tax
payers with U.S. and non-U.S. addresses in the same way, we should observe similar trends in first-
time FBAR filers among the two groups.
We present the results of this comparison in Figure 4, which shows the number of new disclosers
with U.S. and non-U.S. addresses, respectively. The left panel displays the raw numbers: an increase
from around 45,000 disclosers with U.S. addresses in 2008 to around 105,000 disclosers in 2009 and
from just below 20,000 filers with non-U.S. addresses in 2008 to just above 25,000 in 2009. The
right panel displays the same series normalized to the level of each series in 2008. The series have
very similar trends in the period 2005-2008, but diverge sharply in 2009 when first-time FBAR filers
12We note that this estimate is not insensitive to the trimming of extremely large reported account values. Trimming values at $10 billion instead of $1 billion leaves the qualitative pattern virtually unchanged, but yields a larger increase in new disclosures, from about $100 billion in 2005-2008 to nearly $300 billion in 2009. However, we believe that the vast majority of the accounts over $1 billion dollars are erroneously reported.
19
increase by around 120% among taxpayers with U.S. addresses, while the increase among tax payers
with non-U.S. addresses is only 40%. Based on these figures, a simple difference-in-difference
estimate of the effect of the enforcement efforts on the number of first-time FBAR filers among
taxpayers living in the U.S. comes to approximately 80%. This estimator assumes that U.S. taxpayers
with non-U.S. accounts living inside and outside of the U.S. are subject to the same shocks (e.g.
shocks to the financial system, to their portfolios of assets, to their labor market earnings), except
that the group living inside of the U.S. includes a number of tax evaders, whose reporting behavior
is affected by the enforcement initiatives, whereas the group living outside of the U.S. all use their
accounts for a legitimate purpose and are therefore completely unaffected by the enforcement
initiatives. To the extent that some taxpayers living outside of the U.S. were not compliant with their
FBAR filing obligations, part of the increase in first-time FBAR filers among this group would be
caused by the enforcement initiatives, implying that the difference-in-difference estimate is
downward biased. Overall, the comparison between the FBAR reporting by taxpayers with U.S. and
non-U.S. addresses is consistent with the notion that enhanced tax enforcement was the major
driver of the large increase in first-time FBAR filings in 2009.
5.4 Heterogeneity in the increase in first-time FBAR filings
The spectacular surge in the number of taxpayers who filed an FBAR for the first time in 2009
without participating in the OVD initiatives suggests that the enforcement efforts induced a
significant number of quiet disclosures of foreign accounts previously used for tax evasion. To
further probe this interpretation, we describe the heterogeneity of the surge along three dimensions:
account country, amended versus non-amended FBARs, and account value. This analysis excludes
taxpayers who participated in the OVD (who thus cannot be quiet disclosers) and excludes taxpayers
reporting an address outside of the U.S. (whose non-U.S. accounts are less likely to be used for tax
evasion purposes).
First, in Figure 5, we show the number of first-time FBAR filers reporting foreign accounts in
havens and non-havens, respectively. Individuals who report accounts in both havens and non-
havens are included for this purpose in the haven category, and only those who report no accounts
in any haven are included in the non-haven category. Figure 5 reveals that, while most of the
absolute increase was driven by taxpayers with accounts in non-havens, the relative increase was
much larger for taxpayers with accounts in havens, which almost tripled from about 7,000 to almost
20
20,000 individuals. The stark increase in disclosures of tax haven accounts is consistent with the
notion that a significant fraction of the new FBAR filers were previously evading taxes through their
foreign accounts.
Figure 6 further highlights the difference between FBAR reporting in tax havens (red bars) and non-
havens (blue bars) by displaying the change from 2008 to 2009 in the number of accounts reported
by first-time FBAR filers at the individual country-level.13 The upper panel shows that the largest
absolute increases in reported accounts were divided between economies such as Canada, Japan and
the U.K., non-havens with strong economic ties to the U.S., and much smaller economies like
Cayman Islands and Switzerland, which are notorious tax havens. The lower panel reveals that the
largest relative increases were highly concentrated in havens; in the Cayman Islands, for instance, the
increase in the number of accounts disclosed by new FBAR filers was above 1000%!
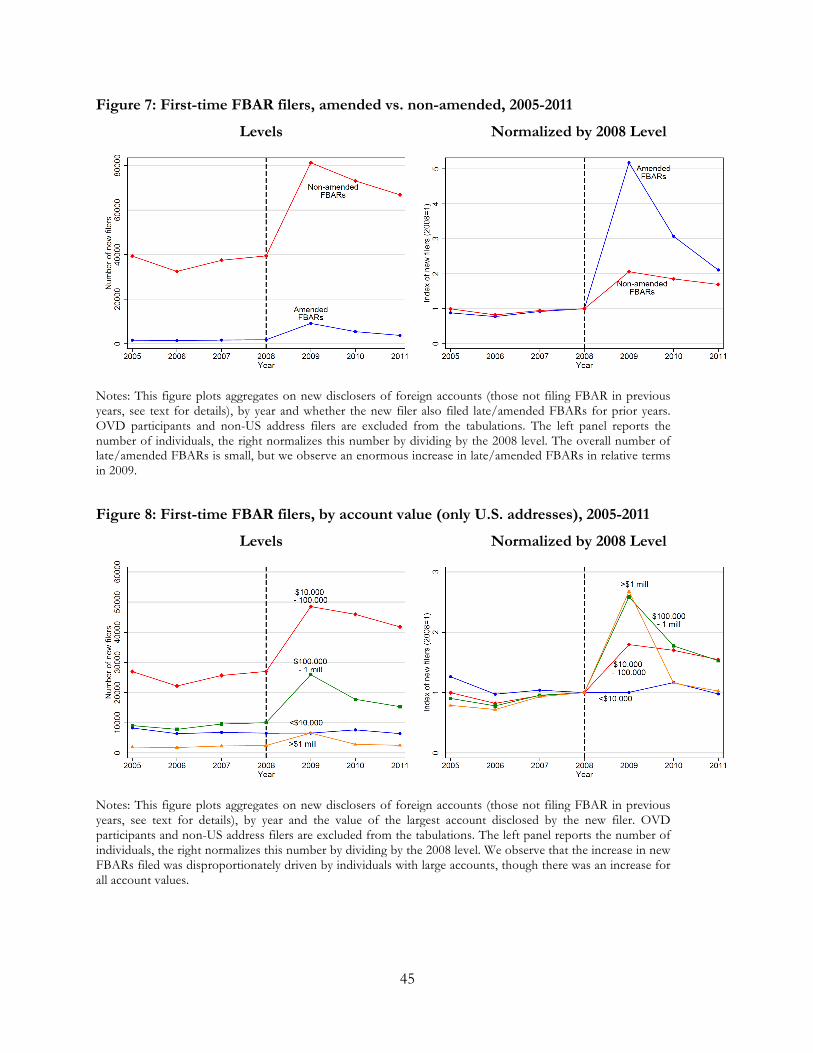
Another potential sign of an enforcement effect is the filing of amended FBARs to correct prior
non-compliance. In Figure 7, we show the number of first-time FBAR filers who did and did not
amend FBARs for previous years respectively. While there are generally relatively few filers who
make amendments, there was a very large relative increase coinciding with the enforcement efforts.
In each of the years 2005-2008, there were about 1,500 individuals filing amended FBARs, but this
figure soared to more than 9,000 in 2009. This documents that a significant number of accounts first
reported in 2009 existed--but were not reported--in prior years, which represents direct evidence of
quiet disclosures.
Next, in Figure 8, we show the number of new FBAR filers within account size categories.
Individuals with multiple foreign accounts are placed into a category based on their largest account.
The left panel shows that the largest absolute increases were in intermediate size categories (between
$10,000 and $1 million). The right panel shows that the increases were relatively larger for larger size
categories (above $100,000), which are more likely to serve wealth storage purposes, and much more
modest for smaller account sizes (below $100,000), which are more likely to be transactional
accounts.
13 In Figure 6, an individual with accounts in multiple countries is counted multiple times, once for each country in which they have an account.
21
In sum, by showing that the surge in first-time FBAR filings in 2009 was particularly pronounced
for accounts that were more likely used to evade taxes – accounts in tax havens, accounts with large
balances and accounts that existed but were undeclared in previous years – Figures 6-8 constitute
further evidence of a surge of quiet disclosures among first-time FBAR filers at the time of the
expanded IRS enforcement initiatives.
5.5 The intensive margin of disclosure
Until now, the analysis has focused on disclosures on the extensive margin of FBAR reporting:
individuals who did not report their foreign accounts before 2008, but started reporting in 2009,
apparently in response to enforcement. Next, we explore whether there are also quiet disclosures on
the intensive margin: individuals who reported some foreign accounts before 2008 (for instance,
small accounts in non-havens serving transactional purposes), but in 2009 started reporting
additional accounts (for instance, large accounts in havens serving wealth storage purposes).
To explore this behavioral response, we define three indicators of quiet disclosers among taxpayers
who did not participate in the OVD program: (i) FBAR filers who reported exactly one account in
year t-1 and at least two accounts in year t (“new multiple account holders”); (ii) FBAR filers who
reported accounts below $100,000 in year t-1 and at least one account above $1 million in year t
(“new large accounts”); and (iii) FBAR filers who reported only non-haven account(s) in year t-1 and
at least one haven account in year t (“new haven account holders”).
Figure 9 shows the number of individuals in each of these groups for the years 2005-2011. While the
trends were almost flat in the years 2005-2008, there was a sharp increase in 2009 for all three
groups: new multiple accounts doubled from about 10,000 to more than 20,000; new haven
accounts tripled from 5,000 to about 15,000; and new large accounts quintupled from approximately
1,000 to almost 5,000. These patterns are clearly consistent with a very large increase in quiet
disclosures in 2009 on the intensive margin.
5.6 The decision to participate in the OVD Program, conditional on disclosure
To this point we have mostly focused on disclosures through OVD and non-OVD channels
separately. This section considers the decision of whether to participate in an OVD program or to
disclose quietly. For a taxpayer who decides that continued evasion is too risky in the new post-2009
22
enforcement environment, a classical deterrence model of tax evasion suggests that people should
decide to disclose quietly or to participate in OVD based on the risks and penalties associated with
each option. The OVD effectively eliminates the risk of criminal prosecution and the harshest
possible penalties, but it also subjects the taxpayer to a 20% (of assets) offshore penalty in the 2009
OVD (in addition to some back taxes and standard penalties). Theory therefore suggests that the
accounts with the highest probability of prosecution in the event of a quiet disclosure should be the
ones in which taxpayers participate in OVD. We hypothesize that, relative to quiet disclosure, OVD
participation is more likely to be attractive for the largest accounts, and for accounts in locations
where the enforcement crackdown was especially strong, most notably Switzerland.
In order to compare quiet disclosures to OVD participants, it is useful to have a more refined way to
estimate the characteristics of FBARs filed in response to enforcement, as not all new FBAR filers in
2009 were induced by enforcement, and the above reasoning suggests that the characteristics of
quiet disclosers may differ from that of other new FBAR filers in 2009. To do this, we assume that
in the counterfactual where the 2009 crackdown did not occur, 1) the overall number of new filers
and 2) the distribution of characteristics of new filers would have been the same in 2009 as in the
2008 new filer population. We can infer from the pre-2008 results in Figures 5 through 9 that the
number and characteristics of new FBARs filed was relatively stable from 2005 to 2008, which
suggests that these assumptions are correct up to a reasonable approximation, and that were we to
use another other year prior to 2008, we would obtain a similar counterfactual.
We will label individuals who filed because of the enforcement crackdown in 2009 “FBAR
compliers.”14 By the first assumption above, we calculate the number of FBAR compliers, denoted
!"#, as!())*–!()),, where !- is the number of new FBARs filed in year t. By the second
assumption, we can write the probability distribution of some characteristic. in the quiet discloser
population as
/"#(.) = /())* . !())*–/()), . !()),
!"#,
14We use this term to distinguish between all filings induced by enforcement from the subset of those that are quiet disclosures. The former may include some “FBAR-only” compliers, who had been reporting income and paying taxes correctly all along. Regardless of whether they are engaging in a true quiet disclosure, these taxpayers are newly compliant with their FBAR filing rule, and they are compliers in the sense of Imbens and Angrist’s (1994) treatment effects framework.
23
where /- is the distribution of . in year t and /"# is the distribution among FBAR compliers.
The next set of figures we present plots the distribution of characteristics for all 2009 new filers, for
the 2009 FBAR compliers (/"# . ), and for 2009 OVD participants. We can then compare these
two to examine our hypothesis that someone would choose to engage in OVD over alternate forms
of disclosure based on the relative risks and penalties of each.
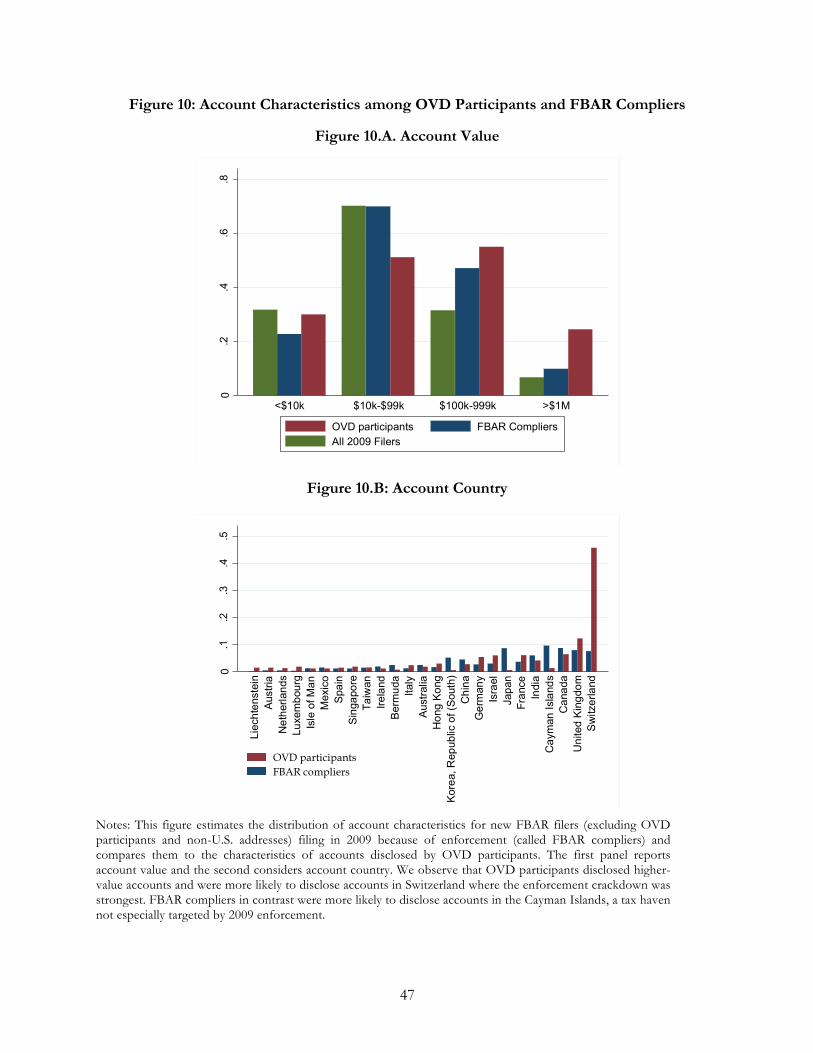
The results of this analysis are in Figure 10. Figure 10.A considers the distribution of account values
using four ranges of account values. We observe that the 2009 FBAR compliers had significantly
higher account values than 2009 new filers overall, but also that the OVD participants typically had
still higher account values. This finding is consistent with the hypothesis that OVD participants
should have larger account values than FBAR compliers, as larger account values are associated with
a larger probability of detection.
Figure 10.B plots the distribution of account country for the FBAR compliers and the OVD
participants. About 45% of OVD participants disclosed a Swiss account, compared to less than 10%
of FBAR compliers. In contrast, 10% of FBAR compliers disclosed an account in the Cayman
Islands, compared to a negligible share of OVD participants. Recall that the 2009 enforcement
expansion especially targeted Swiss accounts and, while the Cayman Islands is thought to harbor
many evasive accounts, it was not especially targeted in 2009. The difference in the pattern of
disclosures between these two countries is therefore consistent with our hypothesis. Although they
are less important overall, Figure 10.B suggests that OVD disclosures were much more concentrated
in Liechtenstein and Luxembourg than quiet disclosures, which likely stems from information
exchange treaties the U.S. signed with these countries in 2008.
While the overall pattern of these correlations is consistent with what we should expect from a
theoretical model in which taxpayers take calculated risks when deciding whether to enter OVD or
disclose quietly, the correlations are not perfect. There are some taxpayers with relatively small
accounts participating in OVD, and some taxpayers with Swiss accounts engaging in quiet
disclosures. This could be due to heterogeneity in risk tolerance, whereby for example some
taxpayers are willing to take the risk of a quiet disclosure even though they have a very large account,
heterogeneity in factors affecting the perceived risk of detection of a quiet disclosure that is not
observable to us, or some taxpayers perceiving the risk of a quiet disclosure to be higher than it
really was.
24
6. The Response of Reported Capital Income
To this point we have largely focused on the impact of the enforcement initiatives on reported
foreign accounts. Of more direct tax policy interest is their effect on income reported, and subjected
to tax, on U.S. tax returns. It is possible, although perhaps unlikely, that our results to this point
could be obtained without an increase in compliance with income taxes, if individuals filing FBARs
for the first time had already been paying tax on the income in those accounts but simply failing to
declare the account on an FBAR. In this section, we analyze capital income reporting behavior by
linking individuals’ income tax returns with their FBAR reports and information on OVD
participation.
As discussed in the conceptual framework of Section 3, there are multiple possible margins of
behavioral response to enforcement. One is that foreign accounts that generate taxable income that
had not previously been reported are now reported for tax purposes. Another is that funds in
foreign accounts are repatriated to U.S. accounts, and taxed on income that accrues after
repatriation. A third is that the foreign accounts are maintained, and possibly further disguised
through the use of, for example, indirect holding through shell corporations in foreign financial
institutions that do not plan to participate in FATCA. The analysis that follows will shed light on the
extent of the first of these responses.
We investigate this issue by looking at OVD participants and first-time FBAR filers, analyzing how
their reported capital income changes around the time of OVD participation or, for non-OVD
participants, first-time FBAR filing. After linking OVD participants and FBAR filers to their income
tax returns, we construct two treatment groups and a control group. The first treatment group
consists of participants in the 2009 OVD. The second treatment group consists of the set of new
FBAR filers in 2009 with U.S. addresses who did not participate in OVD, which is the group for
which we observed evidence of a strong quiet disclosure response in the previous Section. We
analyze data on reported incomes for this group for four years before and four years after their
initial disclosure of an offshore account in 2009. Our control group consists of “continuing” FBAR
filers in 2009, i.e., those who filed FBARs in 2009 and also in each year of the previous four years.
We then estimate a flexible difference-in-differences (DD) model of the form
25
3 45- = 6 + 89:5-9
;
9<=;
+ >5 + ?- ∗ ABCBDE5 + F5- + G5-,(2)
where the :5-9 terms are dummy variables for being in the treatment group for each year relative to
disclosure, where s=0 in the year of disclosure. We estimate the same specification separately for
OVD and other first-time FBAR filer treatment groups in :5-9 . The specification also includes
individual fixed effects, >5 , and year fixed effects, ?-, interacted with age groups. The interaction of
year fixed effects with age groups helps to control for life-cycle wealth accumulation and career
paths.15 The coefficient 89 represents the change in income from the year before disclosure (t-1) to
year I. Under the assumption that aggregate shocks to the various age groups affect the treatment
and control group in the same way before and after the event, we can interpret 89 as a causal effect
of disclosure.16 We examine various sources of income, 45-, as the outcome variable and, because we
expect FBAR filing to be more closely related to capital income relative to labor income, we expect
to observe the largest impacts for these sources of income. To accommodate zeros and, in some
cases, negative values of the dependent variable, we use the inverse hyperbolic sine (IHS)
transformation. For positive ranges of 45-, the coefficients of the event-time dummies can be
interpreted exactly as if we were using a log specification, i.e., as the difference between reported log
income reported at time s and reported log income had disclosure not occurred. As with the log
transformation, for positive values the effect size approximates the percent change in income due to
disclosure. Interpreting the results in the presence of an effect on the propensity to report zero
capital income is more complicated. Nonetheless, we prefer the IHS transformation because 1) we
believe it is more appropriate to assume that the underlying trends are parallel in approximately
logarithmic terms, but 2) we do not wish to exclude zeros, as doing so can introduce bias and, as we
shall see, individuals reporting zero in the pre-treatment period are an important part of the effects
of the policy.17
15 Age groups are defined as of year 2010 and are: 25-40 years, 41-50 years, 51-60 years, and 61-80 years. 16 This is a flexible version of the standard parallel trends assumption of difference-in-differences models. 17 Using instead a traditional log transformation and simply dropping zero and negative observations gives similar results (see, e.g., Table A.2). An alternative approach would be to derive estimates using event studies in levels. There are two main issues with such an approach. First, the pre-trends of the event studies are not parallel in levels, so estimation of our model in levels would lead to a biased treatment effect. With any DD method, the pre-trends cannot be parallel in both levels and percentages unless the averages are the same in the pre-period. Second, because of the thick tail of top incomes in our data, estimation in levels is very difficult in the sense that a high degree of income volatility among this group coupled with outlier values leads to very large standard errors. This issue has been noted when using administrative data focusing on high-income groups in previous studies (see, e.g., Kawano, Weber, and Whitten, 2016).
26
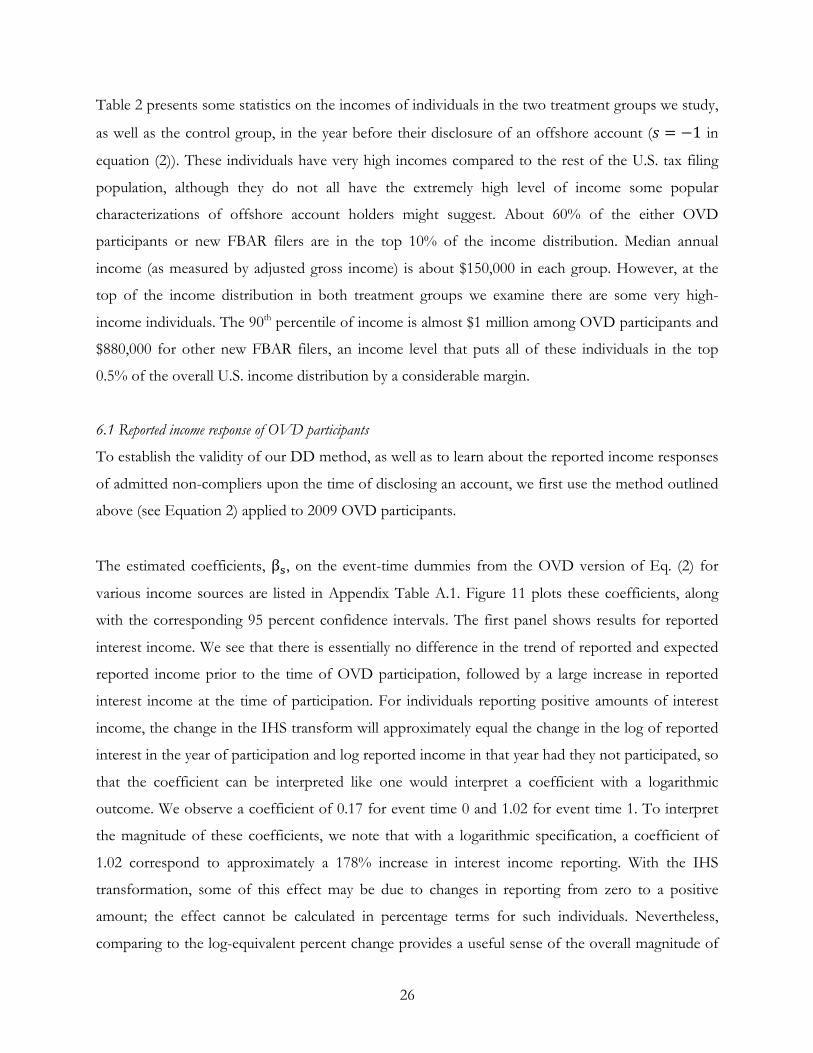
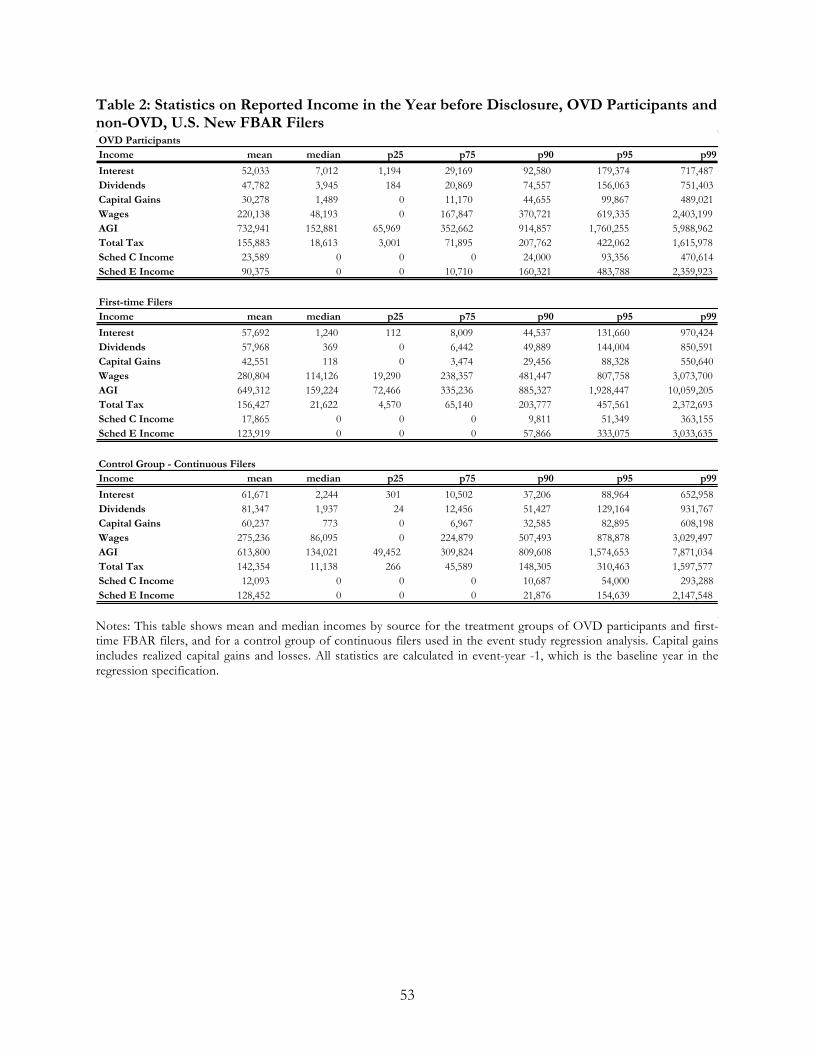
Table 2 presents some statistics on the incomes of individuals in the two treatment groups we study,
as well as the control group, in the year before their disclosure of an offshore account (I = −1 in
equation (2)). These individuals have very high incomes compared to the rest of the U.S. tax filing
population, although they do not all have the extremely high level of income some popular
characterizations of offshore account holders might suggest. About 60% of the either OVD
participants or new FBAR filers are in the top 10% of the income distribution. Median annual
income (as measured by adjusted gross income) is about $150,000 in each group. However, at the
top of the income distribution in both treatment groups we examine there are some very high-
income individuals. The 90th percentile of income is almost $1 million among OVD participants and
$880,000 for other new FBAR filers, an income level that puts all of these individuals in the top
0.5% of the overall U.S. income distribution by a considerable margin.
6.1 Reported income response of OVD participants
To establish the validity of our DD method, as well as to learn about the reported income responses
of admitted non-compliers upon the time of disclosing an account, we first use the method outlined
above (see Equation 2) applied to 2009 OVD participants.
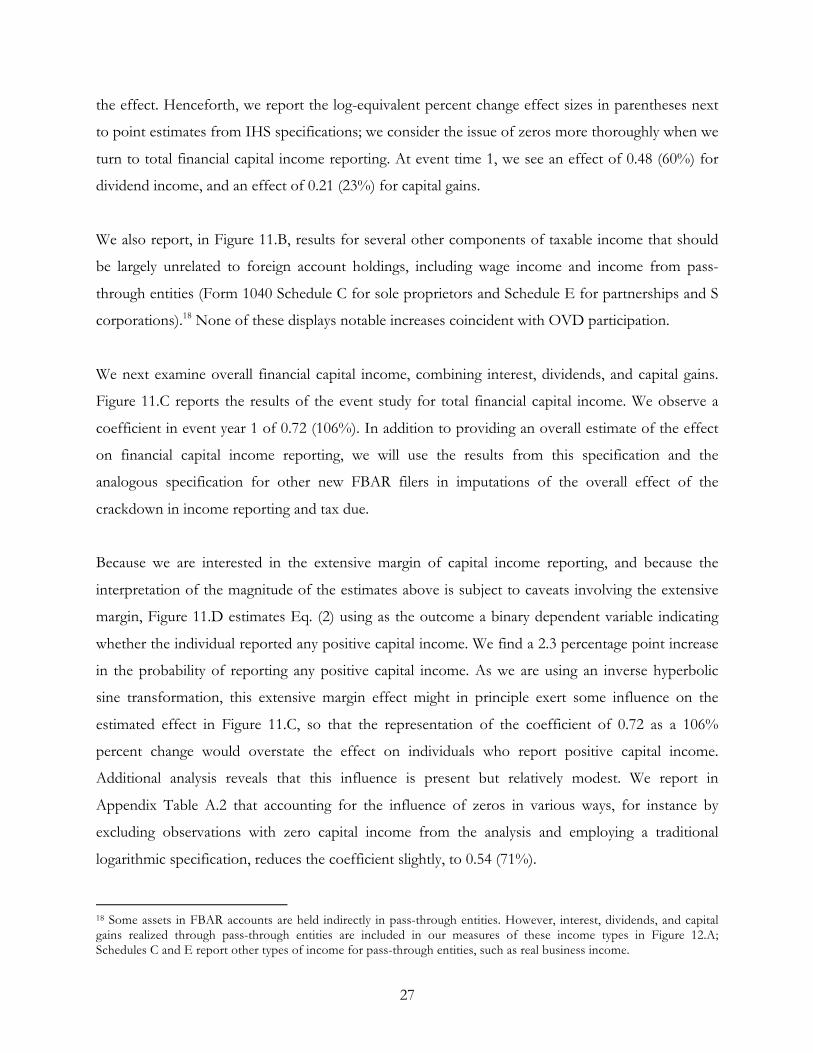
The estimated coefficients, βM, on the event-time dummies from the OVD version of Eq. (2) for
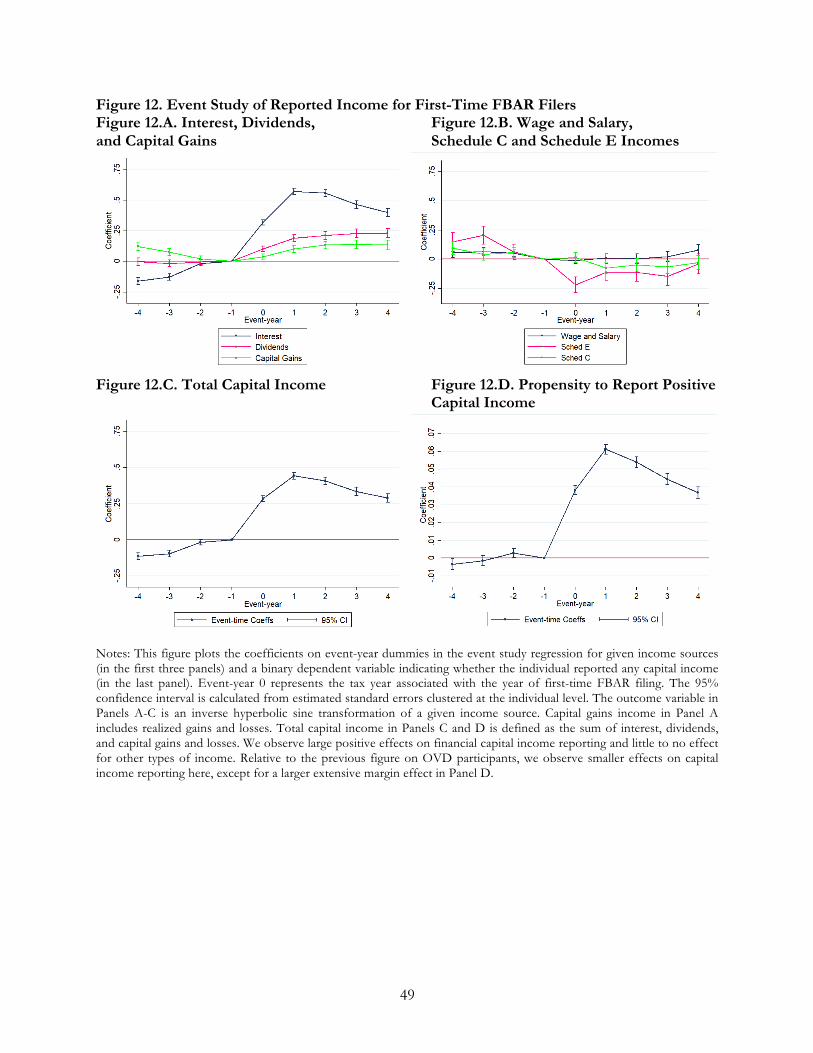
various income sources are listed in Appendix Table A.1. Figure 11 plots these coefficients, along
with the corresponding 95 percent confidence intervals. The first panel shows results for reported
interest income. We see that there is essentially no difference in the trend of reported and expected
reported income prior to the time of OVD participation, followed by a large increase in reported
interest income at the time of participation. For individuals reporting positive amounts of interest
income, the change in the IHS transform will approximately equal the change in the log of reported
interest in the year of participation and log reported income in that year had they not participated, so
that the coefficient can be interpreted like one would interpret a coefficient with a logarithmic
outcome. We observe a coefficient of 0.17 for event time 0 and 1.02 for event time 1. To interpret
the magnitude of these coefficients, we note that with a logarithmic specification, a coefficient of
1.02 correspond to approximately a 178% increase in interest income reporting. With the IHS
transformation, some of this effect may be due to changes in reporting from zero to a positive
amount; the effect cannot be calculated in percentage terms for such individuals. Nevertheless,
comparing to the log-equivalent percent change provides a useful sense of the overall magnitude of
27
the effect. Henceforth, we report the log-equivalent percent change effect sizes in parentheses next
to point estimates from IHS specifications; we consider the issue of zeros more thoroughly when we
turn to total financial capital income reporting. At event time 1, we see an effect of 0.48 (60%) for
dividend income, and an effect of 0.21 (23%) for capital gains.
We also report, in Figure 11.B, results for several other components of taxable income that should
be largely unrelated to foreign account holdings, including wage income and income from pass-
through entities (Form 1040 Schedule C for sole proprietors and Schedule E for partnerships and S
corporations).18 None of these displays notable increases coincident with OVD participation.
We next examine overall financial capital income, combining interest, dividends, and capital gains.
Figure 11.C reports the results of the event study for total financial capital income. We observe a
coefficient in event year 1 of 0.72 (106%). In addition to providing an overall estimate of the effect
on financial capital income reporting, we will use the results from this specification and the
analogous specification for other new FBAR filers in imputations of the overall effect of the
crackdown in income reporting and tax due.
Because we are interested in the extensive margin of capital income reporting, and because the
interpretation of the magnitude of the estimates above is subject to caveats involving the extensive
margin, Figure 11.D estimates Eq. (2) using as the outcome a binary dependent variable indicating
whether the individual reported any positive capital income. We find a 2.3 percentage point increase
in the probability of reporting any positive capital income. As we are using an inverse hyperbolic
sine transformation, this extensive margin effect might in principle exert some influence on the
estimated effect in Figure 11.C, so that the representation of the coefficient of 0.72 as a 106%
percent change would overstate the effect on individuals who report positive capital income.
Additional analysis reveals that this influence is present but relatively modest. We report in
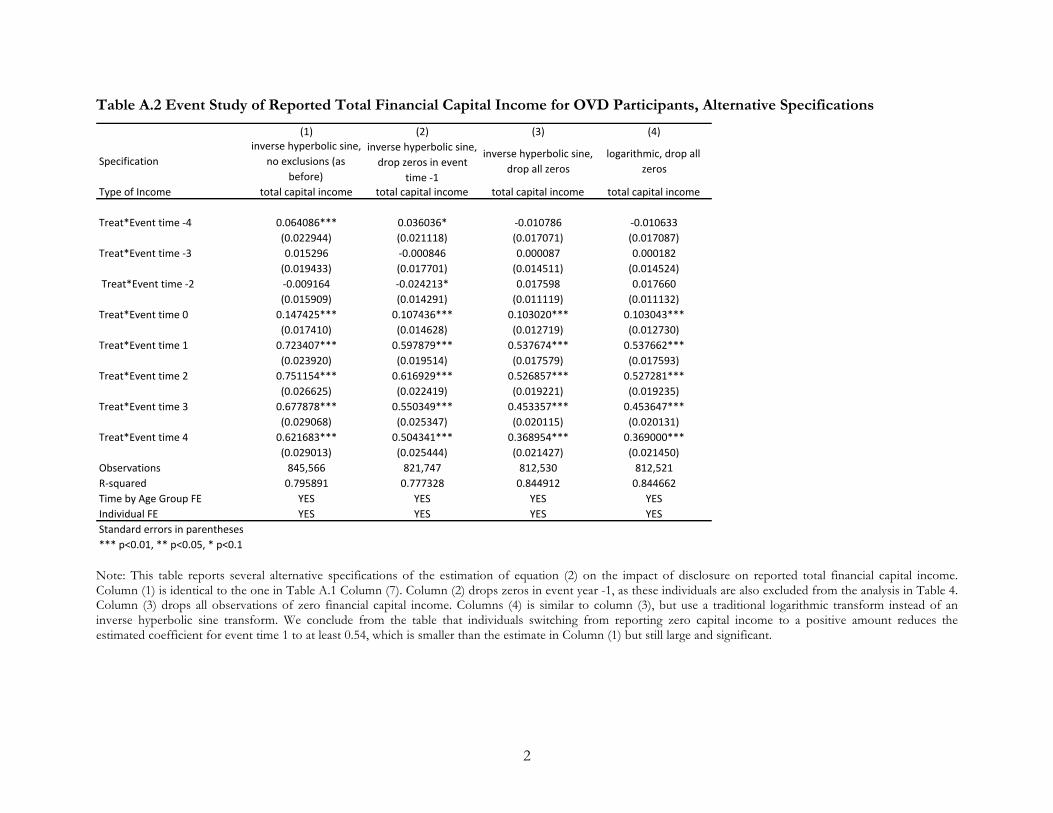
Appendix Table A.2 that accounting for the influence of zeros in various ways, for instance by
excluding observations with zero capital income from the analysis and employing a traditional
logarithmic specification, reduces the coefficient slightly, to 0.54 (71%).
18 Some assets in FBAR accounts are held indirectly in pass-through entities. However, interest, dividends, and capital gains realized through pass-through entities are included in our measures of these income types in Figure 12.A; Schedules C and E report other types of income for pass-through entities, such as real business income.
28
The patterns indicate, as expected, that disclosures through OVD were associated with large
increases in financial capital income reporting. Given that the method works as expected, the results
also give some intuition for what we should observe when focusing on first-time filers. Prior to
participating in the voluntary disclosure program, non-compliant taxpayers underreport capital
income by not reporting capital income from foreign accounts located in countries that do not have
any automatic information reporting. Upon participation in the voluntary disclosure program, the
individual begins to report all, or more of, their true capital income, which is substantially higher
than what they had been reporting previously (about double what they had been reporting on
average if we aggregate across all three capital income sources). The delayed response, occurring in
event year 1 rather than event year 0 is due to delays in processing time: most people participating in
the 2009 OVD entered the program in late 2009, after many had filed their tax return, and their
cases were not processed until sometime in 2010. After the voluntary disclosure, the OVD
participant continues to report the capital income from the sources previously unreported, and
therefore continues to report substantially higher capital income, whether from continued foreign
holdings or from repatriated U.S. accounts. 6.2 Reported income response of other 2009 first-time FBAR filers
Having established that this research design can provide evidence of increases in reported capital
income for OVD participants, whom have admitted noncompliance, we now turn to the group of
individuals we suspect contains a large number of previously non-compliant individuals:19 first-time
FBAR filers with U.S. addresses who did not participate in OVD, a group we henceforth call “first-
time FBAR filers” for brevity. We therefore compare the qualitative and quantitative patterns
observed in Figure 12 with the patterns around first-time FBAR filing constructed in exactly the
same way as in the previous subsection.
For our event study of various types of income for first-time FBAR filers, Table A.3 shows the
estimated coefficients, 89, for 2009 first-time filers, and Figure 12 plots the coefficients and 95%
confidence intervals. In most respects, the patterns are very similar to those observed for OVD
19 Non-compliance may come from explicit evasion of from not reporting taxable income due to lack of knowledge of reporting responsibilities.
29
participants, with large increases in reported capital income at the time of first-time FBAR filing and
virtually no changes in other types of income.
The magnitudes of the estimated percentage change for capital income components are slightly
smaller compared to the OVD group, but perhaps surprisingly similar given that the increases seen
for voluntary disclosure program participants consist entirely of admitted non-compliers, and the
group of first-time filers likely contains some people who were previously compliant. The estimated
coefficient in event year 1 is 0.79 (120%) for interest income, 0.43 (50%) for dividend income and
0.28 (32%) for capital gains income. These are all at least 60% of the estimated increase for
voluntary disclosure program participants. We also find little to no estimated change in wages and
salary income or income of pass-through entities, with the exception of a relatively small decline in
Schedule E income.20 We estimate a coefficient in event year 1 of 0.44 (55%) for total financial
capital income. A larger amount of the response in total financial capital income in this group comes
from the extensive margin: we estimate a 6.1 percentage point increase in the probability of
reporting any positive financial capital income.
With respect to the validity of the research design we observe that, unlike with the OVD cohorts,
the difference in reported income is not precisely zero in the pre-period, prior to first-time filing, for
all income sources. This is perhaps unsurprising, given that some portion of first-time FBAR filers
will be legitimately opening new accounts. In this case, we might expect that the timing of the first
filing contains information about the income path even prior to filing. Nevertheless, we see a large,
sharp jump in capital income at the time of first-time filing, which is a clear break from trend for
each of sources of capital income. The size of this jump suggests that the magnitude of the bias
from slightly divergent pre-trends between the treatment and control groups is likely small.
6.3 Additional Evidence from 1099’s and Amended Returns
We next provide further evidence that the increases in reported income accompanying account
disclosures did indeed result from disclosures of foreign accounts and not some confounding
source.
20As the pre-disclosure period estimates for Schedule E income are slightly positive and significant, this estimated negative effect in the post-disclosure period could easily be spurious.
30
First, we show that the increases in reported interest and dividend income described in Figures 11
and 12 likely came from income in foreign accounts. We do this by analyzing interest income
reported by domestic financial institutions on Forms 1099-INT and 1099-DIV. For both interest
and dividends, we calculate the total 1099 income as the sum of the 1099 income received by the
taxpayer (including that of the taxpayer’s spouse for married taxpayers filing jointly), and we impute
reported income from foreign sources as the difference between reported total income and income
reported on 1099 forms.21,22 We then estimate our event study specification on each type of income
separately. We do not analyze capital gains here, as directly held capital gains and losses in domestic
accounts were not subject to complete information reporting until 2011 (and even then only for
assets acquired after January 1, 2011).
Figure 13 depicts the results (for point estimates, see Table A.4 and A.5). In Figures 13.A and 13.C,
we observe that the estimated effect on overall reported interest is disproportionately driven by
income not appearing on 1099-INT information reports, and thus arguably from foreign accounts.
We do observe a slight increase in 1099-INT income, especially in the year after first-time FBAR
filing in 13.C. One potential explanation for this increase is repatriation of assets in previously
evasive accounts, which would cause an increase in interest income from U.S. accounts. Figure 13.B
repeats this exercise for dividend income. Here, the differences between 1099 income and non-1099
income are slightly less substantial than for interest income, but are nevertheless present and
significant. A delayed effect on the 1099-reported income, suggestive of repatriation, is even more
evident in the analysis of dividend income, which derives partly from the less divergent pre-period
trends in dividend income.
In our conceptual framework (see Figure 1), we mentioned that individuals disclosing quietly may
also file amended tax returns for prior years, in order to correct prior non-compliance with income
reporting obligations. Up to this point, we have studied income reporting using the income initially
reported on tax returns in the year that they are filed. We next examine the extent to which
21 There is third-party reporting for assets held in (domestic or foreign) pass-through entities on various Schedule K-1’s. As pass-through entities can be closely held and/or located offshore, it is unclear if this type of third-party reporting might be influenced by enforcement. However, adding income on K-1’s to 1099 income for our concept of third-party reported income has no qualitative effect on the results. 22 The minimum reporting requirement for forms 1099-INT and 1099-DIV is $10. A taxpayer with less than $10 in interest or dividend income, even from a domestic source, will not receive one of these forms. If the taxpayer reports these amounts on their Form 1040, we will misclassify this income as imputed foreign income. These minimums are so small it is highly unlikely that this qualitatively affects our results.
31
individuals utilized amended filings of previously filed Form 1040s to report income that should
have been reported, without participating in a voluntary disclosure program or paying required
penalties. Studying amended returns provides additional evidence about a margin of response some
quiet disclosers may consider, and it also provides strong evidence that there is indeed a quiet
disclosure response, as there is no other reason we should expect a spike in amended returns upon
first-time filing of an FBAR.
To investigate this channel, we use a model similar to Eq. (2), but with an indicator for filing an
amended Form 1040 for one of the last four years in year t as the outcome variable. This is a linear
probability model, so the coefficients on the event-time dummies can be interpreted as the
percentage point increase in the probability of filing an amended Form 1040 relative to the expected
probability had the event not happened. If people were underreporting prior to first-time filing, and
begin to quietly disclose unreported income at the time of first-time filing, we would expect to see
an increase in the probability of filing an amended return at the time of filing the FBAR.
Figure 14 depicts the results for this event study of first-time FBAR filers nor participating in OVD;
Table A.6 in the Appendix provides the point estimates. The observed pattern of amended return
filing is quite clear. There is essentially no differential pre-trend, and a substantial increase in the
probability of filing an amended return at the time of filing the first FBAR. At the time of filing,
first-time filers are 2.9 percentage points more likely to submit an amended 1040 than expected had
they not begun filing an FBAR. This represents a doubling of the probability of filing an amended
1040, as the mean of the outcome variable in the reference period (t-1) is 3 percent. This result
therefore suggests that almost 50% of individuals filing amended 1040’s at the same time they file an
FBAR for the first time are quiet disclosers.
This finding also suggests that the majority of previously non-compliant taxpayers appear to not file
amended returns when they begin reporting their foreign accounts. Our earlier results imply that a
substantial portion of first-time filers were likely underreporting their capital income from foreign
accounts. That we only observe (only) a 2.9 percentage point increase in the probability of amending
income reports at the time of filing indicates that a large portion of new compliers are not amending
prior returns. Thus, when considering the costs and benefits of enforcement policies such as those
discussed in this paper, it is important to consider the evidently large “compliance” effect of those
32
who disclose an account quietly but without amending prior returns (and remitting back taxes), a
channel that was not well understood previously.
6.4 The total effect of enforcement
In the previous section, we provided evidence that account disclosures both within and outside the
OVD program were associated with increased tax compliance, via an increase in reported capital
income. In this section, we use the event study results to derive estimates for the implied effect on
total reported capital income and tax revenues for both OVD participants and quiet disclosers.23 For
reasons discussed below, we use two related methods of estimating the total effects and ultimately
present a range of estimates for the effect of the enforcement initiatives on capital income reporting
and revenue collections.24
6.4.1 Direct method
We begin by presenting what we will call the “direct method” of estimating the total effect of the
enforcement initiatives. This method uses the average treatment effects from the event study results
presented in Section 6 to estimate the change in total reported capital income for OVD participants
and first-time filers. Specifically, we assume a uniform treatment effect in IHS terms to develop a
counterfactual of total reported capital income in year t+1 for each individual in the treatment
group. The difference between the actual total reported income in year t+1 and the counterfactual
total income provides an estimate of the total change in reported income in year t+1 attributable to
the enforcement initiatives. The counterfactual of total reported income is calculated as:
NOP = 3=Q(3(45) − 8R),5
where NOP is the total counterfactual reported income, 3() is the inverse hyperbolic sine
transformation, 45 is reported income of individuals in the treatment group in year t+1, and 8R is
23Our measure of the total effect on tax revenue does not account for some ways in which taxpayers might change reporting elsewhere on their tax return in order to reduce the impact of reporting additional income on their tax liability, as in Slemrod et al (2017). Our earlier results suggest some forms of offsetting, such as reduced reporting of business income, are uncommon (see Figures 11.B and 12.B). Another intuitive form of offsetting, the realization of capital losses to avoid a large increase in tax liability, is implicitly accounted for by our estimates, as we always use net capital gains and losses. We believe that most remaining forms of offsetting should be second-order. However, if taxpayers realize capital losses or avoid realizing capital gains in order to avoid a large increase in capital gains and/or tax liability, then the long-run effect of enforcement on capital income and tax revenue may be larger than the effect we estimate here. 24 Our revenue estimates only account for federal income taxes and not for the additional income taxes imposed in some U.S. states.
33
the t+1 estimated coefficient from the event study for income source 4. To facilitate the
examination of tax revenues, we do this analysis separately for interest, dividends, and capital gains;
the results are similar if we instead apply this method to total financial capital income.
The results of this method are summarized in Table 3. The first column of Table 3 shows the
relevant event study coefficient and the second column provides the resulting estimate of the change
in total reported income attributable to the enforcement initiatives, separately for each type of
financial capital income and then summing over these.25 For OVD participants, the estimated
change in total reported capital income is almost $600 million and for first-time filers the estimate is
about $3.3 billion.
The third and fourth columns of Table 3 use the estimated change in total reported capital income
to establish implied revenue effects. We assign individuals the top marginal tax rate for each type of
capital income applicable in 2009. For simplicity, we assume that non-qualified dividends and short-
term capital gains are negligible, so that all dividends and capital gains are taxed at a marginal tax rate
of 15 percent. Our calculation suggests that OVD participants incurred $158 million more in taxes
as a result of disclosing previously hidden financial accounts, while other first-time FBAR filers
owed $911 million more. Note that these tax liabilities are calculated for a single year following
disclosures of an offshore accounts. In the event that a taxpayer amended prior income tax returns
when disclosing an account (which is required when participating in OVD), additional tax would
have been due. These figures also do not include any penalties, including the substantial offshore
penalty incurred by OVD participants, which are paid by the taxpayer as a result of disclosure. The
total effect we estimate is thus the annual forward-looking effect from voluntary tax compliance, and
it includes none of the penalty components of the payments made during participation in the OVD
program.
25That interest income is the largest component of the increases in reported income we document may be surprising given other data suggesting that most offshore wealth in tax havens is held in equities (see e.g. Zucman 2014). This finding could be driven by differences in the composition of the individuals we study relative to everyone holding offshore wealth. It could also be driven by endogenous capital gains realizations: if taxpayers avoid realizing capital gains in newly disclosed accounts, or if they realize losses to offset gains, then the share of newly reported income coming from dividends and capital gains will be lower than the share of overall assets invested in equities. A third possibility is that individuals converted equities to cash deposits before disclosing their accounts.
34
6.4.2 Indirect method
While the direct method provides a straightforward way of estimating the total effects of
enforcement using the event study results, there is good reason to suspect that it might overestimate
the total effect. Here we discuss this issue and implement an alternative, indirect approach, which
estimates the total effect by first estimating the rate of return implied by the event study estimates
and applying this to the value of disclosed wealth, rather than directly estimating the total effect
from the event study estimates.
To see why the total effect might be biased, we first model the causal effect of the disclosure of an
account on reported financial capital income for individual S as
T45 = U5D5V5, (3)
where T45 is the change in reported income (in dollars), U5 is an indicator for whether the individual
was non-compliant on the income in their foreign account prior to reporting it, D5 is the rate of
return in the account (including realized capital gains), and V5 is the value of the newly disclosed
account. Dividing the above by some baseline (non-zero) value of 45 yields WRXRX= U5D5
YXRX
. (4)
Eq. (4) says that the effect of a disclosure on reported income in percentage terms is proportional to
the ratio of the account value to baseline capital income. In Figure A.1, we show that this ratio tends
to be decreasing in 45 when we use total financial capital income in year t-1 as the baseline value 45:
newly disclosed accounts tend to be smaller relative to prior capital income when prior capital
income is larger.26 This fact implies that the direct approach presumes an effect that is too large at
the top of the income distribution and too small at the bottom of the income distribution. Because
the capital income distribution has a famously thick top tail (Piketty, 2013), using an approach that
overestimates the effect at the top likely leads to an over-estimate of the total effect, despite an
offsetting under-estimation of the effect at the bottom of the distribution.
We next develop an approach that attempts to address this bias by using as a primitive the average
treatment effect, without assuming that the treatment effect is uniform across individuals. We do so
26 This is probably unsurprising, but it is not entirely mechanical. The ratio V5/45 will obviously be smaller when 45 is larger holding V5 fixed, but it could be the case that higher-income individuals tended to disclose accounts of much higher value, so that the relationship between 45and V5 would cause the ratio V5/45 to increase with income.
35
by inferring information about the compliance-adjusted rate of return, U5D5 , and using it in
combination with the newly disclosed account values V5 , which we can observe directly.27 The key
assumption for this approach is that the compliance-adjusted rate of return U5D5 does not
systematically vary by the ratio V5/45 (i.e., that these two random variables have zero covariance).
Taking expectations of equation (4) and applying this assumption, we have
\[U5D5] =_[WRX/RX]
_[YX/RX]. (5)
The expression in the numerator of the right-hand side of Eq. 5 is the average percent change in
reported capital income, which we can estimate based on our event study regressions. To estimate
the denominator, we use the capital income in the year before disclosure, event year -1, as the
baseline income.28 By dividing the percent change in financial capital income accompanying
disclosure by a measure of the account value relative to capital income, we obtain an estimate of
\ U5D5 , separately for OVD participants and first-time filers. We will use Eq. (5) to see whether our
event-study-based percent changes imply sensible values for \ U5D5 given typical rates of return in
financial accounts and, if they do, we can use the value of \ U5D5 to compute the implied total
effect of disclosures on reported income via Eq. (3). Rather than assuming a uniform treatment
effect and directly calculating the total effect, we can therefore estimate the total effect indirectly, by
calculating what our event study implies about the compliance-adjusted rate of return, and applying
this to the value of accounts disclosed. The most important potential source of bias in this approach
is that individuals with high-income or high-account values may earn relatively high rates of return
(Piketty, 2013), or they may be more or less likely to be non-compliant before disclosure (i.e., \[U5]
may be higher or lower). If individuals with larger accounts earn a larger rate of return, for example,
the indirect approach will tend to underestimate the total effect.
The results of this method are summarized in Table 4. The first column reports the coefficient from
the event study for event year 1, as in Table 3. The second column calculates a percent change,
\[T45/45] from this coefficient, using the fact that the IHS transformation behaves similarly to the
27Note that V5 is directly observable for all newly filed FBARs, but it is not directly observable for the subset of accounts we are interested in, those with prior non-compliance that were disclosed because of enforcement. The variable U5 accounts for the difference bettween the two, as U5 = 1 when accounts were formerly non-compliant and disclosed because of enforcement, and otherwise U5 = 0.28 For the purpose of calculating statistics for the ratio V5/45, we exclude observations with zero or negative capital income in event year -1. Due to the extreme skew of the distribution of V5/45from observations with a very small denominator 45, we also trim the distribution of V5/45at its 95th percentile.
36
log transformation for positive values of 45 . The third column reports the mean of the ratio
\[V5/45], using income in year -1 as the baseline in the denominator. The implied effective average
rate of return, \[U5D5], obtained by dividing the second column by the third, is reported in the
fourth column. We then report the total assets reported on FBARs, V5 , for OVD participants and
other first-time filers. The final column of the table reports estimates of the total change in reported
capital income, column 4 multiplied by column 5, which stand at $438 million for OVD participants
and $2.1 billion for first-time filers. Compared to the direct method, this method results in smaller
estimates for the change in total reported income induced by the enforcement initiatives, which is
consistent with the intuition discussed above that the direct approach might over-estimate the total
effect.
Although our focus here is on the total effect, it is worth emphasizing that our results are consistent
with sensible rates of return. Table 5 summarizes what both the direct and indirect method imply for
rates of prior compliance and rates of return. The first two columns report the level of assets and
the total effect. The third column considers the compliance-adjusted rate of return, \ U5D5 . For the
direct method, we obtain this by dividing the total effect on capital income by the total value of
accounts disclosed; for the indirect method, it is calculated via Eq. (5). The compliance-adjusted
rates of return we estimate, in the range of 1 to 3 percent, are reassuringly reasonable, which bolsters
our claims that the effects estimated in Section 6.2 really do result from disclosure of a foreign
account and not some confounding variation. Note that there is no mechanical reason that
guarantees that our estimates \ U5D5 would not be much larger or smaller.
We next consider what these results might imply for rates of return and rates of prior compliance
separately. Note that, by the law of iterated expectations, \ U5D5 = / U5 = 1 \[D5|U5 = 1]. In
words, the right-hand side of equation (5) should equal the fraction of disclosers who were
previously non-compliant multiplied by the mean rate of return among the previously non-
compliant disclosers. For the last two columns of Table 5, we separately estimate \[D5|U5 = 1] and
/ U5 = 1 under the assumptions that 1) all OVD participants were non-compliant, and 2) the rate
of return for OVD participants is equal to that for first-time filers. The results imply rates of return
around 2 to 3 percent, with about 60 percent of 2009 first-time FBAR filers being previously non-
compliant. The rates of return are slightly lower than one might expect for offshore investments, but
37
this is consistent with much of the effect coming from interest income (see Figures 11.A and 12.A),
and with anecdotal evidence that concealed offshore wealth tends to be conservatively invested. The
estimate that about 60 percent of the first-time FBAR filers were previously non-compliant is
consistent with the numbers of the overall increase in accounts disclosed (see Section Figure 3).29
Finally, Table 6 summarizes the results for each method, including the range of implied revenue
effects. Our results suggest that enforcement increased the total reported annual capital income by
between $438 million and $597 million for OVD participants, and by between $2,095 million and
$3,275 million for first-time filers outside of the OVD. These estimates imply a range of total annual
tax revenue effects of $116 million to $158 million for OVD participants and between $583 million
and $911 million for first-time filers.
In total, we estimate that enforcement efforts led to increased reporting of capital income through
these two channels of roughly $2.5 to $3.8 billion annually, and an increase in tax revenues of
roughly $0.7 billion to $1 billion dollars annually. These numbers are sizable, but are small relative to
independent estimates of the amount of concealed offshore wealth and capital income overall
(Zucman, 2013; Alstadsæter, Johannesen and Zucman, 2017b). This finding suggests that, while the
2008-2009 enforcement had a meaningful impact on tax evasion, significant non-compliance
remained after the enforcement initiatives studied in this paper were implemented.
7. Conclusion
In recent years, many countries have been cracking down on tax evasion achieved through the use
of concealed foreign accounts, through enhanced cross-country information exchange and taxpayer
reporting requirements as well as increased resources devoted to enforcement and larger penalties
for detected evasion, sometimes combined with voluntary disclosure programs. These programs are
costly, and for the most part both their effectiveness in reducing evasion and other consequences
have been largely unknown. This paper offers the first comprehensive analysis of the consequences
of one set of foreign account tax compliance initiatives—U.S. policies beginning in 2008 to acquire
29The 60 percent estimate is perhaps on the high end of what is plausible given the earlier evidence, but it may be slightly over-estimated if one of the two assumptions we make is inaccurate, i.e. if some OVD participants were actually previously tax-compliant, or if OVD participants earn a slightly lower rate of return on average than first-time FBAR filers.
38
information about U.S. account holders in certain foreign financial institutions, increased reporting
requirements, and a series of voluntary disclosure programs.
Using administrative data from taxpayer reports of foreign bank accounts, tax returns, and voluntary
disclosure participation, we find that these foreign enforcement initiatives increased the number of
individuals reporting foreign accounts to the IRS by around 60,000 taxpayers, and increased the total
amount of wealth disclosed by about $120 billion. The majority of this response occurred outside of
the Offshore Voluntary Disclosure programs. Even outside the OVD programs, newly disclosed
accounts were disproportionately concentrated in tax havens; for example, the number of U.S.
taxpayers residing in the United States reporting accounts in the Cayman Islands increased by almost
1,000%. This and other patterns of response suggests that the increase in foreign account reporting
at least partly reflected an increase in tax compliance.
The reporting of new foreign accounts coincided with substantial increases in interest, dividends,
and capital gains reported on tax returns, even for those who never participated in a voluntary
disclosure program. We also document a sharp increase in amended Form 1040 (individual income
tax) filings for years prior to the first foreign account report filed for individuals not participating in
a voluntary disclosure program. Both of these results suggest that a number of individuals made
quiet disclosures to avoid the significant penalties that would be otherwise be due under the
voluntary disclosure program. While we present compelling evidence of the use of quiet disclosures,
we find that the majority of first-time filers do not amend their income reports. Therefore, the large
observed increases in reported capital income among first-time filers imply that quiet disclosures not
accompanied by amended tax returns are likely a primary channel for non-compliers to start
disclosing offshore wealth and reporting the associated income. In total, we estimate that
enforcement efforts led individuals to report $2.5 to $3.8 billion annually in total financial capital
income, which corresponds to an increase in tax revenues of $700 million to $1 billion dollars
annually.
On the whole, these results imply that the increase in tax compliance induced by this set of policy
initiatives was significantly larger than suggested by official statistics based solely on backward-
looking information about tax and penalty payments made under the voluntary disclosure programs
(e.g. IRS, 2014). At the same time, available estimates suggest that the still-unreported component of
39
offshore wealth and capital income remained large after the enforcement initiatives studied in this
paper were implemented. Further research should examine the subsequent, more comprehensive
enforcement efforts undertaken by the U.S. and other countries, and also take into account the
compliance costs of these enforcement policies.
References
Alstadsæter, A., Niels Johannesen and Gabriel Zucman. 2017a. “Tax Evasion and Inequality”. NBER Working Paper 23772.
Alstadsæter, A., Niels Johannesen and Gabriel Zucman. 2017b. “Who Owns the Wealth in Tax Havens? Macro Evidence and Implications for Global Inequality”. NBER Working Paper 23805.
Brown, Stephan Michael. 2014. “One-Size-Fits-Small: A Look at the History of the FBAR Requirement, the Offshore Voluntary Disclosure Programs, and Suggestions for Increased Participation and Future Compliance.” Chapman Law Review, 18: 243.
DOJ. 2008. “Federal Judge Approves IRS Summons for UBS Swiss Bank Account Record.” Press release, retrieved from https://www.justice.gov/archive/tax/txdv08584.htm
DOJ. 2009. "UBS Enters into Deferred Prosecution Agreement.” Press release, retrieved from https://www.justice.gov/opa/pr/ubs-enters-deferred-prosecution-agreement
DOJ. 2009b. “Remarks by IRS Commissioner Doug Shulman on UBS.” Press release, retrieved from https://www.justice.gov/tax/pr/remarks-irs-commissioner-doug-shulman-ubs
GAO. 2013. “Offshore Tax Evasion: IRS Has Collected Billions of Dollars, But May be Missing Continued Evasion.” Report No. GAO-13-318.
Hanlon, Michelle, Edward Maydew and Jacob Thornock, 2015. Taking the Long Way Home: U.S. Tax Evasion and Offshore Investments in U.S. Equity and Debt Markets. Journal of Finance 70(1), pp. 257-287.
IRS. 2009. “Voluntary Disclosure: Questions and Answers.” Press release, retrieved from https://www.irs.gov/newsroom/voluntary-disclosure-questions-and-answers
IRS. 2011. “Second Special Voluntary Disclosure Initiative Opens; Those Hiding Assets Offshore Face Aug. 31 deadline.” Press release, retrieved from https://www.irs.gov/uac/second-special-voluntary-disclosure-initiative-opens-those-hiding-assets-offshore-face-aug-31-deadline
IRS. 2012. “IRS Offshore Program Produce $4.4 Billion to Date for Nation’s Taxpayers; Offshore Voluntary Disclosure Program Reopens.” Press release, retrieved from https://www.irs.gov/uac/irs-offshore-programs-produce-4-4-billion-to-date-for-nation-s-taxpayers-offshore-voluntary-disclosure-program-reopens
IRS. 2014. “IRS Offshore Voluntary Disclosure Efforts Produce $6.5 Billion; 45,000 Taxpayers Participate.” Press release, retrieved from https://www.irs.gov/newsroom/irs-offshore-voluntary-disclosure-efforts-produce-65-billion-45000-taxpayers-participate
40
Jacobs, Deborah L. 2012. “Most Foreign Banks Don't Want U.S. Clients; How To Find One That Does.” Forbes, July 31 https://www.forbes.com/sites/deborahljacobs/2012/07/31/most-foreign-banks-dont-want-u-s-clients-how-to-find-one-that-does/#7fbb0e17704f
Johannesen, Niels. 2014. “Tax Evasion and Swiss Bank Deposits.” Journal of Public Economics, 111: pp. 46-62.
Johannesen, Niels and Gabriel Zucman. 2014. “The End of Bank Secrecy? An Evaluation of the G20 Tax Haven Crackdown." American Economic Journal: Economic Policy 6.1: pp. 65-91.
Jolly, David and Brian Knowlton. 2011. “Law to Find Tax Evaders Denounced.” New York Times, December 26.
Imbens, Guido and Joshua Angrist. 2004. “Identification and Estimation of Local Average Treatment Effects.” Econometrica, 62.2: pp. 467-475.
Kawano, Laura, Caroline Weber, and Andrew Whitten. 2016. “Estimating the Elasticity of Broad Income for High-Income Taxpayers.” Working paper.
Langenmayr, Dominika. 2015. “Voluntary Disclosure of Evaded Taxes – Increasing Revenue, or Increasing Incentives to Evade?” Journal of Public Economics 151: pp. 110-125.
Lederman, Leandra. 2012. “The Use of Voluntary Disclosure Initiatives in the Battle Against Offshore Tax Evasion.” Villanova Law Review 57.
Omartian, Jim. 2016. “Tax Information Exchange and Offshore Entities: Evidence from the Panama Papers”. Working Paper.
Piketty, Thomas. 2013. Capital in the Twenty-First Century. Sheppard, Hale E. 2006. “Evolution of the FBAR: Where We Were, Where We Are, and Why It
Matters.” Houston Business and Tax Journal 7.1: pp. 1-41. Sheppard, Lee. 2009. “Don’t Ask, Don’t Tell, Part 4: Ineffectual Information Sharing”. Tax Notes. Slemrod, Joel, Brett Collins, Jeffrey Hoopes, Daniel Reck, and Michael Sebastiani. 2017. “Does
Credit-Card Information Reporting Improve Small-Business Tax Compliance.” Journal of Public Economics 149: pp. 1-19.
Slemrod, Joel and Caroline Weber. 2012. "Evidence of the Invisible: Toward a Credibility Revolution in the Empirical Analysis of Tax Evasion and the Informal Economy." International Tax and Public Finance 19.1: pp. 25-53.
Zucman, Gabriel. 2013. “The Missing Wealth of Nations: Are Europe and the U.S. Net Debtors or Net Creditors?” The Quarterly Journal of Economics 128.3: pp. 1321-1364.
Zucman, Gabriel. 2014. "Taxing Across Borders: Tracking Personal Wealth and Corporate Profits." Journal of Economic Perspectives 28.4: pp. 121-148.
41
Figure 1. Decision-Making over Tax Compliance with Foreign Assets and the 2008-2009 Enforcement Initiatives
Notes: This figure illustrates the decisions faced by individuals with foreign accounts in following 2008-2009 enforcement efforts. The first column divides individuals into three groups based on their compliance with FBAR filing and/or tax obligations. The second column examines the potential responses of each group. The third column examines the additional decision by a previously non-compliant individual who opts to come into compliance over how to do so. Figure 2: FBAR filers and OVD participants
Notes: This figure illustrates the number of individuals filing FBARs and participating in OVD over time. We observe a gradually increasing trend in the number of FBAR filers prior to 2008, and a sharp increase in 2008. The increase in 2009 is much larger than the number of OVD participants.
Full compliance• Pays taxes• Files FBAR
Tax compliance• Pays taxes• No FBAR
Non-compliance• Pays no taxes• No FBAR
No change
No change
File FBAR
File FBARPay taxes
No FBARPay taxes
No change (relocate wealth?)
Enter OVDP
Treatment
Repatriation?• Amend returns• No OVDP
• No amended returns• No OVDP
“Quiet disclosures”:
42
Figure 3: New disclosers of foreign accounts Figure 3.A. Number of disclosers
Figure 3.B: Value of accounts disclosed by new disclosers
Notes: This figure plots aggregates on new disclosers of foreign accounts (those not filing FBAR in previous years, see text for details) by year. The first panel reports the number of individuals, the second the total disclosed account value. We observe a sharp increase in 2009, only a small portion of which is accounted for by OVD participants.
43
Figure 4: First-time FBAR filers, U.S. vs non-U.S. addresses
Levels Normalized by 2008 Level
Notes: This figure plots aggregates on new disclosers of foreign accounts (those not filing FBAR in previous years, see text for details), by year and whether the filer reported a U.S. address. OVD participants and non-US address filers are excluded from the tabulations. The left panel reports the number of individuals, the right normalizes this number by dividing by the 2008 level. We observe that the sharp increase in FBARs in 2009 in the previous figure was almost completely driven by individuals with U.S. addresses.
Figure 5: First-time FBAR filers, haven vs non-haven accounts, 2005-2011
Levels Normalized by 2008 Level
Notes: This figure plots aggregates on new disclosers of foreign accounts (those not filing FBAR in previous years, see text for details), by year and whether the account was located in a tax haven. OVD participants and non-US address filers are excluded from the tabulations. We define tax havens using the OECD (2000) list of uncooperative tax havens plus Switzerland, Singapore, Hong Kong and Luxembourg (see also the next figure). The left panel reports the number of individuals, the right normalizes this number by dividing by the 2008 level. The overall number of accounts in havens is smaller than the number of accounts in non-havens, but we observe that the sharp increase in FBARs in 2009 in the previous figure was almost disproportionately driven by disclosures of accounts in tax havens.
44
Figure 6: Change in first-time FBAR filings 2008-2009, by country
Change in the Number of Filers Disclosing an Account in Each Country
Percent Changes in the Number of Filers Relative to 2008
Notes: This figure plots the change in the number of new disclosers of foreign accounts (those not filing FBAR in previous years, see text for details), from 2008 to 2009 by the country in which new filers reported accounts. OVD participants and non-US address filers are excluded from the tabulations (see also Figure 10B). Tax havens are shown with red bars; we define tax havens using the OECD (2000) list of uncooperative tax havens plus Switzerland, Singapore, Hong Kong and Luxembourg. The top panel reports the number of accounts, the right converts this number to a percent change by dividing by the 2008 level. We observe that the sharp increase in FBARs in 2009 in the previous figure was almost disproportionately driven by disclosures of accounts in tax havens, especially the Cayman Islands and Switzerland.
45
Figure 7: First-time FBAR filers, amended vs. non-amended, 2005-2011
Levels Normalized by 2008 Level
Notes: This figure plots aggregates on new disclosers of foreign accounts (those not filing FBAR in previous years, see text for details), by year and whether the new filer also filed late/amended FBARs for prior years. OVD participants and non-US address filers are excluded from the tabulations. The left panel reports the number of individuals, the right normalizes this number by dividing by the 2008 level. The overall number of late/amended FBARs is small, but we observe an enormous increase in late/amended FBARs in relative terms in 2009.
Figure 8: First-time FBAR filers, by account value (only U.S. addresses), 2005-2011
Levels Normalized by 2008 Level
Notes: This figure plots aggregates on new disclosers of foreign accounts (those not filing FBAR in previous years, see text for details), by year and the value of the largest account disclosed by the new filer. OVD participants and non-US address filers are excluded from the tabulations. The left panel reports the number of individuals, the right normalizes this number by dividing by the 2008 level. We observe that the increase in new FBARs filed was disproportionately driven by individuals with large accounts, though there was an increase for all account values.
46
Figure 9: Additional Account Disclosures for Previous FBAR Filers
Levels Normalized by 2008 Level
Notes: This figure plots aggregates on disclosures of additional accounts by individuals who had already been filing FBARs by year. We count individuals who previously disclosed only one account and start declaring multiple accounts, individuals who previously disclosed only non-haven accounts who start disclosing multiple accounts, and individuals who previously only disclosed small accounts and start disclosing large (>$1 million) accounts (see text for details). OVD participants and non-US address filers are excluded from the tabulations. The left panel reports the number of individuals, the right normalizes this number by dividing by the 2008 level. We observe a large an increase in each intensive margin measure of new account disclosure.
47
Figure 10: Account Characteristics among OVD Participants and FBAR Compliers
Figure 10.A. Account Value
Figure 10.B: Account Country
Notes: This figure estimates the distribution of account characteristics for new FBAR filers (excluding OVD participants and non-U.S. addresses) filing in 2009 because of enforcement (called FBAR compliers) and compares them to the characteristics of accounts disclosed by OVD participants. The first panel reports account value and the second considers account country. We observe that OVD participants disclosed higher-value accounts and were more likely to disclose accounts in Switzerland where the enforcement crackdown was strongest. FBAR compliers in contrast were more likely to disclose accounts in the Cayman Islands, a tax haven not especially targeted by 2009 enforcement.
0.2
.4.6
.8
Prop
ortio
n of
File
rs
<$10k $10k-$99k $100k-999k >$1M
OVD participants FBAR CompliersAll 2009 Filers
0.1
.2.3
.4.5
Prop
ortio
n of
File
rs
Liec
hten
stei
nAu
stria
Net
herla
nds
Luxe
mbo
urg
Isle
of M
anM
exic
oSp
ain
Sing
apor
eTa
iwan
Irela
ndBe
rmud
aIta
lyAu
stra
liaH
ong
Kong
Kore
a, R
epub
lic o
f (So
uth)
Chi
naG
erm
any
Isra
elJa
pan
Fran
ceIn
dia
Cay
man
Isla
nds
Can
ada
Uni
ted
King
dom
Switz
erla
nd
OVD participants FBAR compliers 0
.2.4
.6.8
Propo
rtion o
f Filer
s
A B C D
New Filers (all) New filers (compliers)OVD participants
0.2
.4.6
.8
Proportio
n of Filer
s
A B C D
New Filers (all) New filers (compliers)OVD participants
48
Figure 11. Event Study of Reported Income for OVD Participants Figure 11.A. Interest, Dividends, Figure 11.B. Wage and Salary, and Capital Gains Schedule C and Schedule E Incomes
Figure 11.C. Total Capital Income Figure 11.D. Propensity to Report
Positive Capital Income
Notes: This figure plots the coefficients on event-year dummies in the event study regression for given income sources (in the first three panels) and a binary dependent variable indicating whether the individual reported any capital income (in the last panel). Event-year 0 represents the tax year associated with the year of initial OVD participation. The 95% confidence interval is calculated from estimated standard errors clustered at the individual level. The outcome variable in Panels A-C is an inverse hyperbolic sine transformation of a given income source. Capital gains income in Panel A includes realized gains and losses. Total capital income in Panels C and D is defined as the sum of interest, dividends, and capital gains and losses. We observe large positive effects on financial capital income reporting and little to no effect for other types of income.
49
Figure 12. Event Study of Reported Income for First-Time FBAR Filers Figure 12.A. Interest, Dividends, Figure 12.B. Wage and Salary, and Capital Gains Schedule C and Schedule E Incomes
Figure 12.C. Total Capital Income Figure 12.D. Propensity to Report Positive
Capital Income
Notes: This figure plots the coefficients on event-year dummies in the event study regression for given income sources (in the first three panels) and a binary dependent variable indicating whether the individual reported any capital income (in the last panel). Event-year 0 represents the tax year associated with the year of first-time FBAR filing. The 95% confidence interval is calculated from estimated standard errors clustered at the individual level. The outcome variable in Panels A-C is an inverse hyperbolic sine transformation of a given income source. Capital gains income in Panel A includes realized gains and losses. Total capital income in Panels C and D is defined as the sum of interest, dividends, and capital gains and losses. We observe large positive effects on financial capital income reporting and little to no effect for other types of income. Relative to the previous figure on OVD participants, we observe smaller effects on capital income reporting here, except for a larger extensive margin effect in Panel D.
50
Figure 13. Decomposing Reported Income in Event Study of OVD Participants and First-Time Filers Panel 13A. OVD Participants, Interest Panel 13B. OVD Participants, Dividends
Notes: This figure repeats the exercise the previous two figures for interest and dividend income, decomposing these types of income into income reported by domestic financial institutions (on Forms 1099-INT and 1099-DIV) and income reported by the taxpayer but not reported by domestic financial institutions. Event-year 0 represents the tax-year associated with the year of first-time FBAR filing. The 95% confidence interval is calculated from estimated standard errors clustered at the individual level. The outcome variable is an inverse hyperbolic sine transformation of a given income source such that point estimates can be interpreted similarly to a log transformation. We observe that the increase in interest and dividend income reporting in the previous two figures was driven primarily by interest and dividend income not reported on a 1099 Form filed by domestic banks, suggesting it is likely from a foreign account. We do see a delayed increase in 1099 income, which could be driven by repatriation, especially for first-time FBAR filers in Panels C and D.
51
Figure 14. Probability of Amending Returns Relative to First-Time Filing
Notes: This figure plots the regression coefficients on the event time dummies from a linear probability model where the outcome variable is an indicator for amending a 1040 from one of the previous four years in year t. The sample is identical to that of Figure 12, first-time FBAR filers outside OVD. Confidence Intervals are derived from estimated standard errors which are clustered at the individual level. We observe a substantial spike in filing amended tax returns following the disclosure of a foreign account, which is strongly suggestive of a number of quiet disclosures.
52
Table 1: Characteristics of FBAR filers and accounts in 2008
2008
2009
Total number of FBAR filers 236,331 100% 326,312 100% U.S. address 161,214 68%
233213 71%
non-U.S. address 75,117 32%
93099 29%
haven account 39,784 17%
63052 19% no haven account 196,547 83%
263260 81%
amended return 7,022 3%
18081 6% no amended return 229,309 97%
308231 94%
multiple accounts 157,786 67%
213815 66% single account 78,545 33% 112497 34% Total number of FBAR accounts 859,700 100% 988,020 100% Europe 406,723 47%
433,142 44%
Asia 185,018 22%
258,503 26% North America 246,272 29%
272,485 28%
Other 21,687 3%
23,890 2%
<$10,000 279,548 33%
274,174 28% $10,000 - $100,000 391,612 46%
480,881 49%
$100,000 - $1 million 150,407 17%
200,078 20% >$1 million 39,941 5% 41,033 4%
Notes: This table summarizes the characteristics of FBAR filers and accounts in 2008, which serves as the baseline for our analysis of the increase from 2008 to 2009.
53
Table 2: Statistics on Reported Income in the Year before Disclosure, OVD Participants and non-OVD, U.S. New FBAR Filers
Notes: This table shows mean and median incomes by source for the treatment groups of OVD participants and first-time FBAR filers, and for a control group of continuous filers used in the event study regression analysis. Capital gains includes realized capital gains and losses. All statistics are calculated in event-year -1, which is the baseline year in the regression specification.
OVD ParticipantsIncome mean median p25 p75 p90 p95 p99Interest 52,033 7,012 1,194 29,169 92,580 179,374 717,487 Dividends 47,782 3,945 184 20,869 74,557 156,063 751,403 Capital Gains 30,278 1,489 0 11,170 44,655 99,867 489,021 Wages 220,138 48,193 0 167,847 370,721 619,335 2,403,199 AGI 732,941 152,881 65,969 352,662 914,857 1,760,255 5,988,962 Total Tax 155,883 18,613 3,001 71,895 207,762 422,062 1,615,978 Sched C Income 23,589 0 0 0 24,000 93,356 470,614 Sched E Income 90,375 0 0 10,710 160,321 483,788 2,359,923
First-time FilersIncome mean median p25 p75 p90 p95 p99Interest 57,692 1,240 112 8,009 44,537 131,660 970,424 Dividends 57,968 369 0 6,442 49,889 144,004 850,591 Capital Gains 42,551 118 0 3,474 29,456 88,328 550,640 Wages 280,804 114,126 19,290 238,357 481,447 807,758 3,073,700 AGI 649,312 159,224 72,466 335,236 885,327 1,928,447 10,059,205 Total Tax 156,427 21,622 4,570 65,140 203,777 457,561 2,372,693 Sched C Income 17,865 0 0 0 9,811 51,349 363,155 Sched E Income 123,919 0 0 0 57,866 333,075 3,033,635
Control Group - Continuous FilersIncome mean median p25 p75 p90 p95 p99Interest 61,671 2,244 301 10,502 37,206 88,964 652,958 Dividends 81,347 1,937 24 12,456 51,427 129,164 931,767 Capital Gains 60,237 773 0 6,967 32,585 82,895 608,198 Wages 275,236 86,095 0 224,879 507,493 878,878 3,029,497 AGI 613,800 134,021 49,452 309,824 809,608 1,574,653 7,871,034 Total Tax 142,354 11,138 266 45,589 148,305 310,463 1,597,577 Sched C Income 12,093 0 0 0 10,687 54,000 293,288 Sched E Income 128,452 0 0 0 21,876 154,639 2,147,548
54
Table 3: Estimate of the Total Effect (Direct Method)
Notes: This table constructs the estimate of the total effect on reported capital income and tax revenues using the “direct method” described in the text, i.e. simply applying the event study estimates to each observation assuming a uniform treatment effect. The first column reports the coefficient from the event study for each type of capital income. The second reports the total effect on capital income. The third column reports the tax rate we use to construct the revenue estimate. We assume for simplicity that realized capital gains and dividends are taxed at the preferred rate, which was 15 percent in the top tax bracket in the period we study. The last column multiplies the total change in reported income by the tax rate.
Table 4: Estimate of the Total Effect (Indirect Method)
Notes: This table constructs the estimate of the total effect on reported capital income and tax revenues using the “indirect method” described in the text. We first convert the coefficient from total financial capital income in the event studies to its implied percent change in income. We then use Eq. (5) to estimate ![#$%$] from the reported statistics in the second and third column. We apply this via Eq. 3 to the total reported assets to estimate the total effect on reported income.
coefficient (t+1)
Change in Total Reported Capital Income (millions) Tax Rate
Table 5: Estimated Rates of Return on Foreign Assets
Notes: This table considers the implications of our results using the direct or indirect method (Tables 3 and 4) for rates of return on foreign wealth. The first to columns report the total assets and total change in reported capital income. The third column estimates the compliance-adjusted rate of return. For the direct method, this is calculated by dividing the change in reported capital income by total reported assets; for the indirect method, it is calculated using Eq. (5). In the last two columns, we decompose the compliance adjusted rate of return into the actual rate of return for previously non-compliant account, and the fraction of accounts that are non-compliant, under the assumption that 1) all OVD participants were previously non-compliant, and 2) the rate of return was the same for OVD participants and first-time filers.
Table 6: Summary of Total Income and Revenue Estimate Results
Notes: This table summarizes our estimates of the change in total reported capital income and tax revenues using the direct and indirect method (see Tables 3 and 4). To obtain the tax revenue estimate for the indirect method, we use the average tax rates implied by the direct method for OVD participants and first-time filers. We report totals adding across OVD participants and first-time filers in the last two rows.
Table 5: Estimated Rates of Return on Foreign Assets
Table A.2 Event Study of Reported Total Financial Capital Income for OVD Participants, Alternative Specifications
Note: This table reports several alternative specifications of the estimation of equation (2) on the impact of disclosure on reported total financial capital income. Column (1) is identical to the one in Table A.1 Column (7). Column (2) drops zeros in event year -1, as these individuals are also excluded from the analysis in Table 4. Column (3) drops all observations of zero financial capital income. Columns (4) is similar to column (3), but use a traditional logarithmic transform instead of an inverse hyperbolic sine transform. We conclude from the table that individuals switching from reporting zero capital income to a positive amount reduces the estimated coefficient for event time 1 to at least 0.54, which is smaller than the estimate in Column (1) but still large and significant.
Table A.6. Probability of Amending Returns Relative to First-Time Filing
Note: This table reports the regression coefficients plotted in Figure 14.
(1)VARIABLES Amdend
Treat*Event time -4 -0.001174(0.001297)
Treat*Event time -3 -0.007545***(0.001366)
Treat*Event time -2 -0.002049(0.001339)
Treat*Event time 0 0.028696***(0.001481)
Treat*Event time 1 0.014274***(0.001402)
Treat*Event time 2 0.004294***(0.001351)
Treat*Event time 3 0.002525*(0.001444)
Treat*Event time 4 -0.002716**(0.001338)
Observations 845,580R-squared 0.1581Standard errors clustered at the individual-level*** p<0.01, ** p<0.05, * p<0.1
7
Figure A.1 The Ratio of Account Value to Previously Reported Capital Income
Figure A.1.A OVD Participants
Figure A.1.B First-Time Filers
Note: This table reports quantiles of the ratio of total FBAR account value to capital income in the year before disclosure, by rank in the total capital income distribution. We rank individuals according to their rank among OVD participants or first-time filers rather than the entire population, for simplicity. To obtain total FBAR account value, we add across accounts if the individual reported multiple accounts. Results are very similar when using the maximum account value. Individuals with zero capital income in the prior year are excluded from the analysis. We observe that the ratio is typically lower for individuals further up in the capital income distribution. Because this group holds more weight when calculating the total effect, this suggests that the direct method overestimates the total effect of enforcement on reported capital income. See Section 6.4 for further details.
.11
1010
010
0010
000
acct
val
ue /
capi
tal i
ncom
e in
t-1
5 10 15 20 25 30 35 40 45 50 55 60 65 70 75 80 85 90 95 100percentile of total capital income distribution
25th percentile of acct value / income 50th percentile of acct value / income 75th percentile of acct value / income
.11
1010
010
0010
000
acct
val
ue /
capi
tal i
ncom
e in
t-1
10 15 20 25 30 35 40 45 50 55 60 65 70 75 80 85 90 95 100percentile of total capital income distribution
25th percentile of acct value / income 50th percentile of acct value / income 75th percentile of acct value / income