6.8BCD: Changes in Force and Motion Force, Motion, and Energy TEKS UNWRAPPED The student knows force and motion are related to potential and kinetic energy. The student is expected to: 6.8B Identify and describe the changes in position, direction, and speed of an object when acted upon by unbalanced forces. 6.8C Calculate average speed using distance and time measurements. (Supporting Standard, NEW TOPIC) 6.8D Measure and graph changes in motion. (Supporting Standard, NEW TOPIC) Prior Knowledge/TEKS 4.6.D: Design an experiment to test the effect of force on an object such as a push or a pull, gravity, friction, or magnetism. 5.6.D: Design an experiment that tests the effect of force on an object. 6.A: Identify and describe the changes in position, direction of motion, and speed of an object when acted upon by force. 6.B: Demonstrate that changes in motion can be measured and graphically represented. Key Concepts • A force is a push or a pull that can change the motion of an object. • Motion is a change in an objects position, direction, or location. • An object in its rest position stays in its resting position until an unbalanced force acts upon it. An object in motion will move in the same direction and at the same speed until an unbalanced force acts upon it. • Speed is a measurement of the rate of change of position with respect to time. • Average speed is calculated by dividing the distance an object traveled by the specified amount of time it took the object to travel the distance (s=c1/t). • A distance and time graph illustrates changes in motion. Time, measured in seconds, is graphed on the x-axis and distance, measured in meters, is graphed on the y-axis. 2012 Rice University - Ali Rights Reserv ed
Transcript
6.8BCD: Changes in Force and Motion Force, Motion, and Energy
TEKS UNWRAPPED The student knows force and motion are related to potential and kinetic energy. The student is expected to:
6.8B Identify and describe the changes in position, direction, and speed of an object when acted upon
by unbalanced forces.
6.8C Calculate average speed using distance and time measurements. (Supporting Standard, NEW TOPIC)
6.8D Measure and graph changes in motion. (Supporting Standard, NEW TOPIC)
Prior Knowledge/TEKS 4.6.D: Design an experiment to test the effect of force on an object such as a push or a pull, gravity, friction, or
magnetism.
5.6.D: Design an experiment that tests the effect of force on an object.
6.A: Identify and describe the changes in position, direction of motion, and speed of an object when
acted upon by force.
6.B: Demonstrate that changes in motion can be measured and graphically represented.
Key Concepts • A force is a push or a pull that can change the motion of an object.
• Motion is a change in an objects position, direction, or location.
• An object in its rest position stays in its resting position until an unbalanced force acts upon it.
An object in motion will move in the same direction and at the same speed until an unbalanced force acts
upon it.
• Speed is a measurement of the rate of change of position with respect to time. • Average speed is calculated by dividing the distance an object traveled by the specified amount of time it
took the object to travel the distance (s=c1/t).
• A distance and time graph illustrates changes in motion. Time, measured in seconds, is graphed on the
x-axis and distance, measured in meters, is graphed on the y-axis.
2012 Rice University - Ali Rights Reserved
6.8BCD: Changes in Force and Motion Force, Motion, and Energy
TEKS UNWRAPPED
Fundamental Questions -What is force? What is motion?
-What is the difference between balanced and unbalanced forces?
•How can unbalanced forces change the motion of an object?
'What is velocity? 'What happens when force is applied to a moving object?
•How can the speed of an object be measured?
-How can creating and analyzing graphs be useful in understanding forces and motion of objects?
Dissecting TEKS Nouns
position
average speed
distance
force
direction
unbalanced forces
kinetic energy
speed
motion
potential energy
' 012 Rice tinivcrsity - A11 Rights Reserved
6.8BCD: Changes in Force and Motion Force, Motion, and Energy
TEKS UNWRAPPED
Dissecting TEKS Verbs
201 2
Identity 1. to know and say who someone is or what something is
2. to find out who someone is or what something is
Put together, Change, Apply, Produce, Translate, Calculate, Manipulate, Modify
How will your students APPLY the concepts in 6.8D TEKS?
Examples of prompts for this level of content knowledge include:
6.8D Example: Construct a distance and time graph to show a car's speed. (Use with a table of
distance and time coordinates.) 6.8D Example: Examine the distance and time graph and decide if the object's speed generally
increased or decreased over the course of its travel.
Definition Source: Merriam Webster Dictionary
2012 i 11 University - All Rights Re se
6.8BCD: Changes in Force and Motion Force, Motion, and Energy
TEKS UNWRAPPED
Time (min) Time (min)
UI
E
3 a)
Time (min)
2012 Rice University - All Rights Reserved
STAARTm: 2013 Released 8th Grade Test Questions
For 6.8BCD: Questions # 28, 30
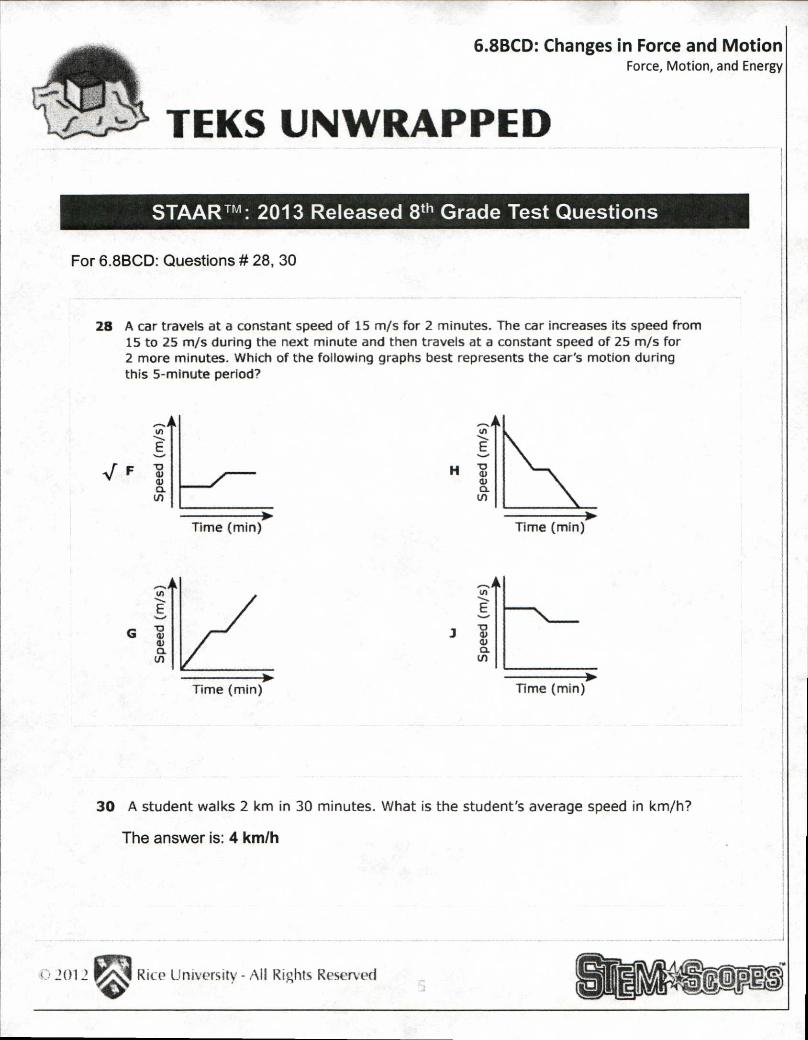
28 A car travels at a constant speed of 15 m/s for 2 minutes. The car increases its speed from 15 to 25 m/s during the next minute and then travels at a constant speed of 25 m/s for 2 more minutes. Which of the following graphs best represents the car's motion during this 5-minute period?
Sp
eed
(m/s
) F
Q. U)
30 A student walks 2 km in 30 minutes. What is the student's average speed in km/h?
The answer is: 4 km/h
i i I I I I I I
1
2 3 4 5 6 7
8
Time (in minutes)
8th Grade Math 6.8C
Name
Class/Grade
Date
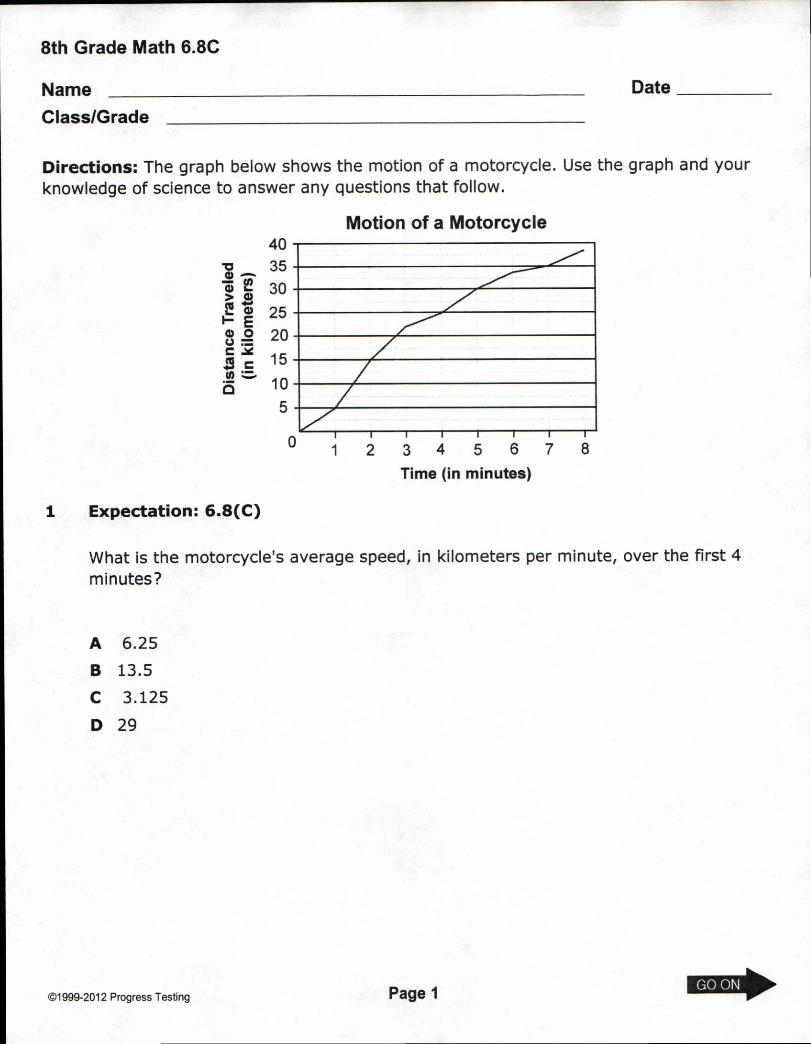
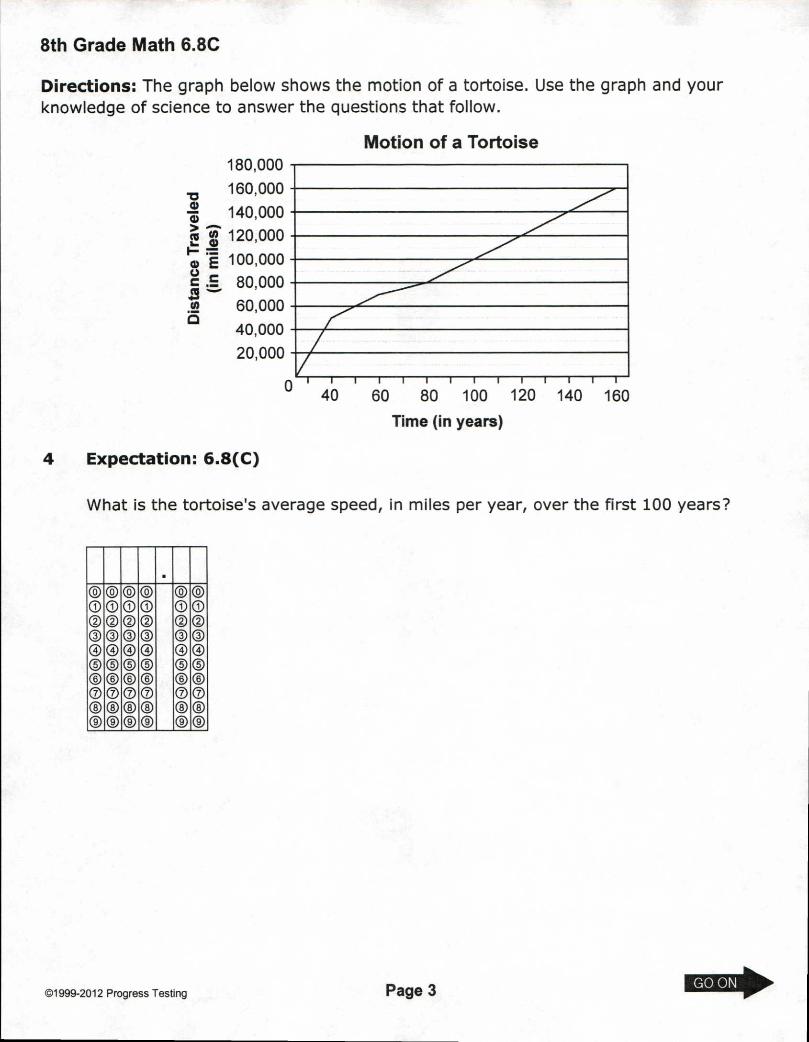
Directions: The graph below shows the motion of a motorcycle. Use the graph and your
knowledge of science to answer any questions that follow.
Motion of a Motorcycle 40
-0 35 2 17)- w 1.- 30 > o I! 1
E 1 25
1— O 20 o c.) =
..
•
le = 15
u) i5 1 0
5
0
1 Expectation: 6.8(C)
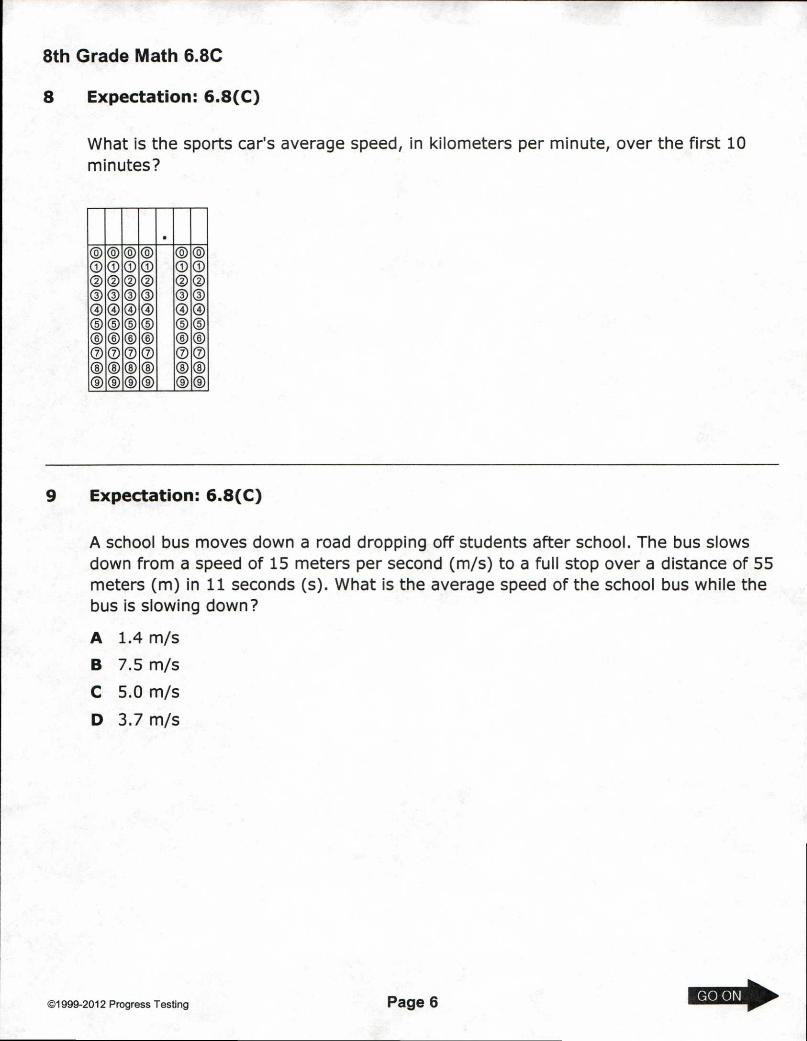
What is the motorcycle's average speed, in kilometers per minute, over the first 4
A school bus moves down a road dropping off students after school. The bus slows down from a speed of 15 meters per second (m/s) to a full stop over a distance of 55 meters (m) in 11 seconds (s). What is the average speed of the school bus while the bus is slowing down?
A professional triathlete competes in an Orlando bike race. She takes 90 minutes to travel the entire course. Her speed varies from 0 kilometers per hour (km/hr) while stopped for a tire change to 30 kilometers per hour while riding downhill. The illustration shows her trip distances for each section of the race.
Section 1 Start 4 km
Section 2 3 km
What is the rider's average speed during the 90-minute bike race?
DIRECTIONS FOR MARKING ANSWER SHEET Use a #2 pencil only. Do NOT use ink or ballpoint pens. Make heavy black marks that fill the ovals completely. Erase clearly any answer you wish to change. Make no stray marks on the answer sheet.
8th Grade Math 6.8C Instructions to read aloud to your students.
When you decide what the answer to a question is, mark your answer on your answer sheet. To do so, find the row of circles with the same number as the question. Then darken in the circle with the same letter as the answer you chose. If you don't know the answer to a question, skip it. You may return to it later if you have time. If you finish the test early, you should go back and check over your work. Do NOT fold your answer sheet or make any stray marks.
When marking your answer sheet:
1. Make a heavy mark. The mark should be large enough to fill the circle, but it should not go outside too much. Do not waste time making very neat marks. It is more important to make very dark marks. Be sure to use a #2 pencil. 2. Be sure that your mark for every question is placed in the row with the same number as that question. 3. Make only ONE mark in a row. If you change your mind about an answer, erase your first mark as completely as you can.
7 It takes five hours to drive from Fort Worth to Midland, which is a distance of 300 miles. What would be the average speed for this trip? Record and bubble in your answer on the grid provided.
•
n„,,e,„ 2013 Rice University - All Rights Reserved
$peed ChAle Materials: stopwatch
meter stick tape or masking tape marker
Procedures:
Step 1: Bather your materials
Step 2: Find a spot in the hallway and measure off a 10 meter race track.
Use 3 pieces of tape to mark the beginning, middle and end of your track.
Step 3: Have each person from your team take turns WALKING the race track
(from Om to 10m) while the other team members use the stopwatch to accurately
time the trip.
Step 4: Record the data for your own walk in your own data table.
Step 5. Repeat steps 3 and 4 with HOPPING, WALKING BACKWARDS, and SPEED-
WALKING*. Record all data for your own walks in your data table.
Step 6: Clean up: All tape must be cleared off the floor in the hall way. Your
teacher will ask to see the tape is taken up. Return the timer, meter stick and
markers to your teacher.
Safety: Be careful. Your shoes should be appropriate for lab. Clear the hallways of obstructions
or objects before doing the lab.
Courtesy: Other students are in class learning. We do not want to interfere with their learning.
Be considerate and as quiet as possible while taking data so we may do future assignments out of the classroom.
*Definition of Speed Walking: SPEED WALKING IS GOING AS FAST AS YOU CAN WITHOUT
JOGGING OR RUNNING. THERE SHOULD NOT BE ANY RUNNING IN THE HALL WAY.*
27
Data Table
Task Distance (y) Time (seconds) (x)
Walking 10m
Hopping 10m
Walking Backwards 10m
Speed-Walking 10m
Use your data table to complete the following line-graph.
Remember to title your graph, label your x and y axes, and provide an accurate scale.
Use a different color for each task (your graph should have 4 separate lines) and provide a key.
28
Analysis:
Look at your graph. Which task produced the steepest line?
Which task produced the least steep line?
What conclusions, if any, can you make about the steepness of a line on a distance/time graph?
Calculations
Use your graph to calculate the speed of each task. (Hint: the speed is the same as the SLOPE of the
line) Label your answers with m/s.
Walking: Hopping:
Walking Backwards: Speed-Walking:
Questions:
Which task had the fastest speed?
How do you know?
Which task had the slowest speed?
How do you know?
Conclusion: In at least 3 complete sentences, tell how your speed is related to the line on the graph you drew. Use
your data to support your response (there should be numbers in your response).
29
Calculating Speed from a Graph
8th Grade Science
Directions: Use the story to draw a graph. Then use the graph to calculate the speed. Don't forget to label your axes and correctly scale your graphs.
1) A car is traveling down the road. It drove
for 50 seconds and in that time it traveled
100 meters. What is the speed of the car?
2) If an ant crawls 1 meter in 25 seconds,
what is the ant's speed?
3) a) Three elephants are standing on a very
very strong bridge. The bridge happens to
have marks at every meter along the way
(almost like it was meant for setting up a
physics problem). Elephant #1 is standing
at 4m and starts walking. He walks for 30
seconds and after 30 seconds, the
elephant is at the place on the bridge
marked 64 meters. What is Elephant #1's speed?
31
b)lf Elephant #2 started at 3m and it took him
90 seconds to walk to meter mark 93m, what was Elephant #2's speed?
c) Elephant #3 was a track star in his day, so he has been standing on the 5m mark. He starts running, and 10 seconds later, he is at the 25m mark. What was Elephant #3's speed?
4) A beetle has been walking down a
sidewalk. He started at 3:15 in the
afternoon, and by 3:20 he had made it 4
meters. What is the beetles speed in m/s?
(Hint: there are 60 seconds in one minute)
32
1
3
5
2
4
6
7
Distance vs. Time Graphs 8 th Grade Science
Directions: Draw the graph of distance over time. Be careful, do not confuse the distance/time graph with a
graph of the terrain.
1) I was walking to the bus stop when I suddenly saw the bus coming. I ran as fast as I could towards the stop, but the bus moved off before I got there. I walked slowly the rest of the way to the stop and sat, waiting for the next bus.
2) Mr. Rose went down the street on his skateboard. At the end
of the street he ran into the curb and came to a sudden stop.
3) Mrs. Brevetti set off for Cheyenne one morning. When she
was half way there, she remembered she had left some important teacher things at home, so she went back to get
them. Then, she realized she was going to be late, so she hurried all the way back to school.
4) Billy went swimming after school. He swam slowly up and
down the pool for 4 laps, and then he did two laps at top
speed (one pool length-one lap).
5) Mrs. Antkowiak is learning to ski. She waited in the tow-rope
line at the bottom of the hill for 5 minutes; rode up the lift fo r 3 minutes, and then set off downhill. She skied extra slowly down the hill, so she wouldn't lose control and it took her 5
minutes to get down the hill. Once at the bottom, she waited for her husband (who skis even more slowly) to join her.
6) Anne and Barbara raced one another to the opposite side of
the parking lot and back. Barbara got a good start and kept
up a steady pace all the way. Ann was late getting off the
curb, but she ran faster than Barbara, and passed her before
they reached the far side. About halfway back to the starting
point, Ann stumbled and fell. She got up again quickly, but she had hurt her ankle and, as she limped on, Barbara passed her and won the race.
7) Cragen and Huckerby went on the Ferris Wheel at the fair.
The wheel started up slowly, and once it got to the top it
came down a little bit faster. It started up again, and when
the puppies were at the top, it stopped to let people on.
33
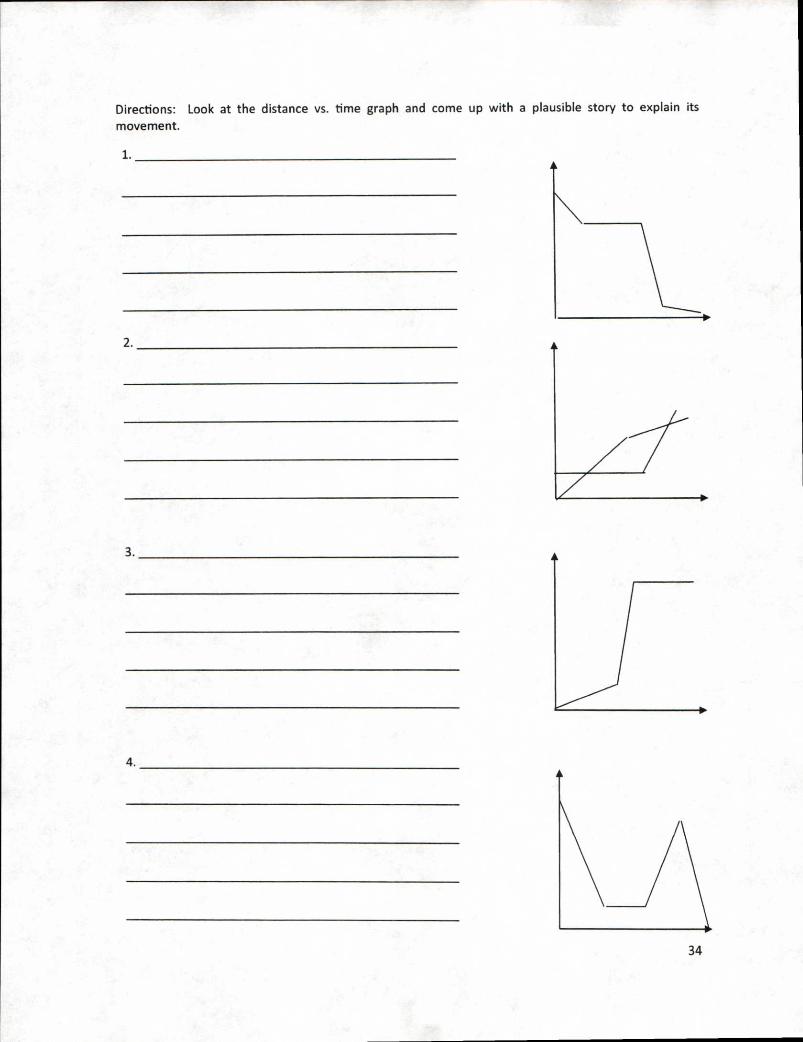
Directions: Look at the distance vs. time graph and come up with a plausible story to explain its
movement.
1.
2.
3.
4.
34
Calculating Speed in m/s 8 th Grade Science
1) A car is traveling down the road. It drove for 50 seconds and in that time it traveled 100 meters.
What is the speed of the car?
2) If an ant crawls 1 meter in 25 seconds, what is the ant's speed?
3) a) Three elephants are standing on a very very strong bridge. The bridge happens to have marks at
every meter along the way (almost like it was meant for setting up a physics problem). Elephant #1
is standing at 4m and starts walking. He walks for 30 seconds and after 30 seconds, the elephant is
at the place on the bridge marked 64 meters. What is Elephant #1's speed?
b) If Elephant #2 started at 3m and it took him 90 seconds to walk to meter mark 93m, what was
Elephant #2's speed?
c) Elephant #3 was a track star in his day, so he has been standing on the 5m mark. He starts
running, and 10 seconds later, he is at the 25m mark. What was Elephant #3's speed?
d) Out of Elephants 1, 2, and 3; which elephant was the FASTEST? Which elephant was the
SLOWEST? Explain how you know.
4) a) A beetle has been walking down a sidewalk. He started at 3:15 in the afternoon, and by 3:20 he
had made it 4 meters. What is the beetles speed in m/s? (Hint: there are 60 seconds in one minute)
b) A boy has also been walking down a sidewalk. He, too, started at 3:15 in the afternoon.
However, by 3:20 the boy had made it 200 meters. What was the boy's speed in m/s?
c) Who was walking FASTER? The boy or the beetle? How do you know?
35
•
D 7
6
e 5
u3
di 3
2 1 •
25
20 C
1 2 3 4 5 6 7 8 9 10 11 12 13 14 Time (s)
40
a 30 a)
ct) 20
10
• 1 2 3 4 5 6 7 8 9 10 11 12 1314
Time (s)
The graph to the left is a graph of distance traveled over time. Use the graph to answer the following questions.
1) Calculate the speed from A to B.
2) Calculate the speed from B to C.
3) Calculate the speed from C to D.
1 2 3 4 5 6 7 8 9 10 1112 1314 Time (a)
The graph to the right is a graph of distance traveled over time. Use the graph to answer the following questions.
4) Calculate the speed from A to B.
5) Calculate the speed from B to C.
6) Calculate the speed from C to D.
7) Between which letters is the FASTEST speed?
8) What is wrong with the distance/time graph to the left?