INTRODUCTION A telecommunications company is concerned about the number of customers leaving their Services. They need to understand who is leaving and why they leaving. The company's customer database includes customers who churned within the last month. In addition to information on Churn (Yes/No) for each customer, the data contains information on provided services in variables Est_Income , Car_Owner , Usage , Age group , Rate Plan , Long Distance, International Calls, Local Calls, Dropped Calls. It also contains customer account information in variables Pay method, Local Bill type, Long Distance Bill type. Finally, customer demographic information is contained in variables gender, Status, Dependents. IBM® Cognos® Insight is a personal analytics solution that empowers users to independently explore, analyze, visualize and share data without relying on IT for assistance. In minutes, analysts and line-of-business managers can create and share custom applications, dashboards and visualizations to help solve individual and workgroup challenges. IBM Cognos Insight delivers outstanding data interactivity, analysis and visualization capabilities to individual desktop users. Purpose The purpose of this study is, with the help of IBM Cognos Insight analyze why customers are not used the connection of Bits Telecom Company, which factors are influence the churn. Also see the cross selling and up-selling, also focus on profitability and investment and find out the way for better results.
Transcript
INTRODUCTION
A telecommunications company is concerned about the number of customers leaving their Services. They need to understand who is leaving and why they leaving. The company's customer database includes customers who churned within the last month. In addition to information on Churn (Yes/No) for each customer, the data contains information on provided services in variables Est_Income , Car_Owner , Usage , Age group , Rate Plan , Long Distance, International Calls, Local Calls, Dropped Calls. It also contains customer account information in variables Pay method, Local Bill type, Long Distance Bill type. Finally, customer demographic information is contained in variables gender, Status, Dependents.
IBM® Cognos® Insight is a personal analytics solution that empowers users to
independently explore, analyze, visualize and share data without relying on IT for
assistance. In minutes, analysts and line-of-business managers can create and share
custom applications, dashboards and visualizations to help solve individual and
workgroup challenges.
IBM Cognos Insight delivers outstanding data interactivity, analysis and visualization
capabilities to individual desktop users.
Purpose
The purpose of this study is, with the help of IBM Cognos Insight analyze why
customers are not used the connection of Bits Telecom Company, which factors
are influence the churn. Also see the cross selling and up-selling, also focus on
profitability and investment and find out the way for better results.
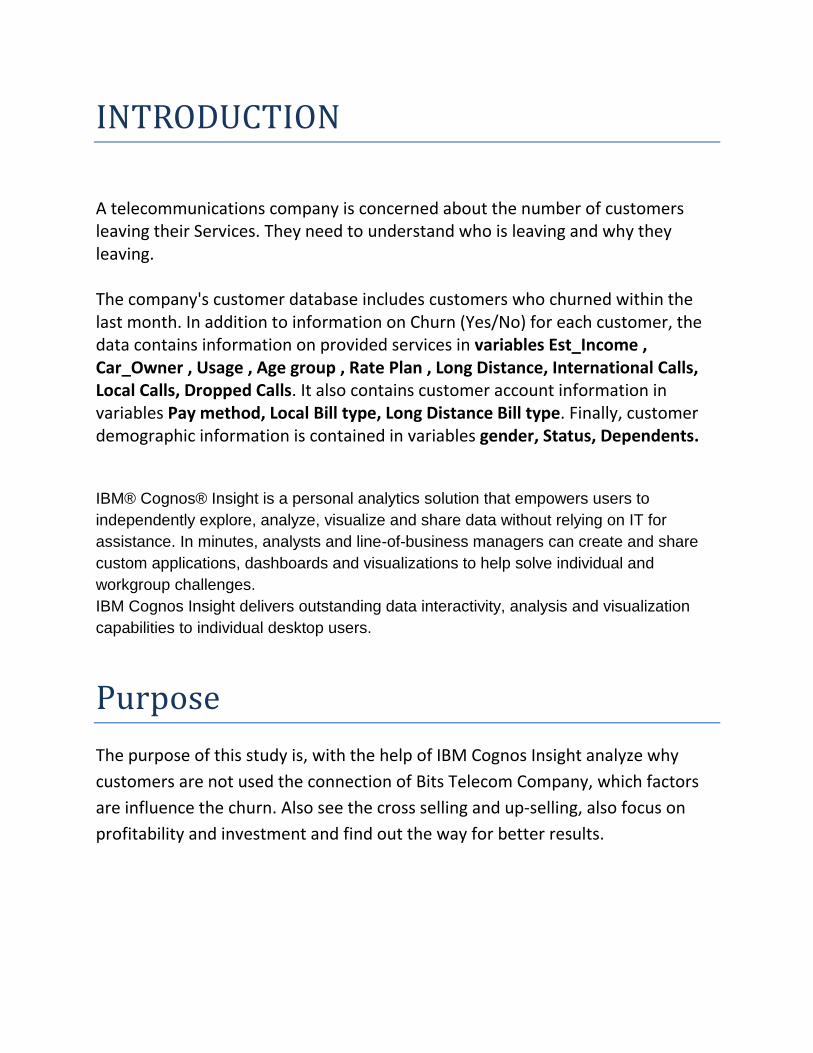
Front page
Get Data -> Quick import or Create a Workspace
If already save any Workspace then, select
Open a Workspace
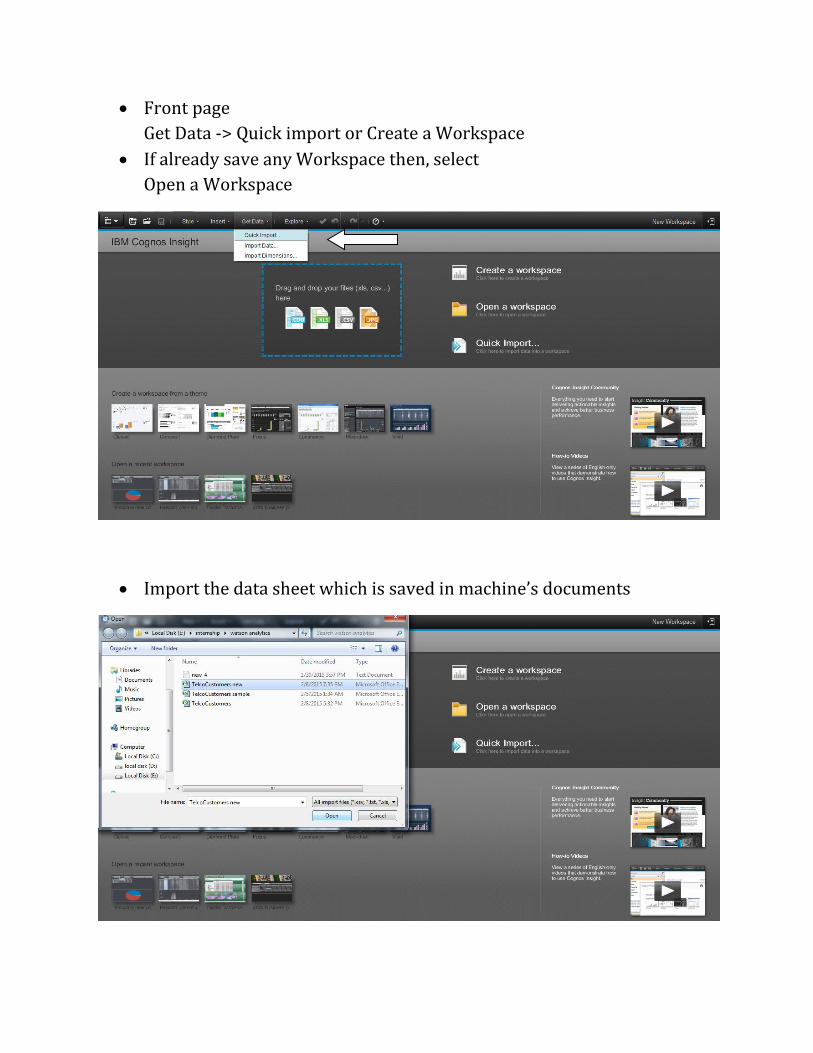
Import the data sheet which is saved in machine’s documents
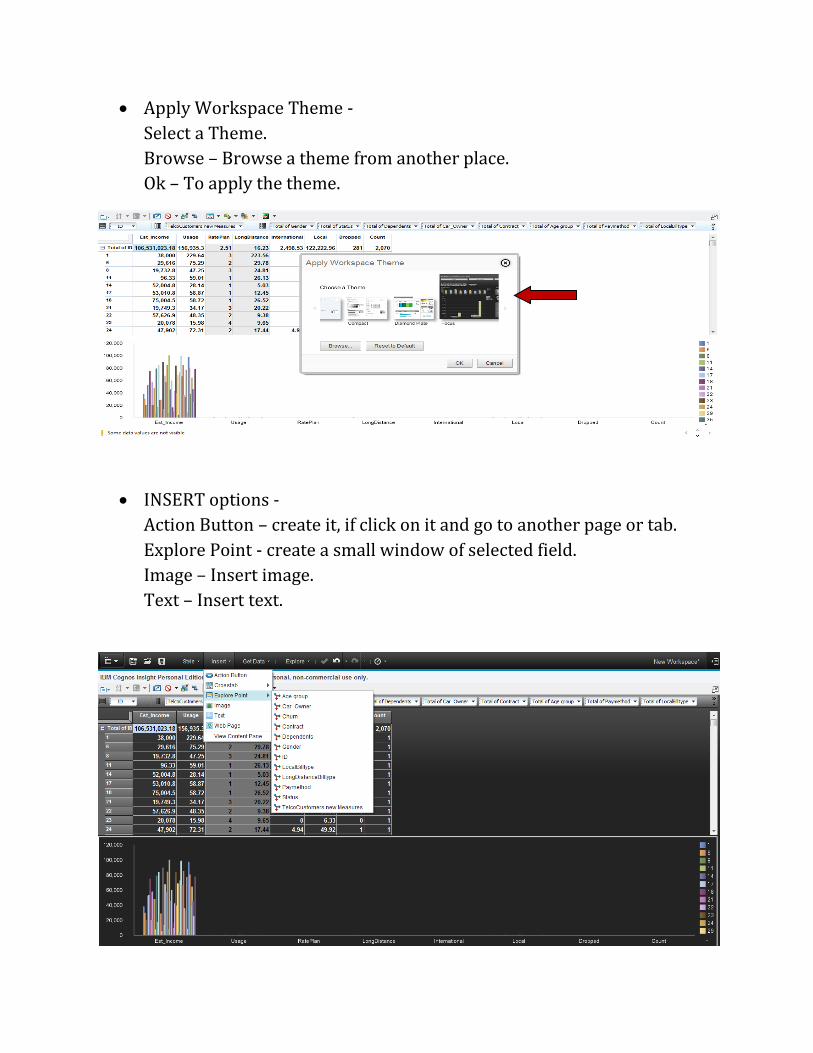
Apply Workspace Theme -
Select a Theme.
Browse – Browse a theme from another place.
Ok – To apply the theme.
INSERT options -
Action Button – create it, if click on it and go to another page or tab.
Explore Point - create a small window of selected field.
Image – Insert image.
Text – Insert text.
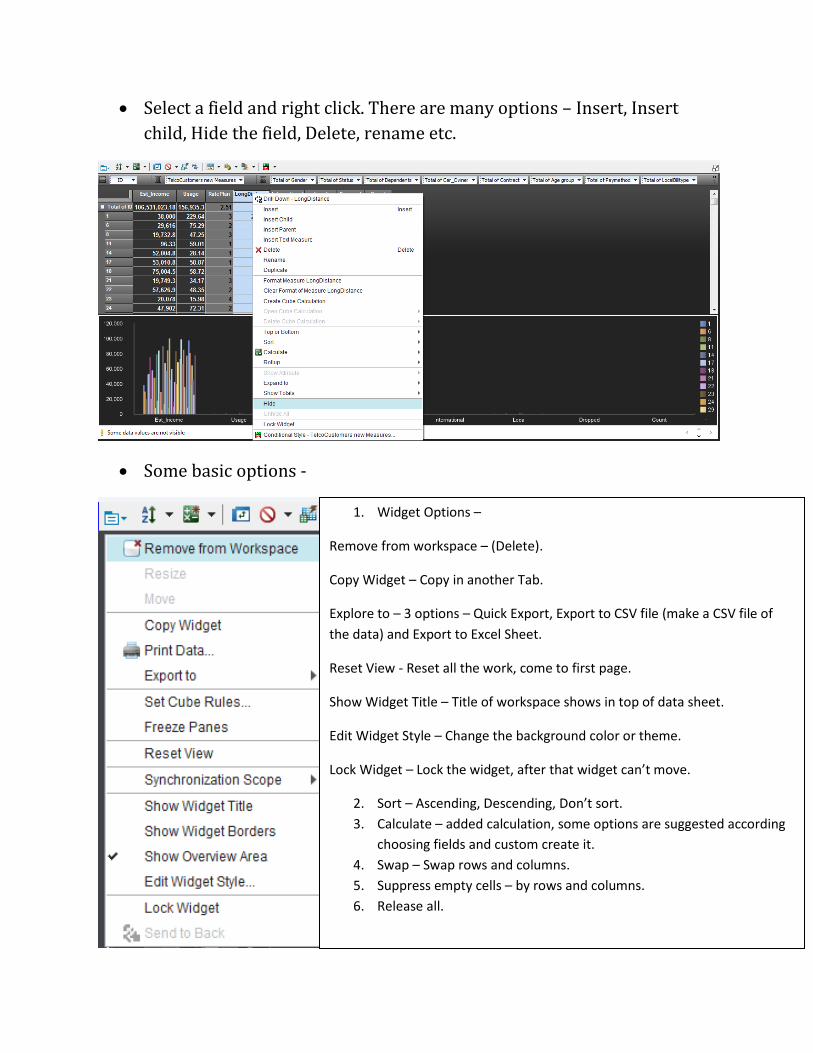
Select a field and right click. There are many options – Insert, Insert
child, Hide the field, Delete, rename etc.
Some basic options -
1. Widget Options –
Remove from workspace – (Delete).
Copy Widget – Copy in another Tab.
Explore to – 3 options – Quick Export, Export to CSV file (make a CSV file of
the data) and Export to Excel Sheet.
Reset View - Reset all the work, come to first page.
Show Widget Title – Title of workspace shows in top of data sheet.
Edit Widget Style – Change the background color or theme.
Lock Widget – Lock the widget, after that widget can’t move.
2. Sort – Ascending, Descending, Don’t sort.
3. Calculate – added calculation, some options are suggested according
choosing fields and custom create it.
4. Swap – Swap rows and columns.
5. Suppress empty cells – by rows and columns.
6. Release all.
Task 1 – Churn Analysis
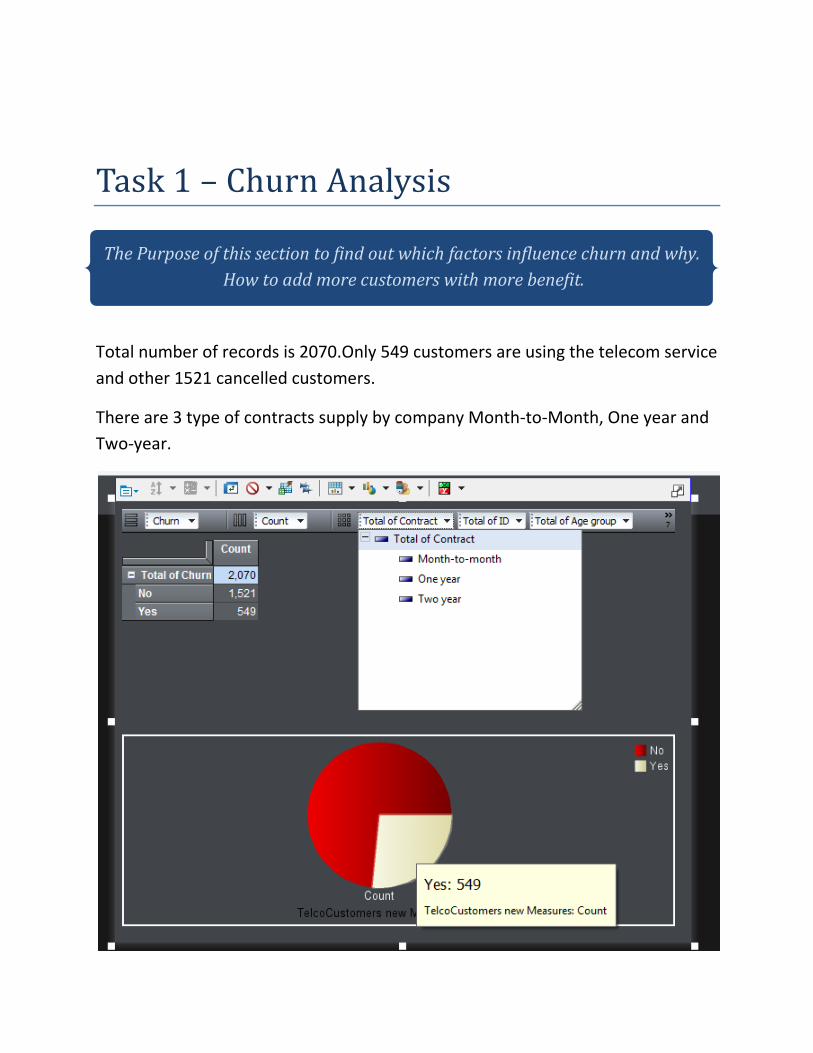
Total number of records is 2070.Only 549 customers are using the telecom service
and other 1521 cancelled customers.
There are 3 type of contracts supply by company Month-to-Month, One year and
Two-year.
The Purpose of this section to find out which factors influence churn and why.
How to add more customers with more benefit.
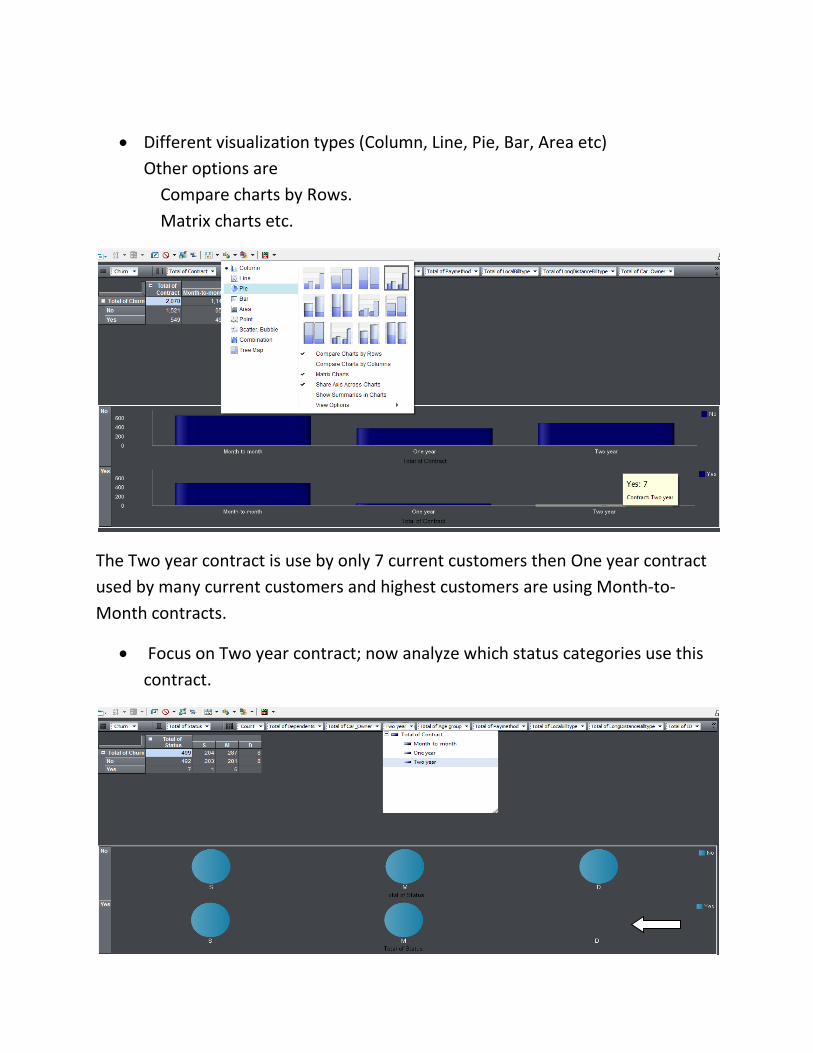
Different visualization types (Column, Line, Pie, Bar, Area etc)
Other options are
Compare charts by Rows.
Matrix charts etc.
The Two year contract is use by only 7 current customers then One year contract
used by many current customers and highest customers are using Month-to-
Month contracts.
Focus on Two year contract; now analyze which status categories use this
contract.
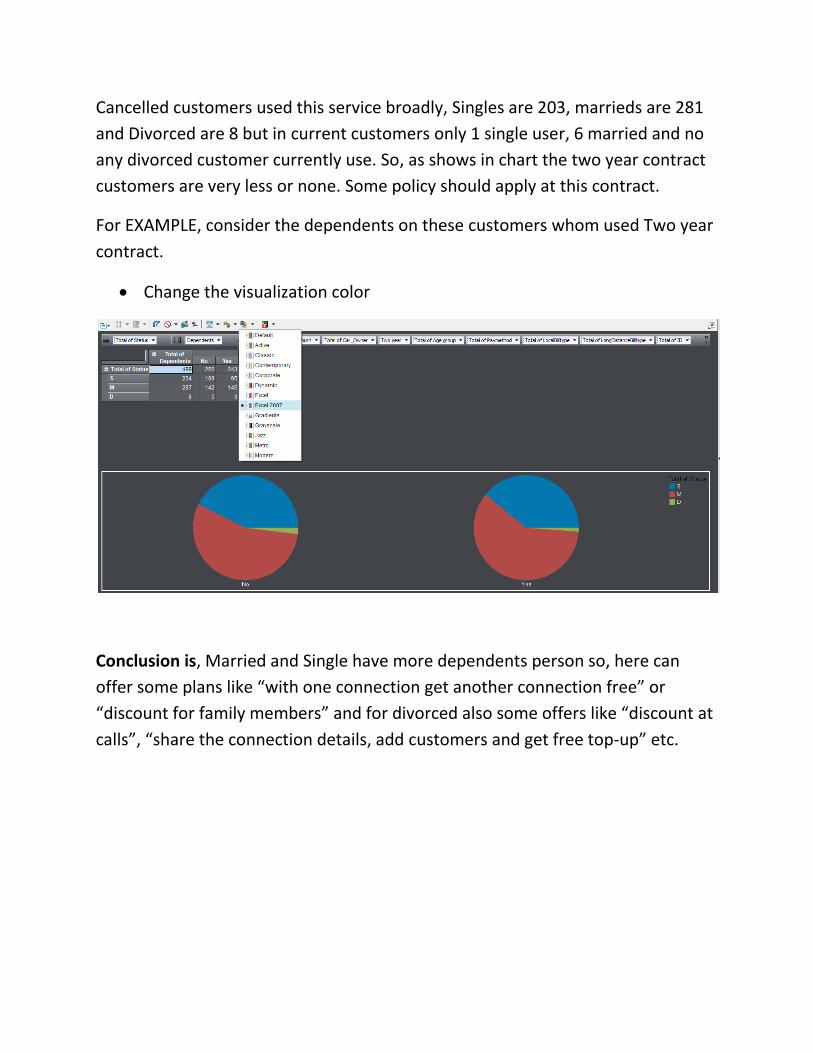
Cancelled customers used this service broadly, Singles are 203, marrieds are 281
and Divorced are 8 but in current customers only 1 single user, 6 married and no
any divorced customer currently use. So, as shows in chart the two year contract
customers are very less or none. Some policy should apply at this contract.
For EXAMPLE, consider the dependents on these customers whom used Two year
contract.
Change the visualization color
Conclusion is, Married and Single have more dependents person so, here can
offer some plans like “with one connection get another connection free” or
“discount for family members” and for divorced also some offers like “discount at
calls”, “share the connection details, add customers and get free top-up” etc.
Task 2 – Cross Selling and Up-selling
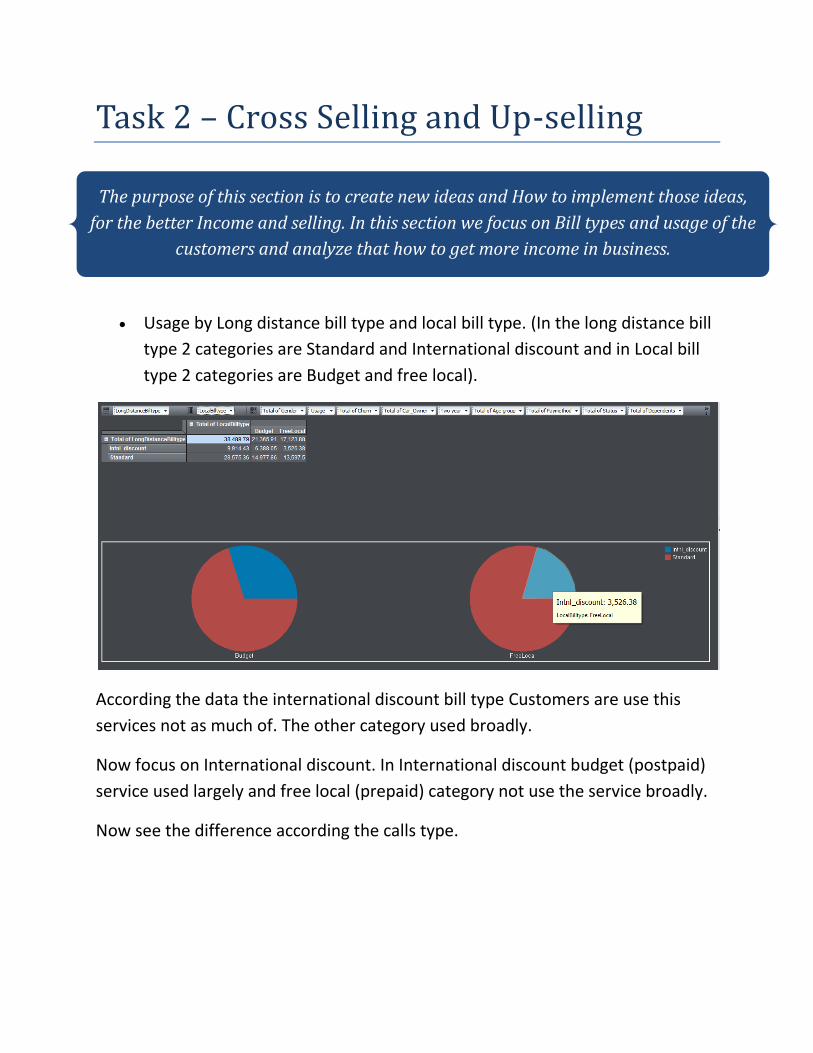
Usage by Long distance bill type and local bill type. (In the long distance bill
type 2 categories are Standard and International discount and in Local bill
type 2 categories are Budget and free local).
According the data the international discount bill type Customers are use this
services not as much of. The other category used broadly.
Now focus on International discount. In International discount budget (postpaid)
service used largely and free local (prepaid) category not use the service broadly.
Now see the difference according the calls type.
The purpose of this section is to create new ideas and How to implement those ideas,
for the better Income and selling. In this section we focus on Bill types and usage of the
customers and analyze that how to get more income in business.
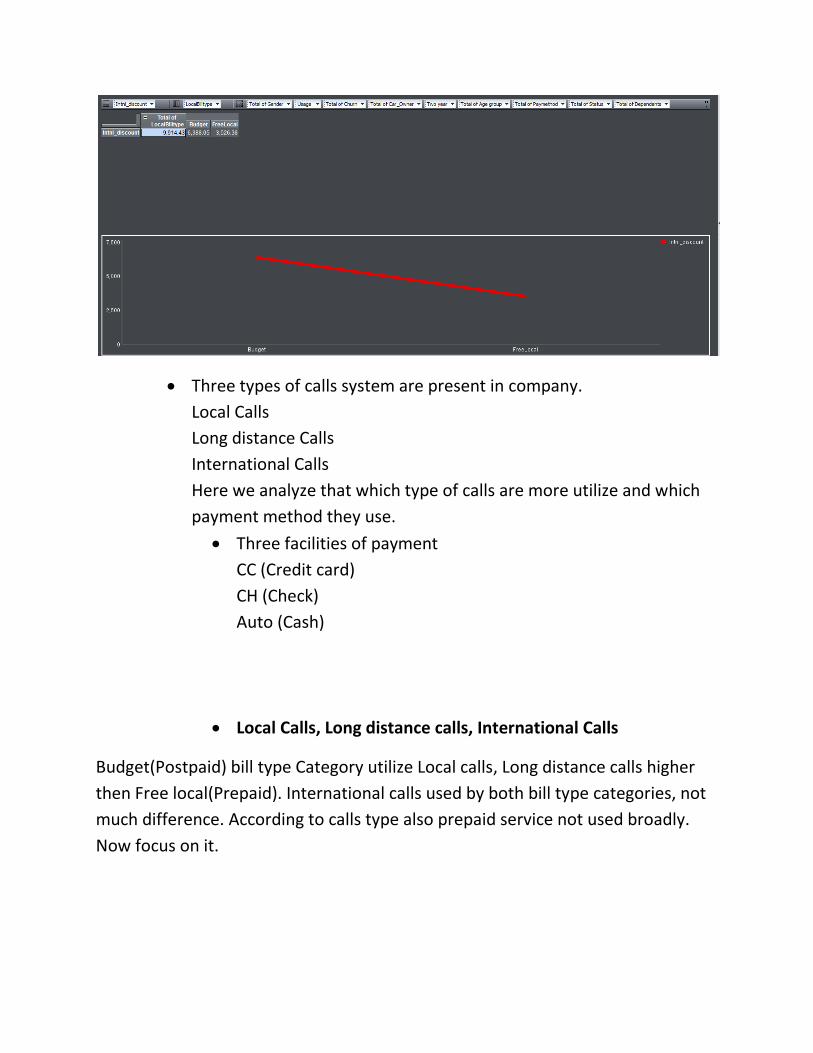
Three types of calls system are present in company.
Local Calls
Long distance Calls
International Calls
Here we analyze that which type of calls are more utilize and which
payment method they use.
Three facilities of payment
CC (Credit card)
CH (Check)
Auto (Cash)
Local Calls, Long distance calls, International Calls
Budget(Postpaid) bill type Category utilize Local calls, Long distance calls higher
then Free local(Prepaid). International calls used by both bill type categories, not
much difference. According to calls type also prepaid service not used broadly.
Now focus on it.
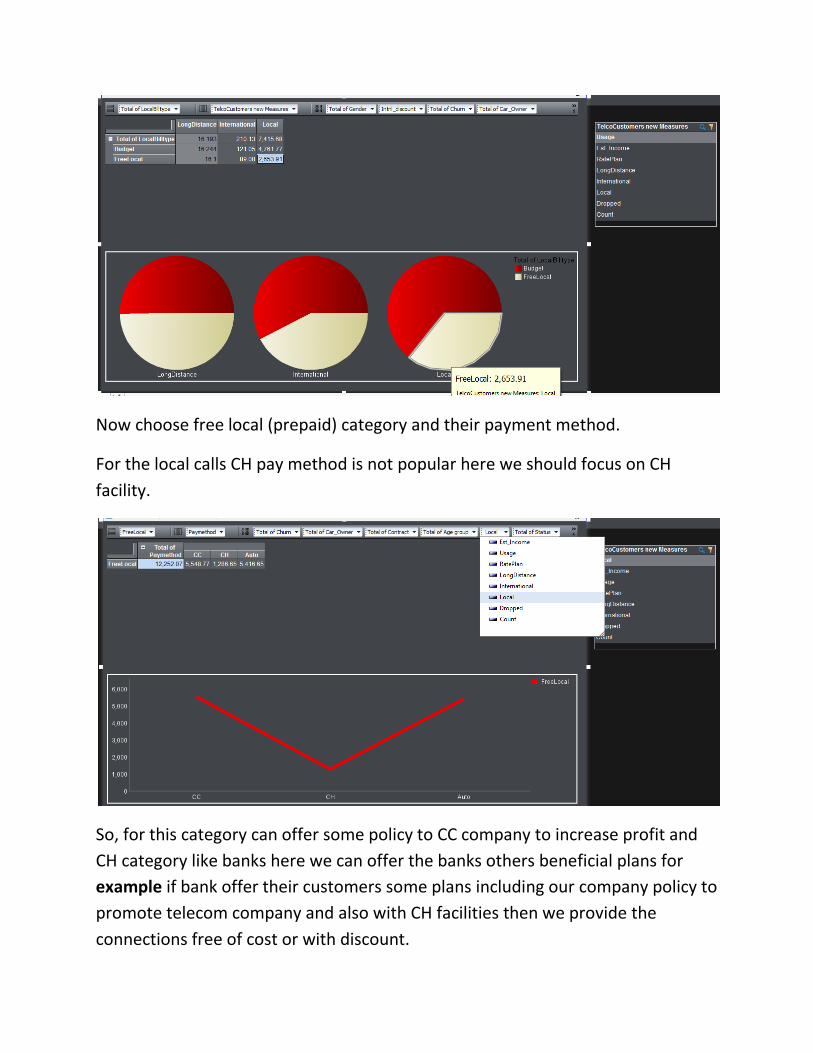
Now choose free local (prepaid) category and their payment method.
For the local calls CH pay method is not popular here we should focus on CH
facility.
So, for this category can offer some policy to CC company to increase profit and
CH category like banks here we can offer the banks others beneficial plans for
example if bank offer their customers some plans including our company policy to
promote telecom company and also with CH facilities then we provide the
connections free of cost or with discount.
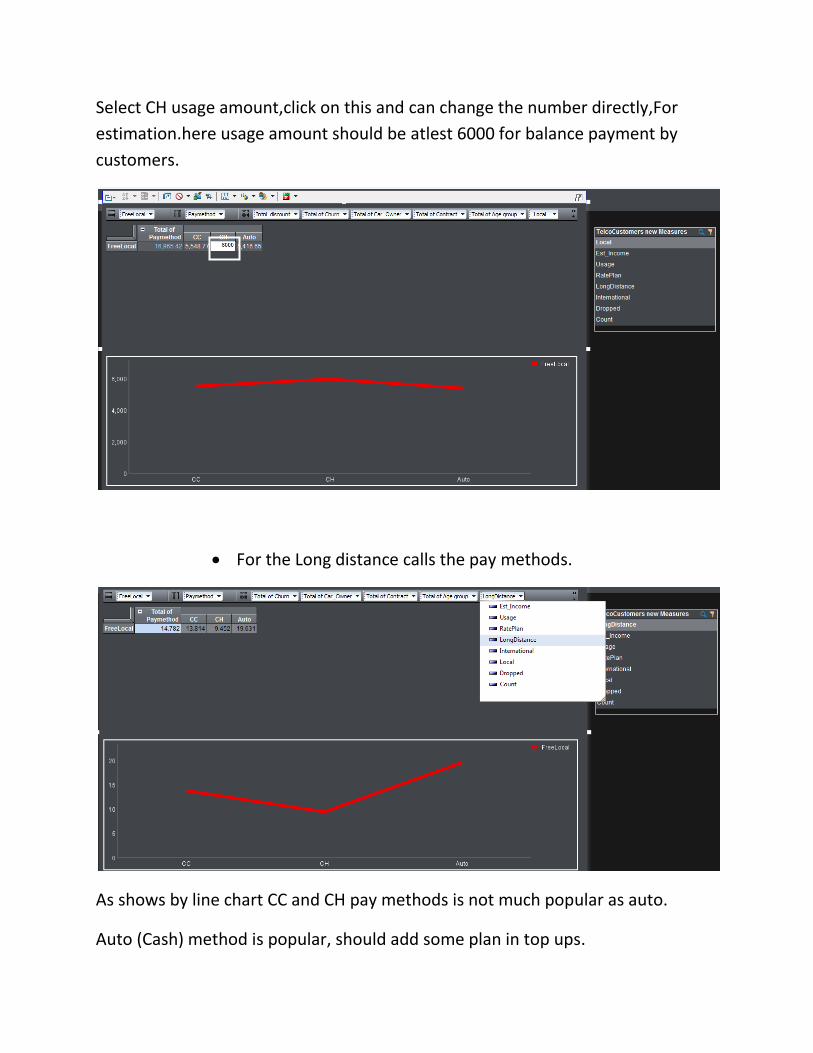
Select CH usage amount,click on this and can change the number directly,For
estimation.here usage amount should be atlest 6000 for balance payment by
customers.
For the Long distance calls the pay methods.
As shows by line chart CC and CH pay methods is not much popular as auto.
Auto (Cash) method is popular, should add some plan in top ups.
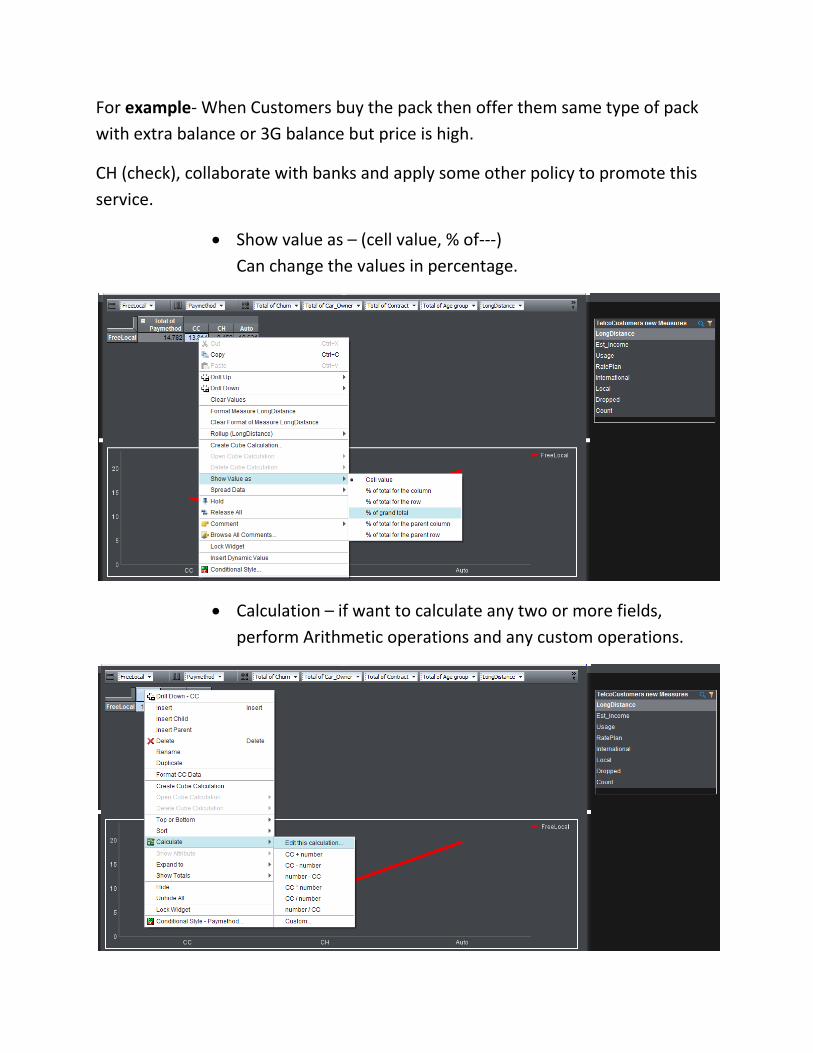
For example- When Customers buy the pack then offer them same type of pack
with extra balance or 3G balance but price is high.
CH (check), collaborate with banks and apply some other policy to promote this
service.
Show value as – (cell value, % of---)
Can change the values in percentage.
Calculation – if want to calculate any two or more fields,
perform Arithmetic operations and any custom operations.
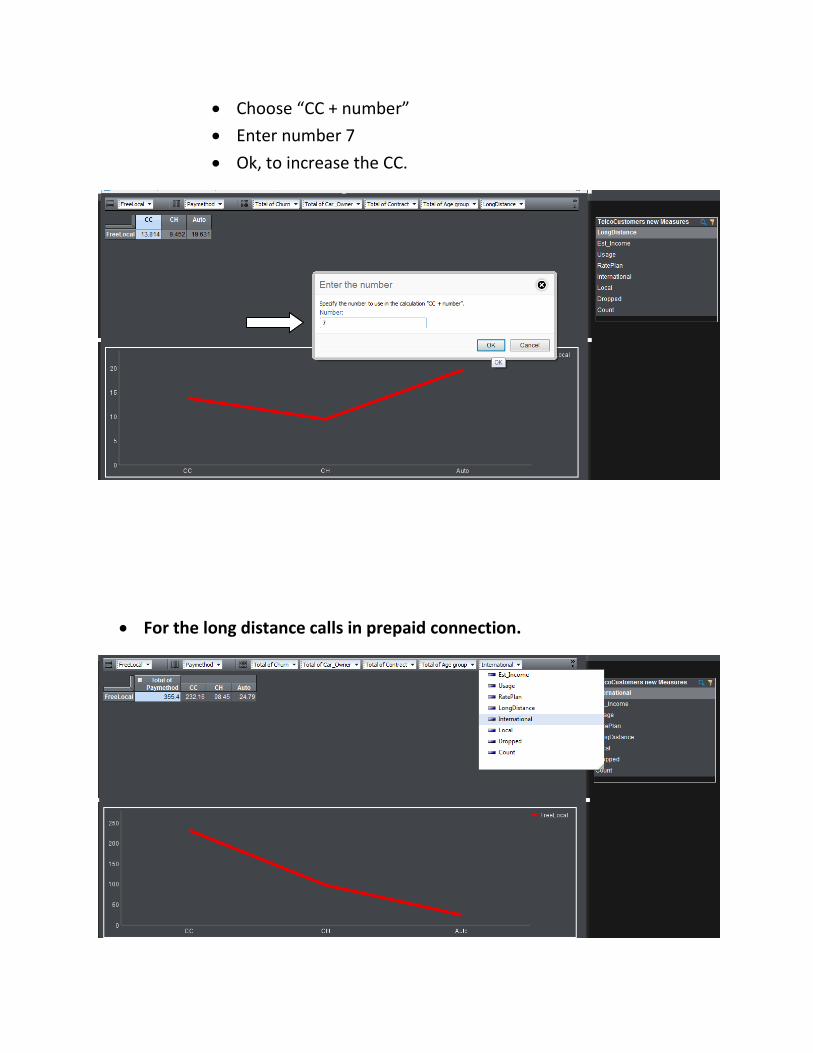
Choose “CC + number”
Enter number 7
Ok, to increase the CC.
For the long distance calls in prepaid connection.
Only CC customers use broadly the service. Auto customers very less, offer some
discount, if they choose cash payment option. CH (check), collaborate with banks
and apply some other policy to promote this service.
Conclusion is, prepaid Connection is not using the services broadly. In the
Payment methods we should focus and then add some policy to promote the
company.
Task 3 - Customer Segmentation & Customer Lifetime Value Analytics
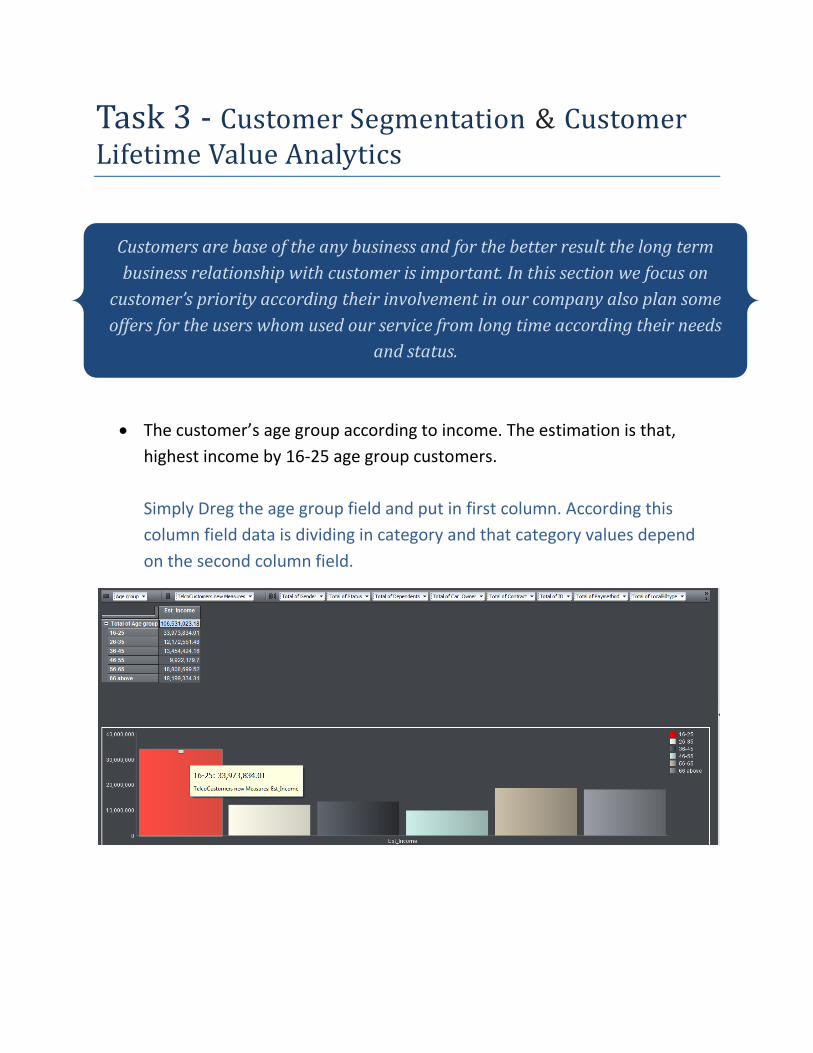
The customer’s age group according to income. The estimation is that,
highest income by 16-25 age group customers.
Simply Dreg the age group field and put in first column. According this
column field data is dividing in category and that category values depend
on the second column field.
Customers are base of the any business and for the better result the long term
business relationship with customer is important. In this section we focus on
customer’s priority according their involvement in our company also plan some
offers for the users whom used our service from long time according their needs
and status.
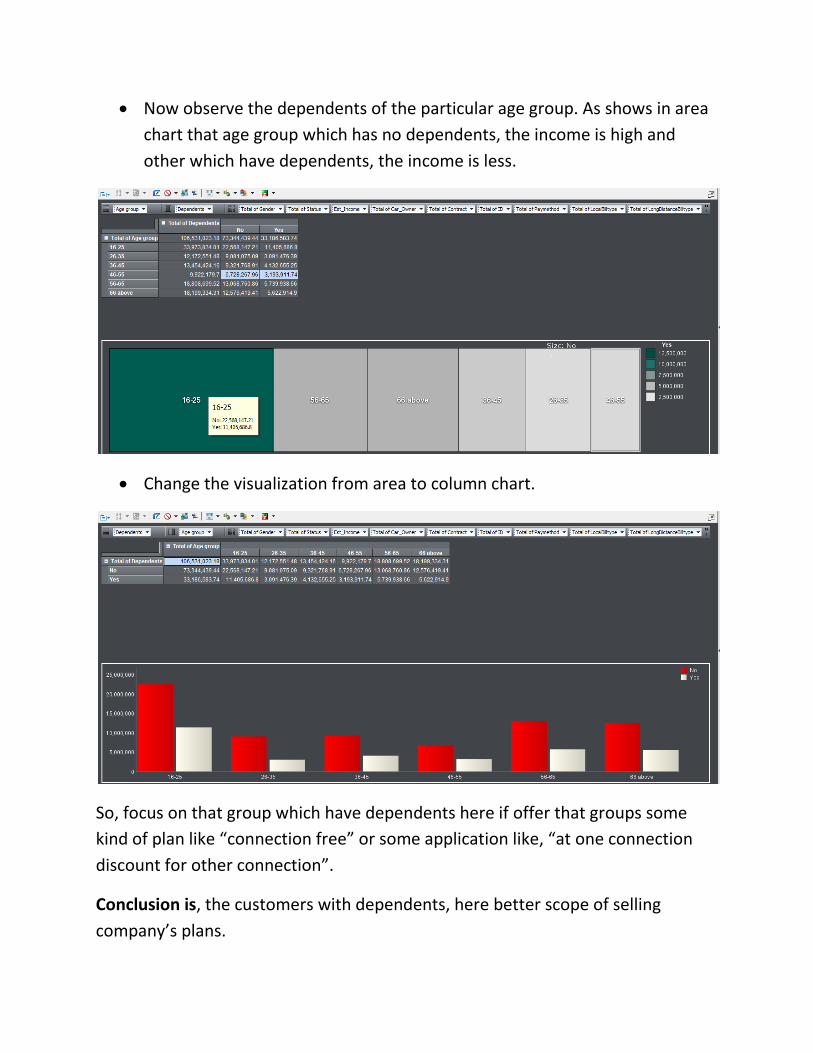
Now observe the dependents of the particular age group. As shows in area
chart that age group which has no dependents, the income is high and
other which have dependents, the income is less.
Change the visualization from area to column chart.
So, focus on that group which have dependents here if offer that groups some
kind of plan like “connection free” or some application like, “at one connection
discount for other connection”.
Conclusion is, the customers with dependents, here better scope of selling
company’s plans.
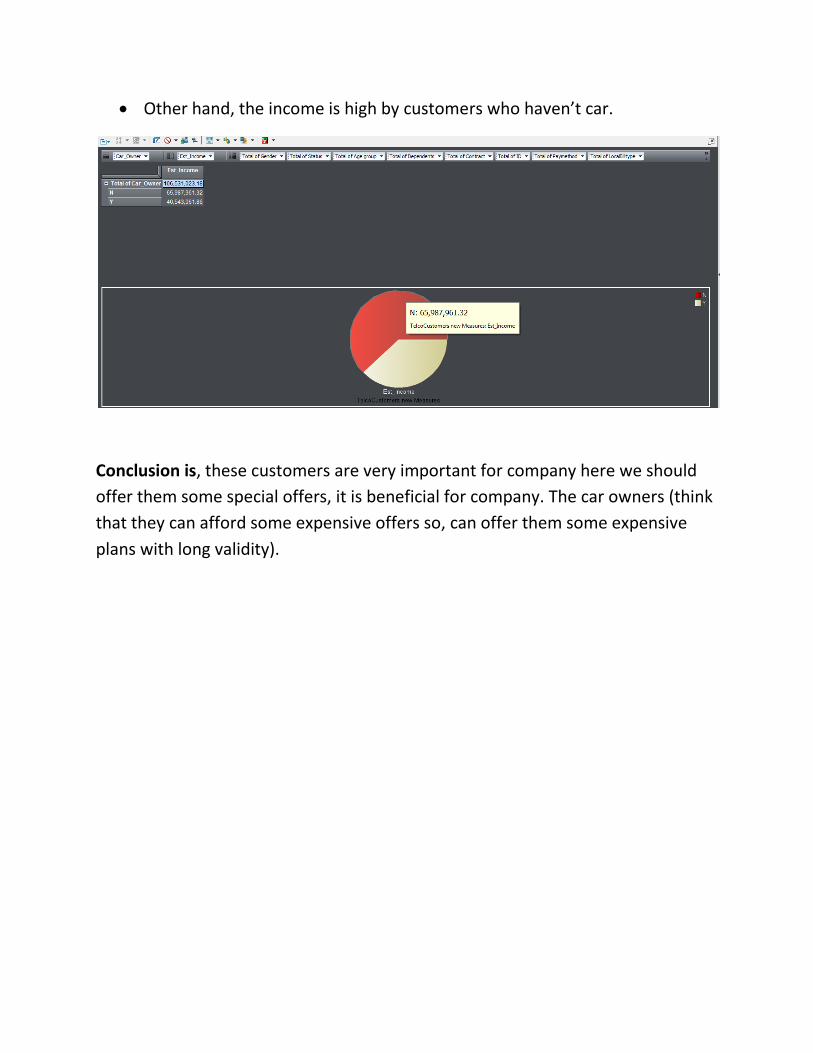
Other hand, the income is high by customers who haven’t car.
Conclusion is, these customers are very important for company here we should
offer them some special offers, it is beneficial for company. The car owners (think
that they can afford some expensive offers so, can offer them some expensive