32
The 2016 A.T. Kearney Foreign Direct Investment Confidence Index® FDI on the Rebound? Despite stalling globalization, business executives are turning to FDI for growth opportunities.

1The 2016 A.T. Kearney Foreign Direct Investment Confidence Index: FDI on the Rebound?
The 2016 A.T. Kearney Foreign Direct Investment Confidence Index®
FDI on the Rebound? Despite stalling globalization, business executives are turning to FDI for growth opportunities.
Over the nearly two-decade history of the Foreign Direct Investment (FDI) Confidence Index, I have observed executives’ interest in FDI wax and wane. So too have the FDI fortunes of key markets and regions of the world. The results of this year’s Index are the latest installment in this long-running story, with two important insights for business leaders.
1. The negative sentiment toward emerging markets that appeared in early 2015 is even more pronounced this year (with a few important exceptions).
Our immediate reaction to last year’s FDI Confidence Index results was one of genuine surprise: nearly three-fourths of all countries ranked in the top 25 were developed markets. As 2015 wore on, however, we saw the reasons for the lack of investor confidence in emerging markets. From China’s sub-7 percent growth to economic meltdown in Brazil, emerging markets teetered, spurred by a continued commodity slump, a very strong dollar, and volatile equity markets. In this year’s Index, emerging markets once again account for a small percentage of the top 25, only one-fifth, and now the reasons are more apparent.
However, we should emphasize that India leads a subset of Asian emerging markets that have defied this trend. All eyes were on the new government led by Prime Minister Narendra Modi, and they delivered 7.5% GDP growth. Accordingly, investor interest has grown and India rises two positions to claim ninth place in the Index. Taiwan is also back on the Index this year—along with Thailand.
2. Global investors are more strongly committed to FDI as a pillar of their future growth strategy.
Nearly three-quarters of global business executives report that they plan to increase their FDI in the next three years. This augurs well for those hoping globalization might still bounce back to its pre-2008 levels, despite the sustained dip in key traditional measures of global economic connectivity.
And while Europe fares particularly well again on this year’s Index (13 of the top 25 spots), the overall ranking shows that investors’ target markets are globally diversified, including a nearly even regional division of the top 10 spots between the Americas, Asia, and Europe.
Global economic growth remains well below where any of us wish it would be, and concerns are again growing about the potential for a financial crisis—this time from the developing world. Yet, investors tell us that a Brexit would diminish the FDI attractiveness of Britain and the EU broadly, much as the election of an extremist US presidential candidate of the right or left would undermine America’s investment worthiness.
These two insights serve to highlight how FDI trends both shape and are shaped by the broader functioning of the global economy. As always, we welcome any input you may have regarding the Index, its scope, and our analysis.
Paul A. Laudicina Chairman, Global Business Policy Council Partner and chairman emeritus, A.T. Kearney

1The 2016 A.T. Kearney Foreign Direct Investment Confidence Index: FDI on the Rebound?
Executive Summary• The United States tops the Foreign Direct Investment (FDI) Confidence Index for
the fourth year in a row. Global business executives are also more optimistic about the economic outlook for the United States than for any other country, with 42 percent of respondents more bullish on the American economy than they were a year ago. This is reflected in recent flows, with the United States having attracted an estimated $384 billion in FDI in 2015. However, a significant percentage of business executives say they would reduce FDI into the United States if Americans elect a populist (far-left or far-right) president in the November election.
• China claims second place in the FDI Confidence Index for the fourth consecutive year. This follows a decade in the top spot, demonstrating investors’ enduring interest in the Chinese market. However, investor sentiment on the Chinese economic outlook has turned decidedly more negative this year. This is likely because of the challenges of transitioning the country from an investment-led to a consumption-led economy while managing slower growth and significant equity and currency market volatility. Executives say they will reduce their FDI in China if market volatility persists.
• Europe continues to be a prime investment destination, accounting for 13 of the 25 countries in the 2016 FDI Confidence Index. Although this is a slight drop from an all-time high of 15 in last year’s Index, it demonstrates the perennial attractiveness of the European market to global business executives. Despite the rise of nontraditional political parties, continued geopolitical instability in Ukraine, a refugee crisis of unprecedented magnitude, and recent high-profile attacks in Paris and Brussels, the reality is that European economies continue to strengthen moderately. In addition, the regulatory environment in most European countries is welcoming of FDI, while a weakened euro makes investments in Europe a relatively good bargain. However, the looming possibility of a Brexit clearly weighs on executives’ minds, and if British voters ultimately choose to leave the European Union (EU), executives say they will invest less in both the United Kingdom and in the EU more generally. Perhaps as a result of this somewhat uncertain environment, investor interest in European economies is limited to developed markets, with European emerging markets notably absent from the Index this year.1
• For the second straight year, developed markets dominate the FDI Confidence Index. As recently as 2013, emerging markets comprised more than 50 percent of the countries on the FDI Confidence Index, and they accounted for about 70 percent of the countries in the 2010 edition. In contrast, in this year’s Index it is developed markets, not emerging ones, that capture eight of the top 10 spots and account for 80 percent of all the countries included. This likely reflects the fact that developed markets are once again the primary contributors to real GDP growth worldwide. And while 39 percent of global executives are seeking new investments in emerging markets, most of the BRICS have lost their luster—so investments in emerging markets are being spread across a wider range of countries than in the past.2
1 Throughout this report, “developed markets” is used to describe the countries that the IMF classifies as “advanced economies” based on high income per capita, high export diversification, and strong integration into the global financial system. “Emerging markets” are those countries that have middle levels of income per capita, offer a governance and regulatory environment that allows for some investment, and are somewhat integrated into the global financial system. “Frontier markets” are developing economies with generally low levels of income per capita, less advanced regulatory environments, and weak integration with the global financial system.
2 The BRICS are Brazil, Russia, India, China, and South Africa.
2The 2016 A.T. Kearney Foreign Direct Investment Confidence Index: FDI on the Rebound?
• Asian economies continue to perform well overall on FDI measures. Emerging and frontier markets in Asia attracted the highest FDI inflows of any region in the world in 2015, according to estimates from the United Nations Conference on Trade and Development (UNCTAD). Based on the results of this year’s FDI Confidence Index, we expect Asia will continue to be a favored FDI destination. India rises two places in the 2016 FDI Confidence Index, entering the top 10 after a one-year absence. In fact, India is the key exception to the overall trend of declining investor confidence in large emerging markets, and global executives are more optimistic about India’s economic outlook than about that of any other emerging market. Investor interest in Asia extends to developed markets as well. Singapore makes the largest leap in this year’s Index, rising five spots, and Japan and Australia rank in the top 10. In addition, two of the three newcomers to the Index this year are Taiwan and Thailand.
• At a time of slowing globalization, with global trade well below its 2007 peak, it appears that global executives are turning to FDI for growth opportunities. Global FDI flows jumped to an estimated $1.7 trillion in 2015—the highest level since 2007. Moreover, a vast majority of executives also believe that FDI will become more important for corporate profit-ability and competitiveness in the coming years, perhaps in part because of an increasing need to establish a local presence in countries where protectionist sentiment is on the rise. Accordingly, more than 70 percent of firms in our study plan to significantly or moderately increase their level of FDI in the next three years. The most commonly cited reasons for a planned increase in FDI are the availability of high-quality investment targets, the overall macroeconomic environment, and favorable foreign exchange dynamics.
• Global business executives are almost evenly split on the outlook for the global economy. One-half of investors are more optimistic than they were a year ago, while 44 percent are more pessimistic. While still positive in net terms, this is the least bullish outlook in several years. At the regional level, executives are most bullish about the Americas—led by top-ranked United States and third-ranked Canada in the FDI Confidence Index—and are most bearish about Sub-Saharan Africa.
• Investors see an increase in geopolitical tensions as the highest risk in the external environment for the second year in a row. This is followed by political and economic insta-bility in emerging markets, which is likely depressing the performance of emerging markets on the FDI Confidence Index. Commodity prices are a true wild card, though, with 28 percent of executives expecting prices to rise over the next year and 27 percent predicting they will fall.

3The 2016 A.T. Kearney Foreign Direct Investment Confidence Index: FDI on the Rebound?
The 2016 Foreign Direct Investment Confidence IndexThe United States and China once again claim the top two spots in the A.T. Kearney Foreign Direct Investment (FDI) Confidence Index, holding these respective positions for the fourth year in a row (see figure 1). These two countries have held steady at the top of the Index in the face of significant changes in the global operating environment over the past four years, including the ongoing economic slowdown in China, persistently low global oil and commodity prices, and the sharp appreciation of the US dollar. The sustained interest of global business executives in investing in the United States and China in the face of this volatility demonstrates the enduring attractiveness of the world’s two largest economies.
However, the gap between top-ranked United States and second-ranked China doubled from 0.10 points last year to 0.20 points in 2016. This is symptomatic of the widening US lead overall. Bullish sentiment among global business executives on the economic outlook for the United States reinforces this trend. More broadly, executives’ outlook on the US economy is
High confidenceLow confidence
0.00 1.00 2.500.50 2.001.50
Note: Values are calculated on a 0 to 3 scale, with 3 being the highest level of confidence in a market as a future destination for FDI.
Source: 2016 A.T. Kearney Foreign Direct Investment Confidence Index
Figure 1 2016 A.T. Kearney FDI Confidence Index®
Ranking
United StatesChina
CanadaGermany
United KingdomJapan
AustraliaFrance
IndiaSingapore
SwitzerlandBrazilSpain
NetherlandsTaiwan
ItalySouth Korea
MexicoBelgium
DenmarkThailandSweden
IrelandAustria
Norway
2.021.82
1.801.75
1.731.73
1.631.601.60
1.571.541.53
1.511.511.50
1.481.47
1.451.44
1.421.421.42
1.401.391.39
123456789
10111213141516171819202122232425
124537
1081115146
1713–
12169
1920
–18–
2124
12364
198
1079
145
1822
–20
–122123
–16–––
201620152014
Score
Maintains ranking Moves up Moves down

4The 2016 A.T. Kearney Foreign Direct Investment Confidence Index: FDI on the Rebound?
considerably more positive today than it was in 2015, with the same holding true for other large developed markets such as Germany, the United Kingdom, and Japan (see figure 2). In contrast, global executives have grown less optimistic over the past year about the economic prospects of most of the emerging markets in the Index, with the notable exception of India.
For the second year in a row, global business executives express a notable preference for investing in developed markets. Eight of the top 10 spots in the 2016 FDI Confidence Index are developed markets, up from seven in 2015. Developed markets also dominate the overall Index this year, claiming 80 percent of the 25 spots. This is similar to last year, but is a stark contrast with earlier FDI Confidence Indexes. For instance, as recently as 2013, emerging markets made up more than 50 percent of the countries on the Index, and they accounted for about 70 percent of the countries in the 2010 and 2007 editions.
This marks a dramatic shift in investor preference from emerging to developed markets. It appears to be driven by both a flight to the (perceived) safety of more familiar developed markets and by the slowdown of economic growth in China and other emerging markets. In fact, for the second year in a row, only three of the BRICS countries appear on the Index: China, India, and Brazil. Russia last appeared on the Index in 2013, while South Africa dropped off the list in 2015.
Figure 2 Optimism continues to rise for large developed markets
United StatesCanada
GermanyUnited Kingdom
AustraliaSweden
JapanSingapore
SwitzerlandIndia
AustriaTaiwan
DenmarkIreland
BelgiumSouth KoreaNetherlands
NorwayFrance
ThailandSpain
MexicoItaly
BrazilChina
14%14%14%
13%14%
13%16%
15%13%
17%14%
17%12%
14%15%
18%16%16%
21%16%
19%18%
20%25%
32%
42%39%
37%33%
32%29%
31%31%
28%32%
25%28%
23%23%
22%25%
23%23%
27%22%
24%22%
23%24%
28%
40 50302010010203040
Compared to one year ago, are you more optimistic or more pessimistic about the country’s economic outlook for the next three years?%
More pessimistic
More optimistic
Note: Countries are listed in descending order of the net score (more optimistic – more pessimistic).
Source: 2016 A.T. Kearney Foreign Direct Investment Confidence Index
5The 2016 A.T. Kearney Foreign Direct Investment Confidence Index: FDI on the Rebound?
Related to the high concentration of developed markets in the Index is global business execu-tives’ continuing preference for investing in Europe. European countries account for 13 of the 25 countries in the 2016 FDI Confidence Index, down slightly from an all-time high of 15 in last year’s edition. Notably absent from the Index this year, though, are European emerging markets: all 13 of the European countries in the top 25 are developed markets.
Newcomers to the FDI Confidence Index in 2016 are Taiwan, Thailand, and Ireland. Singapore makes the largest leap up the Index, rising an impressive five spots since last year. Taken together, these developments highlight growing investor interest in Asia. This is hardly surprising. In spite of the economic slowdown in China, the regional economic outlook for Asia is among the strongest in the world. Taiwan, Thailand, and Singapore are also all very open and globally integrated economies. On the other hand, the countries that have dropped the most in the Index since 2015 are Brazil (–6) and Mexico (–9), the two largest economies in a Latin America that has been hit hard by the sustained drop in global commodity prices. The countries that were in the Index last year but do not appear this year are Finland, Poland, and Turkey.
There is growing investor interest in Asia, in part because its regional economic outlook is among the strongest in the world.Overall, the average score in the 2016 FDI Confidence Index is much lower than in recent years, at just 1.56 this year compared to about 1.75 in each of the three previous years. At the same time, however, executives tell us that they plan to increase their FDI levels in the coming years (see Investors Plan to Continue Increasing FDI on page 7). The lower average scores, then, are likely driven by uncertainty about which markets will be the best bets in the medium term, rather than by lower interest in FDI overall. The global economic outlook, as well as the outlook for country economies around the world, remains highly unpredictable. After more than a decade of emerging-market-led global growth, developed markets are now the primary engines. Business executives are unsure how long this new reality will last and seemingly have incorporated this wild card into their medium-term FDI outlook, leading to fewer “high likelihood” and “medium likelihood” responses on investing in individual markets—and more “low likelihood” responses. This suggests that although companies will continue to engage in FDI, it has become increasingly difficult for them to determine where to invest.
FDI Flows Jumped in 2015, Led by Developed Markets and M&AsAlthough globalization has appeared to be on hiatus since the Global Financial Crisis, with key indicators such as global trade and international investment flows remaining below their precrisis peaks, FDI seems to have bucked this trend in 2015.3 After a dramatic drop in value in 2014, early estimates by UNCTAD indicate that global FDI inflows soared last year to $1.7 trillion—the highest level since 2007—on the back of a sharp increase in investment in developed
3 For more information on the hiatus in globalization, see From Globalization to Islandization, A.T. Kearney Global Business Policy Council, January 2016.

6The 2016 A.T. Kearney Foreign Direct Investment Confidence Index: FDI on the Rebound?
markets (see figure 3).4 The fact that developed markets received the majority of global FDI inflows last year (for the first time since 2011) tracks with the results of the 2015 FDI Confidence Index, in which developed markets dominated the top 25 slots.
On a regional basis, emerging and frontier markets in Asia (“developing Asia”) continued to attract the greatest volume of FDI inflows. North America (the United States and Canada), however, saw the highest growth in FDI inflows in 2015, with FDI rising by an estimated 194 percent (see figure 4).
Sources: UN Conference on Trade and Development; A.T. Kearney analysis
Figure 3Global FDI jumped in 2015, driven by flows to developed markets
Global FDI inflows$ billion
0
500
1,000
1,500
2,000
20072006 2008 2009 2010 2011 2012 2013 2014 2015e
World
Emerging and frontier markets
Developed markets
4 The UNCTAD estimates on 2015 FDI flows will be revised when the final data is released in June 2016.
Note: These regional groupings are the only ones for which UNCTAD provides data in their 2015 estimate release.
Sources: UN Conference on Trade and Development; A.T. Kearney analysis
Figure 4Asia, North America, and Europe dominate as destinations for global FDI flows
2013 2014 2015e
DevelopingAsia
North America EuropeanUnion
Latin Americaand Caribbean
Africa
428475
548
301
146
429
333
254
426
181 170 151
54 55 38100
4922
Eurasia0
100
200
300
400
500
600
FDI inflows by region$ billion
7The 2016 A.T. Kearney Foreign Direct Investment Confidence Index: FDI on the Rebound?
The United States accounted for the vast majority of this increase, as its FDI inflows suffered a dramatic one-year hit in 2014 because of a single significant divestment. The EU enjoyed the second-highest growth rate in FDI inflows in 2015, followed by markets in developing Asia. UNCTAD estimates that FDI inflows to Latin America fell by about 11 percent, while those to Africa and Eurasia dropped by 31 and 54 percent, respectively.
A look at the different modes of FDI shows that last year’s growth was due almost entirely to mergers and acquisitions (M&A), rather than greenfield investments. Cross-border M&A transaction volumes increased by 61 percent last year, from $399 billion in 2014 to $644 billion in 2015. On the other hand, greenfield FDI projects grew less than 1 percent, from $714 billion in 2014 to just $721 billion in 2015.
Last year’s growth in FDI was due almost entirely to mergers and acquisitions, rather than greenfield investments.The industries that posted the highest number of cross-border M&A deals include healthcare, real estate, finance, computers and electronics, and telecommunications, according to data from Dealogic. Unsurprisingly, some of the largest cross-border M&A deals of 2015 were also in these sectors. The largest cross-border M&A deal of the year, according to Dealogic, was German healthcare giant Merck’s acquisition of US chemicals firm Sigma-Aldrich for $17 billion. Another megadeal nearly as large was the $16.8 billion acquisition of US computer and electronics firm Freescale Semiconductor by the Dutch company NXP Semiconductors. And Swiss health- care company Novartis acquired GlaxoSmithKline’s oncology portfolio and its R&D activities in the United Kingdom for $16 billion.
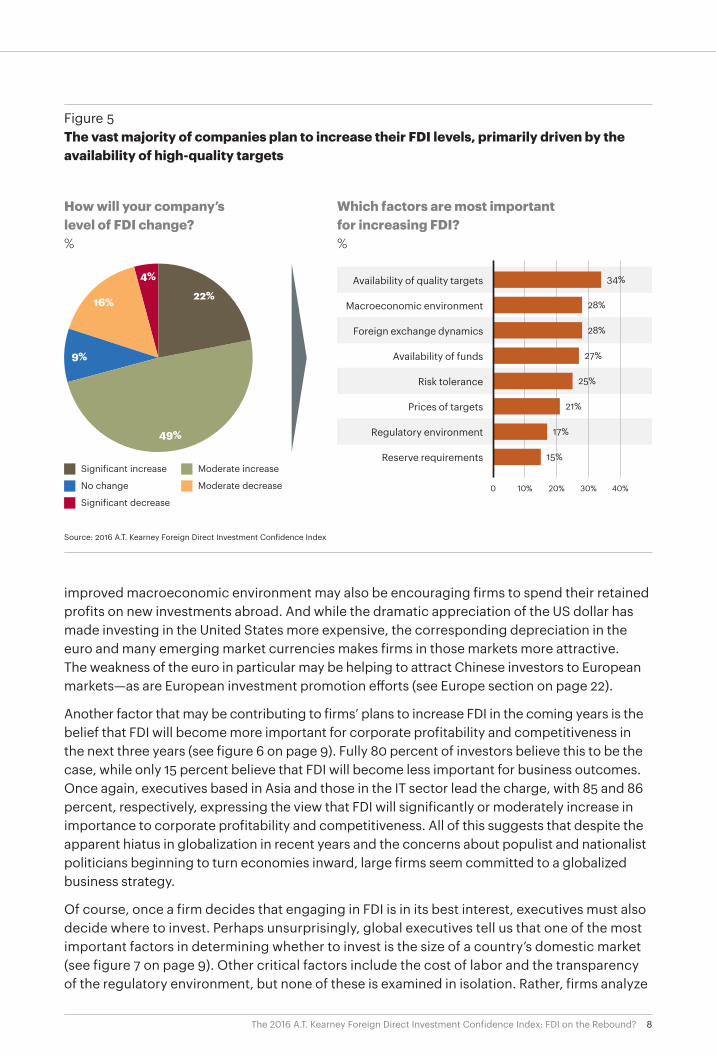
Investors Plan to Continue Increasing FDIGlobal business executives tell us that they plan to continue to invest more internationally. This signals that 2015 may be the start of a new trend in FDI growth, even as other measures of globalization languish. One possible explanation for this seeming contradiction is that companies are thinking about establishing a local presence in markets where protectionist sentiments threaten to take hold. Indeed, more than 70 percent of firms in our survey plan to significantly or moderately increase their level of FDI over the next three years (see figure 5 on page 8). Investors headquartered in the Asia Pacific region are more interested to increase FDI than their European and Americas counterparts, with 74 percent planning to boost invest-ments. Firms in the IT sector are most bullish on their FDI plans, with 79 percent planning to raise FDI in the years ahead.5
Among firms that plan to increase FDI, the most commonly cited reason is the availability of attractive targets, which perhaps have proliferated because the lower relative volume of FDI in recent years has created a backlog of high-quality direct-investment targets. The somewhat
5 The executives we surveyed work at three types of firms: industrial firms (primary goods, aerospace and defense, infrastructure and construction, telecommunications and utilities, heavy industry, and light industry), service-sector firms (transportation, healthcare and pharmaceuticals, wholesale and retail, financial services, and nonfinancial services—excluding IT), and IT firms.
8The 2016 A.T. Kearney Foreign Direct Investment Confidence Index: FDI on the Rebound?
improved macroeconomic environment may also be encouraging firms to spend their retained profits on new investments abroad. And while the dramatic appreciation of the US dollar has made investing in the United States more expensive, the corresponding depreciation in the euro and many emerging market currencies makes firms in those markets more attractive. The weakness of the euro in particular may be helping to attract Chinese investors to European markets—as are European investment promotion efforts (see Europe section on page 22).
Another factor that may be contributing to firms’ plans to increase FDI in the coming years is the belief that FDI will become more important for corporate profitability and competitiveness in the next three years (see figure 6 on page 9). Fully 80 percent of investors believe this to be the case, while only 15 percent believe that FDI will become less important for business outcomes. Once again, executives based in Asia and those in the IT sector lead the charge, with 85 and 86 percent, respectively, expressing the view that FDI will significantly or moderately increase in importance to corporate profitability and competitiveness. All of this suggests that despite the apparent hiatus in globalization in recent years and the concerns about populist and nationalist politicians beginning to turn economies inward, large firms seem committed to a globalized business strategy.
Of course, once a firm decides that engaging in FDI is in its best interest, executives must also decide where to invest. Perhaps unsurprisingly, global executives tell us that one of the most important factors in determining whether to invest is the size of a country’s domestic market (see figure 7 on page 9). Other critical factors include the cost of labor and the transparency of the regulatory environment, but none of these is examined in isolation. Rather, firms analyze
Source: 2016 A.T. Kearney Foreign Direct Investment Confidence Index
Figure 5The vast majority of companies plan to increase their FDI levels, primarily driven by the availability of high-quality targets
How will your company’s level of FDI change? %
22%
49%
9%
16%
4%
Moderate increase Significant increase
No change
Significant decrease
Which factors are most important for increasing FDI? %
Macroeconomic environment
Foreign exchange dynamics
Availability of funds
Risk tolerance
Prices of targets
Regulatory environment
Reserve requirements
Availability of quality targets
0 10% 20% 30% 40%
34%
28%
28%
27%
25%
21%
17%
15%
Moderate decrease

9The 2016 A.T. Kearney Foreign Direct Investment Confidence Index: FDI on the Rebound?
Note: Respondents were asked to pick their top two factors. As a result, percentages do not add up to 100.
Source: 2016 A.T. Kearney Foreign Direct Investment Confidence Index
Figure 7 Both market assets and governance are key factors that investors consider when making FDI decisions
Domestic market size
Cost of labor
Regulatory transparency and lack of corruption
General security environment
E�iciency of legal and regulatory processes
Technological and innovation capabilities
Tax rates and ease of tax payment
Talent and skill level of labor pool
Ease of moving capital into and out of the country
Availability of financial capital in domestic market
Government incentives for investors
R&D capabilities
Regional or bilateral trade agreements
Strength of investor and property rights
Availability of raw materials and other inputs
Availability of land or real estate
Quality of transportation infrastructure
Quality of electricity infrastructure
Quality of telecommunications infrastructure
What are the most important overall factors for where to make investments?%
Market assets and infrastructure factors Governance and regulatory factors
0 2 4 6 8 10 12 14 16
15%
15%
15%
14%
13%
13%
12%
12%
11%
11%
11%
9%
9%
8%
7%
6%
6%
5%
5%
Source: 2016 A.T. Kearney Foreign Direct Investment Confidence Index
Figure 6Investors overwhelmingly believe FDI will drive future profitability and competitiveness
How important will FDI be to profitability and competitiveness?%
Significantlymore important
Moderatelymore important
No change Moderatelyless important
Significantlyless important
13%
5%
54%
26%
2%0
10
20
30
40
50
60

10The 2016 A.T. Kearney Foreign Direct Investment Confidence Index: FDI on the Rebound?
a combination of many market assets and governance factors to assess the attractiveness of a market as an FDI destination. This emphasizes the growing complexity associated with FDI decisions.
Some distinctions do emerge, however, between firms in different regions and sectors. Asian firms are most concerned with the cost of labor and the security environment, while firms in the Americas focus more on the talent of the labor force and European firms prioritize market size. Service-sector firms also place high importance on domestic market size, in addition to the transparency of government regulations. In contrast, industrial firms focus more on the cost of labor and the security environment, which is only natural since their FDI projects are usually fixed investments with longer time horizons. Also intuitive is the fact that IT firms value the technological and innovation capabilities of a market above all other factors, although they also place heavy emphasis on the related market characteristics of labor force talent and R&D capabilities.
These factors lead global business executives to focus on different types of markets as FDI destinations. Most of them prefer FDI opportunities in developed and emerging markets (rather than frontier markets), with 75 and 76 percent of firms planning to either maintain or seek new investments in these types of markets, respectively (see figure 8). While this indicates that the vast majority of investors are looking in all the usual places for FDI opportunities, many investors also have an appetite for frontier markets. Some 48 percent of global execu-tives have already invested in frontier markets and tell us that they plan to maintain or increase their investments, while another 21 percent have not yet invested in frontier markets but are seeking opportunities to do so. Executives of companies based in Asia and of industrial firms are the most interested in investing in frontier markets.
Source: 2016 A.T. Kearney Foreign Direct Investment Confidence Index
Figure 8Developed and emerging markets still attract the most investor attention
How would you characterize your company’s investments in each type of market?%
Developed markets Emerging markets Frontier markets
Not currentlyinvested, and not
seeking investmentopportunities
Currentlyinvested, but
seeking todivest
Not currentlyinvested, butseeking newinvestment
opportunities
Currently invested, and
maintaining levelof investment
Currentlyinvested, andseeking newinvestment
opportunities
0
10
20
30
40
50
5% 5%
15%20% 19% 17%
13% 14%21%
36% 38%
26% 24%19%
29%
11The 2016 A.T. Kearney Foreign Direct Investment Confidence Index: FDI on the Rebound?
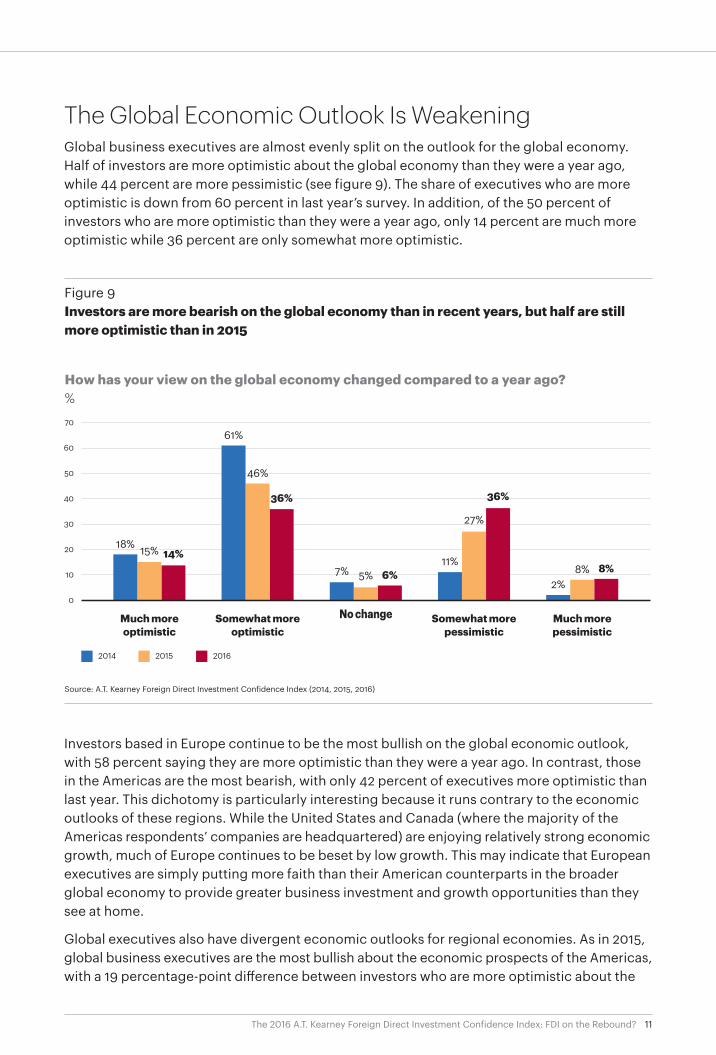
The Global Economic Outlook Is WeakeningGlobal business executives are almost evenly split on the outlook for the global economy. Half of investors are more optimistic about the global economy than they were a year ago, while 44 percent are more pessimistic (see figure 9). The share of executives who are more optimistic is down from 60 percent in last year’s survey. In addition, of the 50 percent of investors who are more optimistic than they were a year ago, only 14 percent are much more optimistic while 36 percent are only somewhat more optimistic.
Investors based in Europe continue to be the most bullish on the global economic outlook, with 58 percent saying they are more optimistic than they were a year ago. In contrast, those in the Americas are the most bearish, with only 42 percent of executives more optimistic than last year. This dichotomy is particularly interesting because it runs contrary to the economic outlooks of these regions. While the United States and Canada (where the majority of the Americas respondents’ companies are headquartered) are enjoying relatively strong economic growth, much of Europe continues to be beset by low growth. This may indicate that European executives are simply putting more faith than their American counterparts in the broader global economy to provide greater business investment and growth opportunities than they see at home.
Global executives also have divergent economic outlooks for regional economies. As in 2015, global business executives are the most bullish about the economic prospects of the Americas, with a 19 percentage-point difference between investors who are more optimistic about the
Source: A.T. Kearney Foreign Direct Investment Confidence Index (2014, 2015, 2016)
Figure 9Investors are more bearish on the global economy than in recent years, but half are still more optimistic than in 2015
How has your view on the global economy changed compared to a year ago?%
2014 2015 2016
Much moreoptimistic
Somewhat moreoptimistic
No change Somewhat morepessimistic
Much morepessimistic
30
50
40
60
70
20
10
0
36%
18% 15% 14%
61%
46%
36%
7% 5% 6%11%
27%
2%8% 8%

12The 2016 A.T. Kearney Foreign Direct Investment Confidence Index: FDI on the Rebound?
Source: 2016 A.T. Kearney Foreign Direct Investment Confidence Index
Figure 10Investors are most optimistic about the economic outlook in the Americas
How has your view on regional economies changed compared to a year ago?%
More optimistic About the same More pessimistic
Americas Europe andEurasia
Asia Pacific Middle Eastand North Africa
36%
47%
17%
37%
42%
21%
37%41%
22% 20%
48%
32%
17%
52%
31%
Sub-SaharanAfrica
30
50
40
60
20
10
0
Americas regional economy than they were a year ago and those who are more pessimistic (see figure 10). The other regions in which optimism outweighs pessimism are Europe and Eurasia (16 percentage-point difference) and Asia Pacific (15 percentage-point difference). On the flip side, global business executives are more pessimistic than optimistic than they were a year ago about the Middle East and North African economy (12 percentage-point difference) and the Sub-Saharan African economy (14 percentage-point difference).
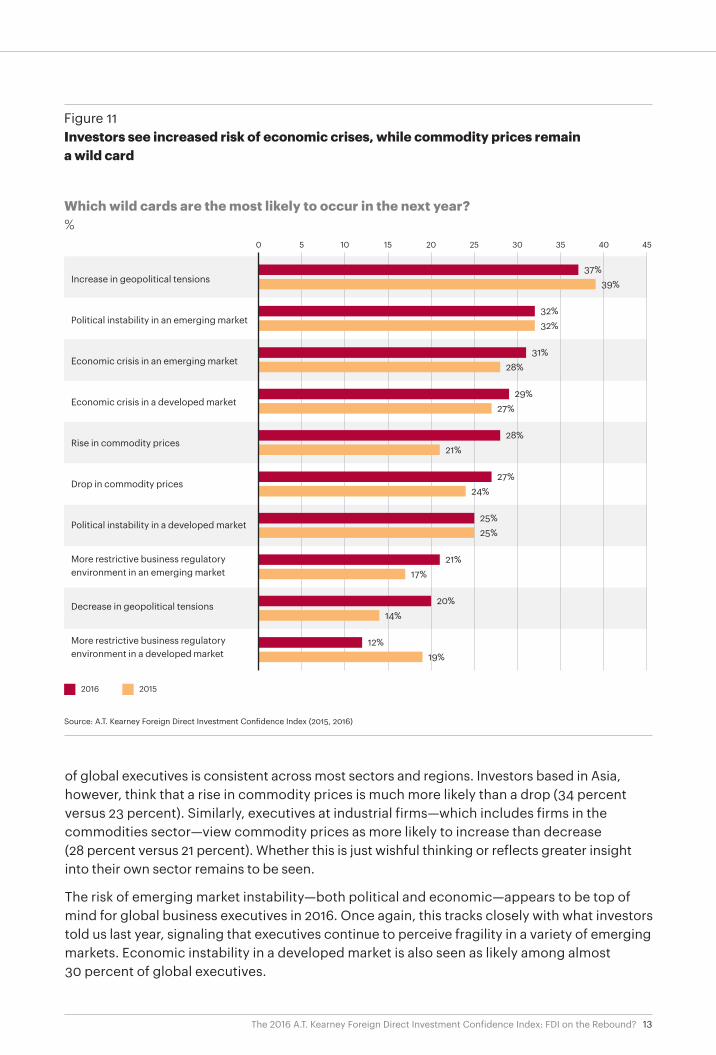
Geopolitics Still Tops Wild Card Risks, but the Risk of Economic Crises Is RisingInvestors see an increase in geopolitical tensions as the most likely wild card event in the next year—the same risk that topped the list of wild cards in 2015 (see figure 11 on page 13). However, the number of investors who think that geopolitical tensions are likely to increase has fallen slightly this year compared to last year. This makes sense given recent events. The geopolitical confrontation between Russia on the one hand and the United States and the EU on the other is less of a headline news story than it was a year ago, while the lifting of Iranian sanctions was an important step in bringing Iran back into the international economy. But tensions persist in both of these cases, even as geopolitical hot spots continue to flare throughout the Middle East and East Asia.
While a strong plurality of global business executives expect geopolitical risks to increase, their views on the evolution of commodity prices are almost evenly split: 28 percent expect them to rise, versus 27 percent who expect them to fall. This rough split in the commodity-price forecast
13The 2016 A.T. Kearney Foreign Direct Investment Confidence Index: FDI on the Rebound?
of global executives is consistent across most sectors and regions. Investors based in Asia, however, think that a rise in commodity prices is much more likely than a drop (34 percent versus 23 percent). Similarly, executives at industrial firms—which includes firms in the commodities sector—view commodity prices as more likely to increase than decrease (28 percent versus 21 percent). Whether this is just wishful thinking or reflects greater insight into their own sector remains to be seen.
The risk of emerging market instability—both political and economic—appears to be top of mind for global business executives in 2016. Once again, this tracks closely with what investors told us last year, signaling that executives continue to perceive fragility in a variety of emerging markets. Economic instability in a developed market is also seen as likely among almost 30 percent of global executives.
Source: A.T. Kearney Foreign Direct Investment Confidence Index (2015, 2016)
Figure 11 Investors see increased risk of economic crises, while commodity prices remain a wild card
Increase in geopolitical tensions
Political instability in an emerging market
Economic crisis in an emerging market
Economic crisis in a developed market
Rise in commodity prices
Drop in commodity prices
Political instability in a developed market
More restrictive business regulatoryenvironment in an emerging market
Decrease in geopolitical tensions
More restrictive business regulatoryenvironment in a developed market
Which wild cards are the most likely to occur in the next year?%
2016 2015
37%
32%
31%
29%
28%
27%
25%
21%
20%
12%
39%
32%
28%
27%
21%
24%
25%
17%
14%
19%
0 5 10 15 20 25 30 35 40 45
14The 2016 A.T. Kearney Foreign Direct Investment Confidence Index: FDI on the Rebound?
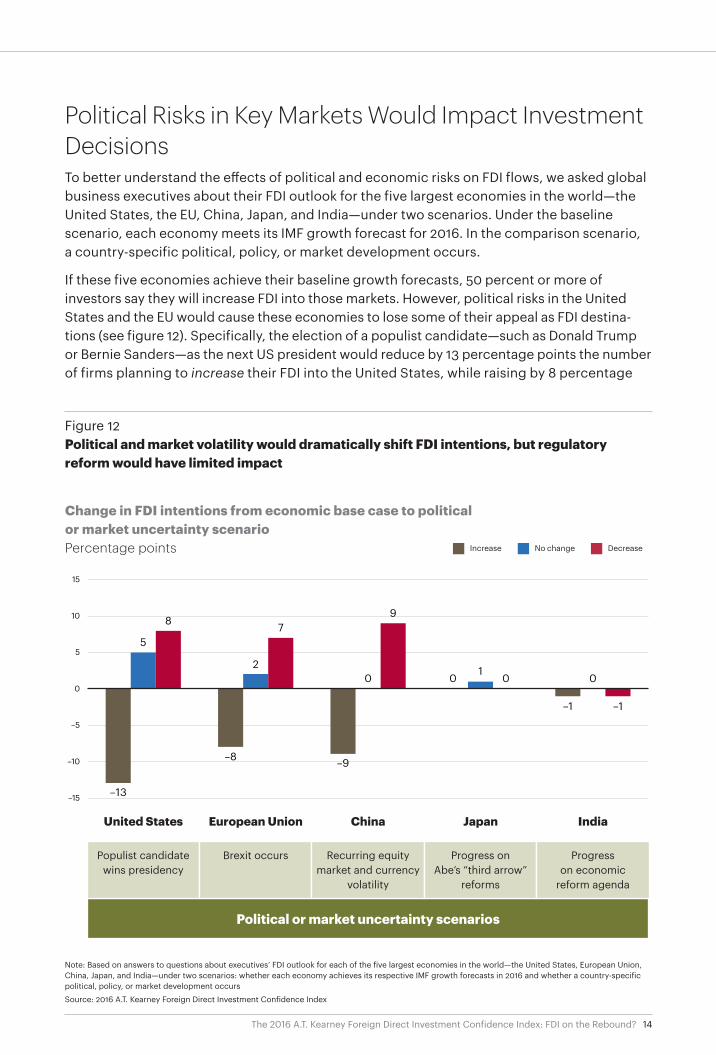
Political Risks in Key Markets Would Impact Investment DecisionsTo better understand the effects of political and economic risks on FDI flows, we asked global business executives about their FDI outlook for the five largest economies in the world—the United States, the EU, China, Japan, and India—under two scenarios. Under the baseline scenario, each economy meets its IMF growth forecast for 2016. In the comparison scenario, a country-specific political, policy, or market development occurs.
If these five economies achieve their baseline growth forecasts, 50 percent or more of investors say they will increase FDI into those markets. However, political risks in the United States and the EU would cause these economies to lose some of their appeal as FDI destina-tions (see figure 12). Specifically, the election of a populist candidate—such as Donald Trump or Bernie Sanders—as the next US president would reduce by 13 percentage points the number of firms planning to increase their FDI into the United States, while raising by 8 percentage
Note: Based on answers to questions about executives’ FDI outlook for each of the five largest economies in the world—the United States, European Union,China, Japan, and India—under two scenarios: whether each economy achieves its respective IMF growth forecasts in 2016 and whether a country-specificpolitical, policy, or market development occurs
Source: 2016 A.T. Kearney Foreign Direct Investment Confidence Index
Figure 12Political and market volatility would dramatically shift FDI intentions, but regulatoryreform would have limited impact
United States European Union China Japan India
Change in FDI intentions from economic base case to politicalor market uncertainty scenarioPercentage points Increase No change Decrease
–15
–10
–5
0
5
10
15
–13
–8 –9
0
–1
5
20
10
8 79
0
–1
Political or market uncertainty scenarios
Populist candidatewins presidency
Brexit occurs Recurring equitymarket and currency
volatility
Progress onAbe’s “third arrow”
reforms
Progresson economic
reform agenda

15The 2016 A.T. Kearney Foreign Direct Investment Confidence Index: FDI on the Rebound?
points the number of firms that would decrease their US investments. The survey results suggest that the effects of a Brexit would have a somewhat lesser impact on FDI to the EU, but would still be significant: firms increasing their FDI there would decline by 8 percentage points, while firms decreasing their EU investment would rise by 7 percentage points.
Similarly, continued equity market and currency volatility in China—as experienced most recently in January 2016—would negatively affect global executives’ willingness to invest there. Such market volatility would reduce by 9 percentage points the number of investors seeking to increase FDI there and raise the number of those who would actively decrease their investments in China by the same amount.
In contrast, the implementation of proposed reform agendas in Japan and India would have almost no effect on FDI intentions for those markets. In either scenario, about 60 percent of executives say they would increase FDI into India, while 50 percent would do so in Japan. This is somewhat surprising, as part of the purpose of reforms in both Japan and India is to increase foreign business investment. But the muted reaction by global executives signals that investors may think reforms will not affect the economics of investing in those markets—at least in the near to medium term.
Regional Findings and ContextAmericas
United States
As the top-ranked FDI destination for the fourth year in a row, the United States is proving resilient to the downside risks other countries face as the global economy struggles to pick up momentum. Private consumption, job creation, and continuing wage growth will continue to play crucial supporting roles in the economy, offsetting many of the negative competitiveness effects of a strong dollar.
While foreign investors are drawn to the strong economic performance of the United States compared to other developed markets and many emerging markets, FDI inflows could be affected by political risks in a crucial presidential election year. One issue is that political gridlock is rising to new levels, so reforms that would improve the business environment and encourage more investment are unlikely to be passed into law by Congress.
Another potentially more damaging effect would be the election of a candidate from outside the US political mainstream (for example, Donald Trump or Bernie Sanders). According to our survey, the number of companies increasing their FDI into the United States would decline by 13 percentage points if such an event were to occur. Business executives from Asia and the Americas are the most concerned about a non-mainstream candidate winning the US presi-dency. The share of companies from these regions that would increase their FDI into the United States would fall by nearly 20 percentage points if a populist candidate wins the White House.
FDI inflows into the United States, however, demonstrate investor confidence in the steady recovery of the United States so far. UNCTAD estimates that FDI inflows reached $384 billion in 2015, the highest number since 2000. This marks a significant recovery from 2014, when FDI inflows to the United States hit a 10-year low.

16The 2016 A.T. Kearney Foreign Direct Investment Confidence Index: FDI on the Rebound?
Foreign investor interest in the US market is widespread, but three sources in particular stand out. The first is Japan, which was the largest source of FDI in the United States in 2015 (with $36 billion in investments) according to the US Bureau of Economic Analysis. Canada, another long-standing source of FDI in the United States, continues to show strong interest in American companies and was the largest originator of foreign M&As in 2015, according to Dealogic. One of the biggest M&A deals in the United States was the acquisition of Salix Pharmaceuticals by Canada’s Valeant Pharmaceuticals for $15.9 billion. However, China is quickly becoming the fastest growing source of FDI in the United States. In just the first half of 2015, China invested $6.4 billion in 88 transactions, according to Rhodium Group, the highest semester on record.
The Valeant-Salix deal was part of a broader trend of FDI into the American pharmaceutical sector. Other significant acquisitions include the UK company Shire’s $5.2 billion acquisition of NPS Pharmaceuticals, Israel’s Teva acquiring Auspex for $3.5 billion, and Japan’s Otsuka purchasing Avanir for $3.5 billion. The largest pharmaceutical M&A deal of 2015 was the German firm Merck’s purchase of Sigma-Aldrich for $17 billion.
Foreign investor interest in the US market is widespread, but three sources in particular stand out: Japan, Canada, and China.
Canada
Canada gains one spot to rank third in this year’s FDI Confidence Index. The economy experi-enced a slight slowdown in growth to 1.2 percent in 2015 due to the global resource slump cycle, but is forecast to return to 1.5 percent growth in 2016 and to continue this upward trend in coming years.
Long-awaited reforms under the Investment Canada Act are making Canada an increasingly attractive FDI destination. Before April 2015, private-sector foreign investments of more than $283 million were subject to a prior government review of net benefits; now the threshold is $459 million, and it will increase to $766 million by 2019. However, the Harper government, now out of office, also introduced new regulations requiring greater disclosure of foreign invest-ments that come in below the threshold and lengthening the national security review process from 130 days to 200 days. It remains to be seen whether the government of Prime Minister Justin Trudeau, who took office in November 2015, will enact further FDI regulations.
In 2015, FDI inflows fell to an estimated $45 billion (down from $54 billion in 2014), continuing a trend of declining inflows after peaking at $70.6 billion in 2013. Among the largest transactions in 2015 were the purchase of Talisman Energy by Spain’s Repsol for $13.4 billion and the $2.3 billion acquisition of Shred-it International by US firm Stericycle. Despite the ongoing slump in global commodity prices, analysts expect the oil and gas and mining industries to continue to drive FDI inflows to Canada over the next several years.
Brazil
After more than five years in the top 10 of the FDI Confidence Index, Brazil drops significantly in the rankings—from sixth place in 2015 to 12th place in 2016. This is likely because of the

17The 2016 A.T. Kearney Foreign Direct Investment Confidence Index: FDI on the Rebound?
country’s worst recession in more than two decades, with the economy having contracted 3.8 percent in 2015 and forecast to shrink another 3.8 percent this year. Investors may also be concerned about Brazil’s business environment, in the wake of ongoing corruption scandals and record-low consumer confidence.
FDI inflows to Brazil dropped 12 percent from $62 billion in 2014 to an estimated $56 billion in 2015. Greenfield FDI has been falling at alarming rates since its peak in 2011, when more than 500 projects valued at a total of $50 billion were started. In more recent years, the number of projects dropped from 117 in the first quarter of 2014 to just 56 during the same period in 2015. However, investor interest appears to remain high in some sectors of the Brazilian economy, such as telecommunications. For instance, the biggest M&A deal in Brazil last year was the $9.9 billion acquisition of Global Village Telecom by Spain’s Telefónica.
Mexico
Mexico falls nine spots to 18th this year, its lowest ranking in the Index since 2012. Most investors interested in Mexico are headquartered in the Americas, and many are industrial firms. Mexico’s economy, which is closely tied to that of its northern neighbor, is doing well. GDP growth is expected to average 2.6 percent over the next three years thanks to an expanding middle class, proximity to the US market, and a strong manufacturing sector.
In addition, President Enrique Peña Nieto’s 2013 reforms to open up the historically state-controlled energy and telecommunications sectors have presented new FDI opportunities. Despite initial hesitation by investors, confidence in the energy and telecommunications sectors is increasing, and they are beginning to attract foreign capital. For instance, US firm AT&T acquired two Mexican telecom companies in 2015—Iusacell for $2.5 billion and Nextel for $1.9 billion. In the energy sector, after disappointing results in the first exploratory oil bid in July 2015, foreign investors won bids in two later auctions, including Italian national oil company Eni and several consortia led by oil companies from Argentina, the Netherlands, Canada, and the United States.
Despite these efforts, FDI into Mexico has been falling in recent years, declining to an estimated $29 billion in 2015 after peaking at $45 billion in 2013. The Mexican government is committed to increase FDI inflows into other sectors, though. Mexico’s automotive sector has been attracting more foreign investment than China’s since 2013, with investments doubling in the past five years thanks to Mexico’s low labor costs and access to the US market. The consumer products sector is also becoming increasingly attractive for FDI. The second-largest M&A deal in 2015 was the $2.2 billion Owens-Illinois takeover of Vitro’s food and beverage glass container business.
Asia
China
China remains in second place for the fourth year in a row, with respondents to the FDI Confidence Index survey expressing interest in numerous sectors. Executives from industrial, service-sector, and IT firms all rank China among the top five markets for FDI.
Though still one of the fastest-growing economies in the world, China’s GDP growth is steadily declining from an annual average of 10.3 percent during the 2000s to a forecast average of just 6.1 percent per year in the latter half of the present decade. Investors are concerned about China’s economic slowdown, as well as how its transition from an export- to a consumption-led economy will play out. Some investors also say that foreign businesses seem less welcome

18The 2016 A.T. Kearney Foreign Direct Investment Confidence Index: FDI on the Rebound?
in China than in previous years and are being singled out in corruption and product safety investigations. Recent trends indicate, however, that foreign firms will continue to invest in China as a long-term strategy to attract consumers from the rising Chinese middle class. For example, US auto giant Ford announced in October 2015 that despite slower growth in the Chinese auto market, it will carry on with its investment program in China to develop smart cars tailored specifically for local consumers.
The agenda to reform state-owned enterprises (SOEs) announced in September 2015 could help China attract further foreign interest and boost its economic performance. The State Council announced the partial privatization of key industries—including telecommunications, electricity, military equipment, oil and gas, and civil aviation—which will also open them up to foreign investment. It remains to be seen how quickly Beijing will implement these guidelines and other business environment reforms.
Foreign firms will continue to invest in China as a long-term strategy to attract consumers from China’s rising middle class.FDI inflows to China increased 29 percent in 2015 to reach an estimated record level of $299 billion, with Hong Kong accounting for $163 billion. FDI into China was driven by firms in the Asia Pacific, with Singapore, Japan, and South Korea the largest FDI sources. China increas-ingly attracts FDI from firms outside its region as well. The largest FDI deal of 2015 was the Abu Dhabi Investment Authority’s acquisition of the Grand Hyatt Hong Kong and Renaissance Habour View hotels property for $1.2 billion. The second-largest deal was Swedish manufac-turing company Volvo’s acquisition of Dongfeng Commercial Vehicles for $876 million.
Japan
Japan continues to rise in the rankings, up one spot this year to sixth place—its highest ranking in the history of the FDI Confidence Index. However, Japan’s FDI stock, at just 3.7 percent of GDP, is extremely low compared with the OECD average of 45.6 percent. In 2013, the govern-ment pledged to double the country’s FDI stock from 17.8 trillion yen in 2012 to 35 trillion yen by 2020. That endeavor, if successful, will help offset stagnating economic growth, forecast to average just 0.3 percent annually between 2016 and 2018.
In March 2015 Japan’s FDI Promotion Council announced a five-point action plan that includes providing free public Wi-Fi to foreigners, assigning a state minister for consultations with businesses that have invested $179 million or more in Japan, and ensuring English is taught in the school curriculum. In April 2015, the government also approved legislation to cut corporate taxes from 32.11 percent to 29.97 percent, although the new rate still exceeds the OECD average of 25 percent.
The government’s commitment to attract more FDI is showing some signs of success. In 2015, Japan had the largest number of M&A deals among the top 25 countries ranked in this year’s FDI Confidence Index, according to Dealogic, with more than 320 deals completed. The largest transaction was American real estate manager LaSalle’s $1.2 billion acquisition of Meguro Gajoen, a wedding hall operator.

19The 2016 A.T. Kearney Foreign Direct Investment Confidence Index: FDI on the Rebound?
Australia
Australia climbs three spots to seventh place in this year’s FDI Confidence Index. Foreign investors are optimistic about Australia’s business environment, despite the government’s mixed signals about its openness to foreign investment. The government recently announced stricter limits on foreign purchases of real estate and housing to stem foreign investments in residential property, as well as new mandatory fees—ranging from $3,800 to $75,900— for foreign investment applications. But soon after taking office in September 2015, Prime Minister Malcolm Turnbull made public a $1.1 billion innovation plan to support start-ups and promote R&D.
In addition, economic growth is expected to rise from 2.4 percent in 2015 to 2.9 percent this year thanks to moderately strong private consumption growth. Thirty-two percent of investors we surveyed are more optimistic about Australia’s outlook now than they were a year ago.
In 2015, FDI inflows into Australia fell to an estimated $34.7 billion, down from $51.9 billion in 2014. The chief cause of this decline is the significant reduction of M&A activity in the mining industry, which is experiencing a global slump cycle. However, foreign investors in other sectors, particularly the IT industry, have shown keen interest in Australia. For example, one of Australia’s top 10 M&A deals in 2015 included the $682 million purchase of online home food delivery service Menulog by Britain’s Just Eat.
India
India’s rise of two spots to ninth place demonstrates the country’s increasing attractiveness to foreign investors. Prime Minister Narendra Modi’s government is committed to regulatory reform (including the “Make in India” initiative) to attract future FDI inflows, as the stock of FDI in India remains a very low 12.4 percent of GDP. In November 2015, Modi announced a major push to reduce red tape in 15 key sectors by increasing the threshold for foreign investment review from $438 billion to $731 billion. Major manufacturing and exporting states, such as Gujarat, Tamil Nadu, and Maharashtra, are also removing regulatory obstacles to attract both domestic and foreign investment.
FDI inflows increased by more than 70 percent in 2015 to reach a record level estimated at $59 billion. In the first half of 2015, India became the top greenfield FDI destination, attracting an estimated $3 billion more than China and $4 billion more than the United States. In fact, companies headquartered in China and the United States were the source of several notably large FDI deals in India last year. Chinese electronics manufacturer Foxconn announced in August 2015 that it would invest $5 billion in new electronics manufacturing facilities in India over the next five years. And US automotive company GM announced in July 2015 that it would invest $1 billion to turn the country into a global export hub. Singapore continues to be India’s largest FDI source country, though, investing $6.7 billion in the first nine months of 2015.
In terms of M&As, investors from the IT sector in particular are interested in the Indian market. For example, American computer system provider Aricent acquired Indian semiconductor and software design firm SmartPlay Technologies for $180 million.
Singapore
Singapore rises five spots to reach 10th place in this year’s Index. Investors from the Asia Pacific region and in the IT industry are those that are most interested in investing in Singapore, according to our survey of global business executives.
20The 2016 A.T. Kearney Foreign Direct Investment Confidence Index: FDI on the Rebound?
The country is very friendly to foreign investments, as FDI stock levels—equivalent to 302.9 percent of GDP—attest. Singapore is the top country in the World Bank’s Doing Business 2015 report and the second-most competitive country in the world according to the World Economic Forum’s 2015–2016 Global Competitiveness Index. Under Singaporean law, foreign businesses receive equal treatment with local firms. Nevertheless, some sectors remain completely or partially closed to foreign investors—among them, telecommunications, broadcasting, legal services, and domestic news media.
FDI inflows to Singapore rose year after year between 2011 and 2014, when they hit $67.5 billion. UNCTAD estimates, however, that FDI inflows fell by 4 percent in 2015 to approximately $65 billion. Large M&A deals in 2015 include the $1.8 billion purchase of semiconductor company STATS ChipPac by a consortium of three Chinese electronics companies and the $1.2 billion acquisition of shipping services provider APL Logistics by Japanese marine freight logistics company Kinetetsu World Express.
Taiwan is in the process of approving the next phase of establishing free economic pilot zones to target investments from high-end service industries.
Taiwan
Taiwan returns to the FDI Confidence Index this year, claiming the 15th spot after a two-year absence. At 13 percent, Taiwan’s FDI stock as a percentage of GDP is higher than that of the majority of its neighbors, and the country is making efforts to attract even more FDI. For example, Taiwan is in the process of approving the next phase of establishing free economic pilot zones (FEPZs). These FEPZs would target investments from high-end service industries, such as international healthcare services, education, smart logistics, and financial services. However, foreign investment in certain sectors remains closed for environmental and security reasons. These industries include natural gas, telecommunications, mass media, public utilities, and air and sea transportation.
From a macroeconomic perspective, Taiwan’s economy has been negatively affected by the slowdown in China and overall weaker demand for exports in developed markets. Nevertheless, Taiwanese economic growth is still expected to average 2.0 percent annually through 2018.
Inflows of FDI into Taiwan averaged $3.2 billion annually between 2012 and 2014. The Ministry of Economic Affairs approved more than 3,400 foreign investment projects in the first 11 months of 2015, a 5.9 percent increase from the same period in the previous year. The total value of these projects was $4.1 billion, 6.9 percent below the comparable value in 2014.
Foreign companies headquartered in the Asia Pacific region, especially in China, are a large source of FDI for Taiwan. For instance, China’s Haocan Equity Share Investment Fund signed the largest M&A deal in 2015 with its $1.9 billion acquisition of the computer and electronics company Tatung.
21The 2016 A.T. Kearney Foreign Direct Investment Confidence Index: FDI on the Rebound?
South Korea
South Korea falls one spot to 17th place this year. FDI stock as a percentage of GDP, at 12.9 percent, is low compared to South Korea’s global peers, although higher than for some of its neighbors.
The government continues to pursue business-friendly policies through President Park Geun-hye’s “creative economy” agenda, which aims to foster innovation and start-ups to drive economic growth. However, foreign businesses often say that South Korea’s regulations do not allow for sufficient innovation and business development. In May 2015, the minister of trade announced a plan to reform foreign investment regulations in order to increase FDI inflows to $30 billion by 2017. Under this plan, the government would gradually open up 29 restricted sectors to FDI, including media, nuclear power, aviation, and telecommunications. A number of other proposed reforms include postponing limits on the number of foreign employers in foreign-invested start-ups and giving foreign companies the opportunity to participate in the regulation and policy development process. However, all of these potentially FDI-generating reforms remain stuck in the pre-approval phase.
South Korea, meanwhile, continues to attract strong levels of foreign investment. FDI inflows increased to an estimated $20.4 billion in 2015, an 11 percent rise from 2014. Much FDI comes from the Asia Pacific region, but inflows from the Middle East are also increasing rapidly. Thanks to growing bilateral economic relationships, FDI inflows from the Middle East to South Korea reached $1.4 billion in 2015, a 526 percent increase from $225 million in 2014. South Korea could also experience a rise in FDI from China following the signing of a bilateral free trade agreement in June 2015. In fact, Chinese firms invested $2 billion in South Korea in 2015, a 70 percent increase from the previous year, and South Korea aims to attract $2.5 billion of FDI from China in 2016.
Thailand
After a two-year absence, Thailand returns to the Index this year in 21st position. Although the military government that took power in a coup in May 2014 created some uncertainty for the future of Thai politics and policies, the government has kept the Thai economy open to foreign investment. In addition, the economy is on a stable trajectory thanks to its strong tourism sector, which has withstood a spate of bombings in 2015.
FDI inflows to Thailand have declined, falling an estimated 78 percent in 2015 from a year earlier. Notably, investments from EU-based firms fell 42 percent while those from Japan—historically Thailand’s biggest source of FDI—plummeted 81 percent. The country’s reappearance on the FDI Confidence Index, however, suggests that investors may be taking a fresh look at Thailand.
Thailand is giving preferential treatment to foreign projects in the technology sector. One example of such a project is China-based photovoltaic cell manufacturer Zhongli Talesun Solar’s construction of a new manufacturing factory in Thailand, which started in February 2015. Thailand’s Board of Investment (BOI) also introduced a new investment incentive policy in January 2015 to attract IT companies, including an eight-year exemption from corporate income taxes. The BOI approved further plans in March 2016 to expedite investment projects in other targeted sectors, including food innovation, aviation, and automation and robotics.

22The 2016 A.T. Kearney Foreign Direct Investment Confidence Index: FDI on the Rebound?
Europe
Germany
Germany, the top-ranked European country in the 2016 FDI Confidence Index, moves up one spot to fourth place, its highest position in 14 years. Despite the Volkswagen emissions scandal and weak global export demand, investor interest in Germany continues to be broad-based, with the country ranking in the top five markets for FDI among respondents in all three sectors included in our survey—industry, services, and IT—with a particularly strong showing in the IT sector.
While the slowdown in Chinese demand has hurt the German economy—roughly 13 percent of German exports head to China—strong consumer confidence, employment growth, and low inflation at home are contributing to relatively solid economic performance, with growth forecast to average 1.5 percent in the next three years. In addition, the weaker euro makes German exports more competitive abroad while also reducing the cost for foreign firms investing in the country.
The weaker euro makes German exports more competitive abroad while also reducing the relative cost for foreign firms investing in the country.FDI grew from a net outflow in 2014 of $6.2 billion to an estimated net inflow of $11 billion in 2015, thanks to a dramatic rise in reinvested earnings. The slowdown in China’s economy may also be helping to drive higher levels of FDI into Germany. According to global law firm Baker & McKenzie, FDI inflows from China to Germany reached $1.3 billion in 2015. For example, Chinese automotive electronic parts manufacturer Ningbo Joyson acquired German steering wheel manufacturer Quin for $113 million. However, the United States remains Germany’s largest source of FDI. For instance, US technology and manufacturing conglomerate Honeywell International acquired energy and water metering company Elster for $5.1 billion.
United Kingdom
The United Kingdom falls two spots in this year’s Index, but at fifth place it remains among the top five. To date, Britain’s European neighbors have been a major source of FDI, accounting for 48 percent of the FDI stock as of 2014. Also noteworthy is that the country is home to more than half of all European headquarters of non-EU firms—more than Germany, Switzerland, France, and the Netherlands combined. Given these business relationships, many investors are concerned about the disruption that a decision to leave the EU could cause, and a Brexit could damage the country’s attractiveness as an FDI destination in the future. In fact, global business executives told us that if a Brexit were to occur, the number of companies that would increase FDI in Britain would fall by 7 percentage points, and those that would decrease their FDI would rise by 5 percentage points.
In 2015, FDI inflows into the United Kingdom rose 29 percent to $68 billion. Investments from China, already one of Britain’s largest FDI sources, continue to increase, particularly in real estate.
23The 2016 A.T. Kearney Foreign Direct Investment Confidence Index: FDI on the Rebound?
Chinese property buyers are expected to invest $13.2 billion in the United Kingdom by 2020. The UK government is also targeting Chinese investors across a variety of sectors. During Chinese President Xi Jinping’s state visit in October 2015 an estimated $56.5 billion worth of deals were finalized, including a $25.4 billion agreement between China General Nuclear Power Corporation and French energy firm EDF to build nuclear plants in Somerset, Essex, and Sizewell.
Economic growth in the United Kingdom fell from 2.9 percent in 2014 to a still-robust 2.2 percent in 2015 and will average 2.1 percent over the next three years. As a result, the UK economy is forecast to continue to outperform most of its European neighbors. The possibility of a Brexit raises questions about Britain’s economic outlook, though.
France
France maintains its eighth position in the FDI Confidence Index for the second consecutive year. To promote France as an attractive investment location and diversify both the sources and sector composition of its FDI inflows, the government launched a new agency called Business France—a merger of French trade commission Ubifrance and the Invest in France Agency—in January 2015. Early this year, Business France launched its international campaign “Creative France” to promote the country’s competitive and innovative environment. It is targeting investors from 10 key countries, including the United Kingdom, Germany, Japan, Singapore, and the United Arab Emirates.
Economic growth continues to slowly recover, albeit somewhat erratically, thanks to strong household consumption. However, future growth could be constrained by an unemployment rate of 10.4 percent, which is higher than the EU average of 9.4 percent. The youth unemployment rate is even more alarming at 25.1 percent. The government introduced a labor market reform bill in March 2016 that aims to reduce unemployment by giving employers more flexibility to hire and fire employees and to negotiate the length of the work week. Labor unions and student groups have organized protests, though, signaling that the public debate will likely be drawn out.
Despite slower than expected economic growth and labor market challenges, France attracted significantly more FDI in 2015, with inflows leaping from just $15 billion in 2014 to an estimated $44 billion last year. The United States was France’s largest source country of M&As, which were valued at more than $17 billion according to Dealogic. One of the largest M&A deals of the year was General Electric’s acquisition of Alstom’s thermal, renewables, and grid business for $13.1 billion. However, European investors remain France’s largest source of foreign investment, including Belgium, the Netherlands, Switzerland, and Germany. Finnish technology company Nokia announced in January 2016 that it received approval to acquire French global telecommu-nications equipment firm Alcatel-Lucent for $17 billion.
Switzerland
Switzerland rises three spots to 11th place in the Index this year. This improvement comes in spite of the dramatic appreciation of the Swiss franc after the Swiss National Bank dropped its exchange rate ceiling against the euro in January 2015. Sustained investor interest in the country is likely a result of continued moderate economic growth rates, high consumer spending, and a highly competitive business environment.
Switzerland is the most competitive economy in the world according to the World Economic Forum 2015–2016 Global Competitiveness Index, and it is also ranked as the top country for attracting and retaining talent in the Global Talent Competitiveness Index 2015–2016. In addition,

24The 2016 A.T. Kearney Foreign Direct Investment Confidence Index: FDI on the Rebound?
the country’s low corporate tax rate of 17.92 percent, geographic proximity to other European markets, and high-quality infrastructure attract foreign investors from many parts of the world.
This is especially true for firms that specialize in high-value goods and services such as pharmaceuticals, IT, and finance. The Swiss pharmaceutical industry grew 5 percent in 2015 over the previous year, to achieve a turnover of $5.5 billion. Foreign investors played a large role in the industry’s growth. For instance, British firm GlaxoSmithKline’s $7.1 billion purchase of Novartis’s global vaccine business and the US firm Eli Lilly’s $5.4 billion acquisition of Novartis’s animal health business were approved in the first half of 2015. Apart from a one-year drop in net FDI inflows to negative territory in 2013, Switzerland has attracted on average $24 billion annually in FDI since 2010.
Spain’s falling unit labor costs and fairly open foreign investment policies have made the country increasingly attractive as a destination for FDI.
Spain
Spain jumps from 17th to 13th in the FDI Confidence Index this year—the largest gain for any European market—as the country’s economy continues to strengthen after robust growth in 2015. The IMF forecasts that Spanish GDP growth will be 2.6 percent in 2016, largely driven by low oil prices and growing private consumption. However, Spain is still struggling to reduce its staggering unemployment rate of 22.1 percent, the second-highest in the EU.
Although economic recovery has been slow in coming, Spain’s falling unit labor costs and fairly open foreign investment policies have made the country an increasingly attractive FDI destination, especially for firms headquartered in other European countries. The Netherlands, Germany, Switzerland, and France have been Spain’s leading FDI source countries in recent years.
Spain has averaged about $30 billion in FDI inflows in recent years, but political uncertainty yet could weigh on Spain’s economic recovery and attractiveness as an FDI destination. The December 2015 general elections resulted in one of the most fragmented parliaments in Spanish history. Socialist party leader Pedro Sánchez attempted to form a coalition government in early March 2016 but failed to secure enough votes in the Chamber of Deputies. Since the current parliament has failed to form a government, new general elections will be held on June 26. The plethora of economic reforms that Spain desperately needs—such as addressing high budget deficits and rigid labor laws—to boost competitiveness and stimulate economic growth over the medium and long term will remain on hold until a government is formed.
Netherlands
The Netherlands falls one spot to 14th place and is the sixth-highest-ranked European country in this year’s Index. It is ranked among the top 10 FDI destinations by European executives, and leaders of service-sector firms also hold the country in high regard. The Netherlands has

25The 2016 A.T. Kearney Foreign Direct Investment Confidence Index: FDI on the Rebound?
a welcoming business environment and strong infrastructure and institutions, earning it a spot as the fifth most competitive economy in the world in the latest World Economic Forum Global Competitiveness Report.
FDI inflows jumped to an estimated $90 billion in 2015 from $30 billion in the previous year. According to the Netherlands Foreign Investment Agency, the country secured 321 foreign investment projects, valued at $2.1 billion, which created 9,300 additional jobs in 2015. Examples include the construction of a new distribution center for world-renowned fashion brand Michael Kors, a new Tesla advanced automotive manufacturing factory, and a laboratory for Indian biotechnology company Cipla. The United States was the largest foreign investor in 2015 with 75 projects, including the expansions of ExxonMobil’s hydrocracker unit at its Rotterdam refinery and Forever21’s distribution center.
Italy
Italy appears on the FDI Confidence Index for the third year in a row, although it falls four spots to 16th in this year’s Index. Italy’s stock of FDI remains very low compared to its neighbors, hovering just above 17 percent of GDP in 2014 while the EU average is nearly three times higher at 49.6 percent.
FDI flows to Italy have been volatile in recent years, although investors from China seem increas-ingly interested in the country. For example, China’s national chemical firm ChemChina won the bid to buy Italian tire maker Pirelli for $7.9 billion in July 2015, the largest Chinese outbound M&A deal in the EU on record.
Prime Minister Matteo Renzi’s government has introduced several bills that aim to attract more FDI in the future. For instance, in January 2015 the government passed the Investment Compact Act to promote R&D, innovation, and the development of small and medium enterprises through tax benefits. Italy also passed controversial labor market reforms in September 2015 to simplify the process to hire and terminate employees and entice employers to hire employees on permanent contracts. The Italian government is also trying to reform its justice system, which has been cited as a reason for reduced foreign investments, including by creating special courts dedicated to company law cases and encouraging out-of-court settlements.
Italy’s economy grew by 0.8 percent in 2015 following a 0.3 percent contraction in 2014, and average annual growth of 1.0 percent is forecast over the next three years. However, the country faces several economic hurdles in the near term, with elevated levels of unemployment and an alarming public debt-to-GDP ratio of 133 percent in 2015. The slowdown in emerging markets may also have dampening effects on Italy’s economy, as they are the destination for 30 percent of Italian exports.
Belgium
Belgium holds steady at 19th place in this year’s FDI Confidence Index. Belgium’s FDI stock is very high, at 98.5 percent of GDP. The country continues to attract FDI thanks to its strong logistics and infrastructure, as well as its central geographic location near other large European markets.
Belgium faces several hurdles to maintaining its competitiveness as an FDI destination, though. Corporate tax rates are among the highest in Europe at 33.99 percent, compared to the EU average of 22.37 percent. In addition, rigid labor markets and higher unit labor costs could also

26The 2016 A.T. Kearney Foreign Direct Investment Confidence Index: FDI on the Rebound?
hinder future FDI growth. To address some of these challenges, the government announced a freeze on wages in 2015, although this raised concerns among labor unions. It also remains to be seen whether the March 2016 terrorist attacks in Brussels and their ongoing social and political ramifications will affect Belgium’s attractiveness as an FDI destination.
Whatever the future may hold in store for Belgium, net FDI inflows came roaring back in 2015 to almost $33 billion in 2015 after a one-off dip to –$8 billion in 2014 due to large divestments.
Denmark
Denmark is ranked 20th in the Index for the second consecutive year. Its economic perfor-mance is relatively robust compared to many of its neighbors, with forecast growth of 1.6 percent in 2016. The country is particularly strong in high-tech, high-value industries, such as IT, life sciences, and clean energy technologies.
The Danish investment promotion agency approved a record 70 investment projects in 2015—46 of them greenfield investments. In August 2015, global IT company Cisco partnered with the city of Copenhagen to develop smart city solutions. In addition, American chemicals firm FMC acquired Cheminova for $1.8 billion—which was the largest M&A deal in Denmark in 2015.
Denmark’s largest sources of FDI in recent years are primarily other European countries and Japan. Chinese investors are also increasingly looking at Denmark. For example, an individual Chinese investor established food trading company Bao Xin Trading to export Denmark’s high-quality meat products back to China, while Chinese cosmetic company Zhongshang plans to open a branch in Copenhagen to design product packaging that would appeal to a global audience.
Sweden
Sweden appears in the FDI Confidence Index for the third year in a row, dropping four spots from last year to 22nd position. Like its Nordic neighbors, Sweden is particularly appealing to investors in clean energy, telecommunications, IT, and healthcare, thanks to its high-tech infrastructure. One of the larger M&A deals in 2015 was US digital optical networking chips and systems producer Infinera’s acquisition of Swedish telecommunications network solutions provider Transmode for $351 million in August.
The country is also quickly becoming an attractive technology hub thanks to its entrepreneurial and collaborative culture, high-quality talent, and strong IT infrastructure. In the first nine months of 2015, 180 investors, including several domestic companies, invested more than $1 billion in Swedish tech start-ups, particularly those in e-commerce, music tech, and software. As more foreign investors flock to Sweden, especially its capital Stockholm, the country is likely to see more FDI in high-tech sectors.
Ireland
Ireland makes its first appearance on the FDI Confidence Index in more than a decade, capturing 23rd place. This is likely a result of Ireland’s stellar economic recovery and performance in recent years. Its economy has accelerated rapidly since 2014 and was the fastest-growing developed economy in 2015 for the second consecutive year. Ireland’s GDP is expected to grow by 5.0 percent in 2016—faster than that of any other advanced economy and more than triple
27The 2016 A.T. Kearney Foreign Direct Investment Confidence Index: FDI on the Rebound?
the eurozone average. Irish economic growth is largely driven by strong private consumption and exports to the United Kingdom and the United States.
In 2015, Ireland approved 213 FDI projects, up from 197 in 2014. The country’s ultralow corporate tax rate of 12.5 percent is enticing to foreign investors and attracts many large companies to locate operations in Ireland. For instance, Facebook plans to construct a new data center in the country, and Apple announced it will invest $953 million to build a data center of its own in Athenry.
Ireland’s agency for industrial development, IDA Ireland, announced in 2015 that it aims to increase FDI by more than 40 percent by 2019, including winning 900 projects, creating 80,000 new jobs, and increasing levels of investment in each region by 30 to 40 percent. IDA Ireland is planning to target high-growth firms in Europe and Asia Pacific. These are ambitious goals, but in just one year IDA Ireland client companies created almost 19,000 jobs, reaching IDA Ireland’s highest total employment levels on record.
European countries provide most of Austria’s and Norway’s FDI inflows, but firms from Asia are increasing investment.
Austria
Austria falls three spots to 24th on the Index. It remains a competitive market in the region and globally, attracting around $6.3 billion in FDI annually in recent years. In 2015, the investment promotion agency, ABA-Invest in Austria, helped 297 international companies set up operations in the country, which led to $542 million in investments and more than 2,600 new jobs.
European countries are the source of most of Austria’s FDI inflows, with Germany remaining the largest originator of FDI, including more than 100 companies operating in the country. However, firms from Asia are increasing investment, likely due to Austria’s skilled labor force, high produc-tivity rates, high-quality infrastructure, relatively low corporate tax rate of 25 percent, and political stability. For instance, Mizuho Bank, one of Japan’s largest financial services companies, opened an office in Vienna in early 2015 to expand its business into Central and Eastern Europe.
Norway
Norway falls one spot to 25th in this year’s Index. Norway’s FDI inflows have hovered around $16 billion annually in recent years, although they fell to just $8.7 billion in 2014. This may be because Norway’s economy has been weighed down by low global oil prices (oil and gas exports account for 22 percent of its GDP), but the IMF forecasts that Norway’s economic growth will average 1.4 percent in the next three years. The government’s reform agenda to increase productivity and employment levels may stimulate investment and boost economic growth. For instance, in January the government enacted a bill to lower the corporate tax rate from 27 percent to 22 percent by 2018.
Norway’s Nordic and European neighbors remain its largest investors, but Chinese firms are increasingly investing in the country. For instance, a group of Chinese Internet firms are currently negotiating to take over Norwegian web browser designer Opera for $1.2 billion.
28The 2016 A.T. Kearney Foreign Direct Investment Confidence Index: FDI on the Rebound?
Conclusion and Business Implications Even as many indicators of globalization continue to stagnate, global FDI flows may be on an upswing. Global business executives are united in the view that FDI will become increasingly important to corporate profitability and competitiveness in the near to medium term. And they are acting accordingly, increasing their planned investments abroad. Developed markets are still attracting the lion’s share of investors’ interest, claiming 20 of the top 25 spots in this year’s FDI Confidence Index. However, high-performing emerging and frontier markets can continue to attract FDI inflows if they have investors’ desired market characteristics. Despite the stability in the top two ranks of the Index once again this year, it is clear that there is a lot of volatility in the global economy as well as in global FDI flows—signaling challenges and opportunities for both global business executives and countries seeking to promote investment.
Authors
Paul Laudicina, partner, chairman emeritus of A.T. Kearney and chairman of the Global Business Policy Council, Washington, D.C. [email protected]
Erik Peterson, partner and managing director of the Global Business Policy Council, Washington, D.C. [email protected]
The authors wish to thank Courtney Rickert McCaffrey and Jiwon Jun for their valuable contributions to this report.

Appendix: About the StudyThe 2016 A.T. Kearney Foreign Direct Investment (FDI) Confidence Index® is constructed using primary data from a proprietary survey administered to senior executives of the world’s leading corporations. The survey was conducted in January 2016.
Respondents include C-level executives and regional and business leads. All companies partici-pating in the survey have annual revenues of $500 million or more. The participating companies are headquartered in 27 different countries and span all sectors. The selection of countries from which to survey senior executives was based on data from the United Nations Conference on Trade and Development (UNCTAD), with the 27 countries represented in the FDI Confidence Index originating more than 90 percent of global FDI flows in recent years. Service-sector firms account for 45 percent of respondents, while industrial firms account for about 35 percent and IT firms account for about 15 percent.
The Index is calculated as a weighted average of the number of high, medium, and low responses to questions on the likelihood of making a direct investment in a market over the next three years. Index values are based on responses only from companies headquartered in foreign markets. For example, the Index value for the United States was calculated without responses from US-headquartered investors. Higher Index values indicate more attractive investment targets.
FDI flow figures are the latest statistics available from UNCTAD, and all 2015 figures are estimates. Other secondary sources include investment promotion agencies, central banks, ministries of finance and trade, and other major data sources.
For past editions of the FDI Confidence Index, please go to: www.atkearney.com/gbpc/foreign-direct-investment-confidence-index
29The 2016 A.T. Kearney Foreign Direct Investment Confidence Index: FDI on the Rebound?

A.T. Kearney is a leading global management consulting firm with offices in more than 40 countries. Since 1926, we have been trusted advisors to the world's foremost organizations. A.T. Kearney is a partner-owned firm, committed to helping clients achieve immediate impact and growing advantage on their most mission-critical issues. For more information, visit www.atkearney.com.
Americas
Asia Pacific
Europe
Middle East and Africa
AtlantaBogotáBostonCalgary Chicago
DallasDetroitHoustonMexico CityNew York
Palo Alto San FranciscoSão PauloTorontoWashington, D.C.
BangkokBeijingHong KongJakartaKuala Lumpur
MelbourneMumbaiNew DelhiSeoulShanghai
SingaporeSydneyTaipeiTokyo
Abu DhabiDoha
DubaiJohannesburg
ManamaRiyadh
For more information, permission to reprint or translate this work, and all other correspondence, please email: [email protected].
The signature of our namesake and founder, Andrew Thomas Kearney, on the cover of this document represents our pledge to live the values he instilled in our firm and uphold his commitment to ensuring “essential rightness” in all that we do.
A.T. Kearney Korea LLC is a separate and independent legal entity operating under the A.T. Kearney name in Korea.
A.T. Kearney operates in India as A.T. Kearney Limited (Branch Office), a branch office of A.T. Kearney Limited, a company organized under the laws of England and Wales.
© 2016, A.T. Kearney, Inc. All rights reserved.
AmsterdamBerlinBrusselsBucharestBudapestCopenhagenDüsseldorfFrankfurtHelsinki
IstanbulKievLisbonLjubljanaLondonMadridMilanMoscowMunich
OsloParisPragueRomeStockholmStuttgartViennaWarsawZurich


