The development and plasticity of alveolar type 1 cellsJun Yang1,*, Belinda J. Hernandez1,*, Denise Martinez Alanis1, Odemaris Narvaez del Pilar2, Lisandra Vila-Ellis1,3, Haruhiko Akiyama4, Scott E. Evans1, Edwin J. Ostrin1 and Jichao Chen1,5,‡
ABSTRACTAlveolar type 1 (AT1) cells cover >95% of the gas exchange surfaceand are extremely thin to facilitate passive gas diffusion. Thedevelopment of these highly specialized cells and its coordinationwith the formation of the honeycomb-like alveolar structure are poorlyunderstood. Using new marker-based stereology and single-cellimaging methods, we show that AT1 cells in the mouse lung formexpansive thin cellular extensions via a non-proliferative two-stepprocess while retaining cellular plasticity. In the flattening step, AT1cells undergo molecular specification and remodel cell junctionswhile remaining connected to their epithelial neighbors. In the foldingstep, AT1 cells increase in size by more than 10-fold and undergocellular morphogenesis that matches capillary and secondary septaformation, resulting in a single AT1 cell spanning multiple alveoli.Furthermore, AT1 cells are an unexpected source of VEGFA and theirnormal development is required for alveolar angiogenesis. Notably, amajority of AT1 cells proliferate upon ectopic SOX2 expression andundergo stage-dependent cell fate reprogramming. These resultsprovide evidence that AT1 cells have both structural and signalingroles in alveolar maturation and can exit their terminally differentiatednon-proliferative state. Our findings suggest that AT1 cells might be anew target in the pathogenesis and treatment of lung diseasesassociated with premature birth.
INTRODUCTIONThemammalian lung consists of a tree-like airway compartment anda honeycomb-like gas exchange compartment. The two majorepithelial cell types covering the gas exchange compartment arealveolar type 1 (AT1) and type 2 (AT2) cells, which are in closecontact with underlying capillaries and fibroblasts (Williams, 2003;Herzog et al., 2008; Weibel, 2015). AT1 cells are flat and covermore than 95% of the gas exchange surface, whereas AT2 cells arecuboidal and synthesize surfactants to prevent the alveoli fromcollapsing (Crapo et al., 1982; Williams, 2003). Classical electronmicroscopy studies show that AT1 cells are extremely thin(<0.1 μm), presumably to facilitate passive gas diffusion, andhave a complex morphology that can be traced over multiple alveoli(Weibel, 1971, 2015). Whereas AT2 cells have recently been shown
to self-renew and give rise to AT1 cells during homeostasis andinjury repair (Barkauskas et al., 2013; Desai et al., 2014), AT1 cellsare generally considered terminally differentiated in vivo, althoughthey exhibit some plasticity in culture (Danto et al., 1995; Williams,2003; Gonzalez et al., 2005, 2009). One recent study suggests that,although infrequent, AT1 cells may convert to AT2 cells andproliferate upon pneumonectomy or oncogenic KRAS expression(Jain et al., 2015).
During development, recent studies suggest that a population ofbipotential progenitors expressing markers of both AT1 and AT2cells differentiate into mature AT1 or AT2 cells by upregulatingadditional markers of the corresponding cell fate anddownregulating markers of the alternative cell fate (Desai et al.,2014; Treutlein et al., 2014). However, it is unknown how alveolarcell number, morphology and fate are regulated during subsequentlung maturation. In particular, how do AT1 cells adopt theirconvoluted morphology in coordination with the formation of thehoneycomb-like alveolar structure? When and to what extent are thefates of AT1 and AT2 cells specified?
In this study, we focus on the poorly understood AT1 cells duringthe perinatal period. We develop a new marker-based stereologymethod to follow the change in cell number and alveolar surfacearea, and use single-cell three-dimensional (3D) imaging and threeAT1 cell genetic drivers to follow changes in cell morphology andcell fate plasticity. We show that AT1 cells develop via a non-proliferative two-step growth process of cell flattening and cellfolding, but retain cellular plasticity. Furthermore, AT1 cells, butnot AT2 cells, express Vegfa, and disruption of AT1 celldevelopment leads to reduced alveolar angiogenesis. Thesefindings pave the way for future investigation of the role of AT1cells in alveolar maturation and of AT1 cell plasticity in vivo.
RESULTSAT1 cell growth fuels postnatal alveolar growthTo understand AT1 cell development, we first set out to determinethe number of AT1 cells during postnatal lung growth in mice. AT1cells have been commonly identified based on morphology usingelectron microscopy (Stone et al., 1992;Weibel, 2015), which limitsthe analysis to small regions and makes it technically challenging toobtain the total cell number as it requires the dissector method (Hsiaet al., 2010) or an assumption of uniform nuclear shapes (Kauffmanet al., 1974; Weibel, 2015). This prompted us to develop a newmarker-based stereology method that combines stereologicalsampling principles with 3D imaging of molecular markers (Fig.S1A). Our method has several advantages. First, we confirmed that,unlike membrane-localized AT1 markers, HOPX stains both thenucleus and cytosol of AT1 cells (Barkauskas et al., 2013), thusallowing nucleus-based cell counting. HOPX expression was AT1specific throughout postnatal development, as alveolar epithelialcells were marked in a mutually exclusive manner by nuclear HOPXand LAMP3 [an AT2 cell marker (Chang et al., 2013; Desai et al.,2014)] or by nuclear HOPX and cuboidal E-cadherin (E-CAD;Received 25 August 2015; Accepted 11 November 2015
1Department of Pulmonary Medicine, The University of Texas M. D. AndersonCancer Center, Houston, TX 77030, USA. 2University of Puerto Rico – MedicalSciences Campus, San Juan, Puerto Rico 00927. 3Tecnologico de Monterrey –
Escuela de Medicina, Monterrey 64710, Mexico. 4Department of Orthopedics,Kyoto University, Sakyo, Kyoto 606-8507, Japan. 5Center for Stem Cells andDevelopmental Biology, The University of Texas M. D. Anderson Cancer Center,Houston, TX 77030, USA.*These authors contributed equally to this work
cadherin 1) staining that colocalized with SFTPC (an AT2 cellmarker) (Fig. 1A,B, Fig. S1E). Second, we developed a whole-mount thick-section staining method that minimized tissueshrinkage as well as dehydration when stained on slides(Fig. S1B,C). Third, we used 3D fluorescence imaging and Imarissoftware to directly visualize and count cells in large fields to reduceedge effect and bias from field selection (Fig. 1B) (Williams andRakic, 1988). Results from this direct counting method werecomparable to those using the optical dissector method (Hsia et al.,2010) (Fig. S1F). Our measurements of alveolar cell number andsurface area in the adult mouse lung were in general agreement withthe widely variable measurements in the literature (Fig. S1G).Using this method, we found that as the lung continued to grow
postnatally, there was a parallel increase in the number of AT2cells, resulting in a nearly 6-fold increase in AT2 cell number fromP0 to P54 (Fig. 1C, Table S1). By contrast, over the same period,the number of AT1 cells only increased ∼2-fold and most of theincrease occurred within the first week after birth, possibly owingto the differentiation of remaining embryonic progenitors (Fig. S2;as described below) (Alanis et al., 2014; Yang and Chen, 2014).Such a difference was also reflected in a previously unappreciateddecrease in the ratio between the numbers of AT1 and AT2 cellspostnatally (Fig. 1C, Table S1). Furthermore, AT2 but not AT1cells express the proliferative marker KI67 (Fig. S3A). Few
apoptotic AT1 or AT2 cells were observed (Fig. S3B) (Schittnyet al., 1998). Despite their smaller number, AT1 cells constitutednearly all the alveolar surface throughout postnatal development, asmeasured using STEPanizer (Fig. 1C, Table S1). Therefore, AT1cell growth, but not proliferation, fuels most of the postnatalalveolar growth with a limited contribution from AT2 cells on astructural level.
AT1 cells flatten in conjunctionwith molecular specificationNext, we examined how AT1 cells grow and the relationship ofthis growth to postnatal alveolar maturation. The boundaries of theultrathin cellular extensions of AT1 cells are only reliably detectedby electron microscopy, which limited the analysis to twodimensions and sections capturing only part of an AT1 cell(Weibel, 1971, 2015). As a result, the complete morphology of asingle AT1 cell in the developing and mature lung is unknown. Toexamine whole AT1 cells in 3D, we titrated down the dose of therecombination inducer (tamoxifen) to genetically label isolated cellswith a membrane-bound reporter (Muzumdar et al., 2007). We alsodeveloped whole-mount multicolor staining and imaging methodsto visualize labeled cells without physical sectioning and inconjunction with molecular markers (Figs 2 and 3). Multicolorreporters, such as RosaConfetti (Snippert et al., 2010), were not usedbecause the soluble reporter proteins do not efficiently mark the
Fig. 1. AT1 cell growth fuels postnatal alveolar growth as quantified using marker-based stereology. (A) Confocal projection images of whole-mountimmunostained mouse lung strips showing that HOPX (solid arrowhead) and cuboidal E-CAD or LAMP3 (open arrowhead) are mutually exclusive. Any apparentpartial overlap is due to the projection view of image stacks, which allows better assignment of the staining to the corresponding nucleus. (B) Confocal projectionimages of a whole-mount immunostained 60 μm section from a P21 ShhCre/+; RosaRG/+ lung. Cre recombination and therefore RFP is restricted to airway andalveolar epithelial cells. Only endogenous RFP but not GFP from the RosaRG allele is detectable. The boxed region is enlarged in the righthand panels showingthat RFP-expressing cells are marked in a mutually exclusive manner by HOPX (AT1, solid arrowhead) and E-CAD (AT2, open arrowhead). Beneath is atransverse section (z-axis) view along the dashed line showing that half AT1 (solid arrowhead) and AT2 (open arrowhead) can be discerned and counted at theimage borders (double-sided arrow). Asterisk marks ‘escaping’ epithelial cells, presumably due to inefficient recombination or RFP expression. (C) The left lungvolume, the ratio between AT1 and AT2 cell numbers, the total number of AT1 and AT2 cells, and alveolar surface area made of AT1 and AT2 cells in the left lungare plotted against animal age. Each symbol represents one mouse. Note that 1 cm2 equals 108 μm2. Scale bars: 10 μm.
55
RESEARCH ARTICLE Development (2016) 143, 54-65 doi:10.1242/dev.130005
ultrathin AT1 cell extensions and because the GFP antibody, whichprovides the necessary signal amplification, does not distinguishGFP variants, including CFP and YFP.To ensure unbiased analyses of the earliest stage of AT1 cell
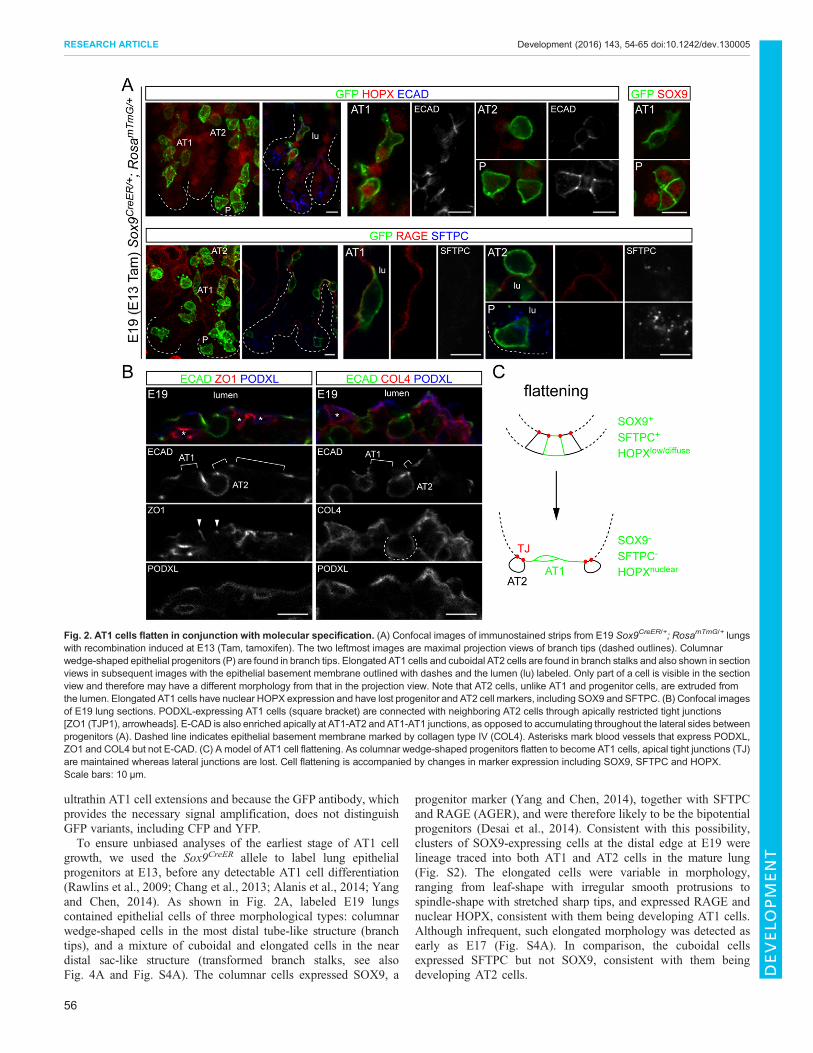
growth, we used the Sox9CreER allele to label lung epithelialprogenitors at E13, before any detectable AT1 cell differentiation(Rawlins et al., 2009; Chang et al., 2013; Alanis et al., 2014; Yangand Chen, 2014). As shown in Fig. 2A, labeled E19 lungscontained epithelial cells of three morphological types: columnarwedge-shaped cells in the most distal tube-like structure (branchtips), and a mixture of cuboidal and elongated cells in the neardistal sac-like structure (transformed branch stalks, see alsoFig. 4A and Fig. S4A). The columnar cells expressed SOX9, a
progenitor marker (Yang and Chen, 2014), together with SFTPCand RAGE (AGER), and were therefore likely to be the bipotentialprogenitors (Desai et al., 2014). Consistent with this possibility,clusters of SOX9-expressing cells at the distal edge at E19 werelineage traced into both AT1 and AT2 cells in the mature lung(Fig. S2). The elongated cells were variable in morphology,ranging from leaf-shape with irregular smooth protrusions tospindle-shape with stretched sharp tips, and expressed RAGE andnuclear HOPX, consistent with them being developing AT1 cells.Although infrequent, such elongated morphology was detected asearly as E17 (Fig. S4A). In comparison, the cuboidal cellsexpressed SFTPC but not SOX9, consistent with them beingdeveloping AT2 cells.
Fig. 2. AT1 cells flatten in conjunction with molecular specification. (A) Confocal images of immunostained strips from E19 Sox9CreER/+; RosamTmG/+ lungswith recombination induced at E13 (Tam, tamoxifen). The two leftmost images are maximal projection views of branch tips (dashed outlines). Columnarwedge-shaped epithelial progenitors (P) are found in branch tips. Elongated AT1 cells and cuboidal AT2 cells are found in branch stalks and also shown in sectionviews in subsequent images with the epithelial basement membrane outlined with dashes and the lumen (lu) labeled. Only part of a cell is visible in the sectionview and therefore may have a different morphology from that in the projection view. Note that AT2 cells, unlike AT1 and progenitor cells, are extruded fromthe lumen. Elongated AT1 cells have nuclear HOPX expression and have lost progenitor and AT2 cell markers, including SOX9 and SFTPC. (B) Confocal imagesof E19 lung sections. PODXL-expressing AT1 cells (square bracket) are connected with neighboring AT2 cells through apically restricted tight junctions[ZO1 (TJP1), arrowheads]. E-CAD is also enriched apically at AT1-AT2 and AT1-AT1 junctions, as opposed to accumulating throughout the lateral sides betweenprogenitors (A). Dashed line indicates epithelial basement membrane marked by collagen type IV (COL4). Asterisks mark blood vessels that express PODXL,ZO1 and COL4 but not E-CAD. (C) A model of AT1 cell flattening. As columnar wedge-shaped progenitors flatten to become AT1 cells, apical tight junctions (TJ)are maintained whereas lateral junctions are lost. Cell flattening is accompanied by changes in marker expression including SOX9, SFTPC and HOPX.Scale bars: 10 μm.
56
RESEARCH ARTICLE Development (2016) 143, 54-65 doi:10.1242/dev.130005
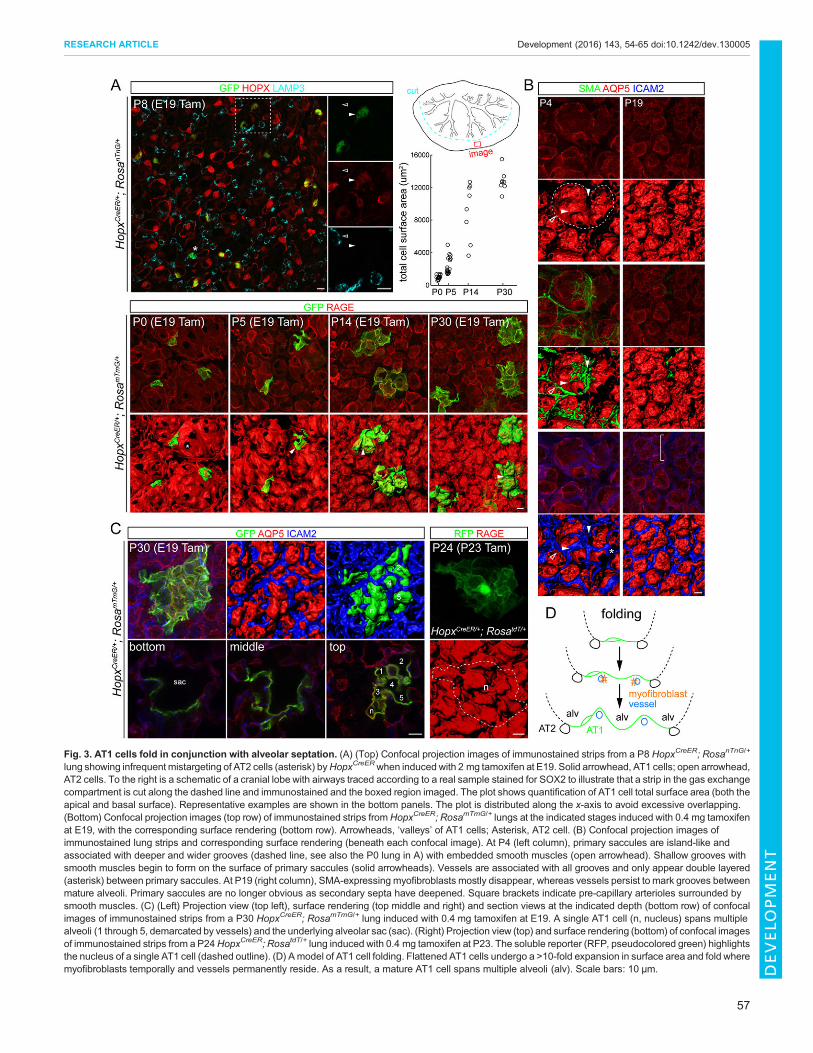
Fig. 3. AT1 cells fold in conjunction with alveolar septation. (A) (Top) Confocal projection images of immunostained strips from a P8 HopxCreER; RosanTnG/+
lung showing infrequent mistargeting of AT2 cells (asterisk) byHopxCreERwhen induced with 2 mg tamoxifen at E19. Solid arrowhead, AT1 cells; open arrowhead,AT2 cells. To the right is a schematic of a cranial lobe with airways traced according to a real sample stained for SOX2 to illustrate that a strip in the gas exchangecompartment is cut along the dashed line and immunostained and the boxed region imaged. The plot shows quantification of AT1 cell total surface area (both theapical and basal surface). Representative examples are shown in the bottom panels. The plot is distributed along the x-axis to avoid excessive overlapping.(Bottom) Confocal projection images (top row) of immunostained strips fromHopxCreER; RosamTmG/+ lungs at the indicated stages induced with 0.4 mg tamoxifenat E19, with the corresponding surface rendering (bottom row). Arrowheads, ‘valleys’ of AT1 cells; Asterisk, AT2 cell. (B) Confocal projection images ofimmunostained lung strips and corresponding surface rendering (beneath each confocal image). At P4 (left column), primary saccules are island-like andassociated with deeper and wider grooves (dashed line, see also the P0 lung in A) with embedded smooth muscles (open arrowhead). Shallow grooves withsmooth muscles begin to form on the surface of primary saccules (solid arrowheads). Vessels are associated with all grooves and only appear double layered(asterisk) between primary saccules. At P19 (right column), SMA-expressing myofibroblasts mostly disappear, whereas vessels persist to mark grooves betweenmature alveoli. Primary saccules are no longer obvious as secondary septa have deepened. Square brackets indicate pre-capillary arterioles surrounded bysmooth muscles. (C) (Left) Projection view (top left), surface rendering (top middle and right) and section views at the indicated depth (bottom row) of confocalimages of immunostained strips from a P30 HopxCreER; RosamTmG/+ lung induced with 0.4 mg tamoxifen at E19. A single AT1 cell (n, nucleus) spans multiplealveoli (1 through 5, demarcated by vessels) and the underlying alveolar sac (sac). (Right) Projection view (top) and surface rendering (bottom) of confocal imagesof immunostained strips from a P24HopxCreER; RosatdT/+ lung induced with 0.4 mg tamoxifen at P23. The soluble reporter (RFP, pseudocolored green) highlightsthe nucleus of a single AT1 cell (dashed outline). (D) Amodel of AT1 cell folding. Flattened AT1 cells undergo a >10-fold expansion in surface area and fold wheremyofibroblasts temporally and vessels permanently reside. As a result, a mature AT1 cell spans multiple alveoli (alv). Scale bars: 10 μm.
57
RESEARCH ARTICLE Development (2016) 143, 54-65 doi:10.1242/dev.130005
DEVELO
PM
ENT
Throughout such changes in cell morphology, the elongatedcells remained connected to their cuboidal neighbors via apicallyrestricted tight junctions and apically enriched adherens junctions(Fig. 2B). Interestingly, the basolateral side of the cuboidal cellscontained E-CAD and was surrounded by a continuous basementmembrane instead of adjacent AT1 cells (Fig. 2B). Such apicallyrestricted contact between AT1 and AT2 cells positioned AT2cells in the interstitial region rather than the lumenal space(Fig. 2B), an arrangement also observed for AT2 cells labeledindividually (Fig. 2A) and at later postnatal stages (Fig. S5).These results suggested that, in the initial step of AT1 cell
growth, columnar wedge-shaped progenitors flatten whilemaintaining apical tight junctions but losing lateral adherensjunctions, a process accompanied by cell type-specific molecularchanges (Fig. 2C).
AT1 cells fold in conjunction with alveolar septationTo specifically label AT1 cells and follow their subsequent growth,we screened seven Cre and CreER alleles of genes that wereexpected to be active in the lung epithelium and therefore potentiallyin AT1 cells. We characterized all of the alleles throughoutembryonic and postnatal stages using the same Cre reporter
Fig. 4. Scnn1a-Cre-driven ectopic SOX2 expression reprograms flattened AT1 cells. (A) Confocal projection images of immunostained P0 Scnn1a-Cre;RosamTmG/+ lung strips. Dashed lines denote a branch-like tube at the lobe edge with distal tips containing progenitors in clusters and proximal stalks containingintermingled flattened AT1 and cuboidal AT2 cells. The boxed region is enlarged to the right. Note that all labeled cells are flattened AT1 cells (demarcatedby E-CAD junctions) with nuclear HOPX (arrowhead), rather than cuboidal AT2 cells (asterisk). (B) Confocal projection images of immunostained Scnn1a-Cre;RosaSox2/+ lung strips at the indicated stages showing that isolated flattened mutant AT1 cells (demarcated by E-CAD junctions, dashed lines) form clusters withcompact cell arrangement over time. (C-E) Projection (C,D) or section (E) view of confocal images of immunostained strips from littermate control (C) andScnn1a-Cre; RosaSox2/+ (C,E) orScnn1a-Cre; RosamTmG/Sox2 (D) mutant lungs. (C) Comparedwith AT1 cells in the control lung or neighboring unrecombined AT1cells (open arrowhead), mutant AT1 cells (solid arrowhead) lose RAGE expression and have diffuse HOPX expression. Asterisks denote AT2 cells. (D) TheRosamTmG allele is easier to recombine than theRosaSox2 allele, generating juxtaposedGFP-labeled AT1 cells with andwithout SOX2 expression. Comparedwithcontrol AT1 cells (green outline with black dashed nuclei), mutant AT1 cells are smaller and express the proliferation marker KI67 (green outline with red dashednuclei). Note additional KI67 expression in mesenchymal cells. (E) Mutant AT1 cells express the basal cell marker P63 (arrowhead). (F) Left two panels showconfocal images of a control lung section showing that NKX2.1 is expressed by both AT1 (solid arrowheads) and AT2 (open arrowheads, cuboidal E-CAD staining)cells. All epithelial cell nuclei are genetically marked by GFP to allow co-staining with the rabbit anti-NKX2.1 antibody. Right two panels are confocal images ofsections from littermate control and Scnn1a-Cre; RosaSox2/+ mutant lungs. Mutant AT1 cells marked by GFP have nuclear (solid arrowhead) or diffuse (arrow)NKX2.1. Inset shows NKX2.1 single-channel image. NKX2.1 expression in AT2 cells (open arrowhead, cuboidal E-CAD staining) of the mutant lung is notaffected. (G) Scatterplot of log2 fold change in gene expression between two biological replicates. Compared with littermate control (Scnn1a-Cre; RosamTmG/+)AT1 cells, mutant (Scnn1a-Cre; RosaSox2/+) AT1 cells downregulate AT1 markers (green) and upregulate airway markers (red). The number in parenthesisdenotes the rank order in fold change among genes that are significantly different between control and mutant. Scale bars: 10 μm.
58
RESEARCH ARTICLE Development (2016) 143, 54-65 doi:10.1242/dev.130005
RosamTmG to allow direct comparison. Whereas some alleles had avery low (Krt8-CreER, Krt18-CreER, Krt14-Cre, Cldn6CreER) ornon-selective (Nkx2.1CreER) activity in the lung epithelium, Scnn1a-Cre (described below) and HopxCreER were found to be highlyselective for AT1 cells (Fig. S6). When recombination was inducedbefore E15, very rare cells were labeled by HopxCreER in the lung(Fig. S6F). When induced at E18,HopxCreER labeled elongated cellswith irregular extensions, similar to the aforementioned developingAT1 cells labeled by Sox9CreER (Fig. S4B). AlthoughHopxCreER canlabel AT2 cells (Jain et al., 2015), such leaky targeting wasinfrequent when induced at E19 using the nuclear reporter RosanTnG
(Prigge et al., 2013) (7/189 GFP+ cells from three mice; Fig. 3A),suggesting that HopxCreER has limited activity in bipotentialprogenitors. Labeled AT1 cells were readily identified by theircharacteristic thin cellular extensions that were marked byRosamTmG (Fig. 3, Fig. S6F).Timecourse morphological analysis using HopxCreER revealed
that AT1 cells underwent a folding process, whereby the initialflattened cells were sculptured into ‘mountains’ and ‘valleys’(Fig. 3A). Although individually variable at a given time point, AT1cells, as a population, had an increase in total cell surface area ofmore than 10-fold and reached a maximum of ∼12,000 μm2 by P30(Fig. 3A). The total (apical and basal) surface area of individualcells was comparable to the average apical surface area calculatedfrom the stereology data (Table S1) and the literature (Stone et al.,1992), with the difference attributed to tissue shrinkage (Fig. S1C)and possibly preferential labeling of AT1 cells that are more matureby HopxCreER at a limiting dose of tamoxifen.Notably, AT1 cell folding became apparent from P5, which
coincided with transformation of the smooth-walled primaryalveolar saccules into the honeycomb-like mature alveoli(Fig. 3A), a process known as secondary septation (Herzog et al.,2008). To further investigate this, we developed whole-mountstaining methods to visualize the septation in 3D. At P4, grooves ofvarious orientation and depth were visible on the alveolar surfacesubdividing the primary alveolar saccules (Fig. 3A,B). Mostgrooves contained smooth muscle actin-expressing cells,consistent with them being the myofibroblast-associatedsecondary septa (Herzog et al., 2008). All the grooves matched anetwork of vessels, which persisted even after the myofibroblastsdisappeared after P19 (Fig. 3B). Therefore, compared with thetransient nature of the myofibroblasts, the vessels are a moreconsistent and permanent marker of secondary septa. The apparentsimilarity in the size of the alveolar pocket between P4 and P19 islikely to be due to the formation of secondary septation, despite theincrease in total alveolar surface area by 3- to 4-fold (Table S1).Interestingly, unlike the capillary maturation model (Burri, 1984),all vessels were parallel, instead of perpendicular, to the grooves andtherefore did not bend to form a hairpin-like double-layeredstructure inside the grooves. Double-layered vessels were onlyobserved at the interface between adjacent primary alveolar sacculeswhere the vessel networks associated with individual saccules werejuxtaposed (Fig. 3B).Co-staining of individual folded AT1 cells with vessels revealed
that the ‘valleys’ of AT1 cells matched the vessels and thus wereconsidered to result from secondary septation, while the‘mountains’ corresponded to alveoli from subdivided primarysaccules (Fig. 3). As a result of cell folding, a single AT1 cell couldspan multiple alveoli and reach the more centrally located alveolarsac (Fig. 3C, see Fig. 3A for additional examples). Similar cellmorphology was observed using the soluble reporter RosatdT
(Madisen et al., 2010), which also highlighted the nucleus, thus
confirming that our approach labeled individual cells (Fig. 3C).These data suggest that AT1 cells further expand via a foldingprocess that matches the formation of capillaries and secondarysepta (Fig. 3D).
Developing AT1 cells retain cellular plasticityHaving shown that AT1 cells grow via a non-proliferative two-stepprocess, we sought to determine when and to what extent AT1 cellswere committed to this growth process. Since little is known aboutthe genes controlling AT1 cell development, we tested whether AT1cells could change their fate upon ectopic expression of SOX2, atranscription factor that is normally restricted to the airways andpromotes airway differentiation (Gontan et al., 2008; Que et al.,2009; Tompkins et al., 2009, 2011; Alanis et al., 2014). We firstused the Scnn1a-Cre allele identified in our driver screen thattargeted AT1 cells in the flattening stage and were thus committed toterminal differentiation. Although SCNN1A was detected in othercell types than AT1 (Borok et al., 2006; Johnson et al., 2002, 2006;Kimura et al., 2011), the Scnn1a-Cre allele was active in AT1 cellsafter E19, consistent with the perinatal upregulation of Scnn1a in thedistal lung epithelium (Fig. S7D) (Chang et al., 2013), and reached atargeting efficiency (defined as the percentage of AT1 cells thatwere targeted) of 71% (n=153 cells) and specificity (defined as thepercentage of targeted cells that were AT1 cells) of 95% (n=176cells from three mice) (Fig. 4A, Fig. S7). As expected from this AT1cell specificity, SOX2-expressing cells in the Scnn1a-Cre; RosaSox2/+
lung initially had isolated nuclei and the flattened morphology thatwas demarcated by E-CAD junctions (P2 in Fig. 4B). Strikingly, atP11, mutant cells formed large clusters with a compact cellarrangement reminiscent of that of the airways (Fig. 4B). Mutantcell clusters remained largely monolayered surrounding the airspaceand thus appeared less dramatic in section views (e.g. Fig. 4F).
Compared with control lungs or adjacent normal AT1 cells in thesame lung, targeted AT1 cells maintained a normal level, albeitdiffuse pattern, of HOPX expression, but downregulated other AT1cell markers including RAGE, upregulated the proliferation markerKI67 (26% of n=191 cells at P11; none in control AT1 cells; threemice in each group), and expressed an isoform of P63 (TRP63)specific for basal cells (52% of n=305 cells at P11; none in controlAT1 cells; three mice in each group) (Fig. 4C-E, Fig. S8A).However, only occasional mutant AT1 cells expressed additionalbasal or other airway cell markers, including KRT5, KRT14 andCCSP (SCGB1A1) (Fig. S8A), suggesting that the high level ofSOX2 expression from the RosaSox2 allele did not supportphysiological airway differentiation. In contrast to prior reports(Ikeda et al., 1995; Zhou et al., 1996), NKX2.1, a lung lineagetranscription factor, was expressed by both AT1 and AT2 cells, andfrequently lost its nuclear localization in mutant AT1 cells (Fig. 4F).This was associated with upregulation of MUC5AC (Fig. 4G,Fig. S8A), reminiscent of the gene expression changes associatedwith the formation of mucinous adenocarcinomas upon loss ofNKX2.1 (Winslow et al., 2011; Maeda et al., 2012; Snyder et al.,2013). These gene expression changes were confirmed bytranscriptome profiling of FACS-purified control and mutant AT1cells, which identified additional SOX2-suppressed AT1 cellmarkers (Fig. 4G, Fig. S9, Table S2).
Although Scnn1a-Cre targeted occasional AT2 cells, such leakytargeting (5%) could not account for the high percentage of mutantAT1 cells expressing KI67 (26%) and P63 (52%) and the robustclustering of mutant cells (Fig. 4B). To further substantiate theobserved AT1 cell plasticity, we activated RosaSox2 with anindependent Cre allele, Aqp5Cre (Flodby et al., 2010), which
59
RESEARCH ARTICLE Development (2016) 143, 54-65 doi:10.1242/dev.130005
targeted AT1 cells with an efficiency of 89% (n=329 cells) and aspecificity of 99% (n=317 cells from three mice) (Fig. S7).Essentially the same phenotypes were observed, including clusterformation over time (Fig. 5A), cell proliferation (KI67, 39% ofn=161 cells at P8; none in control AT1 cells; three mice in eachgroup), downregulation of AT1 markers and upregulation of airwaymarkers (P63, 42% of n=146 cells at P8; none in control AT1 cells;three mice in each group) (Fig. 5B, Fig. S8A). SOX2-induced P63expression was specific to AT1 cells, as RosaSox2 activation inairway cells by Sox2CreER (Alanis et al., 2014) or in mesenchymalcells by Tbx4-Cre (Kumar et al., 2014) did not lead to ectopic P63expression (Fig. S8B,C). Therefore, the overexpression of a singlegene is sufficient to reprogram flattened AT1 cells toward the airwaycell fate and allow them to proliferate.
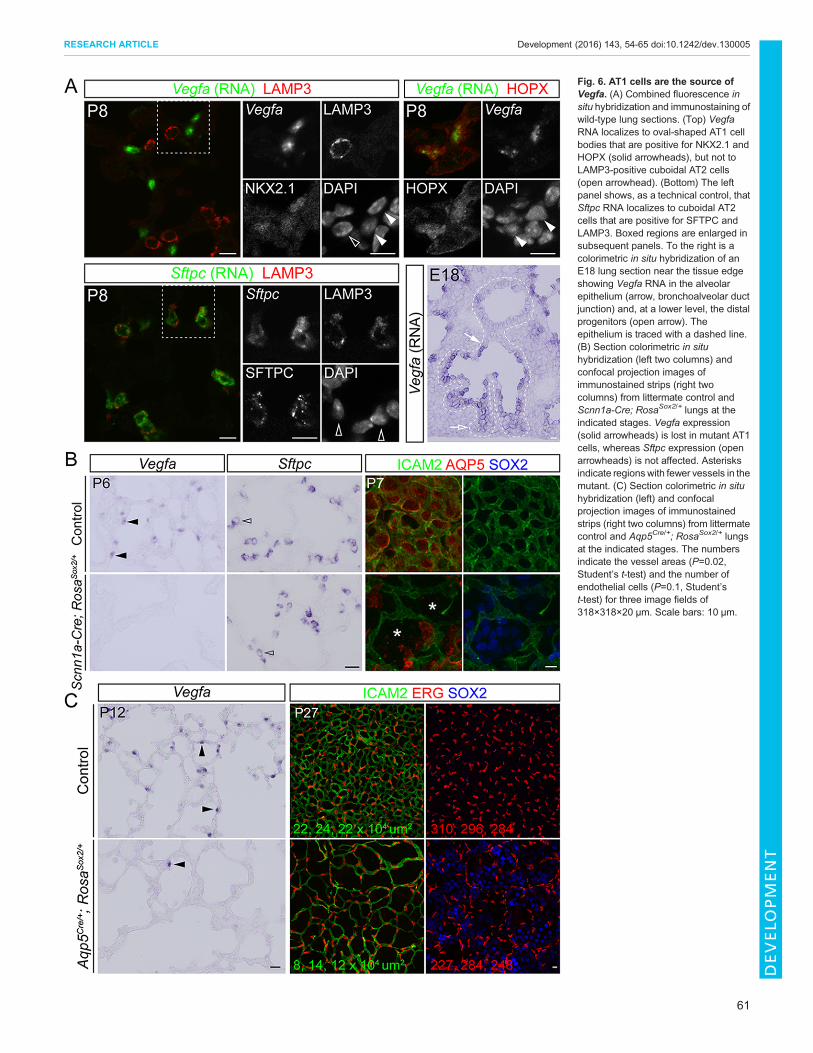
AT1 cells are the source of VegfaInterestingly, the angiogenic factor Vegfa was downregulated by16-fold in SOX2-expressing mutant AT1 cells (Fig. 4G, Table S2),an unexpected change given previous evidence for AT2 cells beingthe source of Vegfa (Bhatt et al., 2001; Ng et al., 2001). Topinpoint the cellular source of Vegfa, we developed a combinedfluorescence in situ hybridization and immunostaining protocoland found that the perinuclear localization of the Vegfa mRNAallowed assignment of its expression to AT1 cells, but not AT2cells (Fig. 6A), consistent with a recent single-cell transcriptomeanalysis (Treutlein et al., 2014). Vegfa mRNA was present in thealveolar epithelium at E18 and at a lower level in the distalprogenitors (Fig. 6A). Notably, Vegfa expression was lost inSOX2-expressing mutant AT1 cells, whereas the AT2 cell markerSftpc was not affected (Fig. 6B,C). This was accompanied by asimplified vascular network, as determined using the endothelialmarker ICAM2, which labels both cell junctions and cell surface(Halai et al., 2014), and a lower, albeit variable, density ofendothelial cells as determined using the endothelial nuclearmarker ERG (Birdsey et al., 2015) (three mice in each group;
Fig. 6C). These results suggested that normal AT1 celldevelopment is required for alveolar angiogenesis.
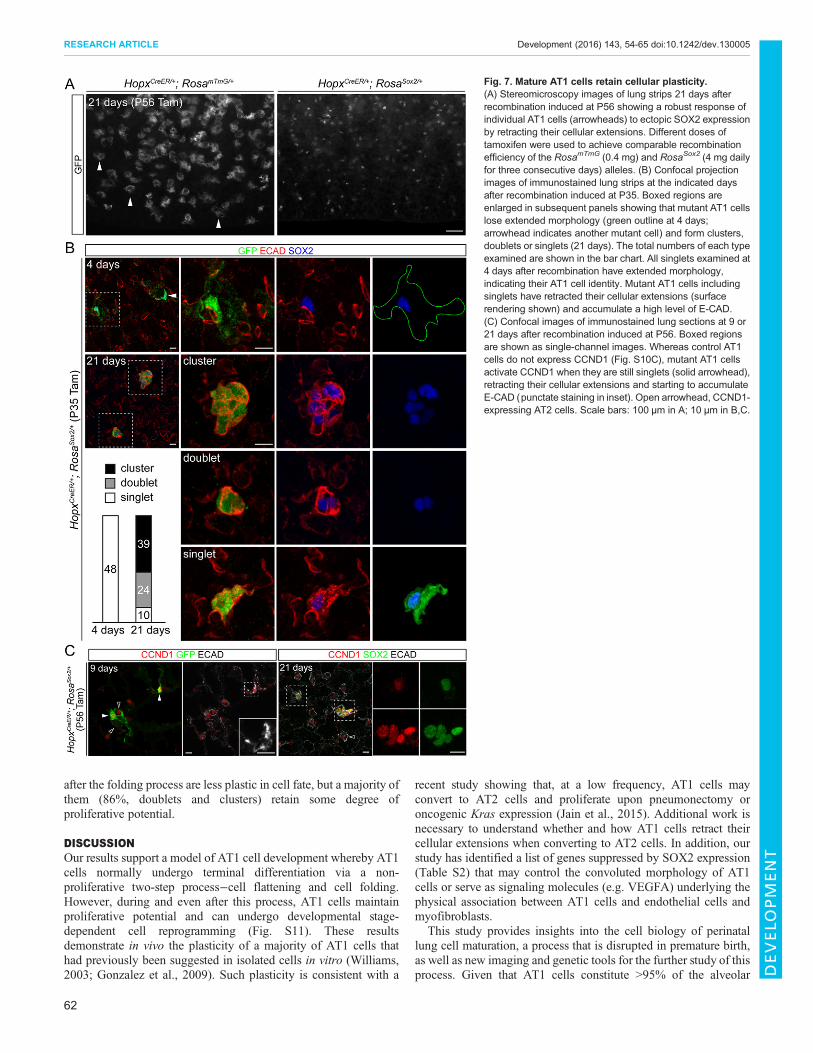
Mature AT1 cells retain cellular plasticityLastly, we examined the plasticity of mature AT1 cells by activatingRosaSox2 with the inducible HopxCreER allele. HopxCreER-inducedrecombination was almost exclusive to AT1 cells after 5 weeks,with an efficiency of 21% and specificity of 98% (n=248 cells fromthree mice) using RosamTmG (Fig. 7A). When RosaSox2 wasactivated at least 5 weeks after birth in AT1 cells that hadcompleted the folding process, mutant AT1 cells fully retractedtheir cellular extensions within 21 days and therefore were muchsmaller than their normal counterparts (Fig. 7A). This differencewas better demonstrated when comparing control and mutant AT1cells in the same lung, taking advantage of the lower recombinationefficiency of the RosaSox2 allele compared with the RosamTmG allele(Fig. S10A).
Although a subset of mutant AT1 cells (11%, n=72 cells fromthree mice) expressed KI67 at a given time (Fig. S10B), over timethe majority of targeted AT1 cells formed doublets (33%) or clusters(53%; n=73 from three mice) (Fig. 7B). Owing to the low efficiencyof HopxCreER in recombining the RosaSox2 allele, individual mutantdoublets or clusters were isolated from each other (Fig. 7B,C) andthus were considered to originate from a single targeted AT1 cell.All mutant cells, including singlets, accumulated a high level of E-CAD (Fig. 7B). Most mutant AT1 cells, including singlets (81%,n=43 cells from three mice), activated the cell cycle gene Ccnd1, aputative direct target of SOX2 (Chen et al., 2008) (Fig. 7C, Fig.S10C). Such activation occurred 9 days after recombination, whenmutant cells still had a single nucleus and elaborate cellularextensions and began to accumulate excessive E-CAD (Fig. 7C).Although NKX2.1 became diffuse, AT1 cell markers weremaintained and no airway markers, such as P63, CCSP, FOXJ1and MUC5AC, were observed in mutant AT1 cells (Fig. S10A,D).Therefore, compared with those in the flattening stage, AT1 cells
lung strips at the indicated stages. Somemutant AT1 cells (arrowhead) haveretracted their cellular extensions andaccumulate a high level of E-CAD at P3.Mutant cell clusters (arrow) are presentat P8. (B) Confocal images of sectionsfrom littermate control and mutant lungsshowing comparable phenotypes of AT1cells targeted with Aqp5Cre to thosetargeted with Scnn1a-Cre (Fig. 4).Mutant AT1 cells (GFP, arrowhead) formclusters, downregulate RAGE (boxedregion shown as single-channel imagesin insets), express KI67 and DNp63(deltaNp63), and have diffuse (arrow) ornuclear (solid arrowhead) NKX2.1(single-channel image shown in inset).NKX2.1 expression in AT2 cells (openarrowhead, cuboidal E-CAD staining) ofthe mutant lung is not affected. KI67 isexpressed in non-AT1 cells in the controllung (Fig. S3A). Scale bars: 10 μm.
60
RESEARCH ARTICLE Development (2016) 143, 54-65 doi:10.1242/dev.130005
Fig. 6. AT1 cells are the source ofVegfa. (A) Combined fluorescence insitu hybridization and immunostaining ofwild-type lung sections. (Top) VegfaRNA localizes to oval-shaped AT1 cellbodies that are positive for NKX2.1 andHOPX (solid arrowheads), but not toLAMP3-positive cuboidal AT2 cells(open arrowhead). (Bottom) The leftpanel shows, as a technical control, thatSftpc RNA localizes to cuboidal AT2cells that are positive for SFTPC andLAMP3. Boxed regions are enlarged insubsequent panels. To the right is acolorimetric in situ hybridization of anE18 lung section near the tissue edgeshowing Vegfa RNA in the alveolarepithelium (arrow, bronchoalveolar ductjunction) and, at a lower level, the distalprogenitors (open arrow). Theepithelium is traced with a dashed line.(B) Section colorimetric in situhybridization (left two columns) andconfocal projection images ofimmunostained strips (right twocolumns) from littermate control andScnn1a-Cre; RosaSox2/+ lungs at theindicated stages. Vegfa expression(solid arrowheads) is lost in mutant AT1cells, whereas Sftpc expression (openarrowheads) is not affected. Asterisksindicate regionswith fewer vessels in themutant. (C) Section colorimetric in situhybridization (left) and confocalprojection images of immunostainedstrips (right two columns) from littermatecontrol and Aqp5Cre/+; RosaSox2/+ lungsat the indicated stages. The numbersindicate the vessel areas (P=0.02,Student’s t-test) and the number ofendothelial cells (P=0.1, Student’st-test) for three image fields of318×318×20 μm. Scale bars: 10 μm.
61
RESEARCH ARTICLE Development (2016) 143, 54-65 doi:10.1242/dev.130005
DEVELO
PM
ENT
after the folding process are less plastic in cell fate, but a majority ofthem (86%, doublets and clusters) retain some degree ofproliferative potential.
DISCUSSIONOur results support a model of AT1 cell development whereby AT1cells normally undergo terminal differentiation via a non-proliferative two-step process−cell flattening and cell folding.However, during and even after this process, AT1 cells maintainproliferative potential and can undergo developmental stage-dependent cell reprogramming (Fig. S11). These resultsdemonstrate in vivo the plasticity of a majority of AT1 cells thathad previously been suggested in isolated cells in vitro (Williams,2003; Gonzalez et al., 2009). Such plasticity is consistent with a
recent study showing that, at a low frequency, AT1 cells mayconvert to AT2 cells and proliferate upon pneumonectomy oroncogenic Kras expression (Jain et al., 2015). Additional work isnecessary to understand whether and how AT1 cells retract theircellular extensions when converting to AT2 cells. In addition, ourstudy has identified a list of genes suppressed by SOX2 expression(Table S2) that may control the convoluted morphology of AT1cells or serve as signaling molecules (e.g. VEGFA) underlying thephysical association between AT1 cells and endothelial cells andmyofibroblasts.
This study provides insights into the cell biology of perinatallung cell maturation, a process that is disrupted in premature birth,as well as new imaging and genetic tools for the further study of thisprocess. Given that AT1 cells constitute >95% of the alveolar
Fig. 7. Mature AT1 cells retain cellular plasticity.(A) Stereomicroscopy images of lung strips 21 days afterrecombination induced at P56 showing a robust response ofindividual AT1 cells (arrowheads) to ectopic SOX2 expressionby retracting their cellular extensions. Different doses oftamoxifen were used to achieve comparable recombinationefficiency of the RosamTmG (0.4 mg) and RosaSox2 (4 mg dailyfor three consecutive days) alleles. (B) Confocal projectionimages of immunostained lung strips at the indicated daysafter recombination induced at P35. Boxed regions areenlarged in subsequent panels showing that mutant AT1 cellslose extended morphology (green outline at 4 days;arrowhead indicates another mutant cell) and form clusters,doublets or singlets (21 days). The total numbers of each typeexamined are shown in the bar chart. All singlets examined at4 days after recombination have extended morphology,indicating their AT1 cell identity. Mutant AT1 cells includingsinglets have retracted their cellular extensions (surfacerendering shown) and accumulate a high level of E-CAD.(C) Confocal images of immunostained lung sections at 9 or21 days after recombination induced at P56. Boxed regionsare shown as single-channel images. Whereas control AT1cells do not express CCND1 (Fig. S10C), mutant AT1 cellsactivate CCND1 when they are still singlets (solid arrowhead),retracting their cellular extensions and starting to accumulateE-CAD (punctate staining in inset). Open arrowhead, CCND1-expressing AT2 cells. Scale bars: 100 μm in A; 10 μm in B,C.
62
RESEARCH ARTICLE Development (2016) 143, 54-65 doi:10.1242/dev.130005
surface area, the cellular changes of AT1 cells are expected toreflect how the tubular epithelium generated by branchingmorphogenesis is transformed into a honeycomb-like alveolarepithelium during the saccular and alveolar stages of lungdevelopment (Yang and Chen, 2014). According to our single-cell morphology analyses, the first flattening step increasesepithelial surface to facilitate saccule formation while maintainingan interconnected epithelial sheet. Flattening of AT1 cells initiatesbehind the SOX9-positive branch tips, at a location where sacculesfirst appear (Chang et al., 2013; Desai et al., 2014). After flattening,individual AT1 cells increase surface area by more than 10-fold andundergo a folding step that matches with the formation of thehoneycomb-like mature alveoli, resulting in a single AT1 cellspanning multiple alveoli.Our multicolor 3D imaging of intact alveolar tissues suggests that,
besides myofibroblasts and vessels, AT1 cells are an integralcomponent and a potential regulator of secondary septation. Onsections, secondary septation appears as club-like inward growth ofthe saccule wall, which in 3D corresponds to grooves running indifferent directions along the saccule surface made of a single foldedAT1 cell. On sections, the septal tips often contain smooth muscleactin-expressing myofibroblasts, which in 3D correspond to fibroussmooth muscle bundles embedded in the aforementioned grooves.Conceivably, these smooth muscle bundles might function as a‘belt’ to limit structural changes locally while the rest of the sacculewall expands as the lung grows in volume. If true, the septamight notin fact grow inward but only appear to do so as the result of therelative outgrowth of the non-septa regions. Vessels are associatedwith the grooves as early as myofibroblasts and remain associatedafter the myofibroblasts disappear. This raises the intriguingpossibility that septa formation might be driven and/or stabilizedby vessels, while myofibroblasts might be required to overcomegreater tissue mechanical resistance during septa initiation. Notably,as judged by 3D analysis, all vessels run in parallel, instead ofperpendicular, to the grooves. We do not observe the doublecapillaries that have previously been suggested to form via hairpin-like bending of single capillaries into the septa (Burri, 1984). Furtherstudies are necessary to test whether the previously reported doublecapillaries are juxtaposed vessels that are associated with twoprimary saccules (Fig. 3B). Given the coordination among AT1cells, myofibroblasts and vessels, it is tempting to speculate that AT1cells might play a signaling role in addition to their structural roleduring secondary septation. Indeed, our results show that AT1 cells,instead of AT2 cells, are the source of the key alveolar angiogenicfactor VEGFA (Kasahara et al., 2000; Stenmark and Abman, 2005).Future genetic experiments should reveal whether AT1 cells signalto the endothelial cells by secreting angiogenic factors, such asVEGFA, and/or by forming permissive matrix substrates.Although AT1 cells are traditionally viewed as terminally
differentiated (Williams, 2003), our study shows that, at a highfrequency, flattened AT1 cells undergoing terminal differentiationcan be reprogrammed toward the airway fate and proliferate, andthat fully differentiated AT1 cells can retract their elaborate cellularextensions and proliferate. As AT1 cells require the overexpressionof a single gene to activate proliferation, it is tempting to speculatethat AT1 cells might also serve a stem cell function or as the cell-of-origin for a subset of lung cancers, both of which have been shownfor AT2 cells (Barkauskas et al., 2013; Desai et al., 2014). Giventhe substantial difference between AT1 and AT2 cells, thecorresponding tumors may have distinct molecular signatures andgenetic alterations. A deeper understanding of the tumorigenicpotential of AT1 cells, as well as of the mechanisms normally
restricting their proliferation, might implicate AT1 cells as a newcellular source for lung repair and lung cancer.
MATERIALS AND METHODSMiceThe following mouse (Mus musculus) strains were used: RosamTmG
(Muzumdar et al., 2007), RosaRG (Shioi et al., 2011), RosanTnG (Priggeet al., 2013), RosaSox2 (Lu et al., 2010), RosatdT (Madisen et al., 2010), ShhCre
(Harfe et al., 2004),HopxCreER (Takeda et al., 2011), Sox2CreER (Arnold et al.,2011), Sox9CreER (Soeda et al., 2010), Scnn1a-Cre (JAX stock number009613), Tbx4-Cre (Kumar et al., 2014), Aqp5Cre (Flodby et al., 2010), Krt8-CreER (Van Keymeulen et al., 2011), Krt18-CreER (Van Keymeulen et al.,2009), Krt14-Cre (Dassule et al., 2000), Cldn6CreER (Anderson et al., 2008)andNkx2.1CreER (Taniguchi et al., 2011). The amount of tamoxifen to achievethe desired level of recombination was determined empirically, as detailed inthe supplementary Materials and Methods.
Marker-based stereologyLungs were inflation fixed at 25 cm H2O pressure with 0.5%paraformaldehyde (P6148, Sigma) in phosphate-buffered saline (PBS, pH7.4). The left lobes were cryosectioned exhaustively at 60 μm with one inevery 15 sections collected for whole-mount immunostaining. STEPanizer(Tschanz et al., 2011) was used to obtain lung volume and alveolar surfacearea. The number of AT1 and AT2 cells in the entire stack (Nv) was directlycounted using Imaris (Bitplane). See the supplementary Materials andMethods for details.
Whole-mount and section immunostainingImmunostaining was performed following published protocols (Chang et al.,2013; Alanis et al., 2014). Cell and tissue surface rendering was generated inImaris with default settings: smoothing with surface area detail level at0.621 μm and thresholding by local contrast at 2.33 μm. For further details,including the antibodies used, see the supplementaryMaterials andMethods.
Fluorescence and colorimetric in situ hybridizationColorimetric section in situ hybridization was carried out followingpublished protocols (Chang et al., 2013; Alanis et al., 2014). Forfluorescence in situ hybridization, sections were incubated with 0.05 μg/mlriboprobes and a fluorescein tyramide signal amplification system(PerkinElmer, NEL741001KT) was used to detect the hybridizedriboprobes. See the supplementary Materials and Methods for details.
Transcriptome profiling of FACS-purified AT1 cellsCell dissociation and purification were performed based on a previousprotocol with modifications as detailed in the supplementary Materials andMethods (Chang et al., 2013). RNAwas extracted from at least 105 purifiedcells using Trizol reagents (Invitrogen, 15596018) and an RNeasyMicro Kit(Qiagen, 74004). RNAseq libraries were prepared using an mRNA isolationkit (New England BioLabs, E7490) and a NEBNext Ultra RNA LibraryPrep Kit (New England BioLabs, E7530S) and were sequenced on anIllumina HiSeq2000. Approximately 35-80 million 76 nt pair-end readswere generated for each sample and analyzed using standard tophat2,bowtie2 and cufflinks modules in R. The raw data were deposited in GEOunder accession number GSE73861.
AcknowledgementsWe thank Drs Brigid Hogan and Mark Onaitis for the RosaSox2mice; Drs Zea Borok,Edward Crandall and Per Flodby for the Aqp5Cre mice; Dr Samuel Ho for theMUC5AC antibody; and Dr Barry Stripp for the CCSP antibody.
Competing interestsThe authors declare no competing or financial interests.
Author contributionsJ.Y., B.J.H., D.M.A. and J.C. designed research; J.Y., B.J.H., D.M.A., O.N., L.V.-E.and E.J.O. performed research; E.J.O. analyzed the transcriptome data; H.A.provided theSox9CreERmice; S.E.E. providedmice; J.C. and E.J.O. wrote the paper;all authors read and approved the paper.
63
RESEARCH ARTICLE Development (2016) 143, 54-65 doi:10.1242/dev.130005
FundingThe University of Texas MD Anderson Cancer Center DNA Analysis Facility andFlow Cytometry and Cellular Imaging Core Facility are supported by the CancerCenter Support Grant [CA #16672] from the National Institutes of Health. This workwas supported by the University of Texas System Rising STARS Award, the Marchof Dimes Basil O’Connor Starter Scholar Research Award, the University CancerFoundation via the Institutional Research Grant program at the University of TexasMD Anderson Cancer Center and the University of Texas MD Anderson CancerCenter Start-up Fund (J.C.) and the National Institutes of Health [R01 HL117976 toS.E.E.]. J.C. is an R. Lee Clark Fellow of The University of Texas MD AndersonCancer Center. Deposited in PMC for release after 12 months.
Supplementary informationSupplementary information available online athttp://dev.biologists.org/lookup/suppl/doi:10.1242/dev.130005/-/DC1
ReferencesAlanis, D. M., Chang, D. R., Akiyama, H., Krasnow, M. A. and Chen, J. (2014).Two nested developmental waves demarcate a compartment boundary in themouse lung. Nat. Commun. 5, 3923.
Anderson, W. J., Zhou, Q., Alcalde, V., Kaneko, O. F., Blank, L. J., Sherwood,R. I., Guseh, J. S., Rajagopal, J. and Melton, D. A. (2008). Genetic targeting ofthe endoderm with claudin-6CreER. Dev. Dyn. 237, 504-512.
Arnold, K., Sarkar, A., Yram, M. A., Polo, J. M., Bronson, R., Sengupta, S.,Seandel, M., Geijsen, N. and Hochedlinger, K. (2011). Sox2(+) adult stem andprogenitor cells are important for tissue regeneration and survival of mice. CellStem Cell 9, 317-329.
Barkauskas, C. E., Cronce, M. J., Rackley, C. R., Bowie, E. J., Keene, D. R.,Stripp, B. R., Randell, S. H., Noble, P. W. and Hogan, B. L. M. (2013). Type 2alveolar cells are stem cells in adult lung. J. Clin. Invest. 123, 3025-3036.
Bhatt, A. J., Pryhuber, G. S., Huyck, H., Watkins, R. H., Metlay, L. A. andManiscalco, W. M. (2001). Disrupted pulmonary vasculature and decreasedvascular endothelial growth factor, Flt-1, and TIE-2 in human infants dying withbronchopulmonary dysplasia. Am. J. Respir. Crit. Care Med. 164, 1971-1980.
Birdsey, G. M., Shah, A. V., Dufton, N., Reynolds, L. E., Osuna Almagro, L.,Yang, Y., Aspalter, I. M., Khan, S. T., Mason, J. C., Dejana, E. et al. (2015). Theendothelial transcription factor ERG promotes vascular stability and growththrough Wnt/beta-catenin signaling. Dev. Cell 32, 82-96.
Borok, Z., Liebler, J. M., Lubman, R. L., Foster, M. J., Zhou, B., Li, X., Zabski, S.M., Kim, K. J. and Crandall, E. D. (2002). Na transport proteins are expressed byrat alveolar epithelial type I cells. Am. J. Physiol. Lung Cell Mol. Physiol. 282,L599-L608.
Burri, P. H. (1984). Fetal and postnatal development of the lung.Annu. Rev. Physiol.46, 617-628.
Chang, D. R., Martinez Alanis, D., Miller, R. K., Ji, H., Akiyama, H., McCrea, P. D.and Chen, J. (2013). Lung epithelial branching program antagonizes alveolardifferentiation. Proc. Natl. Acad. Sci. USA 110, 18042-18051.
Chen, Y., Shi, L., Zhang, L., Li, R., Liang, J., Yu, W., Sun, L., Yang, X., Wang, Y.,Zhang, Y. et al. (2008). The molecular mechanism governing the oncogenicpotential of SOX2 in breast cancer. J. Biol. Chem. 283, 17969-17978.
Crapo, J. D., Barry, B. E., Gehr, P., Bachofen, M. and Weibel, E. R. (1982). Cellnumber and cell characteristics of the normal human lung. Am. Rev. Respir. Dis.126, 332-337.
Danto, S. I., Shannon, J. M., Borok, Z., Zabski, S. M. and Crandall, E. D. (1995).Reversible transdifferentiation of alveolar epithelial cells. Am. J. Respir. Cell Mol.Biol. 12, 497-502.
Dassule, H. R., Lewis, P., Bei, M., Maas, R. and McMahon, A. P. (2000). Sonichedgehog regulates growth and morphogenesis of the tooth. Development 127,4775-4785.
Desai, T. J., Brownfield, D. G. and Krasnow, M. A. (2014). Alveolar progenitor andstem cells in lung development, renewal and cancer. Nature 507, 190-194.
Flodby, P., Borok, Z., Banfalvi, A., Zhou, B., Gao, D., Minoo, P., Ann, D. K.,Morrisey, E. E. and Crandall, E. D. (2010). Directed expression of Cre in alveolarepithelial type 1 cells. Am. J. Respir. Cell Mol. Biol. 43, 173-178.
Gontan, C., de Munck, A., Vermeij, M., Grosveld, F., Tibboel, D. and Rottier, R.(2008). Sox2 is important for two crucial processes in lung development:branching morphogenesis and epithelial cell differentiation. Dev. Biol. 317,296-309.
Gonzalez, R., Yang, Y. H., Griffin, C., Allen, L., Tigue, Z. and Dobbs, L. (2005).Freshly isolated rat alveolar type I cells, type II cells, and cultured type II cells havedistinct molecular phenotypes. Am. J. Physiol. Lung Cell. Mol. Physiol. 288,L179-L189.
Gonzalez, R. F., Allen, L. and Dobbs, L. G. (2009). Rat alveolar type I cellsproliferate, express OCT-4, and exhibit phenotypic plasticity in vitro.Am. J. Physiol. Lung Cell. Mol. Physiol. 297, L1045-L1055.
Halai, K., Whiteford, J., Ma, B., Nourshargh, S. and Woodfin, A. (2014). ICAM-2facilitates luminal interactions between neutrophils and endothelial cells in vivo.J. Cell Sci. 127, 620-629.
Harfe, B. D., Scherz, P. J., Nissim, S., Tian, H., McMahon, A. P. and Tabin, C. J.(2004). Evidence for an expansion-based temporal Shh gradient in specifyingvertebrate digit identities. Cell 118, 517-528.
Herzog, E. L., Brody, A. R., Colby, T. V., Mason, R. and Williams, M. C. (2008).Knowns and unknowns of the alveolus. Proc. Am. Thorac. Soc. 5, 778-782.
Hsia, C. C.W., Hyde, D. M., Ochs, M.,Weibel, E. R. and on behalf of the ATS/ERSJoint Task Force on the Quantitative Assessment of Lung Structure (2010).An official research policy statement of the American Thoracic Society/EuropeanRespiratory Society: standards for quantitative assessment of lung structure.Am. J. Respir. Crit. Care Med. 181, 394-418.
Ikeda, K., Clark, J. C., Shaw-White, J. R., Stahlman, M. T., Boutell, C. J. andWhitsett, J. A. (1995). Gene structure and expression of human thyroidtranscription factor-1 in respiratory epithelial cells. J. Biol. Chem. 270, 8108-8114.
Jain, R., Barkauskas, C. E., Takeda, N., Bowie, E. J., Aghajanian, H., Wang, Q.,Padmanabhan, A., Manderfield, L. J., Gupta, M., Li, D. et al. (2015). Plasticity ofHopx(+) type I alveolar cells to regenerate type II cells in the lung.Nat. Commun. 6,6727.
Johnson, M. D.,Widdicombe, J. H., Allen, L., Barbry, P. andDobbs, L. G. (2002).Alveolar epithelial type I cells contain transport proteins and transport sodium,supporting an active role for type I cells in regulation of lung liquid homeostasis.Proc. Natl. Acad. Sci. USA 99, 1966-1971.
Johnson, M. D., Bao, H.-F., Helms, M. N., Chen, X.-J., Tigue, Z., Jain, L., Dobbs,L. G. and Eaton, D. C. (2006). Functional ion channels in pulmonary alveolar typeI cells support a role for type I cells in lung ion transport. Proc. Natl. Acad. Sci. USA103, 4964-4969.
Kasahara, Y., Tuder, R. M., Taraseviciene-Stewart, L., Le Cras, T. D., Abman, S.,Hirth, P. K., Waltenberger, J. and Voelkel, N. F. (2000). Inhibition of VEGFreceptors causes lung cell apoptosis and emphysema. J. Clin. Invest. 106,1311-1319.
Kauffman, S. L., Burri, P. H. and Weibel, E. R. (1974). The postnatal growth of therat lung. II. Autoradiography. Anat. Rec. 180, 63-76.
Kim, D., Pertea, G., Trapnell, C., Pimentel, H., Kelley, R. and Salzberg, S. L.(2013). TopHat2: accurate alignment of transcriptomes in the presence ofinsertions, deletions and gene fusions. Genome Biol. 14, R36.
Kimura, T., Kawabe, H., Jiang, C., Zhang, W., Xiang, Y.-Y., Lu, C., Salter, M. W.,Brose, N., Lu,W.-Y. and Rotin, D. (2011). Deletion of the ubiquitin ligase Nedd4Lin lung epithelia causes cystic fibrosis-like disease. Proc. Natl. Acad. Sci. USA108, 3216-3221.
Kuhn, C. (1988). Biotin stores in rodent lungs: localization to Clara and type IIalveolar cells. Exp. Lung Res. 14, 527-536.
Kumar, M. E., Bogard, P. E., Espinoza, F. H., Menke, D. B., Kingsley, D. M. andKrasnow, M. A. (2014). Mesenchymal cells. Defining a mesenchymal progenitorniche at single-cell resolution. Science 346, 1258810.
Langmead, B. and Salzberg, S. L. (2012). Fast gapped-read alignment with Bowtie2. Nat. Methods 9, 357-359.
Lu, Y., Futtner, C., Rock, J. R., Xu, X., Whitworth, W., Hogan, B. L. M. andOnaitis, M. W. (2010). Evidence that SOX2 overexpression is oncogenic in thelung. PLoS ONE 5, e11022.
Madisen, L., Zwingman, T. A., Sunkin, S. M., Oh, S. W., Zariwala, H. A., Gu, H.,Ng, L. L., Palmiter, R. D., Hawrylycz, M. J., Jones, A. R. et al. (2010). A robustand high-throughput Cre reporting and characterization system for the wholemouse brain. Nat. Neurosci. 13, 133-140.
Maeda, Y., Tsuchiya, T., Hao, H., Tompkins, D. H., Xu, Y., Mucenski, M. L., Du, L.,Keiser, A. R., Fukazawa, T., Naomoto, Y. et al. (2012). Kras(G12D) and Nkx2-1haploinsufficiency induce mucinous adenocarcinoma of the lung. J. Clin. Invest.122, 4388-4400.
Muzumdar, M. D., Tasic, B., Miyamichi, K., Li, L. and Luo, L. (2007). A globaldouble-fluorescent Cre reporter mouse. Genesis 45, 593-605.
Ng, Y.-S., Rohan, R., Sunday, M. E., Demello, D. E. and D’Amore, P. A. (2001).Differential expression of VEGF isoforms in mouse during development and in theadult. Dev. Dyn. 220, 112-121.
Prigge, J. R., Wiley, J. A., Talago, E. A., Young, E. M., Johns, L. L., Kundert,J. A., Sonsteng, K. M., Halford, W. P., Capecchi, M. R. and Schmidt, E. E.(2013). Nuclear double-fluorescent reporter for in vivo and ex vivo analyses ofbiological transitions in mouse nuclei. Mamm. Genome 24, 389-399.
Que, J., Luo, X., Schwartz, R. J. and Hogan, B. L. (2009). Multiple roles for Sox2 inthe developing and adult mouse trachea. Development 136, 1899-1907.
Rawlins, E. L., Clark, C. P., Xue, Y. and Hogan, B. L. M. (2009). The Id2+ distal tiplung epithelium contains individual multipotent embryonic progenitor cells.Development 136, 3741-3745.
Roberts, A., Pimentel, H., Trapnell, C. and Pachter, L. (2011a). Identification ofnovel transcripts in annotated genomes using RNA-Seq. Bioinformatics 27,2325-2329.
Roberts, A., Trapnell, C., Donaghey, J., Rinn, J. L. and Pachter, L. (2011b).Improving RNA-Seq expression estimates by correcting for fragment bias.Genome Biol. 12, R22.
Scherle, W. (1970). A simple method for volumetry of organs in quantitativestereology. Mikroskopie 26, 57-60.
64
RESEARCH ARTICLE Development (2016) 143, 54-65 doi:10.1242/dev.130005
Schittny, J. C., Djonov, V., Fine, A. andBurri, P. H. (1998). Programmed cell deathcontributes to postnatal lung development. Am. J. Respir. Cell Mol. Biol. 18,786-793.
Shioi, G., Kiyonari, H., Abe, T., Nakao, K., Fujimori, T., Jang, C.-W., Huang, C.-C., Akiyama, H., Behringer, R. R. and Aizawa, S. (2011). A mouse reporter lineto conditionally mark nuclei and cell membranes for in vivo live-imaging. Genesis49, 570-578.
Snippert, H. J., van der Flier, L. G., Sato, T., van Es, J. H., van den Born, M.,Kroon-Veenboer, C., Barker, N., Klein, A. M., van Rheenen, J., Simons, B. D.et al. (2010). Intestinal crypt homeostasis results from neutral competitionbetween symmetrically dividing Lgr5 stem cells. Cell 143, 134-144.
Snyder, E. L., Watanabe, H., Magendantz, M., Hoersch, S., Chen, T. A., Wang,D. G., Crowley, D., Whittaker, C. A., Meyerson, M., Kimura, S. et al. (2013).Nkx2-1 represses a latent gastric differentiation program in lung adenocarcinoma.Mol. Cell 50, 185-199.
Soeda, T., Deng, J. M., de Crombrugghe, B., Behringer, R. R., Nakamura, T. andAkiyama, H. (2010). Sox9-expressing precursors are the cellular origin of thecruciate ligament of the knee joint and the limb tendons. Genesis 48, 635-644.
Stenmark, K. R. and Abman, S. H. (2005). Lung vascular development:implications for the pathogenesis of bronchopulmonary dysplasia. Annu. Rev.Physiol. 67, 623-661.
Stone, K. C., Mercer, R. R., Gehr, P., Stockstill, B. and Crapo, J. D. (1992).Allometric relationships of cell numbers and size in the mammalian lung.Am. J. Respir. Cell Mol. Biol. 6, 235-243.
Takeda, N., Jain, R., LeBoeuf, M. R., Wang, Q., Lu, M. M. and Epstein, J. A.(2011). Interconversion between intestinal stem cell populations in distinct niches.Science 334, 1420-1424.
Taniguchi, H., He, M., Wu, P., Kim, S., Paik, R., Sugino, K., Kvitsiani, D., Fu, Y.,Lu, J., Lin, Y. et al. (2011). A resource of Cre driver lines for genetic targeting ofGABAergic neurons in cerebral cortex. Neuron 71, 995-1013.
Tompkins, D. H., Besnard, V., Lange, A. W., Wert, S. E., Keiser, A. R., Smith,A. N., Lang, R. and Whitsett, J. A. (2009). Sox2 is required for maintenance anddifferentiation of bronchiolar Clara, ciliated, and goblet cells. PLoS ONE 4, e8248.
Tompkins, D. H., Besnard, V., Lange, A. W., Keiser, A. R., Wert, S. E., Bruno,M. D. and Whitsett, J. A. (2011). Sox2 activates cell proliferation anddifferentiation in the respiratory epithelium. Am. J. Respir. Cell Mol. Biol. 45,101-110.
Trapnell, C., Roberts, A., Goff, L., Pertea, G., Kim, D., Kelley, D. R., Pimentel, H.,Salzberg, S. L., Rinn, J. L. and Pachter, L. (2012). Differential gene and
transcript expression analysis of RNA-seq experiments with TopHat and Cufflinks.Nat. Protoc. 7, 562-578.
Trapnell, C., Hendrickson, D. G., Sauvageau, M., Goff, L., Rinn, J. L. andPachter, L. (2013). Differential analysis of gene regulation at transcript resolutionwith RNA-seq. Nat. Biotechnol. 31, 46-53.
Treutlein, B., Brownfield, D. G., Wu, A. R., Neff, N. F., Mantalas, G. L., Espinoza,F. H., Desai, T. J., Krasnow, M. A. and Quake, S. R. (2014). Reconstructinglineage hierarchies of the distal lung epithelium using single-cell RNA-seq.Nature509, 371-375.
Tschanz, S. A., Burri, P. H. andWeibel, E. R. (2011). A simple tool for stereologicalassessment of digital images: the STEPanizer. J. Microsc. 243, 47-59.
Van Keymeulen, A., Mascre, G., Youseff, K. K., Harel, I., Michaux, C., De Geest,N., Szpalski, C., Achouri, Y., Bloch, W., Hassan, B. A. et al. (2009). Epidermalprogenitors give rise to Merkel cells during embryonic development and adulthomeostasis. J. Cell Biol. 187, 91-100.
Van Keymeulen, A., Rocha, A. S., Ousset, M., Beck, B., Bouvencourt, G., Rock,J., Sharma, N., Dekoninck, S. and Blanpain, C. (2011). Distinct stem cellscontribute to mammary gland development and maintenance. Nature 479,189-193.
Weibel, E. R. (1971). The mystery of “non-nucleated plates” in the alveolarepithelium of the lung explained. Cells Tissues Organs 78, 425-443.
Weibel, E. R. (2015). On the tricks alveolar epithelial cells play to make a good lung.Am. J. Respir. Crit. Care Med. 191, 504-513.
Williams,M. C. (2003). Alveolar type I cells: molecular phenotype and development.Annu. Rev. Physiol. 65, 669-695.
Williams, R.W. and Rakic, P. (1988). Three-dimensional counting: an accurate anddirect method to estimate numbers of cells in sectioned material. J. Comp. Neurol.278, 344-352.
Winslow, M. M., Dayton, T. L., Verhaak, R. G. W., Kim-Kiselak, C., Snyder, E. L.,Feldser, D. M., Hubbard, D. D., DuPage, M. J., Whittaker, C. A., Hoersch, S.et al. (2011). Suppression of lung adenocarcinoma progression byNkx2-1.Nature473, 101-104.
Yang, J. and Chen, J. (2014). Developmental programs of lung epithelialprogenitors: a balanced progenitor model. Wiley Interdiscip. Rev. Dev. Biol. 3,331-347.
Zhou, L., Lim, L., Costa, R. H. and Whitsett, J. A. (1996). Thyroid transcriptionfactor-1, hepatocyte nuclear factor-3beta, surfactant protein B, C, and Clara cellsecretory protein in developing mouse lung. J. Histochem. Cytochem. 44,1183-1193.
65
RESEARCH ARTICLE Development (2016) 143, 54-65 doi:10.1242/dev.130005