FE793 The Dynamics and Implications of Recent Increases in Citrus Production Costs 1 Ronald P. Muraro and Robert A. Morris 2 1. This is EDIS document FE793, a publication of the Food and Resource Economics Department, Florida Cooperative Extension Service, Institute of Food and Agricultural Sciences, University of Florida, Gainesville, FL. Published March 2009. Please visit the EDIS website at http://edis.ifas.ufl.edu. 2. Ronald P. Muraro, professor, and Robert A. Morris, associate extension scientist, Food and Resource Economics Department, Citrus Research and Education Center, Lake Alfred, FL, Florida Cooperative Extension Service, Institute of Food and Agricultural Sciences, University of Florida, Gainesville, FL. The Institute of Food and Agricultural Sciences (IFAS) is an Equal Opportunity Institution authorized to provide research, educational information and other services only to individuals and institutions that function with non-discrimination with respect to race, creed, color, religion, age, disability, sex, sexual orientation, marital status, national origin, political opinions or affiliations. U.S. Department of Agriculture, Cooperative Extension Service, University of Florida, IFAS, Florida A. & M. University Cooperative Extension Program, and Boards of County Commissioners Cooperating. Millie Ferrer, Interim Dean Introduction Soaring energy and fertilizer prices along with the added costs to manage citrus greening and canker are significantly changing the composition of production costs for Florida citrus growers. Once impacted primarily by inflation rates and technological changes, citrus production costs are now being driven by the rapidly growing global demand for fuels and fertilizer. Moreover, implementation of management programs for the control of citrus greening are also increasing the costs to produce citrus as a result of increased requirements for labor/scouting, pesticide applications, and resets. This article examines the magnitude of recent changes in citrus production costs for Florida growers and discusses their implications. 1993–2003: A Period of Citrus Production Cost Stability The ten-year period between 1993 and 2003 was characterized by relatively stable production costs for the Florida citrus industry. Between 1993 and 2003, processed orange production costs were relatively flat, ranging from $779 per acre for a Southwest Florida orange grove in 1993 to $775 per acre in 2003. When adjusted for inflation, these costs actually declined by 14% over this period (Table 1). This was primarily because input prices were relatively stable and Florida growers increased their focus on cost efficiencies in response to low processed orange prices. For example, delivered-in processed orange prices ranged from a low of $0.68 per pound solids in 1992–93 to a high of $1.07 per pound solids in 1995–96. When adjusted for inflation to 2003 dollars, fruit prices over this ten-year period ranged from $0.79 to $1.18 per pound solids, which was not much higher. 2003–2008: Increased Cost Volatility Since the 2002–03 season, processed orange production costs have increased by 61%, from $775 to $1,246 per acre, not including the costs of managing greening (Table 2). If greening management costs are included, grove care costs for a southwest Florida processed orange grove are now Archival copy: for current recommendations see http://edis.ifas.ufl.edu or your local extension office.
Transcript
FE793
The Dynamics and Implications of Recent Increases in Citrus Production Costs1
Ronald P. Muraro and Robert A. Morris2
1. This is EDIS document FE793, a publication of the Food and Resource Economics Department, Florida Cooperative Extension Service, Institute of Food and Agricultural Sciences, University of Florida, Gainesville, FL. Published March 2009. Please visit the EDIS website at http://edis.ifas.ufl.edu.
2. Ronald P. Muraro, professor, and Robert A. Morris, associate extension scientist, Food and Resource Economics Department, Citrus Research and Education Center, Lake Alfred, FL, Florida Cooperative Extension Service, Institute of Food and Agricultural Sciences, University of Florida,
Gainesville, FL.
The Institute of Food and Agricultural Sciences (IFAS) is an Equal Opportunity Institution authorized to provide research, educational information and other services only to individuals and institutions that function with non-discrimination with respect to race, creed, color, religion, age, disability, sex, sexual orientation, marital status, national origin, political opinions or affiliations. U.S. Department of Agriculture, Cooperative Extension Service, University of Florida, IFAS, Florida A. & M. University Cooperative Extension Program, and Boards of County Commissioners Cooperating. Millie Ferrer, Interim Dean
Introduction
Soaring energy and fertilizer prices along with the added costs to manage citrus greening and canker are significantly changing the composition of production costs for Florida citrus growers. Once impacted primarily by inflation rates and technological changes, citrus production costs are now being driven by the rapidly growing global demand for fuels and fertilizer. Moreover, implementation of management programs for the control of citrus greening are also increasing the costs to produce citrus as a result of increased requirements for labor/scouting, pesticide applications, and resets. This article examines the magnitude of recent changes in citrus production costs for Florida growers and discusses their implications.
1993–2003: A Period of Citrus Production Cost Stability
The ten-year period between 1993 and 2003 was characterized by relatively stable production costs for the Florida citrus industry. Between 1993 and 2003,
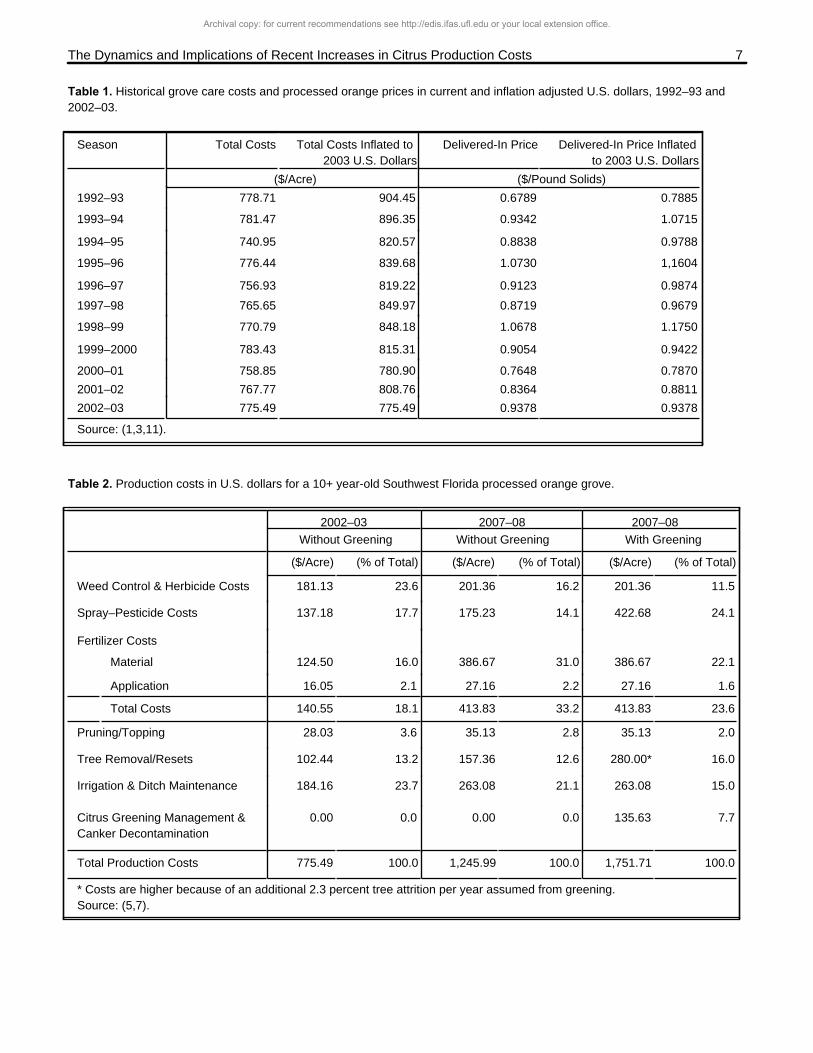
processed orange production costs were relatively flat, ranging from $779 per acre for a Southwest Florida orange grove in 1993 to $775 per acre in 2003. When adjusted for inflation, these costs actually declined by 14% over this period (Table 1). This was primarily because input prices were relatively stable and Florida growers increased their focus on cost efficiencies in response to low processed orange prices. For example, delivered-in processed orange prices ranged from a low of $0.68 per pound solids in 1992–93 to a high of $1.07 per pound solids in 1995–96. When adjusted for inflation to 2003 dollars, fruit prices over this ten-year period ranged from $0.79 to $1.18 per pound solids, which was not much higher.
2003–2008: Increased Cost Volatility
Since the 2002–03 season, processed orange production costs have increased by 61%, from $775 to $1,246 per acre, not including the costs of managing greening (Table 2). If greening management costs are included, grove care costs for a southwest Florida processed orange grove are now
Archival copy: for current recommendations see http://edis.ifas.ufl.edu or your local extension office.
The Dynamics and Implications of Recent Increases in Citrus Production Costs 2
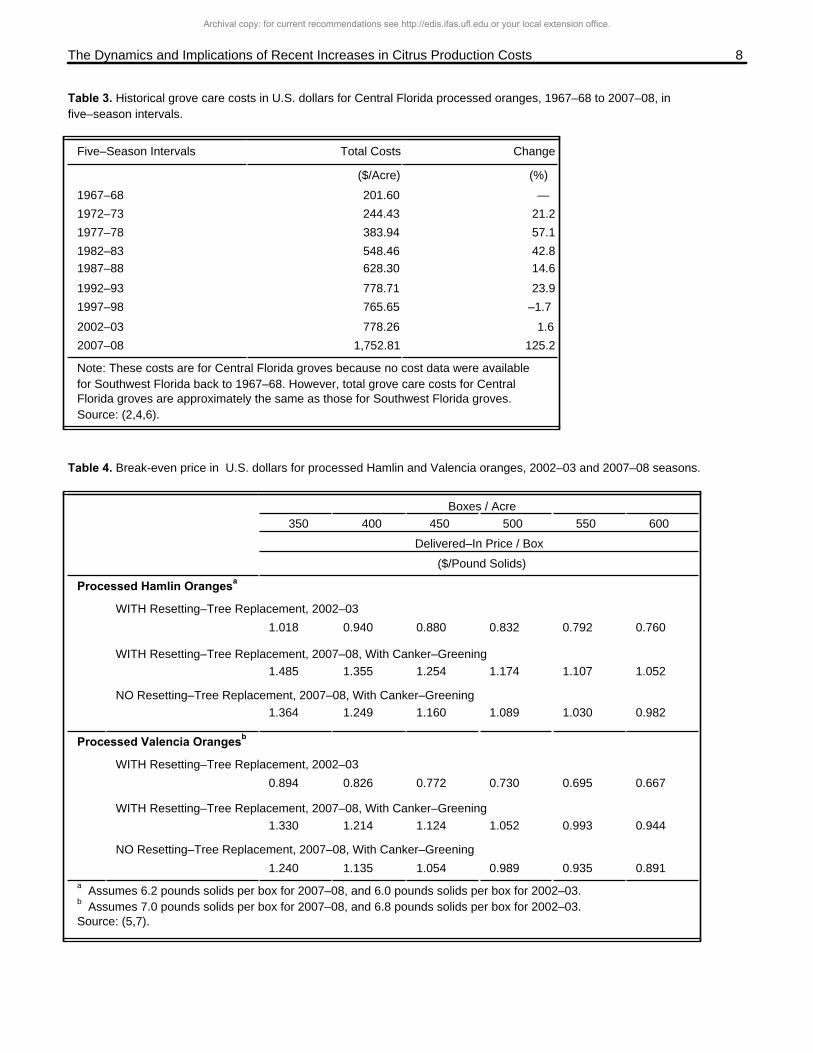
almost $1,800 per acre, more than double the cost in 2002–03. An examination of grove care costs in five-season intervals shows that this is by far the largest increase in grove care costs in any five-season period since the 1960s (Table 3). This recent major shift in grove care costs has also substantially increased break-even prices (Table 4). Adding harvest and haul costs and DOC taxes, totaling $2.77 per box, plus indirect costs, including interest on working capital, taxes, management costs, and interest on investment, brings the break-even price of producing Hamlin oranges at a yield of 450 boxes per acre to $1.25 per pound solids. The break-even price of producing Valencia oranges at a yield of 400 boxes per acre is slightly less at $1.21 per pound solids. This compares to break-even prices of $0.88 per pound solids for Hamlins and $0.83 per pound solids for Valencias at yields of 450 and 400 boxes per acre, respectively, in 2002–03. Break even prices in this comparison are less for Valencias than for Hamlins, even at lower box yields per acre, because of an offsetting higher pound solids yield for Valencias.
Dynamics of Production Cost Increases
Since the 2002–03 season, all areas of grove care have increased in costs. Not including fertilizer or costs to manage greening, grove care costs between 2002–03 and 2007–08 increased on average by 31%, ranging from 10% for weed control to 54% for tree replacement/resets (Figure 1). The price of nursery trees more than doubled between 2002–03 and 2007–08, going from about $4.25 per tree to $8.50 per tree or more. This was primarily due to citrus canker which drastically reduced the supply of trees, and regulations to help control canker and greening which increased the costs of producing trees. Fertilizer represents the largest cost increase for grove care, almost tripling since 2002–03. The primary contributors to cost increases for grove care, other than fertilizer and greening management costs, are increased costs for fuel, labor, and chemicals, with increased fuel costs accounting for most of the cost increases.
Figure 1. Change in production costs in U.S. dollars for Southwest Florida processed oranges between 2002–03 and 2007–08 without citrus greening costs. Source: (5,7).
Oil prices have skyrocketed since 2003, which has also increased gasoline and diesel prices. Oil prices increased from $26.66 per barrel in July of
2003 to $137.11 per barrel by July of 2008, hitting a peak of $147 per barrel on July 11, 2008. Major worldwide financial problems have recently weakened demand and decreased these prices to below $50 per barrel (as of December 2008), but given OPEC's apparent plans to reduce future oil output, it is difficult to say whether this decline is sustainable or higher prices will return.
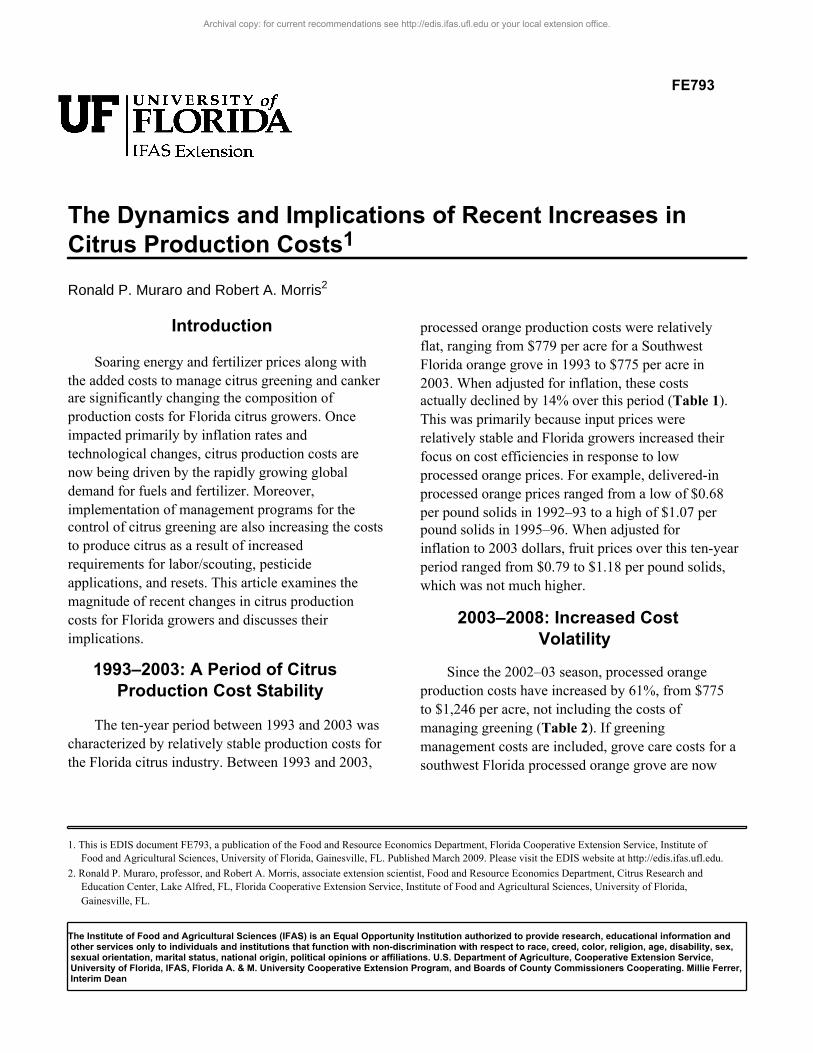
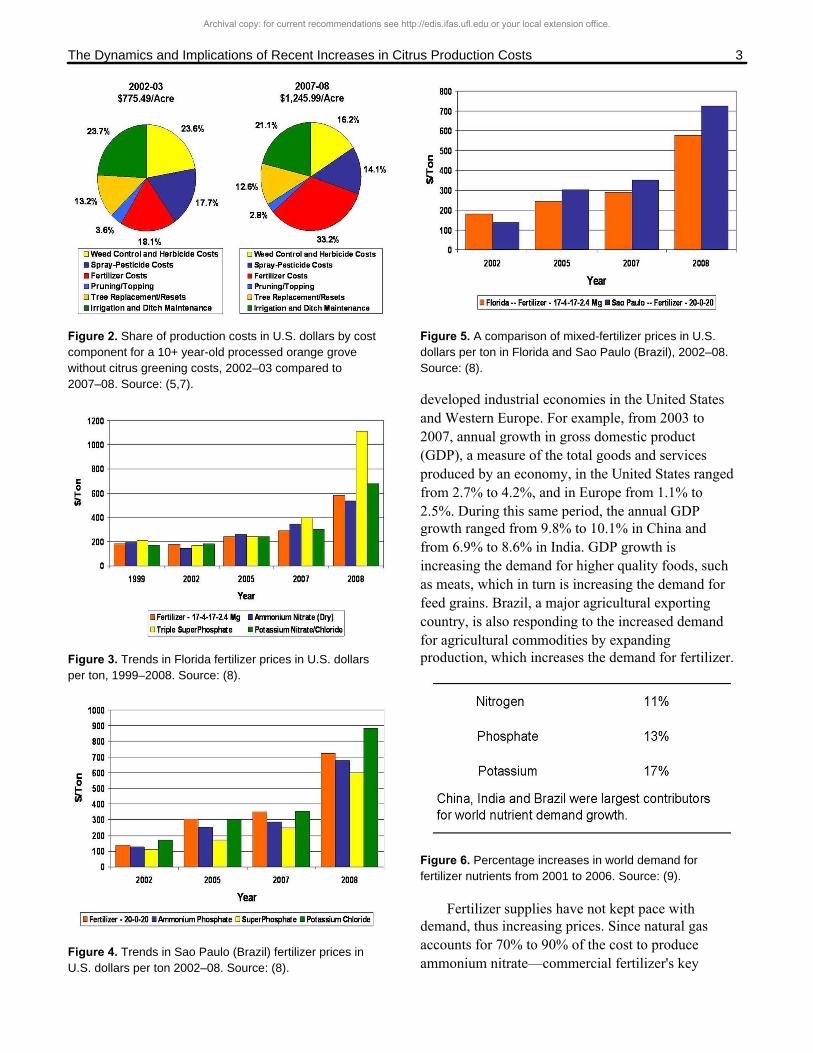
In 2002–03, fertilizer costs were $140.55 per acre, or 18% of grove care costs. By 2007–08, they had increased by just over 194%, to $413.83 per acre, and represented 33% of grove care costs (Table 2 and Figures 1 and 2). A look at trends in fertilizer prices shows that most of these price increases have occurred since 2005 (Figures 3 and 4). Mixed fertilizer prices went from around $200 per ton in the 1999–2005 period to almost $600 per ton by 2008. Triple super phosphate prices increased by more than mixed fertilizer, going from about $200 per ton in the 1999–2005 period to over $1,000 per ton by 2008. Mixed fertilizer prices increased more in Brazil than in Florida (Figure 5). However, since these costs are in U.S. dollars, the devaluing dollar against the Brazilian Real over this period is likely a contributor to these higher fertilizer costs for Brazil.
The key variables that account for increased fertilizer prices are increased demand in China, India, and Brazil and higher fuel prices (Figures 6 and 7). The economic growth of rapidly industrializing China and India has greatly outpaced that of the more
Archival copy: for current recommendations see http://edis.ifas.ufl.edu or your local extension office.
The Dynamics and Implications of Recent Increases in Citrus Production Costs 3
Figure 2. Share of production costs in U.S. dollars by cost component for a 10+ year-old processed orange grove without citrus greening costs, 2002–03 compared to 2007–08. Source: (5,7).
Figure 3. Trends in Florida fertilizer prices in U.S. dollars per ton, 1999–2008. Source: (8).
Figure 4. Trends in Sao Paulo (Brazil) fertilizer prices in U.S. dollars per ton 2002–08. Source: (8).
Figure 5. A comparison of mixed-fertilizer prices in U.S. dollars per ton in Florida and Sao Paulo (Brazil), 2002–08. Source: (8).
developed industrial economies in the United States and Western Europe. For example, from 2003 to 2007, annual growth in gross domestic product (GDP), a measure of the total goods and services produced by an economy, in the United States ranged from 2.7% to 4.2%, and in Europe from 1.1% to 2.5%. During this same period, the annual GDP growth ranged from 9.8% to 10.1% in China and from 6.9% to 8.6% in India. GDP growth is increasing the demand for higher quality foods, such as meats, which in turn is increasing the demand for feed grains. Brazil, a major agricultural exporting country, is also responding to the increased demand for agricultural commodities by expanding production, which increases the demand for fertilizer.
Figure 6. Percentage increases in world demand for fertilizer nutrients from 2001 to 2006. Source: (9).
Fertilizer supplies have not kept pace with demand, thus increasing prices. Since natural gas accounts for 70% to 90% of the cost to produce ammonium nitrate—commercial fertilizer's key
Archival copy: for current recommendations see http://edis.ifas.ufl.edu or your local extension office.
The Dynamics and Implications of Recent Increases in Citrus Production Costs 4
Figure 7. A comparison of fertilizer prices in U.S. dollars per ton to gasoline and diesel prices in U.S. dollars per gallon by year, 1999–2008. Source: (8,10).
source of nitrogen—increased energy and natural gas prices have led to large increases in ammonium nitrate prices. These increased natural gas prices have also resulted in increased costs for U.S. ammonium plants. Consequently, since 2003, twenty-six U.S. ammonium plants have closed due to competition from imported nitrogen. This has led to a 42% reduction in U.S. ammonium production, pushing the United States to import over 50% of the nitrogen it uses in agricultural production. Increased energy and fuel prices not only add to fertilizer mining and production costs, they also increase the costs of transporting fertilizer.
China, a significant fertilizer exporter, recently placed large (100% and potentially higher) tariffs on fertilizer exports. This was to increase its available domestic supply in order to control rapidly rising domestic agricultural production costs and to ensure that China grows enough grain to feed its 1.3 billion people. However, this has added to an already tight world fertilizer market and has contributed to price increases.
Since the discovery of citrus greening in September of 2005 in the Homestead, Florida area, it has spread to 32 commercial citrus producing counties. Greening cannot be eradicated. Currently, the best known method to slow its rate of spread is controlling the vector and the inoculum. The vector that spreads greening, the Asian citrus psyllid, is controlled with pesticides, and the inoculum is controlled by identifying and removing infected trees. This adds costs for spraying, scouting, and tree
removal. The cost of managing greening is estimated to add $506 per acre to grove care costs (Table 2), which increases the cost per box and per pound solids, and reduces profitability.
Mitigating Higher Costs
Mitigating the impact of these higher costs will require an increased focus on cost efficiencies. The use of variable rate technology equipment can, for groves with skips and/or young resets, result in more efficient utilization of fertilizer and spray materials by reducing application rates for smaller trees and eliminating output on empty spaces. Beyond this, experimentation with the amount of fertilizer used can sometimes produce cost savings, depending on the impact that changing the fertilizer rate has on yields. As fertilizer rates are increased, yields increase rapidly at first, but as additional fertilizer is added, yields flatten and ultimately decline. If the rate of fertilizer in a particular grove is high, say 220 pounds of nitrogen (N) per acre or more, it may be possible to reduce this fertilizer rate enough to reduce costs without lowering yields by an offsetting amount. Obviously, this depends on the impact of reduced fertilization on yields and the price of fruit. However, experimental plots within the grove can enable testing to find out.
In-Field Demonstration Trials
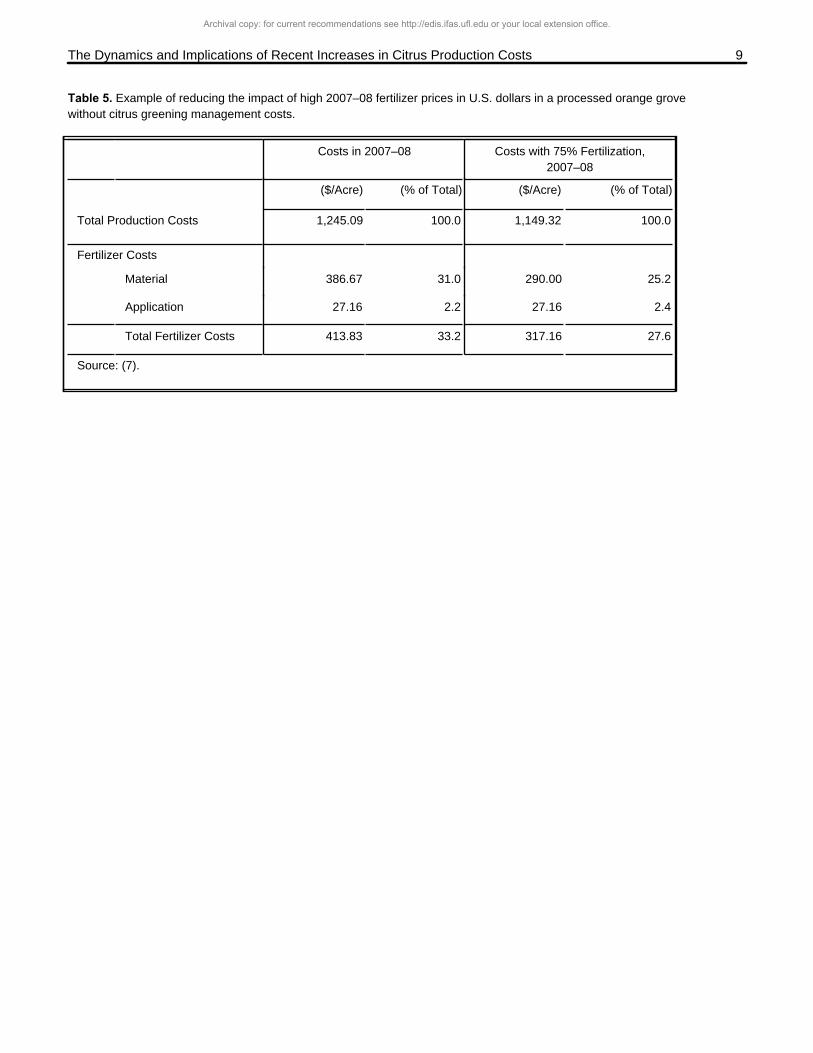
Growers are encouraged to determine optimum fertilizer needs as a way to reduce high fertilizer costs. Set aside part or all of one or two rows each for evaluating different fertilization rates, and use variable rate fertilizer equipment to apply the different rates. Check leaf nitrogen, observe the condition of the trees, and monitor yield differences for comparison to the grove's traditional fertilizer program. An example of offsetting current high fertilizer costs by using 75% of the prior fertilization rate of 220 pounds of nitrogen per acre is shown in Table 5. Reducing fertilization to 75% of nitrogen per acre reduced the fertilizer cost of $387 per acre by $97. Unless current fertilizer rates are above optimum levels, such a strategy is likely a near-term one, maybe for a season or two, since it is important not to impact long-term productivity of the grove. However, in this high cost environment, re-evaluating the
Archival copy: for current recommendations see http://edis.ifas.ufl.edu or your local extension office.
The Dynamics and Implications of Recent Increases in Citrus Production Costs 5
optimum fertilization rates for your grove(s) might yield benefits.
Conclusions
If fertilizer costs had only increased by 31% since 2002–03, as did other grove care costs, and there was no need to manage greening, grove care costs would total $1,016, rather than $1,752 per acre, and break-even prices for a hypothetical Hamlin grove yielding 450 boxes per acre would be $0.26 per pound solids lower. But this is not the case. Possibly, weakening demand and lower oil prices as a result of the world financial situation will result in a reversal of part of the recent cost increases for all grove care practices as well as for fertilizer, or at least result in no further increases in the near-term. However, costs of managing greening are now an integral component of grove care costs because, even for groves that have no symptomatic trees, scouting for symptomatic trees and spraying are critical to minimizing the future impacts of greening when it is found. It is doubtful if reduced demand and lower oil prices from a recessionary world economy will reduce fertilizer costs by the entire amount they have increased. This means that grove care costs are now substantially higher than they were only a few years ago, and are not likely to drop significantly. The key question is: Will fruit prices be high enough to enable growers to cover these greater costs? If a strong market is there, then prices will be also. But if not, either the market must strengthen or supply reductions must occur before prices will adjust to levels that cover the costs and reward the risks of being a citrus grower.
References
1. FCPA. Various years. Weighted average final price for oranges used in FCOJ and SSOJ, by season, (1992–93 to 2002–03 Seasons). Statistical Summary. Florida Citrus Processors Association, Lakeland, FL.
2. Muraro, Ronald P., et. al. Various years. Economic Information Report Series: Budgeting Costs and Returns for Central Florida (Ridge) Citrus Production. Food and Resource Economics Department, University of Florida, Gainesville, FL (reports covering 1977–78 to 2002–03 seasons).
3. Muraro, Ronald P., et. al. Various years. Economic Information Report Series: Budgeting Costs and Returns for Southwest Florida Citrus Production. Food and Resource Economics Department, University of Florida, Gainesville, FL (reports covering 1992–93 to 2002–03 seasons).
4. Muraro, Ronald P. Estimated costs for Central Florida (Ridge) citrus production, 1967-68 and 1972-73 seasons. Unpublished cost data, Polk County Extension Service, UF/IFAS.
5. Muraro, Ronald P., Fritz Roka, and Robert E. Rouse. 2003. Budgeting Costs and Returns for Southwest Florida Citrus Production, 2002–03. Electronic Data Information Source (EDIS) FE434. Food and Resource Economics Department, University of Florida, Gainesville, FL (September).
6. Muraro, Ronald P. 2008. Summary of 2007–2008 citrus budgets for Central Florida (Ridge) production region. UF/IFAS/CREC, Lake Alfred, FL (September). http://www.crec.ifas.ufl.edu/Extension/Economics
7. Muraro, Ronald P. 2008. Summary of 2007–2008 citrus budgets for the Southwest Florida production region. UF/IFAS/CREC, Lake Alfred, FL (September). http://www.crec.ifas.ufl.edu/Extension/Economics
8. Muraro, Ronald P. 2008. Unpublished fertilizer prices obtained from interviews with growers and fertilizer suppliers in Florida, USA and Sao Paulo, Brazil.
9. FI. 2008. The Fertilizer Institute, Washington, D.C.
10. USDE/EIA. 2008. Retail U.S. Gasoline and Diesel Fuel Prices. U.S. Department of Energy, Energy Information Administration, Washington, D.C.
11. USDL/BLS. 2008. Table B-65, producer price indexes by stage of processing, all commodities, 1959–2007. In Economic Report of the President, Table B-65, Executive Office of the
Archival copy: for current recommendations see http://edis.ifas.ufl.edu or your local extension office.
The Dynamics and Implications of Recent Increases in Citrus Production Costs 6
President, Council of Economic Advisors, United States Department of Labor, Bureau of Labor Statistics, Washington, D.C. (February). http://www.gpoaccess.gov/eop/
Archival copy: for current recommendations see http://edis.ifas.ufl.edu or your local extension office.
The Dynamics and Implications of Recent Increases in Citrus Production Costs 7
Table 1. Historical grove care costs and processed orange prices in current and inflation adjusted U.S. dollars, 1992–93 and 2002–03.
Season Total Costs Total Costs Inflated to 2003 U.S. Dollars
Delivered-In Price Delivered-In Price Inflated to 2003 U.S. Dollars
($/Acre) ($/Pound Solids)
1992–93 778.71 904.45 0.6789 0.7885
1993–94 781.47 896.35 0.9342 1.0715
1994–95 740.95 820.57 0.8838 0.9788
1995–96 776.44 839.68 1.0730 1,1604
1996–97 756.93 819.22 0.9123 0.9874
1997–98 765.65 849.97 0.8719 0.9679
1998–99 770.79 848.18 1.0678 1.1750
1999–2000 783.43 815.31 0.9054 0.9422
2000–01 758.85 780.90 0.7648 0.7870
2001–02 767.77 808.76 0.8364 0.8811
2002–03 775.49 775.49 0.9378 0.9378
Source: (1,3,11).
Table 2. Production costs in U.S. dollars for a 10+ year-old Southwest Florida processed orange grove.
2002–03 2007–08 2007–08Without Greening Without Greening With Greening
($/Acre) (% of Total) ($/Acre) (% of Total) ($/Acre) (% of Total)
Total Production Costs 775.49 100.0 1,245.99 100.0 1,751.71 100.0
* Costs are higher because of an additional 2.3 percent tree attrition per year assumed from greening.Source: (5,7).
Archival copy: for current recommendations see http://edis.ifas.ufl.edu or your local extension office.
The Dynamics and Implications of Recent Increases in Citrus Production Costs 8
Table 3. Historical grove care costs in U.S. dollars for Central Florida processed oranges, 1967–68 to 2007–08, in five–season intervals.
Five–Season Intervals Total Costs Change
($/Acre) (%)
1967–68 201.60 —
1972–73 244.43 21.2
1977–78 383.94 57.1
1982–83 548.46 42.81987–88 628.30 14.6
1992–93 778.71 23.9
1997–98 765.65 –1.7
2002–03 778.26 1.6
2007–08 1,752.81 125.2
Note: These costs are for Central Florida groves because no cost data were available for Southwest Florida back to 1967–68. However, total grove care costs for Central Florida groves are approximately the same as those for Southwest Florida groves.Source: (2,4,6).
Table 4. Break-even price in U.S. dollars for processed Hamlin and Valencia oranges, 2002–03 and 2007–08 seasons.
Boxes / Acre350 400 450 500 550 600
Delivered–In Price / Box
($/Pound Solids)
Processed Hamlin Orangesa
WITH Resetting–Tree Replacement, 2002–03
1.018 0.940 0.880 0.832 0.792 0.760
WITH Resetting–Tree Replacement, 2007–08, With Canker–Greening1.485 1.355 1.254 1.174 1.107 1.052
NO Resetting–Tree Replacement, 2007–08, With Canker–Greening1.364 1.249 1.160 1.089 1.030 0.982
Processed Valencia Orangesb
WITH Resetting–Tree Replacement, 2002–03
0.894 0.826 0.772 0.730 0.695 0.667
WITH Resetting–Tree Replacement, 2007–08, With Canker–Greening1.330 1.214 1.124 1.052 0.993 0.944
NO Resetting–Tree Replacement, 2007–08, With Canker–Greening
1.240 1.135 1.054 0.989 0.935 0.891a Assumes 6.2 pounds solids per box for 2007–08, and 6.0 pounds solids per box for 2002–03.b Assumes 7.0 pounds solids per box for 2007–08, and 6.8 pounds solids per box for 2002–03.Source: (5,7).
Archival copy: for current recommendations see http://edis.ifas.ufl.edu or your local extension office.
The Dynamics and Implications of Recent Increases in Citrus Production Costs 9
Table 5. Example of reducing the impact of high 2007–08 fertilizer prices in U.S. dollars in a processed orange grove without citrus greening management costs.
Costs in 2007–08 Costs with 75% Fertilization, 2007–08
($/Acre) (% of Total) ($/Acre) (% of Total)
Total Production Costs 1,245.09 100.0 1,149.32 100.0
Fertilizer Costs
Material 386.67 31.0 290.00 25.2
Application 27.16 2.2 27.16 2.4
Total Fertilizer Costs 413.83 33.2 317.16 27.6
Source: (7).
Archival copy: for current recommendations see http://edis.ifas.ufl.edu or your local extension office.