The Dynamics of Faculty Hiring Networks Eun Lee, 1,2, * Aaron Clauset, 1,2,3, † and Daniel B. Larremore 1,2, † 1 Department of Computer Science, University of Colorado Boulder, Engineering Drive, 80309 Boulder, CO, USA 2 BioFrontiers Institute, University of Colorado Boulder, Colorado Ave., 80303 Boulder, CO, USA 3 Santa Fe Institute, Hyde Park Road, 87501 Santa Fe, NM, USA Faculty hiring networks—who hires whose graduates as faculty—exhibit steep hierarchies, which can rein- force both social and epistemic inequalities in academia. Understanding the mechanisms driving these patterns would inform efforts to diversify the academy and shed new light on the role of hiring in shaping which scien- tific discoveries are made. Here, we investigate the degree to which structural mechanisms can explain hierarchy and other network characteristics observed in empirical faculty hiring networks. We study a family of adaptive rewiring network models, which reinforce institutional prestige within the hierarchy in five distinct ways. Each mechanism determines the probability that a new hire comes from a particular institution according to that in- stitution’s prestige score, which is inferred from the hiring network’s existing structure. We find that structural inequalities and centrality patterns in real hiring networks are best reproduced by a mechanism of global place- ment power, in which a new hire is drawn from a particular institution in proportion to the number of previously drawn hires anywhere. On the other hand, network measures of biased visibility are better recapitulated by a mechanism of local placement power, in which a new hire is drawn from a particular institution in proportion to the number of its previous hires already present at the hiring institution. These contrasting results suggest that the underlying structural mechanism reinforcing hierarchies in faculty hiring networks is a mixture of global and local preference for institutional prestige. Under these dynamics, we show that each institution’s position in the hierarchy is remarkably stable, due to a dynamic competition that overwhelmingly favors more prestigious institutions. These results highlight the reinforcing effects of a prestige-based faculty hiring system, and the importance of understanding its ramifications on diversity and innovation in academia. Keywords: Faculty hiring, Prestige hierarchy, Inequality, Network modeling, Hiring mechanism Introduction Faculty hiring is a crucial process that shapes the composi- tion and structure of the academic workforce. When one de- partment hires a graduate of another department as faculty, it represents an implicit endorsement of the doctoral institution. One aspect of a department’s power is thus its ability to place its graduates as faculty at other institutions. This placement power can be inferred from analyzing the structure of faculty hiring networks, in which nodes represent departments and a directed link (i → j) indicates that of a graduate of node i is faculty at node j. Across academic disciplines, faculty hiring networks exhibit a few highly stereotyped properties, which differentiate them from other types of directed and weighted networks. First, out-degree distributions are heavy-tailed, in- dicating that most faculty graduate from a relatively small number of institutions, while low-variance in-degree distri- butions indicate that, within each field, departments do not vary dramatically in size [1]. Second, faculty hiring networks are well described by a steep linear hierarchy of the nodes in which 86-91% of directed edges point from higher-ranked nodes toward lower-ranked nodes, and the strength of this hi- erarchy is much greater than can be attributed to the heavy- tailed out-degree distribution alone [1]. Prestige hierarchies have been shown to drive numerous in- equalities. For example, the top ten most prestigious insti- tutions in the Humanities produce over half (51.3%) of all * Corresponding author: [email protected]† These two authors contributed equally published articles in top journals, leading to far greater vis- ibility for faculty at the top [2]. Institutional prestige also drives both the productivity and impact of early-career aca- demics [3]. These effects, in turn, strengthen the existing pres- tige hierarchy that produced them in the first place [1, 4], creating a feedback loop in which network position becomes self-reinforcing. Furthermore, because placement power is so skewed across institutions [1], the demographics and research specialities of highly ranked PhD programs will ultimately shape the demographic composition [4] and research agen- das of entire fields [5, 6]. Hence, a deeper understanding of the mechanisms that create and maintain prestige hierarchies would have broad ramifications for research on scientific pro- ductivity, citation patterns, the processes that drive scientific discovery, and efforts to diversify the academy along various dimensions. Network models have shed light on the mechanisms that create hierarchies in many social systems. For instance, a pos- teriori analysis of hierarchies in high school friendship net- works revealed that both unreciprocated and reciprocated re- lationships are critical to explaining observed network struc- ture, yet they follow different attachment mechanisms [7]. Other models, focused on the dynamics of hierarchies over time, have incorporated nodes’ preferences into the process by which new directed links are formed [8], bringing together network formation and discrete choice modeling [9, 10]. Importantly, these statistically generative models allow for model comparison in explaining empirical data. In economics, models based on iterative games have been shown to capture hierarchical nested structures [11]. These studies are distinct in that they focus on network formation in the absence of growth [8, 11], which differentiates them from the well stud- arXiv:2105.02949v1 [physics.soc-ph] 6 May 2021
Transcript
The Dynamics of Faculty Hiring Networks
Eun Lee,1, 2, ∗ Aaron Clauset,1, 2, 3, † and Daniel B. Larremore1, 2, †
1Department of Computer Science, University of Colorado Boulder, Engineering Drive, 80309 Boulder, CO, USA2BioFrontiers Institute, University of Colorado Boulder, Colorado Ave., 80303 Boulder, CO, USA
3Santa Fe Institute, Hyde Park Road, 87501 Santa Fe, NM, USA
Faculty hiring networks—who hires whose graduates as faculty—exhibit steep hierarchies, which can rein-force both social and epistemic inequalities in academia. Understanding the mechanisms driving these patternswould inform efforts to diversify the academy and shed new light on the role of hiring in shaping which scien-tific discoveries are made. Here, we investigate the degree to which structural mechanisms can explain hierarchyand other network characteristics observed in empirical faculty hiring networks. We study a family of adaptiverewiring network models, which reinforce institutional prestige within the hierarchy in five distinct ways. Eachmechanism determines the probability that a new hire comes from a particular institution according to that in-stitution’s prestige score, which is inferred from the hiring network’s existing structure. We find that structuralinequalities and centrality patterns in real hiring networks are best reproduced by a mechanism of global place-ment power, in which a new hire is drawn from a particular institution in proportion to the number of previouslydrawn hires anywhere. On the other hand, network measures of biased visibility are better recapitulated by amechanism of local placement power, in which a new hire is drawn from a particular institution in proportion tothe number of its previous hires already present at the hiring institution. These contrasting results suggest thatthe underlying structural mechanism reinforcing hierarchies in faculty hiring networks is a mixture of globaland local preference for institutional prestige. Under these dynamics, we show that each institution’s position inthe hierarchy is remarkably stable, due to a dynamic competition that overwhelmingly favors more prestigiousinstitutions. These results highlight the reinforcing effects of a prestige-based faculty hiring system, and theimportance of understanding its ramifications on diversity and innovation in academia.
Faculty hiring is a crucial process that shapes the composi-tion and structure of the academic workforce. When one de-partment hires a graduate of another department as faculty, itrepresents an implicit endorsement of the doctoral institution.One aspect of a department’s power is thus its ability to placeits graduates as faculty at other institutions. This placementpower can be inferred from analyzing the structure of facultyhiring networks, in which nodes represent departments and adirected link (i → j) indicates that of a graduate of node i isfaculty at node j. Across academic disciplines, faculty hiringnetworks exhibit a few highly stereotyped properties, whichdifferentiate them from other types of directed and weightednetworks. First, out-degree distributions are heavy-tailed, in-dicating that most faculty graduate from a relatively smallnumber of institutions, while low-variance in-degree distri-butions indicate that, within each field, departments do notvary dramatically in size [1]. Second, faculty hiring networksare well described by a steep linear hierarchy of the nodesin which 86-91% of directed edges point from higher-rankednodes toward lower-ranked nodes, and the strength of this hi-erarchy is much greater than can be attributed to the heavy-tailed out-degree distribution alone [1].
Prestige hierarchies have been shown to drive numerous in-equalities. For example, the top ten most prestigious insti-tutions in the Humanities produce over half (51.3%) of all
∗ Corresponding author: [email protected]† These two authors contributed equally
published articles in top journals, leading to far greater vis-ibility for faculty at the top [2]. Institutional prestige alsodrives both the productivity and impact of early-career aca-demics [3]. These effects, in turn, strengthen the existing pres-tige hierarchy that produced them in the first place [1, 4],creating a feedback loop in which network position becomesself-reinforcing. Furthermore, because placement power is soskewed across institutions [1], the demographics and researchspecialities of highly ranked PhD programs will ultimatelyshape the demographic composition [4] and research agen-das of entire fields [5, 6]. Hence, a deeper understanding ofthe mechanisms that create and maintain prestige hierarchieswould have broad ramifications for research on scientific pro-ductivity, citation patterns, the processes that drive scientificdiscovery, and efforts to diversify the academy along variousdimensions.
Network models have shed light on the mechanisms thatcreate hierarchies in many social systems. For instance, a pos-teriori analysis of hierarchies in high school friendship net-works revealed that both unreciprocated and reciprocated re-lationships are critical to explaining observed network struc-ture, yet they follow different attachment mechanisms [7].Other models, focused on the dynamics of hierarchies overtime, have incorporated nodes’ preferences into the processby which new directed links are formed [8], bringing togethernetwork formation and discrete choice modeling [9, 10].Importantly, these statistically generative models allow formodel comparison in explaining empirical data. In economics,models based on iterative games have been shown to capturehierarchical nested structures [11]. These studies are distinctin that they focus on network formation in the absence ofgrowth [8, 11], which differentiates them from the well stud-
ied models of network attachment [12, 13].While this body of past work has provided general insights
into hierarchy formation and dynamics, the particular mecha-nisms underlying prestige hierarchies in faculty hiring remainunclear. In this study, we specifically focus on understand-ing which mechanisms can or cannot describe the hierarchicalstructures common to faculty hiring networks. We explore adiverse set of hiring network models with feedback, whichcapture a variety of plausible dynamics in real hiring pro-cesses. In particular, we employ rewiring network models inwhich edges are rewired over time, representing retirementand hiring, based on specific network-based conceptualiza-tions of institutional prestige.
To anchor this work in the real-world properties of facultyhiring networks, we study our models in the context of empiri-cal faculty hiring data from Business (BS), Computer Science(CS), and History (HS), previously hand collected and cu-rated [1]. Comparing model-generated networks with empiri-cal networks allows us to avoid pursuing unrealistic link for-mation mechanisms. By simulating network dynamics fromempirically supported mechanisms, we then investigate themobility of individual institutions within prestige hierarchiesover time to deepen our understanding of the factors that leadto the steepening or flattening of network hierarchies morebroadly.
Methods
Empirical Hiring Networks
Using a dataset containing the education and employmenthistories of more than 16, 000 tenure-track or tenured facultyat 461 PhD-granting Business (BS), Computer Science (CS),and History (HS) departments in the U.S. and Canada [1, 14](Supplementary Table S1), we constructed three directed hir-ing networks, one for each field. We represent each networkas a N × N matrix A in which the number of edges from ito j corresponds to the number of faculty at institution j whoobtained a PhD from institution i. There are N = 112 nodes(institutions) and 9, 336 faculty in the BS network, N = 205nodes and 5, 032 faculty in the CS network, and N = 144nodes and 4, 556 faculty in the HS network.
Models of Faculty Hiring
To model the dynamics of faculty hiring networks, we con-sidered an evolving adaptive rewiring model that representsthe processes of retirement and hiring, in which the network’scurrent structure endogenously affects future hiring decisions.In each time step, a randomly selected edge (x → j) is re-moved, which signifies a retirement that creates an open po-sition at a department j. Then, the open position at j is filledby choosing a new hire from a node i with probability Pi j. Allinstitutions in the network follow the same hiring model fornew hires. Values of Pi j are determined according to one offive hiring mechanisms (Fig. 1(b)):
Figure 1. Schematic representation of five simple models for fac-ulty hiring. (a) Four large circles represent institutions, and filledcircles represent faculty who graduated from the color-matched insti-tutions. Grey links denote faculty hiring, including self-hiring. Whena department j has an open position (a retirement), a new hiring eventfrom institution i will occur with probability Pi j, determined by a hir-ing model. All institutions are assigned a prestige rank, where a highrank ri denotes high prestige, calculated via SpringRank [15]. (b)Mathematical definition of Pi j for five hiring models, showing howeach model formalizes a different notion of institutional prestige: thenumber of faculty produced by an institution i (ki), the number of pre-vious hires from i at j (ki→ j), the rank of i (ri), the weighted numberof faculty produced by i (kiwi), and the weighted number of previoushires from i at j (ki→ jwi) with a preference strength β of an institu-tion’s prestige.
(1) Faculty production: An institution j prefers an institu-tion i based on the total number of faculty ki producedby i. As the number of faculty alumni of an institutionanywhere in the network increases, the probability ofthat institution placing a new graduate as faculty growsproportionally [Pi j ∝ (ki)β].
(2) Local homophily: An institution j prefers an institu-tion i in proportion to the number of faculty at j thatare already from i (ki→ j). This localized preferencerepresents a historical preference to hire again fromthe specific institutions that have placed graduates at j[Pi j ∝ (ki→ j)β].
(3) Ranking: An institution j prefers an institution i in pro-portion to i’s rank ri. This mechanism assumes a well-known ranking ri of each institution in a field, but whichmay be updated over time [Pi j ∝ (ri)β].
(4) Rank-weighted production: An institution j considersinstitution i’s placement power (the number of facultyfrom the institution i) and its ranking together, suchthat the probability is proportional to a rank-weightednumber of ki faculty graduates from i, where wi =
rαi /∑
v∈N rαv , here we set α = 1 for simplicity [Pi j ∝
(kiwi)β].
(5) Rank-weighted homophily: An institution j consid-
3
ers a combination of the number of faculty at j thatare specifically from i and i’s rank weight wi [Pi j ∝
(ki→ jwi)β].
Across all five models, we use a “strength” parameter β ≥ 0to control the salience of the particular definition of institu-tional prestige. When β = 0, Pi j = 1/N for all institutions,and thus, each new hire will be a uniformly random choice.As a result, this point in parameter space is common to all fivemodels. When β = 1, hiring is proportional to the institutionalprestige as defined. As β increases, the probability becomesmore concentrated on the most prestigious institutions, and inthe limit of β → ∞, every new hire is made from only thesingle most prestigious institution.
We also use a parameter p to control the frequency withwhich a particular prestige-based hiring mechanism is ap-plied. At each time step after an edge is removed uniformly atrandom, the institution j makes its next hire according to theprestige mechanism with probability 1 − p, and otherwise ithires by choosing i uniformly random. In this way, the param-eter p interpolates between a fully prestige-based hiring dy-namics (p = 0) and a fully random hiring dynamics (p = 1).As with β = 0, the point p = 1 in parameter space producesthe same, uniformly random hiring dynamics.
Access all five models, a parameterization for β and p fullyspecifies a hiring dynamics model, and we are interested inunderstanding which points or regions in this space producerealistic faculty hiring networks.
Inferring Hierarchies and Measuring Their Steepness
A key evaluation of the five faculty hiring models willbe the degree to which each produces realistic prestige hi-erarchies. Because each model defines an evolving network,whose edges rewire over time, a node’s position or rank ri inthe hierarchy may be dynamic. We track the evolution of thehierarchy by periodically estimating its structure from the cur-rent network, using the computationally efficient SpringRankmethod [15]. This method is known to infer hierarchies thatcorrelate well both with authoritative academic rankings andwith those of other standard methods, such as the MinimumViolation Ranking (MVR) algorithm of Ref. [1].
For a particular hierarchy {ri}, we define its steepness ρ tobe the fraction of edges that “violate” the hierarchy. A directededge j to i is violating if it points “up” the hierarchy, i.e., ifri > r j. Thus, the steepness ρ is a ratio of the number ofupward-directed edges (faculty who are hired at departmentsmore prestigious than where they graduated) to the total num-ber of edges. A value of ρ = 0.5 would indicate that the prob-ability of a hiring edge pointing “up” the hierarchy equals theprobability of it pointing down, and the larger a value of ρ,the closer the network is to a perfect hierarchy, in which everyedge points “down” the hierarchy.
In addition to the hierarchy’s steepness, we also use theGini coefficient G of the out-degree distribution as a secondmeasure of a hierarchy’s structure. The Gini coefficient is cal-culated in the standard way, and directly quantifies how un-
equal the placement powers (out-degrees) are across institu-tions. We note that G and ρ capture different aspects of thehierarchy’s inequality. A network can have a low value of Gbut a high value of ρ, and vice versa.
Hiring Simulations
We systematically study the behavior of these models viasimulation. In this exploration, we consider two types of ini-tial conditions: an idealized setting in which institutions be-gin on equal footing with each other, and no department hasadvantage in terms of network position over any other; anda more realistic setting, where institutions begin with facultyalumni sets a deterministic equal in size to those we observeempirically. In both settings, we set N equal to the number ofinstitutions, and we set the institution sizes (in-degree) equalto those observed in the particular empirical hiring network.In the first setting, the PhD institution of each hire is chosenuniformly at random from among all institutions, creating anetwork with a Poisson out-degree distribution. In the secondsetting, the PhD institutions of faculty are chosen by select-ing a uniformly random matching of in- and out-degrees, cor-responding to a directed version of the configuration model,which replicates the heavy-tailed structure of the empiricalout-degree distribution. We refer to these two initializationsettings as egalitarian and skewed, respectively.
The process of retirement and hiring is continued until thenetwork reaches a dynamic equilibrium, at which point thelarge-scale statistical structure of the network reaches a steadystate even as additional edges continue to be rewired. We de-fine reaching a steady state by the fraction of violations in thehierarchy, given by ρ. In most settings, running the simulationfor 400N2 steps is sufficient to produce a stable value of ρ.However, when p is small, e.g., p ≤ 0.1, the time required toproduce a similarly stable value grows in a slightly non-linearway; in these instances, we find that 800N2 steps is sufficient.
Finding β and p to Reproduce Structural Inequality
To find parameter combinations of β and p that reproducethe empirically observed values of ρ and G, we measuredthe Euclidean distance between simulated and empirical net-works’ as,
D = [G(p, β) −Gdata]2 + [ρ(p, β) − ρdata]2. (1)
For each of the five models and two initial conditions, we mea-sured the distance D over a grid of β and p values. Due tothe computational cost of the simulations, we found approx-imate minimizers of D using an efficient heuristic. Values ofβ for which D > 0.1 for all p were ruled out as implausible.For each remaining value of β, we fit a function of the formρ(p) = ae−bp +c, and selected the value of p which minimizedD. This procedure resulted in values of p and β that best repro-duced empirically observed network properties in an efficientmanner (Table S2).
4
Quantifying Biased Visibility
In networks with community structure or strong linear hi-erarchies, nodes located in different parts of the network mayhave markedly different local neighborhoods. As a result, lo-cal estimates of a network’s global composition may be inac-curate. Thus, individual actors, like the faculty at a particularinstitution, may form inaccurate beliefs about the composi-tion of their field, because which parts of the network a node“sees” depends on how centrally located that node is and howbroadly distributed its neighbors are [16, 17]. In faculty hiringnetworks, this phenomenon called biased visibility, correlateswith prestige ranking and produces to two related phenomena.First, because placement rates are highly skewed, favoring themost prestigious institutions, the top-ranked 10% of institu-tions are likely to be far overrepresented in the local neigh-borhoods of all other institutions. Second, the strength of thisoverrepresentation varies by the rank of the perceiving insti-tution.
We quantify the visibility bias of a set of nodes X in theperception of a node i by defining the quantity
Bi,X =Vi,X − |X|/N|X|/N
=
∑j∈X Ai j/kin
i − |X|/N|X|/N
, (2)
to be the relative representation of a set of institutions X in theneighborhood of institution i, where Ai j denotes the numberof faculty hired at institution i who graduated from j, and kin
irepresents the number of incoming degree of node i. Here, weconsider three choices of the set X: (i) the top-ranked 10%of institutions, (ii) the bottom-ranked 10% of institutions, or(iii) and the set of institutions in the rank decile spanning the50th to 60th percentiles. These three definitions of X allow usto quantify the bias visibility of the most and the least presti-gious institutions along with the middle of the hierarchy, pro-viding some sense of how the whole hierarchy behaves. Pos-itive values of Bi,X > 0 indicate that X is overrepresented inthe neighborhood of i, while negative values indicate that X isunderrepresented in the neighborhood of i.
Results
Reproduction of Empirical Structural Inequalities
To compare the five hiring models’ abilities to reproducethe observed values of the two measures of structural in-equality, the Gini coefficient G and the hierarchy steepnessρ, we systematically varied the strength of prestige preferenceβ ∈ [0.0, 2.0] and the level of random hiring p ∈ [0.0, 1.0] forboth the egalitarian and skewed initial conditions (see Meth-ods). Analyzing the output of simulations leads to two keyinsights.
First, we found that fully or mostly random hiring (p > 0.5)never reproduced the Gini coefficients G and hierarchy steep-ness scores ρ observed in empirical networks, irrespectiveof whether the initial conditions were egalitarian or skewed(Fig. 2). This observation serves as a useful check by ruling
out the possibility that the process of ranking nodes, in and ofitself, leads to the false discovery of hierarchical structure infully or mostly random networks.
Second, among the five proposed hiring preference func-tions, we found that the Local homophily model (egalitarianinitialization) and Ranking model (either initialization) wereunable to produce realistic networks, as measured by the dis-tance from empirical G and ρ to those of the modeled net-works, under any choice of preference strength β or random-ness p (Fig. 2f, Table I). The remaining models were able toreproduce realistic networks only for sufficiently large valuesof β (Business, Fig. 2; Computer Science, Fig. S1; History,Fig. S2).
To more precisely evaluate the plausibility of the remain-ing models, we identified combinations of preference strengthβ and randomness p that led each model and initial condi-tion pair to produce plausibly realistic hiring networks (Ta-bles S2, S3, and S4; see Methods). This exercise revealed thatas preference strength increases, the properties of empiricalhiring networks can be reproduced only if the probability of arandom hire p also increases. For instance, the Faculty pro-duction model with β = 1.0 reproduced empirical networkinequalities at p ≈ 0.007, yet when β increased to 2.0 an in-crease in randomness to p ≈ 0.4 was also required (Tables S2,S3, and S4).
This coupling of β and p reflects a natural tension betweenthe two parameters that the coupling balances. That is, as βincreases, the hiring function concentrates more placementpower among the most prestigious institutions, which tendsto create hierarchies that are too steep and too unequal com-pared to the data. But, increasing p balances this tendency byredistributing placement power equally among all institutions,which moderates the effect of β.
Reproduction of Common Network Centralities
Seven of ten candidate hiring models can produce networksthat replicate the observed measures of structural inequalityin empirical hiring networks: This fact suggests they may allbe plausible mechanisms, but raises the question of whetherthese models are also able to reproduce other statistical pat-terns in the empirical network’s structure. To assess their abil-ity to produce hiring networks that are realistic in other ways,we measured three additional network summary statistics as afunction of node rank: eigenvector centrality, harmonic cen-trality, and normalized mean geodesic distance. In this anal-ysis, we study networks generated by the best-fitting valueof p for β = 1, identified in the previous section (Table S2).This analysis provides a hard test for the models. While in theprevious analysis, we fitted the parameters β and p in orderto match the empirical values of the two structural inequal-ity measures G and ρ, here, models are scored by how wellthey reproduce network statistical patterns that were not partof estimating the model.
No single model was able to replicate all four centralityfunctions across all the fields. However, the Faculty produc-tion model with either initialization and the Local homophily
Figure 2. Structural inequalities of five hiring models vs. empirical faculty hiring network of Business departments. (a-e) Steady-state values of Gini coefficient G and hierarchy steepness ρ, for the five hiring models and two initial conditions for different choices of β(for simplicity, we only show β ∈ {0.0, 0.5, 1.0, 1.5, 2.0}). Each line is a parametric plot in which we vary the randomness parameter over0 ≤ p ≤ 1, and hence all models and choices of β converge to the same point in inequality-space as p → 1. Red dashed lines show theempirical values of G and ρ for the Business faculty hiring network. Results are averaged over 50 simulations, and error bars indicate standarddeviations. (f) Euclidean distance between an averaged structural inequality (G, ρ) obtained from simulation and their pair of empirical valuesfor the Business hiring network. Filled markers represent β values that can reproduce G and ρ with distance D ≤ 0.1; open markers indicateD > 0.1 or a model is not able to reproduce the empirical inequality.
model with skewed initialization produced the most realistichiring networks. While this fact can be seen by comparingempirical and model-produced summary statistics of central-ity functions (Tables I, S5, and S6), scatter plots of centralitiesvs node rank reveal that the Faculty Production model fur-ther captures the more complex centrality-rank trends foundin empirical data, followed by the Local homophily modelwith skewed initialization (Figs. 3, S3, S4, and S5). The othermodels failed to meaningfully reproduce empirical centralityaverages and centrality-rank trends.
For both Faculty production and Local homophily models,the randomness parameter was low (p = 0.008 and 0.007; Ta-ble S2), and yet the resulting simulated hiring networks never-theless produce realistic measures of structural inequality andrank-centrality patterns. These models’ agreement with theempirical rank-centrality patterns is notable, indicating that
these mechanisms are able to reproduce additional structuralpatterns in faculty hiring networks that are not directly relatedto the fitted parameters of hierarchy steepness and faculty pro-duction inequality. This fact suggests that, generally speaking,even simple hiring preferences that reinforce the patterns ofpast hiring, either locally or globally, are capable of generat-ing structurally plausible faculty hiring networks.
Biased Visibility
Hiring processes that explicitly reinforce the patterns ofpast hiring have the potential to also create stratified net-work structures in which a highly ranked node’s neighbors aremarkedly different from those around a lower ranked node. Asa result, some nodes may be far more visible to other nodes,
Table I. Mean value of network summary statistics for five hiring models vs. the empirical values for Business. Mean values of the threenetwork summary statistics—eigenvector centrality, harmonic centrality, and normalized mean geodesic distance—for networks producedby each of the five hiring models vs. the corresponding values of the empirical Business network. Boldface values are close to the empiricalvalue. Uncertainty indicates the average absolute distance between predicted and empirical value. For this comparison, parameter combinationsachieving the closest structural inequality are applied when β = 1.0 (Table S2). Two initializations (Init.) of Egalitarian (E) and Skewed (S)are used. Dashed line represents the Ranking and Local homophily model are unable to reproduce realistic structural inequalities. All valuesare rounded to the second digit.
and other nodes far less. In the context of a faculty hiring net-work, biased visibility driven by prestige would imply thatas the prestige of an institution grows, its visibility or adja-cency to a wider variety of other institutions in the hiring net-work also grows. To quantify this biased visibility, we mea-sured the over- or under-representation of hires from the top-ranked 10%, bottom-ranked 10%, or 50-60th percentile in thein-neighborhoods of other nodes, arranged by rank. We thencompared the empirical and modeled patterns of biased visi-bility [16, 17] (see Eq. 2 and Methods).
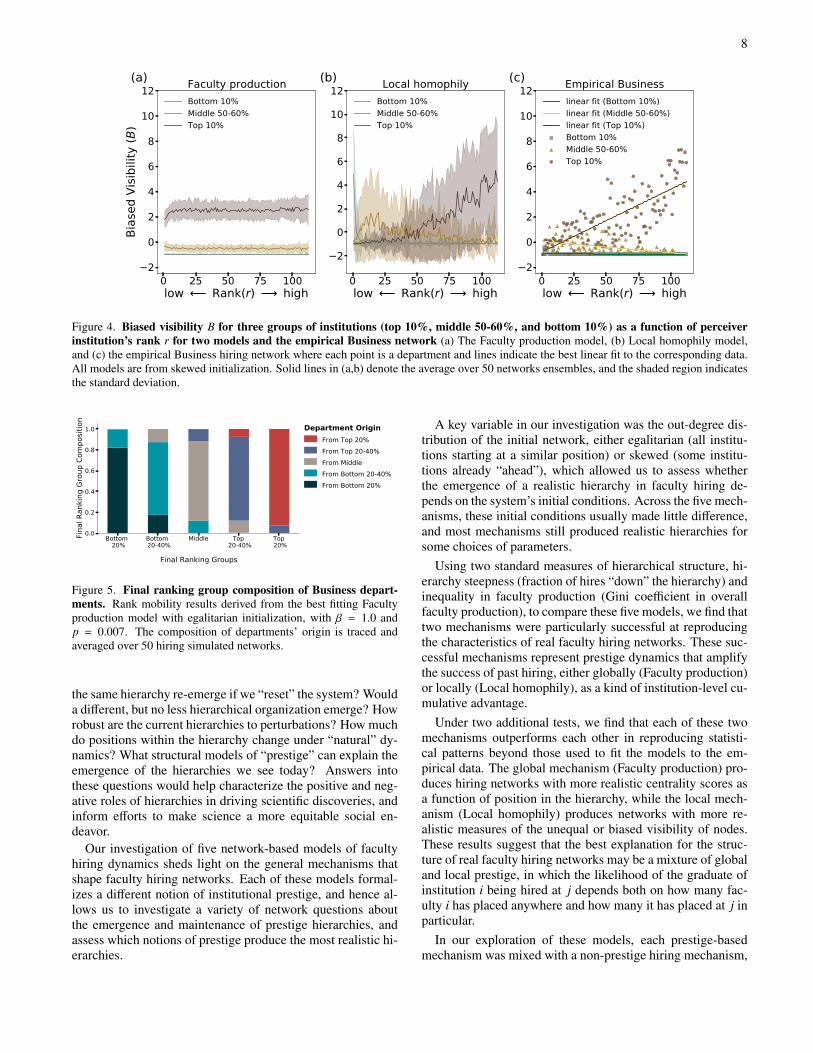
Empirical faculty hiring networks show clear patterns ofbiased visibility by rank. We find that low-prestige institu-tions are uniformly less visible to other institutions acrossthe prestige hierarchy. Institutions from the middle and topof the rankings are as visible as expected in the neighbor-hoods of low-ranked nodes, but as we consider a more pres-tigious subset of institutions, middle-ranked institutions be-come increasingly under-represented, while top-ranked insti-tutions become overrepresented. These patterns are consis-tently true across empirical Business (Figs. 4 and S6), Com-puter Science (Fig. S7), and History networks (Fig. S8), in-dicating that not only do the few most prestigious institutionsproduce the majority of all faculty, they also place these fac-ulty broadly, across the entire prestige hierarchy.
In applying the same analysis to the simulated hiring net-works produced by our best fitting models, we find that theseprestige-correlated patterns of biased visibility were repro-duced by the Local homophily model, but not by the Fac-ulty production model (Figs. 4, S6, S7, S8). This finding isfurther supported by Pearson correlations for top-ranked in-stitutions between empirical and model-derived biased visi-bility for Business, Computer Science, and History, respec-tively: 0.73, 0.81, and 0.7 for the Local homophily model, vs0.3, 0.45, and 0.5 for the Faculty production model (all Pear-
son correlation p-values < 0.001). Thus, despite the fact thatthe Faculty production model better captures centrality-rankpatterns, the Local homophily model better captures prestige-visibility patterns. This discrepancy across measures of thenetworks’ statistical structure suggests that the true mecha-nisms that explain real faculty hiring may reflect aspects ofboth models.
Rank Mobility
In real academic systems, institutions may seek to makestrategic choices in order to improve their ranking or prestigeover time. However, the mechanisms that drive these rankings,such as those studied here, may either mitigate or amplify theeffects of individual choices, leading to a more or less dynam-ically stable hierarchy. A key advantage of our hiring modelsis the ability to study the dynamical consequences of hiringover time, and hence to investigate the long-term stability orfragility under natural dynamics.
To quantify the natural drift in rankings over time, we firstallow simulations to reach a steady state (see Methods). Wethen simulated M sequential retirements and hires, where Mis the total number of professors in the field (i.e., the totalnumber of edges in the hiring network M =
∑i j Ai j). Hence,
we study a perturbation of the steady-state system in whichroughly every faculty member is replaced once. We record theinitial steady-state rank quintile of each institution, and thecorresponding final prestige quintile. This coordinate pair ofinitial and final quantile provides a simple measure of inter-generational rank mobility and drift.
Overall, we find that rank mobility under our best-fittingmodels is low. After a complete turnover of the Business fac-ulty, on average, only 20% of institutions had moved from
(b) Local homophilyModel NetworksEmpirical Network
0 20 40 60 80 10010 6
10 4
10 2
100
Eige
nvec
tor c
en.
(c)
Model NetworksEmpirical Network
0 20 40 60 80 10010 6
10 4
10 2
100
Eige
nvec
tor c
en.
(d)
Model NetworksEmpirical Network
0 20 40 60 80 1000.00
0.25
0.50
0.75
1.00
Harm
onic
cen.
(e)Model NetworksEmpirical Network
0 20 40 60 80 1000.00
0.25
0.50
0.75
1.00
Harm
onic
cen.
(f)Model NetworksEmpirical Network
0 20 40 60 80 100low prestige Rank(r) high prestige
0.00
0.25
0.50
0.75
1.00
Mea
n Ge
odes
ic.
(g)Model NetworksEmpirical Network
0 20 40 60 80 100low prestige Rank(r) high prestige
0.00
0.25
0.50
0.75
1.00
Mea
n Ge
odes
ic.(h)
Model NetworksEmpirical Network
Figure 3. Structural patterns of hiring model networks for two mechanisms of Faculty production and Local homophily and theempirical Business hiring network as a function of prestige. (a,b) Out-degree ki, (c,d) eigenvector centrality, (e,f) harmonic centrality, and(g,h) mean geodesic distance normalized by network diameter. Panels on the left (a,c,e,g) show results for the Faculty production model,and panels on the right (b,d,f,h) show results for the Local homophily model (skewed initialization). Solid lines indicate the mean over 50simulations, and shaded region around the mean indicates the 25% to 75% quantile range. Orange points indicate the observed values for theBusiness hiring network. Large rank denotes higher prestige.
one quintile to another, and the overwhelming majority movedonly to an adjacent quintile (Fig. 5). At the top of the rank-ings, 93% of the institutions that were located in the final topquintile had also been there at the beginning of the experi-ment, with 82% of institutions similarly staying in the bottomquintile (Fig. 5). Similar results held for Computer Science(Fig. S9) and History (Fig. S10) simulations.
These findings suggest that once an institution is positionednear the top of the network hierarchy, prestige mobility bychance alone is limited. Only 7%, 12% and 8% of institu-tions in the final top quintile of Business, Computer Science,and History networks, respectively, had drifted up from thequintile below (Faculty production model, egalitarian initial-ization). On the other hand, mobility into and out of the mid-dle quintile was far greater, with new entrants to the middlequintile comprising 20-30%, 29-49%, and 23-52% of middle-
quintile institutions in Business, Computer Science, and His-tory, respectively, after one generation.
Discussion
Faculty hiring plays a fundamental role in shaping the com-position of the scientific workforce [1, 18], and hence in de-termining the demographic composition of scientists [18], andwhat and whose particular scientific questions are studied [5].Although past work has shown that doctoral prestige is predic-tive of whose graduates are hired as faculty [1, 4, 15], we havelacked a deeper understanding the dynamics of and mech-anisms that create and maintain prestige hierarchies [8, 19–22]. Without this understanding, the long-term stability of ex-isting academic prestige hierarchies remains unclear—Would
linear fit (Bottom 10%)linear fit (Middle 50-60%)linear fit (Top 10%)Bottom 10%Middle 50-60%Top 10%
Figure 4. Biased visibility B for three groups of institutions (top 10%, middle 50-60%, and bottom 10%) as a function of perceiverinstitution’s rank r for two models and the empirical Business network (a) The Faculty production model, (b) Local homophily model,and (c) the empirical Business hiring network where each point is a department and lines indicate the best linear fit to the corresponding data.All models are from skewed initialization. Solid lines in (a,b) denote the average over 50 networks ensembles, and the shaded region indicatesthe standard deviation.
Bottom 20%
Bottom 20-40%
Middle Top 20-40%
Top 20%
Final Ranking Groups
0.0
0.2
0.4
0.6
0.8
1.0
Fina
l Ran
king
Gro
up C
ompo
sitio
n
Department OriginFrom Top 20%From Top 20-40%From MiddleFrom Bottom 20-40%From Bottom 20%
Figure 5. Final ranking group composition of Business depart-ments. Rank mobility results derived from the best fitting Facultyproduction model with egalitarian initialization, with β = 1.0 andp = 0.007. The composition of departments’ origin is traced andaveraged over 50 hiring simulated networks.
the same hierarchy re-emerge if we “reset” the system? Woulda different, but no less hierarchical organization emerge? Howrobust are the current hierarchies to perturbations? How muchdo positions within the hierarchy change under “natural” dy-namics? What structural models of “prestige” can explain theemergence of the hierarchies we see today? Answers intothese questions would help characterize the positive and neg-ative roles of hierarchies in driving scientific discoveries, andinform efforts to make science a more equitable social en-deavor.
Our investigation of five network-based models of facultyhiring dynamics sheds light on the general mechanisms thatshape faculty hiring networks. Each of these models formal-izes a different notion of institutional prestige, and hence al-lows us to investigate a variety of network questions aboutthe emergence and maintenance of prestige hierarchies, andassess which notions of prestige produce the most realistic hi-erarchies.
A key variable in our investigation was the out-degree dis-tribution of the initial network, either egalitarian (all institu-tions starting at a similar position) or skewed (some institu-tions already “ahead”), which allowed us to assess whetherthe emergence of a realistic hierarchy in faculty hiring de-pends on the system’s initial conditions. Across the five mech-anisms, these initial conditions usually made little difference,and most mechanisms still produced realistic hierarchies forsome choices of parameters.
Using two standard measures of hierarchical structure, hi-erarchy steepness (fraction of hires “down” the hierarchy) andinequality in faculty production (Gini coefficient in overallfaculty production), to compare these five models, we find thattwo mechanisms were particularly successful at reproducingthe characteristics of real faculty hiring networks. These suc-cessful mechanisms represent prestige dynamics that amplifythe success of past hiring, either globally (Faculty production)or locally (Local homophily), as a kind of institution-level cu-mulative advantage.
Under two additional tests, we find that each of these twomechanisms outperforms each other in reproducing statisti-cal patterns beyond those used to fit the models to the em-pirical data. The global mechanism (Faculty production) pro-duces hiring networks with more realistic centrality scores asa function of position in the hierarchy, while the local mech-anism (Local homophily) produces networks with more re-alistic measures of the unequal or biased visibility of nodes.These results suggest that the best explanation for the struc-ture of real faculty hiring networks may be a mixture of globaland local prestige, in which the likelihood of the graduate ofinstitution i being hired at j depends both on how many fac-ulty i has placed anywhere and how many it has placed at j inparticular.
In our exploration of these models, each prestige-basedmechanism was mixed with a non-prestige hiring mechanism,
9
in which hires are chosen uniformly at random rather than byprestige. Across our results, we find that strong hierarchiesemerge even when only modest levels of prestige-based feed-back in faculty hiring are used. However, we also found thatthe most realistic hierarchies required a trade-off between thestrength of preference for prestige (β) and the tendency to hireindependent of prestige (p).
In both successful models for faculty hiring, we find thatinstitution ranks are relatively stable over time, with the vastmajority of institutions remaining in the same rank quintile af-ter an entire generation of hiring (all faculty replaced once). Inthe absence of strategic hiring or placement behavior by indi-vidual institutions, the hiring system mixes poorly by rank.Hence, the prestige rankings embodied by hierarchical andunequal faculty hiring networks are unlikely to change withinthe careers of individual faculty without sustained and inten-tional strategy.
We note that the simplified mechanisms of faculty hiringwe studied here explicitly omit any dependence on the char-acteristics of the individuals actually being hired. Studies ex-amining the preferences of hiring committees suggest that ad-ditional factors, including individual productivity, gender, andpostdoctoral experience, likely play important roles in theirpreferences for hiring different graduates [4, 23, 24]. Never-theless, the fact that our network-only models can accuratelyrecapitulate the broad characteristics of empirical hiring net-works suggests that, to a first approximation, the large-scaledynamics of hiring can be thought of as being mainly aboutprestige, which is known to correlate strongly with traditionalmetrics of “merit.”
All of the models introduced in this study are edge“rewiring” models, a broad class of generative network mech-anisms in which the numbers of edges and vertices are heldfixed, while edges are moved from one place in the networkto another. This class of network formation processes is notwell studied. In contrast, much more is known about bothnetwork growth models, in which new nodes arrive steadilyand form connections with existing nodes [13, 25], and non-growth models, in which links are formed among a fixed setof nodes via conditionally independent draws [26–29]. Ourresults hint at the richness of network dynamics that are pos-sible from models that neither grow nor shrink, but insteadrearrange edges dynamically. Such models are likely to findbroad applications, and would benefit from the developmentof more general mathematical theory.
A number of our modeling assumptions may not hold true
in practice, and these represent interesting directions of fu-ture work. For instance, real faculty hiring networks have nei-ther a fixed number of nodes nor a fixed number of edges—within a single field, departments form, grow, shrink, and caneven dissolve. Future work on the dynamics of faculty hiringshould explore the causes, incentives, and thresholds underly-ing these dynamics, and their implications for the stability ofhierarchies. We also assumed that all institutions followed auniversal preference function over candidates while in reality,these preferences may vary across institutions or across time.Finally, our models do not capture the two-sided nature of thehiring process, in which institutions make offers to individu-als, and individuals choose which, if any, offers to accept. As aresult, some job opening may go unfilled (no offers accepted)and some applicants may go unemployed (no offers received).A more realistic model of hiring would more explicitly cap-ture these dynamics, which may lead to additional insights onthe stability of hiring hierarchies, e.g., if the likelihood of anoffer being received as accepted also correlates with prestigeor the attributes of individuals.
Finally, our results bear on efforts to diversify the academythrough changes in the mechanics of faculty hiring. Our mod-els show that the self-reinforcing dynamics of prestige leadto entrenched hierarchies, which do not mix rapidly or dissi-pate on their own [30]. The robustness of prestige hierarchieshas two key implications. First, it suggests that those elite in-stitutions that are currently responsible for placing the vastmajority of faculty [1] are likely to naturally remain in suchpositions unless preferences across the entire field change dra-matically. Second, it suggests that these same institutions,which are in stable positions of high visibility and placementpower, have the power to alter the demographic compositionand research interests of the entire field, through their ownPhD admissions and training. Hence, although our findingspredict that the dominant rank and placement power of theseelite institutions is unlikely to change, their network positionsmay nevertheless enable them to rapidly reshape their fieldsin other significant ways.
Acknowledgements
The authors thank Sam Zhang, Tzu-Chi Yen, Hunter Wap-man, and Allison Morgan for helpful discussions. All authorsacknowledge support from the Air Force Office of ScientificResearch Award FA9550-19-1-0329.
[1] A. Clauset, S. Arbesman, and D. B. Larremore, Systematic in-equality and hierarchy in faculty hiring networks, Science Ad-vances 1, e1400005 (2015).
[2] C. Wellmon and A. Piper, Publication, power, and patron-age: On inequality and academic publishing, Critical Inquiry(2017).
[3] S. F. Way, A. C. Morgan, D. B. Larremore, and A. Clauset, Pro-ductivity, prominence, and the effects of academic environment,Proceedings of the National Academy of Sciences 116, 10729
(2019).[4] S. F. Way, D. B. Larremore, and A. Clauset, Gender, Productiv-
ity, and Prestige in Computer Science Faculty Hiring Networks,in Proceedings of the 25th International Conference on WorldWide Web, WWW ’16 (International World Wide Web Confer-ences Steering Committee, 2016) p. 1169–1179.
[5] A. C. Morgan, D. J. Economou, S. F. Way, and A. Clauset,Prestige drives epistemic inequality in the diffusion of scientificideas, EPJ Data Science 7, 40 (2018), 1805.09966.
[6] B. Hofstra, V. V. Kulkarni, S. M.-N. Galvez, B. He, D. Juraf-sky, and D. A. McFarland, The Diversity–Innovation Paradoxin Science, Proceedings of the National Academy of Sciences ,201915378 (2020).
[7] B. Ball and M. E. J. Newman, Friendship networks and socialstatus, Network Science 1, 16–30 (2013).
[8] M. Kawakatsu, P. S. Chodrow, N. Eikmeier, and D. B. Lar-remore, Emergence of hierarchy in networked endorsement dy-namics, Proceedings of the National Academy of Sciences 118,e2015188118 (2021).
[9] J. Overgoor, A. Benson, and J. Ugander, Choosing to grow agraph: Modeling network formation as discrete choice, in TheWorld Wide Web Conference (2019) pp. 1409–1420.
[10] F. Feinberg, E. Bruch, M. Braun, B. H. Falk, N. Fefferman,E. M. Feit, J. Helveston, D. Larremore, B. B. McShane, A. Pata-nia, et al., Choices in networks: a research framework, Market-ing Letters 31, 349 (2020).
[11] M. D. Konig, C. J. Tessone, and Y. Zenou, Nestedness in net-works: A theoretical model and some applications, TheoreticalEconomics 9, 695 (2014).
[12] D. D. S. Price, Networks of scientific papers, Science 149, 510(1965).
[13] D. D. S. Price, A general theory of bibliometric and other cu-mulative advantage processes, Journal of the American Societyfor Information Science 27, 292 (1976).
[14] A. Clauset, S. Arbesman, and D. Larremore B., Faculty hir-ing data, http://santafe.edu/˜aaronc/facultyhiring/(2015).
[15] C. De Bacco, D. B. Larremore, and C. Moore, A physical modelfor efficient ranking in networks, Science Advances 4, eaar8260(2018).
[16] M. Galesic, H. Olsson, and J. Rieskamp, Social sampling ex-plains apparent biases in judgments of social environments,Psychological Science 23, 1515 (2012).
[17] K. Lerman, X. Yan, and X.-Z. Wu, The ”Majority Illusion” inSocial Networks, PLOS ONE 11, e0147617 (2016).
[18] A. Morgan, A. Clauset, D. Larremore, N. LaBerge, andM. Galesic, Socioeconomic roots of academic faculty (2021).
[19] R. K. Merton, The Matthew Effect in Science, Science 159, 56(1968).
[20] M. Spence, Job Market Signaling, The Quarterly Journal ofEconomics 87, 355 (1973).
[21] J. Henrich and F. J. Gil-White, The evolution of prestige: freelyconferred deference as a mechanism for enhancing the bene-fits of cultural transmission, Evolution and Human Behavior 22,165 (2001).
[22] V. Burris, The academic caste system: Prestige hierarchies inphd exchange networks, American Sociological Review 69, 239(2004).
[23] W. M. Williams and S. J. Ceci, National hiring experiments re-veal 2:1 faculty preference for women on STEM tenure track,Proceedings of the National Academy of Sciences 112, 5360(2015).
[24] S. Headworth and J. Freese, Credential privilege or cumulativeadvantage? prestige, productivity, and placement in the aca-demic sociology job market, Social Forces 94, 1257 (2015).
[25] P. L. Krapivsky, S. Redner, and F. Leyvraz, Connectivity ofgrowing random networks, Phys. Rev. Lett. 85, 4629 (2000).
[26] P. Erdos and A. Renyi, On the evolution of random graphs,Publ. Math. Inst. Hungary. Acad. Sci. 5, 17 (1960).
[27] P. W. Holland, K. B. Laskey, and S. Leinhardt, Stochastic block-models: First steps, Social Networks 5, 109 (1983).
[28] K. Faust and S. Wasserman, Blockmodels: Interpretation andevaluation, Social Networks 14, 5 (1992), special Issue on
Blockmodels.[29] B. Karrer and M. E. J. Newman, Stochastic blockmodels and
community structure in networks, Phys. Rev. E 83, 016107(2011).
[30] R. A. Hanneman, Some trends in the prestige of U.S. Ph.D.programs in sociology, 1976-2011, The American Sociologist44, 259 (2013).
Collection Period Mar. 2012 - Dec. 2012 May 2011 - Mar. 2012 Jan. 2013 - Aug. 2013
Table S1. Summary of the Hiring Networks of Three Departments Data summary for the collected faculty hiring networks for threedisciplines: Business, Computer Science, and History. The number of institutions and institution’s size regarding the faculty hiring has beenpreserved in five hiring models.
12
Appendix B: Preference Strength β and the Probability of Random Hiring p for Structural Inequalities
Figure S1. Best-fit values of the random hiring parameter p for the Computer Science faculty hiring network. (a-e) Steady-state valuesof Gini coefficient G and hierarchy steepness ρ, for the five hiring models and two initial conditions for different choices of β (for simplicity,we only show β ∈ {0.0, 0.5, 1.0, 1.5, 2.0}). Each line is a parametric plot in which we vary the randomness parameter over 0 ≤ p ≤ 1, andhence all models and choices of β converge to the same point in inequality-space as p → 1. Red dashed lines show the empirical values of Gand ρ for the Computer Science faculty hiring network. Results are averaged over 50 simulations, and error bars indicate standard deviations.(f) Euclidean distance between an averaged structural inequality (G,ρ) obtained from simulation and their pair of empirical values for theComputer Science hiring network. Filled markers represent β values that can reproduce G and ρ with distance D ≤ 0.1; open markers indicateD > 0.1 or a model is not able to reproduce the empirical inequality.
Figure S2. Best-fit values of the random hiring parameter p for the History faculty hiring network. (a-e) Steady-state values of Ginicoefficient G and hierarchy steepness ρ, for the five hiring models and two initial conditions for different choices of β (for simplicity, we onlyshow β ∈ {0.0, 0.5, 1.0, 1.5, 2.0}). Each line is a parametric plot in which we vary the randomness parameter over 0 ≤ p ≤ 1, and hence allmodels and choices of β converge to the same point in inequality-space as p → 1. Red dashed lines show the empirical values of G and ρfor the History faculty hiring network. Results are averaged over 50 simulations, and error bars indicate standard deviations. (f) Euclideandistance between an averaged structural inequality (G,ρ) obtained from simulation and their pair of empirical values for the History hiringnetwork. Filled markers represent β values that can reproduce G and ρ with distance D ≤ 0.1; open markers indicate D > 0.1 or a model is notable to reproduce the empirical inequality.
14
Hiring Model Init. Preference Strength, β0.0 0.5 1.0 1.5 2.0
Faculty production E - - 0.007 0.39 0.418S - - 0.008 0.391 0.419
Local homophily E - - - - -S - 0.001 0.007 0.28 0.39
Ranking E - - - - -S - - - - 0.04
Rank-weighted production E - - 0.247 0.418 0.429S - - 0.244 0.418 0.423
Table S2. Best-fit values of the random hiring parameter p for the Business faculty hiring network. Each entry in the table presents thevalue of p that minimized the distance between modeled networks and empirical networks for values of preference strength β, initializations (E,Egalitarian; S, Skewed) and hiring models, as shown. For combinations which were unable to plausibly reproduce the properties of empiricalnetworks (D > 0.1, see Methods), no value of p is given.
Hiring Model Init. Preference Strength, β0.0 0.5 1.0 1.5 2.0
Table S3. Best-fit values of the random hiring parameter p for the Computer Science faculty hiring network. Each entry in the tablepresents the value of p that minimized the distance between modeled networks and empirical networks for values of preference strength β,initializations (E, Egalitarian; S, Skewed) and hiring models, as shown. For combinations which were unable to plausibly reproduce theproperties of empirical networks (D > 0.1, see Methods), no value of p is given.
15
Hiring Model Init. Preference Strength, β0.0 0.5 1.0 1.5 2.0
Faculty production E - - 0.009 0.283 0.301S - - 0.009 0.281 0.3
Local homophily E - - - - -S - 0.001 0.007 0.092 0.155
Ranking E - - - - -S - - - - -
Rank-weighted production E - - 0.161 0.3 0.301S - - 0.161 0.298 0.302
Table S4. Best-fit values of the random hiring parameter p for the History faculty hiring network. Each entry in the table presents thevalue of p that minimized the distance between modeled networks and empirical networks for values of preference strength β, initializations (E,Egalitarian; S, Skewed) and hiring models, as shown. For combinations which were unable to plausibly reproduce the properties of empiricalnetworks (D > 0.1, see Methods), no value of p is given.
16
Appendix C: Network Properties of Empirical Hiring Network
0 20 40 60 80 100low prestige Rank(r) high prestige
0.00
0.25
0.50
0.75
1.00
Mea
n Ge
odes
ic.
(j)Model NetworksEmpirical Network
0 20 40 60 80 100low prestige Rank(r) high prestige
0.00
0.25
0.50
0.75
1.00
Mea
n Ge
odes
ic.
(k)Model NetworksEmpirical Network
0 20 40 60 80 100low prestige Rank(r) high prestige
0.00
0.25
0.50
0.75
1.00
Mea
n Ge
odes
ic.
(l)Model NetworksEmpirical Network
Figure S3. Structural patterns of hiring model networks for three mechanisms of Faculty production, Rank-weighted production,Rank-weighted homophily and the empirical Business hiring network as a function of prestige. (a, b, c) Out-degree ki, (d, e, f) eigenvectorcentrality, (g, h, i) harmonic centrality, and (j, k, l) mean geodesic distance normalized by network diameter. Panels on the left (a, d, g, j) showresults for the Faculty production model, and panels on the middle (b, e, h, k) show results for the Rank-weighted production model. Panelson the right (c, f, i, l) show results for the Rank-weighted homophily model. All models simulated with egalitarian initialization. Solid linesindicate the mean over 50 simulations, and shaded region around the mean indicates the 25% to 75% quantile range. Orange points indicatethe observed values for the Business hiring network. Large rank denotes higher prestige.
17
Hiring Model Init. Eigenvector centrality (log)(Empirical, -6.7)
Table S5. Mean value of network summary statistics for five hiring models vs. the empirical values for Computer Science. Meanvalues of the three network summary statistics—eigenvector centrality, harmonic centrality, and normalized mean geodesic distance—fornetworks produced by each of the five hiring models vs. the corresponding values of the empirical Computer Science network. Boldfacevalues are close to the empirical value. Uncertainty indicates the average absolute distance between predicted and empirical value. For thiscomparison, parameter combinations achieving the closest structural inequality are applied when β = 1.0 (Table S3). Two initializations (Init.)of Egalitarian (E) and Skewed (S) are used. Dashed line represents the Ranking and Local homophily model are unable to reproduce realisticstructural inequalities. All values are rounded to the second digit.
Table S6. Mean value of network summary statistics for five hiring models vs. the empirical values for History. Mean values of the threenetwork summary statistics—eigenvector centrality, harmonic centrality, and normalized mean geodesic distance—for networks produced byeach of the five hiring models vs. the corresponding values of the empirical History network. Boldface values are close to the empirical value.Uncertainty indicates the average absolute distance between predicted and empirical value. For this comparison, parameter combinationsachieving the closest structural inequality are applied when β = 1.0 (Table S4). Two initializations (Init.) of Egalitarian (E) and Skewed (S)are used. Dashed line represents the Ranking and Local homophily model are unable to reproduce realistic structural inequalities. All valuesare rounded to the second digit.
Figure S4. Structural patterns of hiring model networks for two mechanisms of Faculty production and Local homophily and theempirical Computer Science hiring network as a function of prestige. (a, b) Out-degree ki, (c, d) eigenvector centrality, (e, f) harmoniccentrality, and (g, h) mean geodesic distance normalized by network diameter. Panels on the left (a, c, e, g) show results for the Facultyproduction model, and panels on the right (b, d, f, h) show results for the Local homophily model (skewed initialization). Solid lines indicatethe mean over 50 simulations, and shaded region around the mean indicates the 25% to 75% quantile range. Orange points indicate theobserved values for the Computer Science hiring network. Large rank denotes higher prestige.
Figure S5. Structural patterns of hiring model networks for two mechanisms of Faculty production and Local homophily and theempirical History hiring network as a function of prestige. (a, b) Out-degree ki, (c, d) eigenvector centrality, (e, f) harmonic centrality, and(g, h) mean geodesic distance normalized by network diameter. Panels on the left (a, c, e, g) show results for the Faculty production model,and panels on the right (b, d, f, h) show results for the Local homophily model (skewed initialization). Solid lines indicate the mean over 50simulations, and shaded region around the mean indicates the 25% to 75% quantile range. Orange points indicate the observed values for theHistory hiring network. Large rank denotes higher prestige.
Figure S6. Biased visibility B for three groups of institutions (top 10%, middle 50-60%, and bottom 10%) as a function of perceiverinstitution’s rank r for three models for Business network (a) Faculty production model, (b) Rank-weighted production model, and (c)Rank-weighted homophily. All models started from the egalitarian initialization. Solid lines in (a, b, c) denote the average over 50 networksensembles, and the shaded region indicates the standard deviation.
0 50 100 150 200low Rank(r) high
2
0
2
4
6
8
10
12
Bia
sed
Vis
ibili
ty (B
)
(a)Faculty production
Bottom 10%Middle 50-60%Top 10%
0 50 100 150 200low Rank(r) high
2
0
2
4
6
8
10
12(b)
Local homophily
Bottom 10%Middle 50-60%Top 10%
0 50 100 150 200low Rank(r) high
2
0
2
4
6
8
10
12(c)
Empirical Computer Science
linear fit (Bottom 10%)linear fit (Middle 50-60%)linear fit (Top 10%)Bottom 10%Middle 50-60%Top 10%
Figure S7. Biased visibility B for three groups of institutions (top 10%, middle 50-60%, and bottom 10%) as a function of perceiverinstitution’s rank r for two models and the empirical Computer Science network (a) The Faculty production model, (b) Local homophilymodel, and (c) the empirical Computer Science hiring network where each point is a department and lines indicate the best linear fit to thecorresponding data. All models are from skewed initialization. Solid lines in (a, b) denote the average over 50 networks ensembles, and theshaded region indicates the standard deviation.
21
0 50 100 150low Rank(r) high
2
0
2
4
6
8
10
12B
iase
d V
isib
ility
(B)
(a)Faculty production
Bottom 10%Middle 50-60%Top 10%
0 50 100 150low Rank(r) high
2
0
2
4
6
8
10
12(b)
Local homophily
Bottom 10%Middle 50-60%Top 10%
0 50 100 150low Rank(r) high
2
0
2
4
6
8
10
12
(c)Empirical History
linear fit (Bottom 10%)linear fit (Middle 50-60%)linear fit (Top 10%)Bottom 10%Middle 50-60%Top 10%
Figure S8. Biased visibility B for three groups of institutions (top 10%, middle 50-60%, and bottom 10%) as a function of perceiverinstitution’s rank r for two models and the empirical History network (a) The Faculty production model, (b) Local homophily model, and(c) the empirical History hiring network where each point is a department and lines indicate the best linear fit to the corresponding data. Allmodels are from skewed initialization. Solid lines in (a, b) denote the average over 50 networks ensembles, and the shaded region indicates thestandard deviation.
22
Appendix E: Stability of Rank of Hiring Network
Bottom 20%
Bottom 20-40%
Middle Top 20-40%
Top 20%
Final Ranking Groups
0.0
0.2
0.4
0.6
0.8
1.0Fi
nal R
anki
ng G
roup
Com
posit
ion
Department OriginFrom Top 20%From Top 20-40%From MiddleFrom Bottom 20-40%From Bottom 20%
Figure S9. Final ranking group composition of Computer Science departments. Rank mobility results derived from the best fitting Facultyproduction model with egalitarian initialization, with β = 1.0 and p = 0.02. The composition of departments’ origin is traced and averagedover 50 hiring simulated networks.
Bottom 20%
Bottom 20-40%
Middle Top 20-40%
Top 20%
Final Ranking Groups
0.0
0.2
0.4
0.6
0.8
1.0
Fina
l Ran
king
Gro
up C
ompo
sitio
n
Department OriginFrom Top 20%From Top 20-40%From MiddleFrom Bottom 20-40%From Bottom 20%
Figure S10. Final ranking group composition of History departments. Rank mobility results derived from the best fitting Faculty productionmodel with egalitarian initialization, with β = 1.0 and p = 0.009. The composition of departments’ origin is traced and averaged over 50hiring simulated networks.