The Economic Interdependence between the EU and Its Major (Asian) Trade Partners: An International Input-Output Approach Jahangir Alam Associate Professor Department of Finance and Banking University of Chittagong Bangladesh Email: [email protected]Telephone: 00-88- 031-684543 Fax: 0088-031-726310
Transcript
The Economic Interdependence between the EU and Its Major (Asian) Trade Partners: An International Input-Output Approach
Jahangir Alam Associate Professor
Department of Finance and Banking University of Chittagong
The Economic Interdependence between the EU and Its Major (Asian) Trade Partners: An International Input-Output Approach
(Abstract: This research aims at analysing how the EU and its major trade partner countries in Asia are economic interdependent by using various data obtained from different sources. We have collected data from different sources such Statistical Yearbook, Web Sites of EU and Asian Countries, etc., and compiled in different tables to find out the trade relationship between EU and each country. Then we analyse the economic interdependence between the EU and its Asian trade partners from several aspects such as how the import and export influences each other in EU and those countries. The study has set up an Input-Output model for general use for the potential researchers. This research presents some papers and research reports about the economic interdependence between the EU and its major trade partners in Asian and gives some suggestion that will be benefit to investors and traders.) 1.1 Prelude
Resources are unevenly scattered across the surface of Earth, and no country
has all of the resources it needs to survive and grow. Therefore, trading becomes
necessary. Economic activity is present and transportation plays a large role in
the movement of these goods. Raw materials and food from tropical areas are
exchanged for processed products of the mid-latitude developed countries.
Petroleum is shipped from Southwest Asia, Africa, and Latin America to regions
such as the United States, Western Europe, and Japan. This is the reality of life.
Since World War II, trade barriers have declined significantly due to successive
rounds of trade negotiations. During the last half of the twentieth century average
tariff levels of the United States and other industrialized countries dropped from
about 40 percent to only 6 percent, and barriers to trade in services have also
been lowered (Gilpin, 2001). In addition, from the late 1970s onward,
deregulation and privatization further opened national economies to imports.
Technological advances in communications and transportation reduced costs
and thus significantly encouraged trade expansion. Taking advantage of these
economic and technological changes, more and more businesses have
participated in international markets. Nevertheless, despite these developments,
most trade takes place among the three advanced industrialized economies--the
United States, Western Europe, and Japan, plus a few emerging markets in East
Asia, Latin America, and elsewhere. Most of the less developed world is
3
excluded, except as exporters of food and raw materials. It is estimated, for
example, that Africa and south of the Sahara accounted for only about 1 percent
of total world trade in the 1990s (Ibid).
International interdependence is often said to be strong and to have increased.
International trade is taken to be an indicator of interdependence, and its high
and, with some interruptions, rapidly growing values are accepted as evidence of
the increasing interdependence of nations (Streeten, 2001). Between 1820 and
1992, world population increased 5-fold, income per head 8-fold, world income
40-fold, and world trade 540-fold (Maddison, 1995). Sometimes international
financial flows are taken as the measure of interdependence. But five important
qualifications to the notion that today's globalization is unprecedented, large, and
increasing should be pointed out (Streeten, 1989; and Wade, 1996). These are
(i) the ratio of international trade to national income, (ii) unprecedented
globalization where developing countries’ participation is concentrated to a few
nations, (iii) the foreign direct investment, (iv) much less international migration
than during 1870-1913, and (v) the effects on consumers' and producers'
surpluses.
As the wider Asian and Asia-Pacific region (including South Asia, South-East
Asia, North-East Asia and Australasia) accounts for 56% of the world’s
population, 25% of world GNP, and 22% of the world’s international trade, Asia is
a crucial partner for the EU, whether economically, politically or culturally. This
paper tries to evaluate the interdependence between EU and its major Asian
partners in terms of trade with a view to find whether or not there is any more
scope to strengthen cooperation between them. However, only the major
countries in both the continents have been taken into account.
1.2 Setting Research Questions and Objectives
The main objective of the study is to evaluate the trade interdependence
between EU and its major Asian partners. As the globalization continues to grow
4
despite its some unfavorable effects for both developed and developing nations,
the obvious question is “is the world getting more more interdependent on the
basis of classical trade theories of comparative and or absolute advantage?” If
the answer is positive, we will evaluate the interdependence between EU and its
major trade partners located in Asia.
To accomplish the task, we will keep in mind the following sub-objectives (sub-
research questions):
i. The EU attitudes towards Asia and Asia attitudes towards EU.
ii. The present trend and scenario of trade between EU and its partners
in Asia and their economic interdependence.
iii. Building a theoretical Input-Output Model.
iv. The concluding remarks and suggestions for an improved trading
relationship.
1.3 Methodologies
The research works have been mainly carried out on the basis of secondary data
obtained from different sources. To accomplish the research, the following
methodologies have been followed:
• A literature review has been done to find out the previous and present
trade relationships between EU and its major Asian partners. For this
purpose, various books, journals, reports, have been consulted obtained
from different sources. Internet searching has also been used for in this
regard.
• Computer soft wares (word and excel) have been used to prepare
different tables used to analyze.
• On the basis of research question, some basis objectives have been set
and those objectives have been evaluated one after another.
5
2. Analysis and Findings 2.1 The EU attitudes towards Asia and Vice Versa Realizing the importance of partnership in various aspects, EU has taken a wider
initiative for strengthening cooperation with Asia in different fields. The Strategy
Paper and Indicative Program for Multi-Country Programs1 in Asia 2005-2006
prepared by the Commission of European Communities is an evidence of EU’s
attitudes towards Asia. The new strategy of EU is multi-country cooperation to
supplement the bilateral programs in areas where support is more effective on a
multi-country basis. As a result, two emerging regional blocks have been taken
where a separate strategy has been taken for partnership with China
(Commission Policy Paper, 2003). The Association of South East Asian Nations
(ASEAN) and the South Asian Association for Regional Cooperation (SAARC)
have been taken for multi-country basis cooperation for EU’s Asia-wide2
Program. The reason is that most of the Asian countries are included in these
two regional associations. However, there is an informal arrangement through
Asia Europe Meeting (ASEM)3. The EC has six objectives in Asia that includes
the further strengthening economic and trade relationship among the countries in
these two continents.
On trade and investment, the EU views are that all countries of Asia are linked
with common challenges and opportunities in the context of globalization and
progressive trade liberalization. Since almost all countries in the region are
member of the WTO or are in the process of acceding to this organization, they 1 This Strategy Paper is an indicative paper for the Asia-wide Programs (Commission Communication, 2001) 2 Asia-wide programs cover in principle all Asian countries, which are eligible under the ALA Regulation: Afghanistan, Bangladesh, Bhutan, Burma/Myanmar, Cambodia, China, East Timor, India, Indonesia, Laos, Malaysia, Maldives, Mongolia, Nepal, North Korea, Pakistan, Philippines, Sri Lanka, Thailand, Vietnam. 3 ASEM is an informal process of dialogue and co-operation, established in 1996, addressing political, economic and cultural issues, with the objective of strengthening the relationship between Asia and Europe, in a spirit of mutual respect and equal partnership. The Commission’s Asia Strategy of 2001 recognizes the important role that ASEM plays for the improvement of mutual understanding between Asia and Europe.
6
are expected they will, as a result, have to implement obligations relating to this
membership and need to be empowered to fully participate in the ongoing
negotiations. In the emerging globally integrated economy, Asian countries can
bring their comparative advantages to bear and some – although not all - are
doing so very successfully. Nonetheless, there is scope for improvement,
including access to EU markets. Many Asian countries also face the task of
adapting their regulatory environments, for example in order to improve corporate
governance and the stability of financial systems. At the same time, Asian
exporters face yet another common challenge - to adapt their products to meet
changing EU regulatory requirements, notably in the areas of health and
environmental protection. Making full use of know-how available in Asia and
Europe to deal with these tasks using comparative economic advantages to the
full, adapting regulatory environments and meeting evolving EU requirements,
will need well functioning networks between the Asian and European business
communities. Such a program needs a distinctly regional approach for bringing
together participants from many countries in Asia and Europe.
On the other hand, Asian countries have also been actively looking for economic
partners from the rest of the world. Although this is the largest continent in the
world as compared to all other continents, Asia lacks in economic development
for various reasons. There is less use of full scale of intra-regional and inter-
country trade and cooperation in this continent. Although, there is relatively a
successful regional trade block (the ASEAN), SAARC is still in the first stage of
7
its development. A proper gap between SAARC and ASEAN in various aspects
of common issues and hence in economic interdependence is a fact although
there has been found a very rapidly rising trend in intra-regional trade in ASEAN
member countries (Francis and Alexander, 2003). As a result, the countries in
the region need counterparts from other continents. With the increasing wave of
globalization and accordingly with the decreasing cost of transportation, more
and more goods are becoming "tradeables." Asian countries are trying to forget
their previous experiences of ‘foreign invasion’ with the name of trade. The new
dimension of these (Asian) countries to EU is that mutual trade and investment
will benefit from efforts to improve market access and investment conditions in
both regions. It is proposed to support contacts between private sector
companies (in particular SMEs) notably in high technology sectors, to strengthen
dialogue on economic and financial policy and to enhance market access for the
poorest developing countries.
2.2 The present trend and scenario of trade between EU and its partners in Asia and their economic interdependence
Asia and Europe find themselves in the midst of an economic, social and
communications revolution, set to accelerate. These pose new challenges in the
21st Century. Given their history, cultural strengths and talents, it is imperative
that Asia and Europe work together to make a strong and specific contribution,
and to address these issues with urgency and tenacity (Asia-Europe Vision
Group 1999). With this statement in mind the EU’s relations with Asia have
evolved considerably in recent years. The first Summit-level dialogue began in
8
1991 with Japan. In the last few years’ comparable summits with India, China
and South Korea have been established, as well as with East Asia as a whole
through the Asia-Europe Meeting process. At the Ministerial level, EU dialogue
with ASEAN, with Australia and New Zealand, and with SAARC countries
continue to move forward. The EU has played an active part in addressing some
of the key developments in Asia in recent years, for example on the Korean
Peninsula, in Cambodia, Indonesia and East Timor, and in relation to refugees in
Afghanistan. This evolution in EU relations with the region provides a strong
foundation on which strengthened relations can be built.
Asia accounts for 56% of the world’s population (and 66% of the world’s poor),
for 25% of world GNP, and for 21% of EU exports. The EU has committed itself
to keep markets open and help recovery. This can be seen in the massive growth
in Asia’s trade surplus with the EU, from €13 billion in 1996 to over €121 billion in
2000 (EU-Asia 2001).
Asia as a whole is the EU’s second-largest regional trading partner, with total EU
exports to the region in 2000 of some €197.4 billion, and total imports of €318.9
billion. Asia thus accounted for 21.1% of EU’s total exports, and 26.4% of its total
external trade. Within this, the developed countries in the region (Japan, Korea,
Hong Kong, Taiwan, Australia, New Zealand) accounted for 10.6% of the EU’s
total exports, and the developing countries (South and South-East Asia, China)
for 10.5% (Europa, 2004). EU imports from Asia are considerably greater than
its exports, and EU’s trade deficit with Asia in 2000 amounted to €121.5 billion
9
(as stated above) accounting for more than the entirety of EU’s global trade
deficit of €86.9 billion. The following Table (Table-1) shows the overall trade
position of EU with the rest of the world.
Table-1: Shows the overall trade of EU
Region Share of EU exports%
Share of EU trade%
Trade Balance € billion
North-East Asia 13.0 % 17.4 % - 96.4
South-East Asia 4.3 % 5.6 % - 29.3
South Asia 1.9 % 1.9 % - 2.6
Australasia 1.9 % 1.5 5 + 6.7
Total Asia 21.1 % 26.4 % - 121.5
Europe outside EU 30.9 % 29.2 % + 6.7
NAFTA 28.4 % 24.9 % + 43.1
Mediterranean 5.4 % 4.9 % + 5.9
S & C America 4.3 % 4.2 % - 1.0
Gulf 3.3 % 3.0 % + 2.7
ACP 4.1 % 4.1 % - 4.9
Source: Europa, 2004.
The recent trends of trade between Asia and EU show very rapidly growing
economic interdependence. Asia’s commercial relations with the EU have
increased ten fold since the early 1990’s. The following graphs show the scale of
this interdependence – the EU now imports over € 230 billion from Asia and
exports over € 140 billion to the region (Eurostat, 2003).
10
Source: Eurostat, 2003
11
The EU is also an important investment partner for Asia. Total EU Foreign Direct
Investment (FDI) flows to Asia in 1999 amounted to some €18.8 billion, though
this was still a relatively limited proportion of global EU FDI. Asia accounted for
6.8% of total EU outward FDI in 1999, compared to 67.5% going to the NAFTA
countries, 15.1% going to Central and South America, and 7.5% to Europe
outside the EU. Major investment destinations in 1999 included Japan (€8.9
billion), Hong Kong (€4.5 billion), ANZ (2.7 billion), Thailand (2.0 billion), South
Korea (€1.6 billion), India (€1.1 billion) and China (€1.1 billion). The East Asian
crisis from 1997 has certainly had a short-term effect in reducing EU investment
in certain countries (notably in SE Asia), but total EU FDI flows to Asia have
nevertheless doubled between 1995 and 1999, notwithstanding a dip in 1997 and
1998. Certain Asian countries (notably Japan and Korea) are also major
investors in the EU (Europa, 2004).
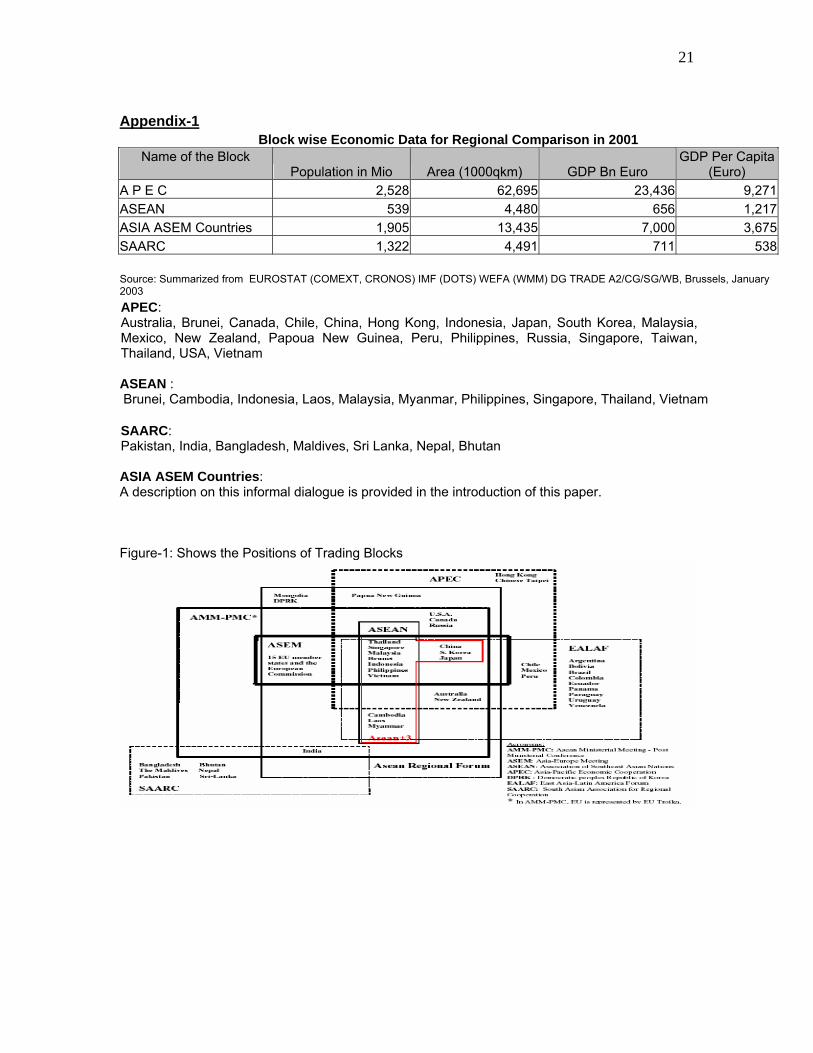
For a regional comparison between EU and Asia, we should exclude the APEC
as it includes USA, Canada, Mexico, New Zealand, Papua New Guinea, Peru,
etc. which are not truly Asian countries (Figure-1 shown in Appendix-1 exhibits
the positions of different countries). On the other hand, ASEAN does not include
China, the largest Asian trading partner for EU, and it also excludes India another
important partner of EU in Asia. As a result, the regional comparison should be
between EU and other three blocks such as ASEM, ASEAN and SAARC to have
better understood the regional trade interdependence. Appendix-1 shows the
12
important economic facts and structure of these three blocks. To analyze the
trade interdependence, Table-2 is prepared and shown in Appendix-2.
Table-2 shown in Appendix-2 is an informative Table to compare and analyze the
regional trade interdependence between EU and Asian trade blocks. Three trade
blocks from Asia have been chosen, although one is informal dialogue (ASEM)
but bears significant meanings. Whereas ASEAN had trade deficit with the world
trade, it has a trade surplus over the years between 1980 and 2001. That is,
ASEAN Member countries as a whole have a vast market for their goods in EU.
There had been steady growth in trade relationship between these two trade
blocks between 1980 and 1990. But 1990s showed a rapid expansion of EU
mercendise trade deficit with ASEAN. The reasons of such sharp expansion are
mainly the change in attitudes of both the blocks not only in trade, but also with
other fields of cooperation. Although historically EU has had tied with Africa
except UK, 1990s can be termed as a changed area in the relationships of both
the blocks. On the other hand, there has been rapid expansion of trade deficit of
ASEAN with the world. As a result, EU is an important destination of ASEAN for
trading goods. ASEAN world trade deficit could be compensated by EU trade
surplus. On the other hand, since ASEM includes Japan, China and South Korea
and excludes Cambodia, Myanmar and Laos, it shows a similar picture but with
three digits (105 billions) mainly because of trade deficit of EU with Japan and
China. In the similar way SAARC also had a trade surplus in 2001 with EU but
relatively with small amount (4 billions). To have an in-depth study for economic
13
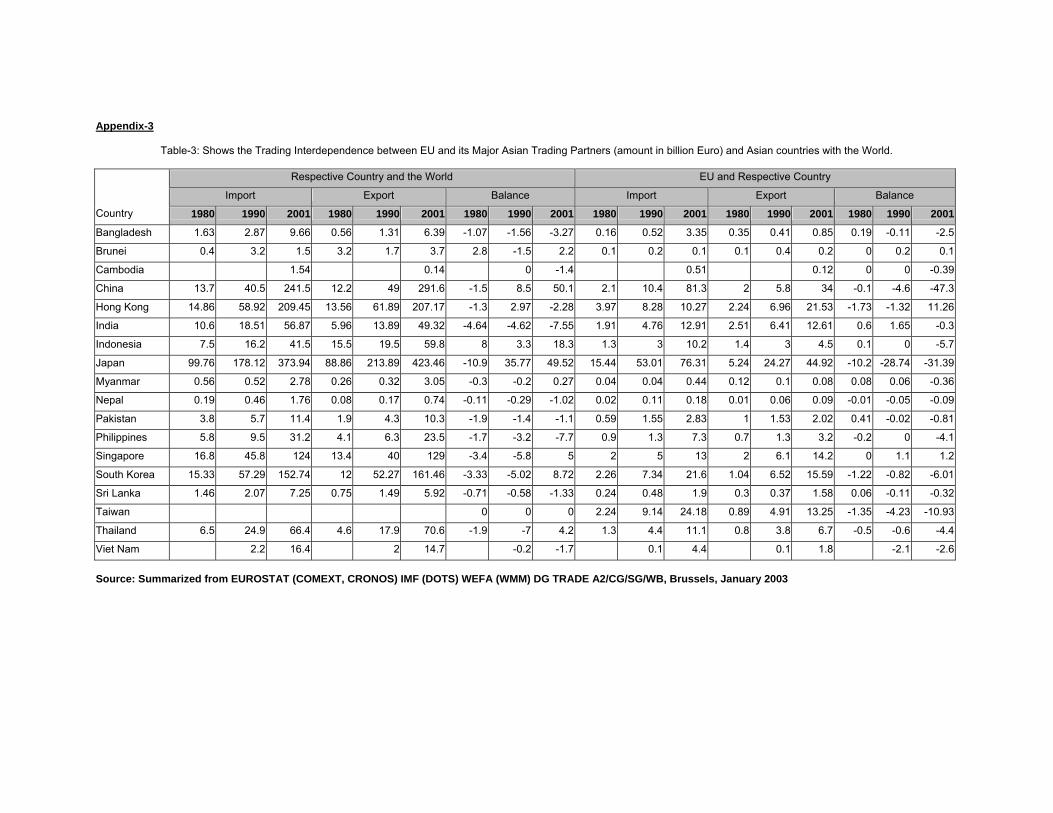
trade interdependence between EU and a detailed Table (Table-3) has been
prepared to show the relationship between EU and its main trading partners in
Asia. This is shown in Appendix-3.
Table-3 shown in the Appendix reveals that almost all the countries in Asia had
trade deficit with the world trade except China, Brunei, Indonesia and Japan. The
reasons behind their trade surpluses with the rest of the world could be that:
• China is now treated as an emerging trading country in the world because
of its recent opening of its controlled economy with skilled workers and
highly planned infrastructure of the country.
• Brunei is an oil exporting country that accounted huge of oil export
proceeds from the world.
• Indonesia attracted huge amount of FDI around the world especially from
Japan that triggers more exports to the rest of the world.
• Japan is mainly a country of high quality products that exports in the world
market.
On the other hand, almost all countries had trade surpluses with EU during the
period under consideration except Brunei and Singapore. So, it is evident that
Asian countries are highly dependent on EU for compensating their trade deficits
with the world. However, the overall picture is that it shows the Asian trade
dependence on EU as the Table-3 makes it clearly.
Another way of measuring trade dependency is to measure the ratio of
respective country’s trade with EU as compared to the world trade. The following
formula is appropriate for measuring the trade dependency ratios:
14
Import or export to and from the EU The trade dependency ratio (ŗ) = -------------------------------------------------- Import or export to and from the World
By using the above formula, the following Table (Table-2) has been prepared.
Table-2: Measuring Trade Dependency Ratio Import Ratio from EU as compared to World Export Ratio to EU as compared to World
Country 1980 1990 2001 1980 1990 2001
Bangladesh 0.21 0.14 0.09 0.29 0.40 0.52
Brunei 0.25 0.13 0.13 0.03 0.12 0.03
Cambodia na na 0.08 na na 3.64
China 0.15 0.14 0.14 0.17 0.21 0.28
Hong Kong 0.15 0.12 0.10 0.29 0.13 0.05
India 0.24 0.35 0.22 0.32 0.34 0.26
Indonesia 0.19 0.19 0.11 0.08 0.15 0.17
Japan 0.05 0.14 0.12 0.17 0.25 0.18
Myanmar 0.21 0.19 0.03 0.15 0.13 0.14
Nepal 0.05 0.13 0.05 0.25 0.65 0.24
Pakistan 0.26 0.27 0.18 0.31 0.36 0.27
Philippines 0.12 0.14 0.10 0.22 0.21 0.31
Singapore 0.12 0.13 0.11 0.15 0.13 0.10
South Korea 0.07 0.11 0.10 0.19 0.14 0.13
Sri Lanka 0.21 0.18 0.22 0.32 0.32 0.32
Taiwan na na na na na na
Thailand 0.12 0.15 0.10 0.28 0.25 0.16
Viet Nam na 0.05 0.11 na 0.05 0.30na= not available. Source: Prepared by the author himself on the basis of data contained in Table-3 shown in Appendex-3 The above Table shows that almost all the Asian countries’ import ratios from EU
as compared to import from the world have been steadily decreasing whereas
export ratios to EU as compared to world export have been increasing. This
clearly shows that Asian countries are more dependent on EU for exports of
goods. This also proves our previous discussion of trade interdependence
between EU and Asia. This means that there has been a high dependency of
Asian countries export trade on EU countries.
15
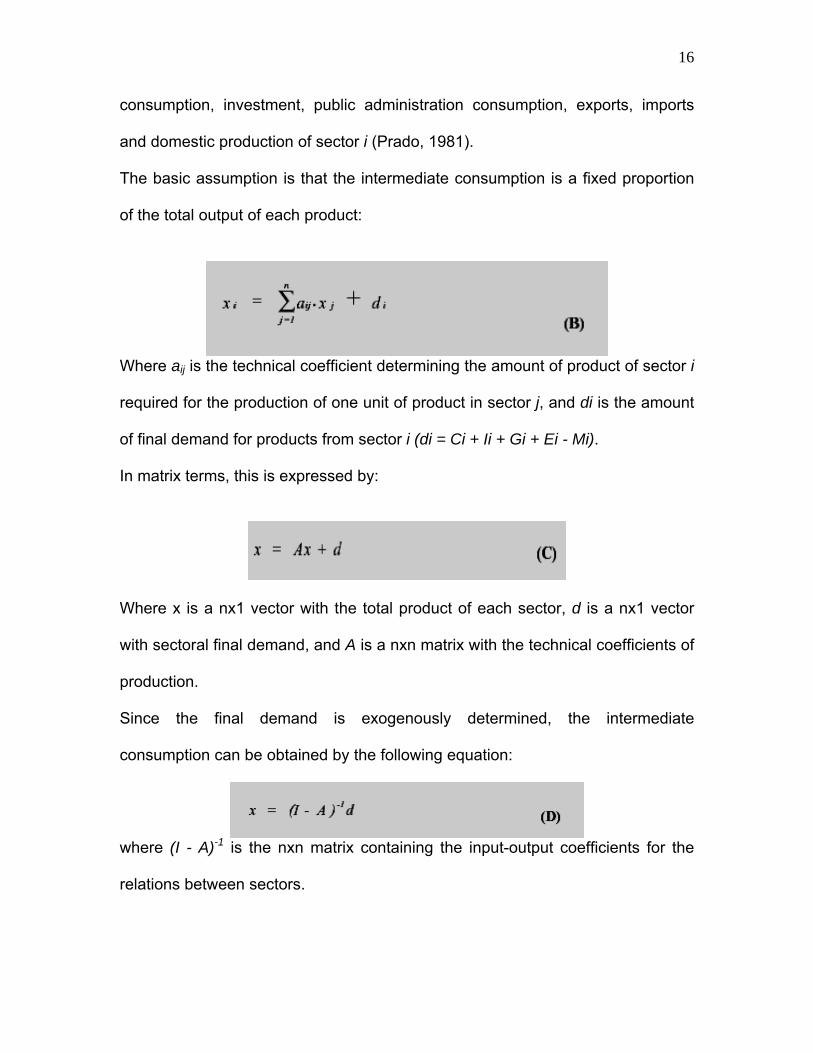
2.3 The input-output model This section indicates a general input-output model to help potential researchers
to evaluate empirically to find out the economic interdependence between EU
and its major (Asian) trading partners in coming days on the basis of model
developed by Young (….). The objective of the input-output model is to describe
the interdependence of the economy, given the current levels of production and
consumption. Assuming that all the (n) sectors of an economy keep a constant
share in the market of each product, and that the production processes of all
these sectors are technologically interdependent and characterized by a linear
relation between the amount of inputs required and the final output of each
sector, it is possible to obtain a system containing n equations relating the output
of every sector to the output of all other sectors. The model also considers an
autonomous sector (final demand) which is determined exogenously to the
model. The sales of each sector should be equal to autonomous consumption
(related to the categories of final demand) plus the amount of production
destined to the intermediate consumption of all the other sectors (Dorfman,
1954).
In formal terms:
where xij is the amount of output from sector i demanded as intermediate
consumption to sector j, and Ci, Ii, Gi, Ei, Mi and xi are, respectively, the private
16
consumption, investment, public administration consumption, exports, imports
and domestic production of sector i (Prado, 1981).
The basic assumption is that the intermediate consumption is a fixed proportion
of the total output of each product:
Where aij is the technical coefficient determining the amount of product of sector i
required for the production of one unit of product in sector j, and di is the amount
of final demand for products from sector i (di = Ci + Ii + Gi + Ei - Mi).
In matrix terms, this is expressed by:
Where x is a nx1 vector with the total product of each sector, d is a nx1 vector
with sectoral final demand, and A is a nxn matrix with the technical coefficients of
production.
Since the final demand is exogenously determined, the intermediate
consumption can be obtained by the following equation:
where (I - A)-1 is the nxn matrix containing the input-output coefficients for the
relations between sectors.
17
The same formula is valid for calculating the direct and indirect effects of exports
or any other component of the final demand, instead of its aggregate:
where xf is the nx1 vector containing the total production per sector necessary to
obtain the nx1 vector of the f-category of final demand (df). Therefore, the input-
output model allows the determination of the level of economic activity in each
productive sector as a function of the final demand for each product.
2.4 The Concluding Remarks Although, historically, most of the EU member countries have been tied with
Africa, there has been a shift of EU relationship towards Asia in various aspects.
This is evident from the facts obtained that most of the Asian countries have
been highly dependent on EU for exporting merchandise. Since most of the
Asian countries are in the group of developing nations, they need export
destinations more importantly than import. However, the input-output model
indicates that if imports of raw materials can be done efficiently, this will help
exports at a lower cost as more output would be possible. Whereas trade in the
world replaces aid, developing Asian nations should also look for trading partners
around the world. EU can be a good trading partner as it has already proved that
most of the Asian countries exports are dependent on EU. Analyzing the trade
trend, trade dependency ratios (by export and import dependency ratios) it is
proved in this article that EU is a good trade destination for Asia.
On the other hand, EU’s core objective is to strengthen its presence in Asia,
raising it to a level commensurate with the growing global weight of an enlarged
18
Union. To do this, the strategy focuses on six key dimensions: strengthening EU
engagement with Asia in the political and security fields, strengthening EU-Asia
two-way trade and investment relations in both directions, contributing effectively
to reduce poverty in the region, helping promote the spread of democracy, good
governance and the rule of law across the region: in turn building global
partnerships with key Asian partners (in combating global challenges as well as
in international organizations), and promoting further the awareness between the
two regions (EU-Asia, 2001). Whereas EU was rigid on other dimensions such as
democracy and protection of human rights, it is now flexible enough to accept
Asia on the basis of Asian-Type democracy and human rights.
So, it can be concluded that both the continents have enormous potentials to
increase trade in both way directions. However, Asian countries need to ensure
the protection of investment, good governance, transparency, and the law and
order situations. These countries have poor records on those aspects.
It is the expectation that the potential researchers will work on input-output model
that will help evaluate more and more imports and exports between these two
regions.
19
References Asia-Europe Vision Group (1999): The ASEM Process,
http://europa.eu.int/index_en.htm
Commission Policy Paper (2003): for Transmission to the Council and the European
Parliament on ‘A maturing partnership – shared interests and challenges in EU-China
relations, COM (2003) 533 final, 10 September.
Commission Communication (2001): ‘Europe and Asia: A Strategic Framework for
Enhanced Partnerships’, COM (2001), 469 final, 4 September.
Dorfman, R. (1954): The nature and significance of input-output, Review of
Economics and Statistics v.36, May. EU-Asia (2001): European Commission adopts new strategy for enhanced partnership
Europa, (2004): EU- Asia External Relations: Economic Relations
http://europa.eu.int/index_en.htm
Eurostat (2003): as quoted in Strategy Paper and Indicative Program for Multi-Country
Programs in Asia 2005-2006, External Relations Directorate General, Directorate Asia
(Except Japan and Korea), Policy, Planning and Coordination, Commission of the
European Communities.
Francis Ng and Alexander Yeats (2003): Major Trade Trends in East Asia -- What are
their Implications for Regional Cooperation and Growth? World Bank Policy Research
Working Paper 3084, June
Gilpin, Robert (2001): Global Political Economy: Understanding the International Economic Order, Princeton University, USA, p-2.
20
Maddison, Angu, (1995): Monitoring the World Economy (Paris: Organization for Economic Cooperation and Development). Prado, E. (1981): Estrutura tecnológica e desenvolvimento regional. Estudos
Econômicos, v.10. São Paulo: IPE/USP as quoted in Young (……).
Streeten, Paul (2001): Integration, Interdependence, and Globalization Finance and Development (A Quarterly Journal of the IMF), June, Volume 38, Number 2, p-2. Streeten, Paul (1989): International Cooperation, in Handbook of Development
Economics, Vol. 2, ed. by Hollis Chenery and T. N. Srinivasan (Amsterdam: North
Holland), pp. 1153-86.
Wade, Robert (1996): Globalization and Its Limits: Reports of the Death of the National
Economy Are Greatly Exaggerated, in National Diversity and Global Capitalism, ed. by
Suzanne Berger and Ronald Dore (Ithaca, New York; and London: Cornell University
Press).
Young, Carlos Eduardo Frickmann (…..): International Trade and Industrial
Emission in Brazil: An Input-Output Approach, Institute of Economics/ Federal
University of Rio de Janeiro, Brazil
21
Appendix-1
Block wise Economic Data for Regional Comparison in 2001 Name of the Block
Population in Mio Area (1000qkm) GDP Bn Euro GDP Per Capita
(Euro) A P E C 2,528 62,695 23,436 9,271ASEAN 539 4,480 656 1,217ASIA ASEM Countries 1,905 13,435 7,000 3,675SAARC 1,322 4,491 711 538 Source: Summarized from EUROSTAT (COMEXT, CRONOS) IMF (DOTS) WEFA (WMM) DG TRADE A2/CG/SG/WB, Brussels, January 2003 APEC: Australia, Brunei, Canada, Chile, China, Hong Kong, Indonesia, Japan, South Korea, Malaysia, Mexico, New Zealand, Papoua New Guinea, Peru, Philippines, Russia, Singapore, Taiwan, Thailand, USA, Vietnam ASEAN : Brunei, Cambodia, Indonesia, Laos, Malaysia, Myanmar, Philippines, Singapore, Thailand, Vietnam SAARC: Pakistan, India, Bangladesh, Maldives, Sri Lanka, Nepal, Bhutan ASIA ASEM Countries: A description on this informal dialogue is provided in the introduction of this paper. Figure-1: Shows the Positions of Trading Blocks
22
Appendix-2 Table-2: Regional Trade between EU and its major Asian Partners (Block wise)
ASEAN Mercendise Trade with the World and with EU 1980-2001(in billion Euro) ASEAN WITH THE WORLD EU WITH ASEAN
ASIA ASEM Countries Mercendise Trade with the World and with EU 1980-2001(in billion Euro)ASIA ASEM Countries with the World EU WITH ASIA ASEM Countries
Source: Summarized from EUROSTAT (COMEXT, CRONOS) IMF (DOTS) WEFA (WMM) DG TRADE A2/CG/SG/WB, Brussels, January 2003
Appendix-3
Table-3: Shows the Trading Interdependence between EU and its Major Asian Trading Partners (amount in billion Euro) and Asian countries with the World.
Respective Country and the World EU and Respective Country