THE EFFECT OF IMPORTS OF STEEL ON THE NATIONAL SECURITY AN INVESTIGATION CONDUCTED UNDER SECTION 232 OF THE TRADE EXPANSION ACT OF 1962, AS AMENDED U.S. Department of Commerce Bureau of Industry and Security Office of Technology Evaluation January 11, 2018
Transcript
THE EFFECT OF IMPORTS OF STEEL ON THE NATIONAL SECURITY
AN INVESTIGATION CONDUCTED UNDER SECTION 232 OF THE TRADE EXPANSION ACT OF 1962 AS AMENDED
US Department of Commerce Bureau of Industry and Security Office of Technology Evaluation
January 11 2018
THE EFFECT OF IMPORTS OF STEEL ON THE NATIONAL SECURITY
TABLE OF CONTENTS I EXECUTIVE SUMMARY 1
II LEGAL FRAMEWORK 11
III INVESTIGATION PROCESS 18
A Initiation of Investigation 18
B Public Hearing 18
C Public Comments 18
D Interagency Consultation 19
IV PRODUCT SCOPE OF THE INVESTIGATION 21
V FINDINGS 23
A Steel is Important to US National Security 23
1 Steel is Needed for National Defense Requirements 232 Steel is Required for US Critical Infrastructure 233 Domestic Steel Production is Essential for National Security Applications 244 Domestic Steel Production Depends on a Healthy and Competitive US Industry 255 Steel Consumed in Critical Industries 25
B Imports in Such Quantities as are Presently Found Adversely Impact the EconomicWelfare of the US Steel Industry 27
1 Imports of Steel Products Continue to Increase 272 High Import Penetration 293 High Import to Export Ratio 304 Steel Prices 315 Steel Mill Closures 336 Declining Employment Trend Since 1998 357 Trade Actions ndash Antidumping and Countervailing Duties 368 Loss of Domestic Opportunities to Bidders Using Imported Steel 369 Financial Distress 3710 Capital Expenditures 40
C Displacement of Domestic Steel by Excessive Quantities of Imports has the Serious Effectof Weakening Our Internal Economy 41
1 Domestic Steel Production Capacity is Stagnant and Concentrated 412 Production is Well Below Demand 46
3 Utilization Rates are Well Below Economically Viable Levels 474 Declining Steel Production Facilities Limits Capacity Available for a NationalEmergency 49
D Global Excess Steel Capacity is a Circumstance that Contributes to the Weakening of theDomestic Economy 51
1 Free markets globally are adversely affected by substantial chronic global excess steelproduction led by China 512 Increasing global excess steel capacity will further weaken the internal economy as USsteel producers will face increasing import competition 53
VI CONCLUSION 55
VII RECOMMENDATION 58
Prepared by Bureau of Industry and Securityhttpwwwbisdocgov
APPENDICES
APPENDIX A Section 232 Investigation Notification Letter to Secretary of Defense James Mattis (April 19 2017) Department of Defense Response to Notification (May 8 2017)
APPENDIX B Presidential Memorandum for the Secretary of Commerce - Steel Imports and Threats to National Security (April 20 2017)
APPENDIX C Federal Register - Notice Request for Public Comments and Public Hearing on Section 232 National Security Investigation of Imports of Steel (April 21 2017)
APPENDIX D Federal Register - Notice on Procedures for Attending or Viewing Remotely the Public Hearing on Section 232 National Security Investigation of Imports of Steel (May 17 2017)
APPENDIX E Public Hearing Witnesses
APPENDIX F Public Hearing Testimonies
APPENDIX G Public Comments
APPENDIX H Uses of Steel for National Defense
APPENDIX I Uses of Steel for Critical Infrastructure
APPENDIX J US Government Steel Measures and Actions
APPENDIX K Steel Orders in Effect as of January 11 2018
APPENDIX L Global Excess Capacity in Steel Production
I EXECUTIVE SUMMARY
Overview
This report summarizes the findings of an investigation conducted by the US
Department of Commerce (the ldquoDepartmentrdquo) pursuant to Section 232 of the Trade
Expansion Act of 1962 as amended (19 USC sect1862 (ldquoSection 232rdquo)) into the
effect of imports of steel mill products (ldquosteelrdquo) on the national security of the United
States
In conducting this investigation the Secretary of Commerce (the ldquoSecretaryrdquo)
noted the Departmentrsquos prior investigations under Section 232 This report
incorporates the statutory analysis from the Departmentrsquos 2001 Report1 with respect
to applying the terms ldquonational defenserdquo and ldquonational securityrdquo in a manner that is
consistent with the statute and legislative intent2 As in the 2001 Report the
Secretary in this investigation determined that ldquonational securityrdquo for purposes of
Section 232 includes the ldquogeneral security and welfare of certain industries beyond
those necessary to satisfy national defense requirements which are critical to
minimum operations of the economy and governmentrdquo3
As required under Section 232 the Secretary examined the effect of imports
on national security requirements including domestic production needed for
projected national defense requirements the capacity of domestic industries to meet
such requirements existing and anticipated availabilities of the human resources
products raw materials and other supplies and services essential to the national
defense the requirements of growth of such industries and such supplies and
services including the investment exploration and development necessary to assure
such growth and the importation of goods in terms of their quantities availabilities
character and use as those affect such industries and the capacity of the United
States to meet national security requirements
1 Department of ommerce ureau of Export dministration- The Effect of Imports of Iron Ore and Semi-Finished Steel on the National Security- Oct 2001 (2001 Report)
2 Id at 5
3 Id
1
The Secretary also recognized the close relation of the economic welfare of
the United States to its national security the impact of foreign competition on the
economic welfare of individual domestic industries and any substantial
unemployment decrease in revenues of government loss of skills or any other
serious effects resulting from the displacement of any domestic products by
excessive imports without excluding other factors in determining whether a
weakening of the US economy by such imports may impair national security In
particular this report assesses whether steel is being imported ldquoin such quantitiesrdquo
and ldquounder such circumstancesrdquo as to ldquothreaten to impair the national securityrdquo4
Findings
In conducting the investigation the Secretary found
A Steel is Important to US National Security
1 National security includes projected national defense requirements for the US Department of Defense
2 National security also encompasses US critical infrastructure sectors including transportation systems the electric power grid water systems
and energy generation systems
3 Domestic steel production is essential for national security applications Statutory provisions illustrate that Congress believes domestic
production capability is essential for defense requirements and critical
infrastructure needs and ultimately to the national security of the United
States5 US Government actions on steel across earlier Administrations
4 19 US sect 1862(b)(3)()
5 See eg 15 US sect 271(a)(1)(The future well-being of the United States economy depends on a strong manufacturing base0)- 50 US sect 4502(a)(ongress finds that ndash (1) the security of the United States is dependent on the ability of the domestic industrial base to supply materials and services0 (2)() to provide for the protection and restoration of domestic critical infrastructure operations under emergency conditions0- and merican Recovery and Reinvestment ct PL 111-5 sect1605 123 Stat 303 (Feb 17 2009) (providing that none of the funds appropriated or made available by the act may be used for the construction alteration maintenance or repair of a public building or public work unless the iron steel and manufactured goods are produced in the United States)
2
further demonstrate domestic steel production is vital to national
security6
4 Domestic steel production depends on a healthy and competitive US industry The principal types of mills that produce steel are integrated
mills with basic oxygen furnaces (BOFs) mini-mills using electric arc
furnaces (EAFs) re-rollerconverter and metal coater facilities Basic
oxygen furnaces convert raw materials into steel and remain critical for
continued innovation in steel technology Covered in this report are five
categories of steel products that are used for national security
applications flat long semi-finished pipe and tube and stainless
5 The Department found that demand for steel in critical industries has increased since the Departmentrsquos last investigation in 2001 The 2001
Report determined that there was 3368 million tons of finished steel
consumed in critical industries per year in the United States based on
1997 data7 The Department updated that analysis for this report using
2007 data (the latest available) and determined that domestic
consumption in critical industries has increased significantly with 54
million metric tons of steel now being consumed annually in critical
industries
B Imports in Such Quantities as are Presently Found Adversely Impact the Economic Welfare of the US Steel Industry
1 The United States is the worldrsquos largest steel importer In the first ten months of 2017 steel imports have increased at a double-digit rate over
2016 accounting for more than 30 percent of US consumption
Notwithstanding numerous anti-dumping and countervailing duty orders
which are limited in scope imports of most types of steel continue to
increase
6 See infra section V()(3) and ppendix J
7 2001 Report at 14 The 2001 Report is not clear whether it used short tons or metric tons If short tons were used then the metric ton equivalent is 3056 million metric tons
3
2 Import penetration levels for flat semi-finished stainless long and pipe and tube products continue on an upward trend above 30 percent of
domestic consumption
3 Imports are nearly four times US exports
4 Imports are priced substantially lower than US produced steel
5 Excessive steel imports have adversely impacted the steel industry Numerous US steel mill closures a substantial decline in employment
lost domestic sales and market share and marginal annual net income for
US-based steel companies illustrate the decline of the US steel industry
C Displacement of Domestic Steel by Excessive Quantities of Imports has the
Serious Effect of Weakening our Internal Economy
1 As steel imports have increased US steel production capacity has been stagnant and production has decreased
2 Since 2000 foreign competition and the displacement of domestic steel by excessive imports have resulted in the closure of six basic oxygen furnace
facilities and the idling of four more (which is more than a 50 percent
reduction in the number of such facilities) a 35 percent decrease in
employment in the steel industry and caused the domestic steel industry
as a whole to operate on average with negative net income since 2009
3 The declining steel capacity utilization rate is not economically sustainable Utilization rates of 80 percent or greater are necessary to
sustain adequate profitability and continued capital investment research
and development and workforce enhancement in the steel sector
D Global Excess Steel Capacity is a Circumstance that Contributes to the
Weakening of the Domestic Economy
1 In the steel sector free markets globally are adversely affected by substantial chronic global excess steel production led by China The
worldrsquos nominal crude steelmaking capacity reached about 24 billion
metric tons in 2016 an increase of 127 percent compared to the capacity
4
level in 2000 while steel demand grew at a much smaller rate In 2016
there was a 737 million metric ton global gap between steelmaking
capacity and steel crude demand which means there is unlikely to be any
market-driven reduction in steel exports to the United States in the near
future 8
2 While US steel production capacity has remained flat since 2001 other steel producing nations have increased their production capacity with
China alone able to produce as much steel as the rest of the world
combined This overhang of excess capacity means that US steel
producers for the foreseeable future will face increasing competition
from imported steel as other countries export more steel to the United
States to bolster their own economic objectives and offset loss of markets
to Chinese steel exports
Conclusion
Based on these findings the Secretary of Commerce concludes that the
present quantities and circumstance of steel imports are ldquoweakening our internal
economyrdquo and threaten to impair the national security as defined in Section 232 The
Secretary considered the Departmentrsquos narrower investigation of iron ore and semi-
finished steel imports in 2001 which recommended no action be taken and finds
that several important factors ndash the broader scope of the investigation the level of
global excess capacity the level of imports the reduction in basic oxygen furnace
facilities since 2001 and the potential impact of further plant closures on capacity
needed in a national emergency support recommending action under Section 232
In light of this conclusion the Secretary has determined that the only effective means
of removing the threat of impairment is to reduce imports to a level that should in
combination with good management enable US steel mills to operate at 80 percent
or more of their rated production capacity
Source Global Forum report- httpwwwbmwideRedaktionENDownloadsglobal-forum-on-steel-excess-
capacity-reportpdf
5
8
Recommendation
Prior significant actions to address steel imports using quotas andor tariffs
were taken under various statutory authorities by President George W Bush
President William J Clinton (three times) President George H W Bush President
Ronald W Reagan (three times) President James E Carter (twice) and President
Richard M Nixon all at lower levels of import penetration than the present level
which is greater than 30 percent
Due to the threat as defined in Section 232 to national security from steel
imports the Secretary recommends that the President take immediate action by
adjusting the level of these imports through quotas or tariffs The quotas or tariffs
imposed should be sufficient even after any exceptions (if granted) to enable US
steel producers to operate at an 80 percent or better average capacity utilization rate
based on available capacity in 2017 (see Figure 1)
6
Figure 1 Import Levels and US Steel Mill Capacity Utilization Rates
Steel Market Snapshot (millions of metric tons) 2011-2016
Average 2017
Annualized
Total Demand for Steel in US (production + imports-exports) 1055 1073
US Annual Capacity 1144 1133
US Annual Production (liquid) 846 819
Capacity Utilization Rate (percentage) 740 723
Imports and Exports (millions of metric tons)
Imports of Steel to US (including semi-finished) 318 360
Exports of Steel from the US 108 101
Percent Import Penetration 301 338
Production at Various Utilization Rates (millions of metric tons)
Maximum Capacity 1144 1133
Production at 75 Capacity Utilization 858 850
Production at 80 Capacity Utilization 915 906
Production at 85 Capacity Utilization 972 963
Import Levels and Domestic Production Targets Based on 80 Capacity Utilization
General Equilibrium (GTAP Model ndash Includes Reduction in Exports and Demand)
Maximum Import Level (mmt) 227
Estimated Import Penetration 22
Estimated Production (mmt) 906
Alternative 1A Quota Applied to 2017 Import Levels 63
Alternative 1B Tariff Rate Applied to All Imports 24
Numbers may differ slightly due to rounding Sources United States Department of Commerce Bureau of the Census American Iron and Steel Institute Calculations based on industry and trade data
The Secretary recommends that the President impose a quota or tariff on all
steel products covered in this investigation imported into the United States to remove
the threatened impairment to national security
Alternative 1 ndash Global Quota or Tariff
1A Global Quota
Impose quotas on all imported steel products at a specified percent of the 2017
import level applied on a country and steel product basis
7
According to the Global Trade Analysis Project (GTAP) Model9 produced by
Purdue University a 63 percent quota would be expected to reduce steel imports by
about 37 percent (133 million metric tons) from 2017 levels Based on imports from
January to October import levels for 2017 are projected to reach 360 million metric
tons This action would result in imports equaling about 227 million metric tons
which will enable an 80 percent capacity utilization rate at 2017 demand levels
(including exports)
1B Global Tariff
Apply a tariff rate on all imported steel products in addition to any
antidumping or countervailing duty collections applicable to any imported steel
product
According to the Global Trade Analysis Project (GTAP) Model produced by
Purdue University a 24 percent tariff on all steel imports would be expected to
reduce imports by 37 percent (ie a reduction of 133 million metric tons from 2017
levels of 360 million metric tons) This tariff rate would thus result in imports
equaling about 227 million metric tons which will enable an 80 percent capacity
utilization rate at 2017 demand levels (including exports)
Alternative 2 ndash Tariffs on a Subset of Countries
Apply a tariff rate on all imported steel products from Brazil South Korea
Russia Turkey India Vietnam China Thailand South Africa Egypt Malaysia and
Costa Rica in addition to any antidumping or countervailing duty collections
applicable to any steel products from those countries All other countries would be
limited to 100 percent of their 2017 import level
According to the Global Trade Analysis Project (GTAP) Model produced by
Purdue University a 53 percent tariff on all steel imports from this subset of
countries would be expected to reduce imports by 133 million metric tons from 2017
The standard GTP Model is a static multiregional multisector computable general equilibrium model with perfect competition and constant returns to scale The model is based on optimizing behavior by economic agents The standard GTP closure allows all prices and wages in the economy to adjust so as to ensure supply equals demand in all markets including the labor market The estimates in this report were made using the GTP 10 model which has a 2014 base
8
9
import levels from the targeted countries This action would enable an increase in
domestic production to achieve an 80 percent capacity utilization rate at 2017
demand levels (including exports) The countries identified are projected to account
for less than 4 percent of US steel exports in 2017
Exemptions
In selecting an alternative the President could determine that specific
countries should be exempted from the proposed 63 percent quota or 24 percent tariff
by granting those specific countries 100 percent of their prior imports in 2017 based
on an overriding economic or security interest of the United States The Secretary
recommends that any such determination should be made at the outset and a
corresponding adjustment be made to the final quota or tariff imposed on the
remaining countries This would ensure that overall imports of steel to the United
States remain at or below the level needed to enable the domestic steel industry to
operate as a whole at an 80 percent or greater capacity utilization rate The limitation
to 100 percent of each exempted countryrsquos 2017 imports is necessary to prevent
exempted countries from producing additional steel for export to the United States
or encouraging other countries to seek to trans-ship steel to the United States through
the exempted countries
It is possible to provide exemptions from either the quota or tariff and still
meet the necessary objective of increasing US steel capacity utilization to a
financially viable target of 80 percent However to do so would require a reduction
in the quota or increase in the tariff applied to the remaining countries to offset the
effect of the exempted import tonnage
Exclusions
The Secretary recommends an appeal process by which affected US parties
could seek an exclusion from the tariff or quota imposed The Secretary would grant
exclusions based on a demonstrated (1) lack of sufficient US production capacity
of comparable products or (2) specific national security based considerations This
appeal process would include a public comment period on each exclusion request
9
and in general would be completed within 90 days of a completed application being
filed with the Secretary
An exclusion may be granted for a period to be determined by the Secretary
and may be terminated if the conditions that gave rise to the exclusion change The
US Department of Commerce will lead the appeal process in coordination with the
Department of Defense and other agencies as appropriate Should exclusions be
granted the Secretary would consider at the time whether the quota or tariff for the
remaining products needs to be adjusted to increase US steel capacity utilization to
a financially viable target of 80 percent
10
II LEGAL FRAMEWORK
I Section 232 Requirements
Section 232 provides the Secretary with the authority to conduct
investigations to determine the effect on the national security of the United States of
imports of any article It authorizes the Secretary to conduct an investigation if
requested by the head of any department or agency upon application of an interested
party or upon his own motion See 19 USC sect 1862(b)(1)(A)
Section 232 directs the Secretary to submit to the President a report with
recommendations for ldquoaction or inaction under this sectionrdquo and requires the
Secretary to advise the President if any article ldquois being imported into the United
States in such quantities or under such circumstances as to threaten to impair the
national securityrdquo See 19 USC sect 1862(b)(3)(A)
Section 232(d) directs the Secretary and the President to in light of the
requirements of national security and without excluding other relevant factors give
consideration to the domestic production needed for projected national defense
requirements and the capacity of the United States to meet national security
requirements See 19 USC sect 1862(d)
Section 232(d) also directs the Secretary and the President to ldquorecognize the
close relation of the economic welfare of the Nation to our national security and
helliptake into consideration the impact of foreign competition on the economic welfare
of individual domestic industriesrdquo by examining whether any substantial
unemployment decrease in revenues of government loss of skills or investment or
other serious effects resulting from the displacement of any domestic products by
excessive imports or other factors result in a ldquoweakening of our internal economyrdquo
that may impair the national security See 19 USC sect 1862(d)
Once an investigation has been initiated Section 232 mandates that the
Secretary provide notice to the Secretary of Defense that such an investigation has
been initiated Section 232 also requires the Secretary to do the following
(1) ldquoConsult with the Secretary of Defense regarding the methodological and policy questions raised in [the] investigationrdquo
11
(2) ldquoSeek information and advice from and consult with appropriate
officers of the United Statesrdquo and
(3) ldquoIf it is appropriate and after reasonable notice hold public hearings or
otherwise afford interested parties an opportunity to present
information and advice relevant to such investigationrdquo10 See 19 USC
sect 1862(b)(2)(A)(i)-(iii)
As detailed in Parts III and V of this report each of the legal requirements set
forth above has been satisfied
In conducting the investigation Section 232 permits the Secretary to request
that the Secretary of Defense provide an assessment of the defense requirements of
the article that is the subject of the investigation See 19 USC sect 1862(b)(2)(B)
Upon completion of a Section 232 investigation the Secretary is required to
submit a report to the President no later than 270 days after the date on which the
investigation was initiated See 19 USC sect 1862(b)(3)(A) The required report
must
(1) Set forth ldquothe findings of such investigation with respect to the effect of the importation of such article in such quantities or under such
circumstances upon the national securityrdquo
(2) Set forth ldquobased on such findings the recommendations of the Secretary for action or inaction under this sectionrdquo and
(3) ldquoIf the Secretary finds that such article is being imported into the United States in such quantities or under such circumstances as to threaten to
impair the national security so advise the Presidentrdquo See 19 USC
sect 1862(b)(3)(A)
10 Department regulations (i) set forth additional authority and specific procedures for such input from interested parties see 15 FR sectsect 7057 and 7058 and (ii) provide that the Secretary may vary or dispense with those procedures in emergency situations or when in the judgment of the Department national security interests require it Id sect 7059
12
All unclassified and non-proprietary portions of the report submitted by the
Secretary to the President must be published
Within 90 days after receiving a report in which the Secretary finds that an
article is being imported into the United States in such quantities or under such
circumstances as to threaten to impair the national security the President shall
(1) ldquoDetermine whether the President concurs with the finding of the Secretaryrdquo and
(2) ldquoIf the President concurs determine the nature and duration of the action that in the judgment of the President must be taken to adjust the
imports of the article and its derivatives so that such imports will not
threaten to impair the national securityrdquo See 19 USC sect
1862(c)(1)(A)
II Discussion
While Section 232 does not contain a definition of ldquonational securityrdquo both
Section 232 and its implementing regulations at 15 CFR Part 705 contain non-
exclusive lists of factors that Commerce must consider in evaluating the effect of
imports on the national security Congress in Section 232 explicitly determined that
ldquonational securityrdquo includes but is not limited to ldquonational defenserdquo requirements
See 19 USC sect 1862(d) The Department in 2001 determined that ldquonational
defenserdquo includes both defense of the United States directly and the ldquoability to
project military capabilities globallyrdquo11
The Department also concluded in 2001 that ldquoin addition to the satisfaction of
national defense requirements the term ldquonational securityrdquo can be interpreted more
broadly to include the general security and welfare of certain industries beyond
those necessary to satisfy national defense requirements that are critical to the
minimum operations of the economy and governmentrdquo The Department called
these ldquocritical industriesrdquo12 This report once again uses these reasonable
11 Department of ommerce ureau of Export dministration- The Effect of Imports of Iron Ore and Semi-Finished Steel on the National Security- Oct 2001 (2001 Report)
12 Id
13
interpretations of ldquonational defenserdquo and ldquonational securityrdquo However this report
uses the more recent 16 critical infrastructure sectors identified in Presidential Policy
Directive 2113 instead of the 28 critical industry sectors used by the Bureau of Export
Administration in the 2001 Report14
Section 232 directs the Secretary to determine whether imports of any article
are being made ldquoin such quantities or under such circumstancesrdquo that those imports
ldquothreaten to impair the national securityrdquo See 19 USC sect 1862(b)(3)(A) The
statutory construction makes clear that either the quantities or the circumstances
standing alone may be sufficient to support an affirmative finding They may also
be considered together particularly where the circumstances act to prolong or
magnify the impact of the quantities being imported
The statute does not define a threshold for when ldquosuch quantitiesrdquo of imports
are sufficient to threaten to impair the national security nor does it define the
ldquocircumstancesrdquo that might qualify
Likewise the statute does not require a finding that the quantities or
circumstances are impairing the national security Instead the threshold question
under Section 232 is whether those quantities or circumstances ldquothreaten to impair
the national securityrdquo See 19 USC sect 1862(b)(3)(A) This formulation strongly
suggests that Congress expected an affirmative finding under Section 232 would
occur before there is actual impairment of the national security 15
Section 232(d) contains a considerable list of factors for the Secretary to
consider in determining if imports ldquothreaten to impair the national securityrdquo16 of the
United States and this list is mirrored in the implementing regulations See 19
13 Presidential Policy Directive 21- ritical Infrastructure Security and Resilience- February 12 2013 (PPD-21)
14 See Op it at 16
15 The 2001 Report used the phrase fundamentally threaten to impair when discussing how imports may threaten to impair national security See 2001 Report at 7 and 37 ecause the term fundamentally is not included in the statutory text and could be perceived as establishing a higher threshold the Secretary expressly does not use the qualifier in this report The statutory threshold in Section 232(b)(3)() is unambiguously threaten to impair and the Secretary adopts that threshold without qualification 19 US sect 1862(b)(3)() The statute also uses the formulation may impair in Section 232(d) Id at 1862(d)
16 19 US sect 1862(b)(3)()
14
USC sect 1862(d) and 15 CFR sect 7054 Congress was careful to note twice in
Section 232(d) that the list they provided while mandatory is not exclusive17
Congressrsquo illustrative list is focused on the ability of the United States to maintain
the domestic capacity to provide the articles in question as needed to maintain the
national security of the United States18 Congress broke the list of factors into two
equal parts using two separate sentences The first sentence focuses directly on
ldquonational defenserdquo requirements thus making clear that ldquonational defenserdquo is a
subset of the broader term ldquonational securityrdquo The second sentence focuses on the
broader economy and expressly directs that the Secretary and the President ldquoshall
recognize the close relation of the economic welfare of the Nation to our national
securityrdquo19 See 19 USC sect 1862(d)
Two of the factors listed in the second sentence of Section 232(d) are most
relevant in this investigation Both are directed at how ldquosuch quantitiesrdquo of imports
threaten to impair national security See 19 USC sect 1862(b)(3)(A) In
administering Section 232 the Secretary and the President are required to ldquotake into
consideration the impact of foreign competition on the economic welfare of
individual domestic industriesrdquo and any ldquoserious effects resulting from the
displacement of any domestic products by excessive importsrdquo in ldquodetermining
whether such weakening of our internal economy may impair the national securityrdquo
17 See 19 US sect 1862(d) (the Secretary and the President shall in light of the requirements of national security and without excluding other relevant factors0 and serious effects resulting from the displacement of any domestic products by excessive imports shall be considered without excluding other factors0 )
18 This reading is supported by ongressional findings in other statutes See eg 15 US sect 271(a)(1)(The future well-being of the United States economy depends on a strong manufacturing base0) and 50 US sect 4502(a)(ongress finds that ndash (1) the security of the United States is dependent on the ability of the domestic industrial base to supply materials and services0 (2)() to provide for the protection and restoration of domestic critical infrastructure operations under emergency conditions0 (3)0 the national defense preparedness effort of the United States Government requires ndash () the development of domestic productive capacity to meet ndash (ii) unique technological requirements0 (7) much of the industrial capacity that is relied upon by the United States Government for military production and other national defense purposes is deeply and directly influenced by ndash () the overall competitiveness of the industrial economy of the United States- and () the ability of industries in the United States in general to produce internationally competitive products and operate profitably while maintaining adequate research and development to preserve competitiveness with respect to military and civilian production- and (8) the inability of industries in the United States especially smaller subcontractors and suppliers to provide vital parts and components and other materials would impair the ability to sustain the rmed Forces of the United States in combat for longer than a short period )
19 ccord 50 US sect 4502(a)
15
See 19 USC sect 1862(d) Since the 2001 investigation foreign competition and the
displacement of domestic steel by excessive imports have resulted in the closure of
six basic oxygen furnace facilities and the idling of four more (which is more than a
50 percent reduction in the number of such facilities) a 35 percent decrease in
employment in the steel industry and caused the domestic steel industry as a whole
to operate on average with negative net income since 2009
Another factor not on the list that the Secretary finds to be a relevant is the
presence of massive excess capacity for producing steel This excess capacity results
in steel imports occurring ldquounder such circumstancesrdquo that they threaten to impair
the national security See 19 USC sect 1862(b)(3)(A) The circumstance of excess
global steel production capacity is a factor because while US production capacity
has remained flat since 2001 other steel producing nations have increased their
production capacity with China alone able to produce as much as the rest of the
world combined This overhang of global excess capacity means that US steel
producers for the foreseeable future will continue to lose market share to imported
steel as other countries export more steel to the United States to bolster their own
economic objectives and offset loss of markets to Chinese steel exports
It is these three factors ndash displacement of domestic steel by excessive imports
and the consequent adverse impact on the economic welfare of the domestic steel
industry along with global excess capacity in steel ndash that the Secretary has concluded
create a persistent threat of further plant closures that could leave the United States
unable in a national emergency to produce sufficient steel to meet national defense
and critical industry needs The Secretary finds this ldquoweakening of our internal
economy may impair the national securityrdquo as defined in Section 232 See 19 USC
1862(d)
The Secretary also considered whether the source of the imports affects the
analysis under Section 232 In the 2001 Report ldquothe Department found that iron ore
and semi-finished steel are imported from reliable foreign sourcesrdquo and concluded
that ldquoeven if the United States were dependent on imports of iron ore and semi-
finished steel imports would not threaten to impair national securityrdquo 2001 Report
at 27 However because Congress in Section 232 chose to explicitly direct the
Secretary to consider whether the ldquoimpact of foreign competitionrdquo and
ldquothe
16
displacement of any domestic products by excessive importsrdquo are ldquoweakening our
internal economyrdquo but made no reference to an assessment of the sources of imports
it appears likely that Congress recognized adverse impacts might be caused by
imports from allies or other reliable sources20 As a result the fact that some or all
of the imports causing the harm are from reliable sources does not compel a finding
that those imports do not threaten to impair national security21
After careful examination of the facts in this investigation the Secretary has
concluded that excessive imports of steel in the present circumstances do threaten to
impair national security under Section 232 Several important factors ndash the broader
scope of the investigation22 the level of global excess capacity the level of imports
the reduction in basic oxygen furnace facilities since 2001 and the potential impact
of further plant closures on capacity needed in a national emergency ndash support a
recommendation different from the one adopted in the 2001 Report
20 When ongress adopted Section 232(d) in 1962 the immediately preceding section was Section 231 19 US sect 1861 which required the President as soon as practicable to suspend most-favored-nation tariff treatment for imports from communist countries Given the bipolar nature of the world at the time the absence of a distinction between communist and non-communist countries in Section 232 suggests that ongress expected Section 232 would be applied to imports from all countriesmdashincluding allies and other reliable sources
21 To the extent that the 2001 Report or other prior Department reports under Section 232 can be read to
conclude that imports from reliable sources cannot impair the national security when the Secretary finds those
imports are causing substantial unemployment decrease in revenues of government loss of skills or
investment or other serious effects resulting from the displacement of any domestic products by excessive
imports the Secretary expressly rejects such a reading
22 This investigation examines the import of a broad range of steel products ndash flat long pipe and tube semi-
finished and stainless ndash whereas the 2001 Report addressed only semi-finished steel products and iron ore
which is not part of this investigation s the 2001 Report noted at the time semi-finished imports accounted
for a small percentage (approximately 7 percent) of total US semi-finished steel consumption 2001 Report
at 31 The 2001 Report also stated that whether imports have harmed or threaten to harm US producers writ
large is beyond the scope of the Departments inquiry and need not be resolved here Id at 37 This
investigation is focused on the larger inquiry that the 2001 Report expressly did not reach
17
III INVESTIGATION PROCESS
A Initiation of Investigation
On April 19 2017 US Secretary of Commerce Wilbur Ross initiated an
investigation to determine the effect of imported steel on national security under
Section 232 of the Trade Expansion Act of 1962 as amended (19 USC sect 1862)
Pursuant to Section 232(b)(1)(B) the Department notified the US
Department of Defense with an April 19 2017 letter from Secretary Ross to
Secretary James Mattis23
On April 20 2017 President Donald Trump signed a Presidential
Memorandum directing Secretary Ross to proceed expeditiously in conducting his
investigation and submit a report on his findings to the President24
On April 21 2017 the Department published in the Federal Register a notice
about the initiation of this investigation to determine the effect of imports of steel on
the national security The notice also announced the opening of the public comment
period as well as a public hearing to be held on May 24 201725
B Public Hearing
The Department held a public hearing to elicit further information concerning
this investigation in Washington DC on May 24 2017 The Department heard
testimony from 37 witnesses at the hearing A full list of witnesses and copies of
their testimony are included in Appendices E and F
C Public Comments
On April 21 2017 the Department invited interested parties to submit written
comments opinions data information or advice relevant to the criteria listed in
23 19 US sect 1862(b)(1)() See ppendix Section 232 Investigation Notification Letter to Secretary of Defense James Mattis (pril 19 2017) - Department of Defense Response to Notification (May 8 2017)
24 See ppendix Presidential Memorandum for the Secretary of ommerce - Steel Imports and Threats to National Security (pril 20 2017)
25 See ppendices and D for Federal Register Notice Federal Register Vol 82 No 79 19205-19207 and See Federal Register Vol 82 No 98 23529-23530
18
Section 7054 of the National Security Industrial Base Regulations (15 CFR sect
7054) as they affect the requirements of national security including the following
(a) Quantity of the articles subject to the investigation and other circumstances
related to the importation of such articles (b) Domestic production capacity needed
for these articles to meet projected national defense requirements (c) The capacity
of domestic industries to meet projected national defense requirements (d) Existing
and anticipated availability of human resources products raw materials production
equipment facilities and other supplies and services essential to the national
defense (e) Growth requirements of domestic industries needed to meet national
defense requirements and the supplies and services including the investment
exploration and development necessary to assure such growth (f) The impact of
foreign competition on the economic welfare of any domestic industry essential to
our national security (g) The displacement of any domestic products causing
substantial unemployment decrease in the revenues of government loss of
investment or specialized skills and productive capacity or other serious effects (h)
Relevant factors that are causing or will cause a weakening of our national economy
and (i) Any other relevant factors See Federal Register Vol 82 No 79 19205-
19207
The public comment period ended on May 31 2017 The Department
received 201 written public comment submissions concerning this investigation All
public comments were carefully reviewed and factored into the investigation
process For a listing of all public comments see Appendix G
D Interagency Consultation
In addition to the required notification provided by the April 19 2017 letter
from Secretary Ross to Secretary Mattis Department staff carried out the
consultations required under Section 232(b)(2)26 Staff consulted with their
counterparts in the Department of Defense regarding any methodological and policy
questions that arose during the investigation Discussions were held with the US
Army Materiel Command the Defense Logistics Agency the US NavyNaval Air
26 19 US sect 1862(b)(2)
19
Systems Command and the Under Secretary of Defense for Acquisitions amp
Logistics Manufacturing and Industrial Base Policy
Discussions were also held with ldquoappropriate officers of the United Statesrdquo
including the Department of State Department of the Treasury Department of the
InteriorUS Geological Survey the Department of Homeland SecurityUS
Customs and Border Protection the International Trade Commission and the Office
of the United States Trade Representative 27
27 Id
20
IV PRODUCT SCOPE OF THE INVESTIGATION28 29
For this report the product scope covers steel mill products (ldquosteelrdquo) which
are defined at the Harmonized System (ldquoHSrdquo) 6-digit level as 720610 through
721650 721699 through 730110 730210 730240 through 730290 and 730410
through 730690 including any subsequent revisions to these HS codes The
following discontinued HS codes have been included for purposes of reporting
historical data (prior to 2007) 722520 722693 722694 722910 730410 730421
730610 730620 and 730660
These steel products are all produced by US steel companies and support
various applications across the defense critical infrastructure and commercial
sectors Generally these products fall into one of the following five product
categories (including but not limited to)
(1) Carbon and Alloy Flat Product (Flat Products) Produced by rolling semi-
finished steel through varying sets of rolls Includes sheets strips and plates
Flat products are covered under the following 6-digit HS codes 720810
29 Note that import data for steel products includes what are believed to be very small amounts of iron as well as steel both of which are included in the HS codes covered in the scope
As discussed in Part II ldquonational securityrdquo under Section 232 includes both
(1) national defense and (2) critical infrastructure needs
1 Steel is Needed for National Defense Requirements
Steel articles are critical to the nationrsquos overall defense objectives30 The US
Department of Defense (DoD) has a large and ongoing need for a range of steel
products that are used in fabricating weapons and related systems for the nationrsquos
defense31 DoD requirements ndash which currently require about three percent of US
steel production ndash are met by steel companies that also support the requirements for
critical infrastructure and commercial industries
The free market system in the United States requires commercially viable steel
producers to meet defense needs No company could afford to construct and operate
a modern steel mill solely to supply defense needs because those needs are too
diverse In order to supply those diverse national defense needs US steel mills
must attract sufficient commercial (ie non-defense) business The commercial
revenue supports construction operation and maintenance of production capacity
as well as the upgrades research and development required to continue to supply
defense needs in the future See Appendix H for examples
2 Steel is Required for US Critical Infrastructure
Steel also is needed to satisfy requirements for ldquothose industries that the US
Government has determined are critical to minimum operations of the economy and
governmentrdquo32 In the 2001 Report the Department identified 28 ldquocritical
industriesrdquo33 The Critical Infrastructure Assurance Office that identified the
30 ccord 2001 Report at 1 12
31 ISI 2017 public policy agenda available from httpwwwsteelorg~mediaFilesISIReportsISI-2017-
Public-Policy-gendapdfla=en
32 2001 Report at 14 See also 2001 Report at 16 Table 2 for a listing of the 28 critical industries
33 Id
23
ldquocritical industriesrdquo is no longer in existence so for this investigation the Department
instead relied on the industries identified by the US Government in the 2013
Presidential Policy Directive 21 (PPD-21) 34 The Secretary believes that the range
of industries identified in PPD-21 is comparable to the range of critical industries
analyzed in the 2001 Report
Pursuant to PPD-21 there are 16 designated critical infrastructure sectors in
the United States many of which use high volumes of steel (see Appendix I)35 The
16 sectors include chemical production communications dams energy food
production nuclear reactors transportation systems water and waste water systems
Increased quantities of steel will be needed for various critical infrastructure
applications in the coming years The American Society of Civil Engineers
estimates that the United States needs to invest $45 trillion in infrastructure by 2025
and a substantial portion of these projects require steel content36
3 Domestic Steel Production is Essential for National Security
Applications
Domestic steel production is essential for national security Congress in
Section 232(d) directed the Secretary of Commerce and the President to consider
domestic production and the economic welfare of the United States in determining
whether imports threaten to impair national security
In the case of steel the history of US Government actions to ensure the
continued viability of the US steel industry demonstrates that across decades and
Administrations there has been consensus that domestic steel production is vital to
national security
34 PPD-21 can be viewed at httpsobamawhitehousearchivesgovthe-press-office20130212presidential-policy-directive-critical-infrastructure-security-and-resil
35 Department of Homeland Security ritical Infrastructure Sectors httpswwwdhsgovcritical-infrastructure-sectors
36 2017 Infrastructure Report ard merican Society of ivil Engineers httpswwwinfrastructurereportcardorgwp-contentuploads2016102017-Infrastructure-Report-ardpdf
24
Prior significant actions under various statutory authorities to address steel
imports using quotas or tariffs were taken by President George W Bush President
William J Clinton (three times) President George H W Bush President Ronald W
Reagan (three times) President James E Carter (twice) and President Richard M
Nixon all at lower levels of import penetration than at present In the 1970s action
was taken to limit import penetration to approximately 19 percent In the 1980s
import penetration had reached 21 percent and the US Government enacted
correcting measures In the 1990s and 2000s import penetration again reached up to
23 percent which prompted the US Government to take additional actions37 In
2016 import penetration averaged 30 percent and for the first nine months of 2017
imports have consistently averaged over 30 percent of US domestic demand
4 Domestic Steel Production Depends on a Healthy and Competitive
US Industry
US steel producers would be unable to survive purely on defense or critical
infrastructure steel needs In the steel industry it is commercial and industrial
customer sales that generate the relatively steady production needed for
manufacturing efficiency and the revenue volume needed to sustain the business
Sales for critical infrastructure and defense applications are often less predictable
cyclical and limited in volume
Steel manufacturers operating in the United States however have seen their
commercial and industrial business steadily eroded by a growing influx of lower-
priced imported product from countries where steel manufacturing often is
subsidized directly or indirectly The Department of Commerce currently has 164
antidumping and countervailing duty determinations in effect and has 20 additional
cases under investigation to address specific cases See Appendix K
5 Steel Consumed in Critical Industries
In this investigation the issue before the Department is whether steel imports
ldquothreaten to impairrdquo national security See 19 USC sect 1862 As discussed in Part
II the Secretary has determined that in the present case the relevant factors are the
37 See ppendix J for additional detail on US Government actions on steel in the past
25
ldquoserious effects resulting from the displacement of hellip domestic [steel] products by
excessive importsrdquo and the ldquoimpact of foreign competition on the economic welfare
of individual domestic [steel] industriesrdquo that when combined with the circumstance
of massive global excess capacity causes a ldquoweakening of our internal economyrdquo
that ldquomay impair the national securityrdquo38
In a free market system the ability of the domestic steel industry to continue
meeting national security needs depends on the continued capability of the US steel
industry to compete fairly in the commercial marketplace and maintain a financially
viable domestic manufacturing capability This includes the need to have an
adequately skilled workforce for manufacturing as well as to conduct research and
development for future products39 A continued loss of viable commercial
production capabilities and related skilled workforce will jeopardize the US steel
industryrsquos ability to meet the full spectrum of national security requirements
The Department in 2001 determined that the ldquocritical industriesrdquo sector which
is analogous to the more robust critical infrastructure sectors identified pursuant to
PPD-21 would require ldquono more than 3368 million tons of finished steel per yearrdquo40
based on 3088 percent of domestic consumption being used in industries related to
critical infrastructure The Department has now updated the ldquocritical industriesrdquo
calculation from the 2001 Report41 using Census Bureau steel usage figures from
2007 which are the latest available See Appendix I for more detailed information
on steel needs for critical infrastructure
38 19 US sect 1862(d)
39 See 50 US sect 4502(a)(ongress finds that ndash 0 (7) much of the industrial capacity that is relied upon by the United States Government for military production and other national defense purposes is deeply and directly influenced by ndash () the overall competitiveness of the industrial economy of the United States- and the ability of industries in the United States in general to produce internationally competitive products and operate profitably while maintaining adequate research and development to preserve competitiveness with respect to military and civilian production0)
40 2001 Report at 14 The report is not clear whether it is referring to short tons or metric tons While not crucial to the analysis if the figure is in short tons then the equivalent amount in metric tons would be 3056 million metric tons
41 2001 Report at 16 (Table 2)
26
The updated analysis in Appendix I shows that 491 percent of domestic steel
consumption in 2007 was used in critical industries Domestic production in 2007
was 110 million metric tons The 491 percent of domestic consumption used in
critical industries equals 54 million metric tons compared to 3056 million metric
tons (or 3368 million short tons) used in critical industries in 1997 Thus in 10 years
the demand for steel in critical industries increased by 63 percent
B Imports in Such Quantities as are Presently Found Adversely Impact the
Economic Welfare of the US Steel Industry
In the steel sector foreign competition is characterized by substantial and
sustained global overcapacity and production in excess of foreign domestic demand
1 Imports of Steel Products Continue to Increase
The United States is the worldrsquos largest steel importer The top 20 sources of
US imports of steel products accounted for approximately 91 percent of the roughly
36 million metric tons of steel the United States is expected to import in 2017 (see
Figure 2)
Total US imports rose from 259 million metric tons in 2011 peaking at 402
million metric tons in 2014 at the height of the shale hydrocarbon drilling boom For
2017 (first ten months) imports are increasing at a double-digit rate over 2016
pushing finished steel imports consistently over 30 percent of US consumption
27
-
Figure 2 Top US Imports of All Steel Products
Imports for Domestic Consumption Quantity In Metric Tons Ranked By 2017
2017 Rank
Country 2011 2017
(Annualized) Change 2011
2017 (Annualized)
World 25994621 35927141 38
1 Canada 5539448 5800008 5
2 Brazil 2820927 4678530 66
3 South Korea 2572981 3653934 42
4 Mexico 2625104 3249292 24
5 Russia 1269717 3123691 146
6 Turkey 665303 2249456 238
7 Japan 1824393 1781147 -2
8 Germany 978230 1370669 40
9 Taiwan 588036 1251767 113
10 India 735802 854026 16
11 China 1132292 784393 -31
12 Vietnam 120134 727643 506
13 Netherlands 517773 589930 14
14 Italy 276809 515459 86
15 Thailand 72183 417389 478
16 Spain 195907 403091 106
17 United Kingdom 400244 354389 -11
18 South Africa 123001 350425 185
19 Sweden 267685 299170 12
20 United Arab Emirates 63316 290221 358
Top 20 Total 22789285 32744630 44
Source United States Department of Commerce Bureau of the Census Foreign Trade Division IHS Global Trade Atlas Database Revised Statistics for 2011 - 2017 2017 data is annualized based on YTD 2017 through October
As shown in Appendix K antidumping and countervailing duty actions can
address specific instances of unfairly traded steel products However given the large
number of countries from which the United States imports steel and the myriad of
different products involved it could take years to identify and investigate every
instance of unfairly traded steel or attempts to transship or evade remedial duties
28
Moreover US industry has already spent hundreds of millions of dollars in
recent years on ADCVD cases with seemingly no end in sight to their outlays
Smaller steel manufacturers are financially unable to afford these type of cases or
are hesitant to file cases in light of possible market entry retaliation in foreign
markets for finished steel products42
2 High Import Penetration
In contrast to the situation in the 2001 Report where imports of semi-finished
steel represented approximately 7 percent of domestic consumption 43 imports of
finished steel products (ie not including semi-finished steel) currently represent
over 25 percent of US consumption (see Figure 3)44 If imports of semi-finished
products are included the import penetration level has been above 30 percent for the
first ten months of 2017 Import penetration of steel pipe and tube was 74 percent
Figure 3 US Import Penetration of Finished Steel Products (Excludes Semi-Finished)
Source American Iron and Steel Institute YTD data source is through October 2016 and October 2017 Excludes semi-finished imports
42 ongress has specifically expressed concern about the need to maintain small suppliers and the potential adverse impact on military readiness caused by the loss of small suppliers See 50 US sect 4502(a)(8)
43 2001 Report at 31
44 ISIs statistical yearbook reports that about 8 percent of US shipments are made of imported substrate
29
3 High Import to Export Ratio
US imports of steel products which displace demand for domestic steel and
lower production at US plants reached nearly four times the level of exports of
US steel products in 2016 (see Figure 4) The expansion of steel production
capacity outside of the United States in the last decade (Asia the Middle East and
South America) much of it subsidized by national governments continues to
depress world steel prices while making it increasingly difficult for US companies
to export their steel products While US steel producers saw a mild increase in steel
exports from 2005 to 2013 more recently sales to foreign customers have been
declining Exports fell to nine million metric tons in 2016 from a 20-year high of 12
million metric tons annually from 2011 to 2013 Most US steel exports are auto
industry related and are sent to Canada (50 percent by weight in 2016) and Mexico
(39 percent by weight in 2016) Flat products represent the majority of these exports
ndash 57 percent of US steel exports for Canada and 64 percent of steel exports for
North Europe Domestic Hot Rolled Coil 65954 61441 56841 42019 45529 60490
South Europe Domestic Steel Rebar 63659 59834 55166 39411 42768 56853
000
10000
20000
30000
40000
50000
60000
70000
80000
USD
MT
Source Bloomberg Platts Antaike 2017 prices are through December 20 2017
Figure 6 Regional Comparison of Hot Rolled Coil Bench Mark Prices (USDMT)
In 2015 steel prices fell globally As the OECD noted the combined effect
of weakening global steel demand including in the United States growing exports
in many economies and decreases in steelmaking costs led to a very sharp decline
32
in steel prices in 2015 Notwithstanding these effects prices for steel in the US
remained substantially higher than in any other area However relative to prices
between 2010 and 2013 prices are still relatively depressed
Global excess steel production weakens the pricing power of US steel
producers US steel producersrsquo costs are higher than the costs for producers in other
regions due to higher taxes healthcare environmental and other regulatory
expenses Higher US steel prices incentivize importing lower-cost foreign steel
Moreover excess production and lower prices in regions proximate to state
subsidized enterprises displace purchases from market based steel exporters and add
pressure on those market based suppliers to export to the US The effect of global
excess steel production on US steel prices and import levels is discussed in greater
detail in Appendix L
5 Steel Mill Closures
US steel mill closures continue eroding overall US steel mill capacity and
employment Many US steel mills have been driven out of business due to
declining steel prices global overcapacity and unfairly traded steel Since 2000 the
United States has lost over 25 percent of its basic oxygen furnace facilities with the
closure of six facilities RG Steel in Sparrows Point Maryland RG Steel in
Steubenville Ohio RG Steel in Warren Ohio ArcelorMittal in East Chicago
Indiana ArcelorMittal in Weirton West Virginia and US Steel in Fairfield
Alabama
In addition four electric arc furnace steel facilities have closed Evraz in
Claymont Delaware ArcelorMittal in Georgetown South Carolina Gerdau in Sand
Springs Oklahoma and Republic Steel in Lorain Ohio Most recently
ArcelorMittal has announced the closure of its plate rolling mill in Conshohocken
Pennsylvania because of sagging commercial sales attributed to surging imports of
low-cost steel product and flat defense demand45
The closures of these facilities have had a significant impact on the US
industrial workforce and local economies RG Steel suffered three closures
45 owden M rcelor Mittal to Shut P Plate Mill merican Metal market September 18 2017
33
Sparrows Point Maryland Steubenville Ohio and Warren Ohio After filing for
bankruptcy in 2012 more than 2000 employees were displaced in Maryland alone
and another 2000 in the Midwest The company cited weak demand in the steel
industry as well as lack of financing as key contributors to the closure46
Closures of smaller steel mills have had equally devastating impacts on
employment Gerdau Sand Springs in Oklahoma lost 300 employees after closing
in 2009 because of a long-term drop in demand for steel47 Sand Springs was the
last remaining steel plant in Oklahoma and had been in production since the 1920s
In 2013 at least 345 employees were laid off in response to the closure of the
Claymont steel mill in Delaware The Governor of Delaware Jack Markell
attributed the financial difficulties of the facility to ldquosubdued market demand and the
high volume of importsrdquo48
Similar difficulties were cited by the ArcelorMittalrsquos Georgetown South
Carolina facility and US Steelrsquos location in Fairfield Alabama both of which
closed in 2015 Layoffs for these two corporations totaled 226 and more than 1100
employees respectively Both companies attributed the layoffs to financial losses
and ultimately to facility closures due to the rise in competition from inexpensive
imports49
Even temporary idling of steel plants threatens the US steel industry as there
are significant financial costs with re-opening a steel mill Multiple US facilities
remain idled there are four idled basic oxygen furnace facilities two each in
Kentucky and Illinois representing almost one third of the remaining basic oxygen
46 usiness Journal Unforeseen onditions loses Warren Steel Holdings January 12 2016 httpbusinessjournaldailycomutilities-cut-to-warren-steel-holdings- altimore rew Six reasons why the Sparrows Point steel mill collapsed May 25 2012 httpsbaltimorebrewcom20120525six-reasons-why-the-sparrows-point-steel-mill-collapsed
47 News on 6 Sand Springs Steel Plant May lose June 9 2009 httpwwwnewson6comstory10500785sand-springs-steel-plant-may-close
48 usiness Insider Shutdown of Russian Steel Mill in Delaware ould Send a Message bout US Trade October 17 2013 httpwwwbusinessinsidercomevraz-closes-claymont-steel-2013-10
49 Lcom US Steel lays off 200 more workers in Fairfield March 18 2016 httpwwwalcombusinessindexssf201603us_steel_lays_off_200_more_worhtml
34
furnace facilities in United States50 In addition there are idled pipe and tube mills
in Texas Ohio and Alabama Once production is halted at these facilities it is not
always possible to bring back the highly skilled workforce needed to operate them
When steel mill restarts do occur additional costs are often incurred for specialized
worker training and production ramp-up
In addition when a steel mill closes at a given location the workers find other
occupations move to other steel mills or remain indefinitely unemployed After a
significant period of unemployment much of the specialized skill required by steel
mill workers is forgotten Furthermore it is typically not easy to find and recruit
displaced workers who may live hundreds or thousands of miles away
6 Declining Employment Trend Since 1998
US steel industry employment has declined 35 percent (216400 in 1998 to
139800 in January 2016 - December 2016) including 14100 lost jobs between 2015
and 2016 While employment numbers increased slightly in certain years the trend
is dramatically downward (see Figure 7) Layoffs defer formal plant closings but
are an indication of financial distress Layoffs in the last two years have been
particularly acute in steel producers with pipe and tubular facilities In addition to
layoffs there are permanent closures and bankruptcies in the industry 51
The loss of skilled workers is especially detrimental to the long-term health
and competitiveness of the industry The unstable and declining employment
outlook for the industry also dissuades younger workers from wanting to participate
in the future US steel industry The inability to rapidly add skilled workers to the
industry negatively affects current manufacturing capabilities This is especially
problematic in the event of a major production surge or mobilization
Source Bureau of Labor Statistics using the annual average of seasonally adjusted employees NAICS Codes 3311 and 3312 updated 11222017
Figure 7 Combined Steel Industry Employment (Yearly Average)
7 Trade Actions ndash Antidumping and Countervailing Duties
The number of US antidumping and countervailing duty measures in effect
illustrates the scope of the problem confronting the US steel industry In 1998 at
the height of that periods steel crisis there were just over 100 antidumping and
countervailing duty cases against finished steel products52 Today there are 164
antidumping and countervailing duty orders in effect for steel with another 20 steel
investigations currently ongoing and another waiting to take effect through
publication in the Federal Register (see Appendix K for a full listing of Steel
Antidumping and Countervailing Duty Orders in Effect) This represents a 60
percent increase in cases since the last time the Department investigated steel in
2001
8 Loss of Domestic Opportunities to Bidders Using Imported Steel
Despite efforts to level the playing field through ADCVD orders there are
numerous examples of US steel producers being unable to fairly compete with
foreign suppliers including the lack of ability to bid on some critical US
infrastructure projects Due to unfair competition particularly from foreign state-
52 Global Steel Trade Structural Problems and Future Solutions- Department of ommerce- July 2000
36
owned enterprises US steel producers have lost out on US business opportunities
Some examples include Chinese companies providing steel for the eastern span of
the San Francisco-Oakland Bay Bridge as well as the Alexander Hamilton Bridge
over the Harlem River in New York53
The Alliance for American Manufacturingrsquos statement before the
Congressional Steel Caucus (March 2017) identified three other recent infrastructure
projects in New York that have used or will use heavily subsidized or possibly
dumped foreign steel the Verrazano-Narrows Bridge LaGuardia Airport and the
Holland Tunnel Two major US cities ndash Boston and Chicago ndash have contracted
with Chinese companies to build new subway cars primarily constructed with
imported steel for their respective transportation systems54
9 Financial Distress
Rising levels of imports of steel continue to weaken the US steel industryrsquos
financial health Years of running on low-profit margins or at a loss have weakened
an industry that continues to face an ever-increasing wave of steel imports The US
industry as a whole has operated on average with negative net income from 2009-
2016 Net income for US-owned steel companies has averaged only $162 million
annually since 2010 challenging the financial viability of this vital industry (see
Figure 8)
53 New York Times ridge omes to San Francisco With a Made-in-hina Label June 25 2011 httpwwwnytimescom20110626businessglobal26bridgehtml
54 Reuters hinas RR lands $13 billion hina rail car project March 10 2016 httpwwwreuterscomarticleus-crrc-usa-idUSKN0W17I
37
The Stern School of Business at New York University calculates that US steel
industry participants in the last five years experienced negative net income of 178
percent Compounded growth in revenue for the past five years in the steel industry
has been a negative 7 percent55 The loss of revenue has caused US steel
manufacturers both large and small to defer or eliminate production facility capital
investments and funding for research and development Even though there was a
slight uptick in net income for the first quarter in 2017 over the fourth quarter of
2016 margins remain poor compared to historic levels
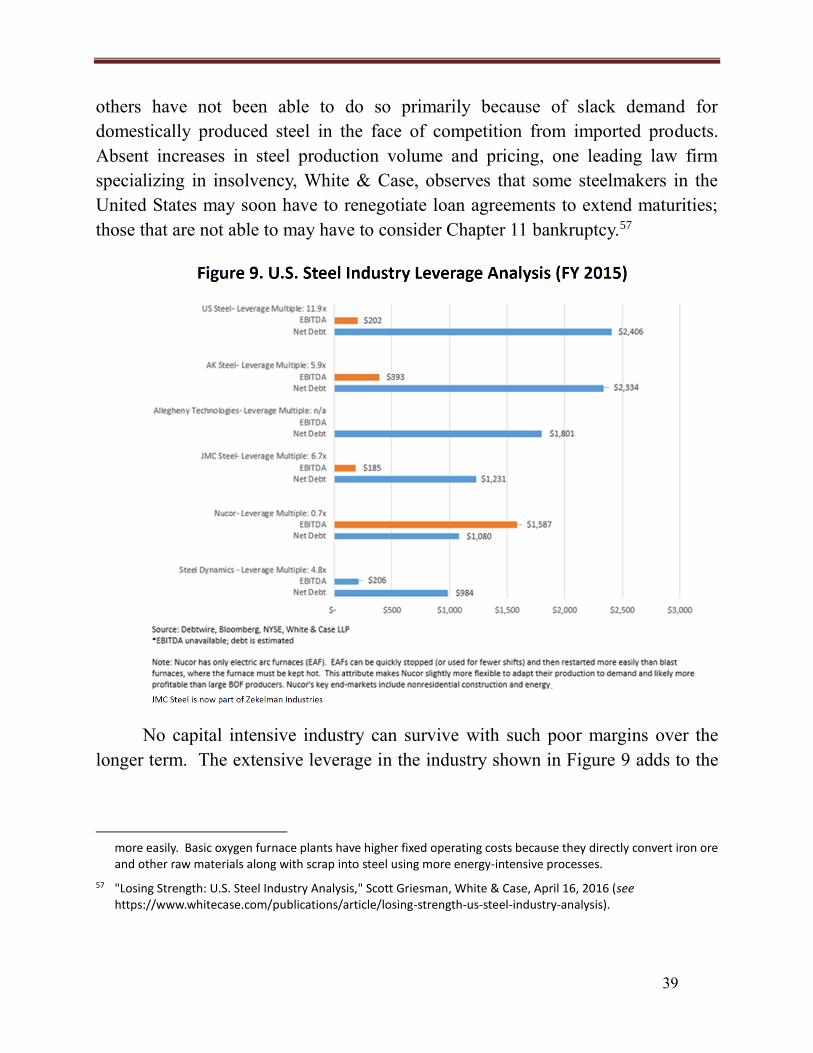
Not only have earnings before interest taxes depreciation and amortization
(EBITDA) been shallow for steel producers in the United States many of them are
burdened with high levels of debt as much as 119 times of earnings for one major
producer (see Figure 9)56 While some companies are starting to pay down debt
55 Historical (ompounded nnual) Growth Rates by Sector swath Damodaran New York University Stern School
of usiness January 2017 (see httppagessternnyuedu~adamodarNew_Home_Pagedatafile histgrhtml) 56 Nucor operates mini-mills that use electric arc furnaces to produce high demand steel products primarily with recycled steel scrap From a financial perspective this business model allows Nucor to be highly price competitive but the company produces a narrower range of flat steel products than integrated steel mills The
mini-mills can weather bad economic times because they have lower energy costs and can regulate production
38
others have not been able to do so primarily because of slack demand for
domestically produced steel in the face of competition from imported products
Absent increases in steel production volume and pricing one leading law firm
specializing in insolvency White amp Case observes that some steelmakers in the
United States may soon have to renegotiate loan agreements to extend maturities
those that are not able to may have to consider Chapter 11 bankruptcy57
No capital intensive industry can survive with such poor margins over the
longer term The extensive leverage in the industry shown in Figure 9 adds to the
more easily asic oxygen furnace plants have higher fixed operating costs because they directly convert iron ore and other raw materials along with scrap into steel using more energy-intensive processes
57 Losing Strength US Steel Industry nalysis Scott Griesman White ase pril 16 2016 (see httpswwwwhitecasecompublicationsarticlelosing-strength-us-steel-industry-analysis)
39
likelihood of further closures if the present high level of imports continues to force
US steel mills to operate well below profitable capacity utilization rates
10 Capital Expenditures
The ability of US manufacturers of iron and steel products to fund capital
expenditures for new production plants as well as facility modernization and
advanced manufacturing equipment has been limited by falling revenue and reduced
profits As shown in Figure 10 annual capital expenditures for companies making
iron and steel ingot bars rods plate and other semi-finished products wavered from
$57 billion to $51 billion for 2010-2012 before ramping to $71 billion in 2013
Figure 10 Annual Capital Expenditures
Iron Steel and Ferroalloys Steel NAICS Codes 3311 and 3312 Combined
Millions of Current Dollars
Annual Capital Expenditures Survey 2010 2011 2012 2013 2014 2015
A Structures [New amp Used Structures Combined] 1026 1322 1564 1157 724 580
B Equipment [New amp Used Equipment Combined] 4634 4572 3592 5954 3139 2531
C Total Capital Expenditures 5661 5894 5157 7111 3863 3110
D (Unweighted) Payroll of Reporters Total Payroll of Firms Classified in Industry group
86 84 80 61 86 84
Source US Census Bureau Annual Capital Expenditures Survey wwwcensusgovprograms-surveysaceshtml
Confronted with receding orders for products and declines in income in 2013
iron and steel companies operating production facilities in the United States started
curtailing capital investments Total capital spending dropped to $387 billion in
2014 and slid further to $311 billion in 2015 ndash 32 percent below 2010 levels of $566
billion
The decline in capital expenditures reflected similar drops in net sales which
plummeted from $1296 billion in 2014 to $102 billion in 2015 Income after taxes
40
for US iron and steel manufacturers fell from $248 billion in the same two-year
period to a massive loss of $35 billion in 2015
C Displacement of Domestic Steel by Excessive Quantities of Imports has the
Serious Effect of Weakening Our Internal Economy
1 Domestic Steel Production Capacity is Stagnant and Concentrated
According to the OECD US steel production capacity has remained stagnant
at an average of approximately 1143 million metric tons for more than a decade
from 2006-2016 (see Figure 11) For 2016 the rated maximum capacity was 113
million metric tons for existing basic oxygen furnace and electric arc furnace
Source Organization for Economic Cooperation and Development (OECD) 2017 capacity is a forecast
41
42
The present situation with respect to basic oxygen furnace production is
significantly worse than the situation assessed by the Department in the 2001 Report
As shown in Figure 13 below the number of basic oxygen furnace facilities and units
has declined precipitously since 1995 In 2000 there were 105 companies that
produced raw steel at 144 locations59 while today there are only 38 companies
producing steel at 93 locations a 64 percent and 36 percent reduction respectively
Most importantly in 2000 thirteen companies ldquooperated integrated steel mills
with an average of 35 blast furnaces in continuous operation during the yearrdquo60 while
today there are only three companies operating 13 basic oxygen furnaces These are
77 percent and 60 percent reductions respectively As a result today only 26 percent
of domestic steel is produced from raw materials in the United States as compared
to 53 percent in 2000
As noted earlier since 2000 there has been over a 25 percent reduction in the
number of basic oxygen furnaces operating in the United States and 33 percent of
the remaining basic oxygen furnaces are currently idled In the Secretaryrsquos view a
further reduction in basic oxygen furnace capacity which is especially important to
the ability of domestic industry to meet national security needs is inevitable if the
present imports continue or increase
This would be a serious ldquoweakening of our internal
economyrdquo and place the United States in a position where it is unable to be certain
59 2001 Report at 21
60 Id
43
it could meet demands for national defense and critical industries in a national 61emergency
Figure 13 Basic Oxygen and Electric Arc Facilities and Units Located in the United States 1975 - 2016
Year asic Oxygen Furnace Facilities
asic Oxygen Furnace Units
Electric rc Furnace Facilities
Electric rc Furnace Units
1975 38 90 -- --
1980 33 78 -- --
1985 27 66 -- --
1990 24 61 127 246
1995 22 56 116 218
2000 19 50 122 174
2005 17 46 115 169
2010 16 44 108 164
2015 13 31 98 154
2016 13 31 98 154 Source US Department of CommerceBIS American Iron and Steel Institute Association for Iron amp Steel Technology Steel Manufacturers Association August 2017 Estimated
Basic Oxygen Furnace Basic Oxygen Furnaces (BOF) are the dominant steelmaking technology globally accounting for 74 of the worlds total output of crude steel in 2016 OF share of production in the US was 33 in 2016 and has been slowly declining due primarily to the advent of the Greenfield electric arc furnace (EF) flat-rolled mills The primary raw materials for the BOF are liquid hot metal (iron) from the blast furnace and steel scrap [1] These are charged into the BOF vessel Oxygen (gt995 pure) is blown into the OF at supersonic velocities It oxidizes the carbon and silicon contained in the hot metal liberating great quantities of heat which melts the scrap Source Steelorg
Electric Arc Furnace The Electric Arc Furnace (EAF) operates as a batch melting process producing batches of molten steel known heats The EF process uses steel scrap and iron units melting them using electricity to make new steel EF output accounted for 66 of US steel production in 2016 Source Steelorg
[1 The last Furnace chemically reduces and physically converts iron oxides into liquid iron called hot metal The blast furnace is a huge steel stack lined with refractory brick where iron ore coke and limestone are dumped into the top and preheated air is blown into the bottom The raw materials require six to eight hours to descend to the bottom of the furnace where they become the final product of liquid slag and liquid iron Source Steelorg
In contrast to the situation in the United States the leading global producers
of steel (Brazil South Korea Japan Russia Germany and especially China)
primarily rely on basic oxygen furnace capacity rather than electric arc furnace
capacity (see Figure 14) Each of these economic competitors to the United States
possess critical research development and production capabilities that the United
61 See infra sections 4 and 5 for a further discussion of the inability to meet surge requirements in an emergency
44
rsquo
States is in danger of losing if imports continue to force US steel producers to
operate at uneconomic capacity utilization levels
A further reduction in domestic basic oxygen furnace capacity would put the
United States at serious risk of becoming dependent on foreign steel to support its
critical industries and defense needs Allowing this decline to continue represents a
ldquoweakening of our internal economy that may impair national securityrdquo which the
Congress has directed the Secretary to advise the President of under the Section 232
See 19 USC sect 1862(d)
Figure 14 The Top 20 Countries Exporting to the US ndash BOF vs EAF Capacity
Rank Top Import Sources in 2016 in Tonnage
Terms
2015 OF Share
2015 EF Share
2015 Other Share
pprox ountry s verage apacity Utilization in 2016
(OED) World 7420 2520 050 67
1 Canada 5380 4620 62
2 Brazil 7820 2020 57
3 South Korea 6960 3040 80
4 Mexico 2970 7030 75
5 Turkey 3500 6500 65
6 Japan 7710 2290 80
7 Russia 6630 3050 310 76
8 Germany 7040 2960 72 (EU 28)
9 Taiwan 6230 3770 75
10 Vietnam 2500 5990 1520 32
11 China 9390 610 69
12 Netherlands 9860 150 72 (EU 28)
13 Italy 2130 7820 72 (EU 28)
14 United Kingdom 8300 1700 72 (EU 28)
15 France 6560 3440 72 (EU 28)
16 India 4290 5710 75
17 Australia 7760 2240 63
18 Spain 3170 6830 72 (EU 28)
19 Sweden 6610 3390 72 (EU 28)
20 South Africa 5650 4350 585 Source World Steel- Production Share Figures for 2015 US ensus ureau (ccessed Via HIS) ndash Import Growth Rates OED 2017 Q2 Market ssessment ndash pproximate apacity Utilization
This is not a hypothetical situation The Department of Defense already finds
itself without domestic suppliers for some particular types of steel used in defense
45
products including tire rod steel used in military vehicles and trucks62 While the
United States has many allies that produce steel relying on foreign owned facilities
located outside the United States introduces significant risk and potential delay for
the development of new steel technologies and production of needed steel products
particularly in times of emergency The Secretary notes that the authority for the
Department of Defense to place its order ahead of commercial orders on a mandatory
basis does not extend to foreign-owned facilities outside the United States63
In the case of critical infrastructure the United States is down to only one
remaining producer of electrical steel in the United States (AK Steel ndash which is
highly leveraged) Electrical steel is necessary for power distribution transformers
for all types of energy ndash including solar nuclear wind coal and natural gas ndash across
the country If domestic electrical steel production as well as transformer and
generator production is not maintained in the US the US will become entirely
dependent on foreign producers to supply these critical materials and products64
Without an assured domestic supply of these products the United States cannot be
certain that it can effectively respond to large power disruptions affecting civilian
populations critical infrastructure and US defense industrial production
capabilities in a timely manner
2 Production is Well Below Demand
Demand for steel products in the United States (see Figure 15) increased from
1001 million metric tons in 2011 to 1175 million metric tons in 2014 then declined
to 998 million metric tons in 2016 Demand in 2017 is projected to rebound to
1077 million metric tons During the 2011 to 2016 period US production of steel
products dropped from 864 million metric tons in 2011 to 786 million metric tons
in 2016 with a four percent increase expected in 2017
62 Letter from Defense Logistics gency olumbus OH to ISOTE ugust 1 2017
63 See Defense Priorities and llocations System Program (DPS) wwwdcmamilDPS
64 United States ongress ongressional Steel aucus Statement of Roger Newport EO K Steel orporation (on behalf of the merican Iron and Steel Institute) March 29 2017
46
For the six-year period US domestic steel production supplied only 70
percent of the average demand even though available US domestic steel production
capacity during that period could have on average supplied up to 100 percent of
demand (US steel producers would be running at 92 percent capacity utilization for
this period) with approximately 13 million metric tons of additional capacity
remaining
Figure 15 US Steel Market Snapshot (millions of metric tons)
2011 2012 2013 2014 2015 2016 2017 YTD
2017 nnualized
Total Demand for Steel in US (Production + Imports - Exports)
US Annual Production (Liquid) 864 887 869 882 788 786 615 819
Sources United States Department of ommerce ureau of the ensus merican Iron and Steel Institute alculations based on industry and trade data
3 Utilization Rates are Well Below Economically Viable Levels
Overall steel mill production capacity utilization has declined from 87 percent
in 1998 to 814 percent in 2008 to 694 percent in 2016 (see Figure 16) For the
most recent six-year period (2011- 2016) the average utilization rate was 74 percent
Industry analysts note that utilization of 80 percent or more is typically
necessary for sustained profitability among other factors65 For most capital and
energy-intensive US steel producers capacity levels of 80 percent or higher are
required to maintain facilities carry out periodic modernization service company
debt and fund research and development
65 Market Realist Why steel investors are mindful of capacity utilization rates October 2 2014 httpmarketrealistcom201410investors-mindful-capacity-utilization-rate See also httpmarketrealistcom201509upstream-exposure-impact-steel-companies
47
When steel factory utilization falls costs per unit of steel product rises
reducing profit margins and product pricing flexibility Higher capacity utilization
usually results in lower per-unit product costs and higher overall profit66 Over 80
percent is a healthy capacity utilization rate and a rate at which most companies
would be profitable
The US steel industry uses 80 percent as a benchmark for minimum
operational efficiency Moreover the steel industry is capable of reaching and
sustaining 80 percent capacity utilization or higher During the 2002-2008 period
US steel companies operated at an average 874 percent level 67
These industry assessments are consistent with a 1983 report on ldquoCritical
Materials Requirements in the US Steel Industryrdquo in which the Department
66 Houston hronical apacity Utilization and Effects on Product and Profit httpsmallbusinesschroncomcapacity-utilization-effects-product-profit-67046html- steel industry sources
67 httpmarketrealistcom201509upstream-exposure-impact-steel-companieshtml (Its important to note how changes in capacity utilization rates impact a companys earnings For example we see a big jump in earnings when utilization rates improve from 80 percent to 85 percent However incremental benefits are lower when utilization rates increase from 90 percent to 95 percent )
48
explained that ldquo[c]apability utilization or capacity use which in effect describes the
efficiency of an industrys use of capital is a prime determinant of profitability
Domestic steel producers were operating at about 55 percent capability for the first
half of 1982 The comparable rate for the first half of 1981 was 85 percent This
current rate is probably well below a breakeven point for most producers whereas
1981 was profitable for nearly all producersrdquo68
4 Declining Steel Production Facilities Limits Capacity Available for a
National Emergency
The number of steel production facilities located in the US continues to
decline As shown earlier in Figure 13 from 1975 to 2016 the number of basic
oxygen furnace facilities decreased from 38 to 13 Similarly from 1990 to 2016
the number of electric arc furnace facilities decreased from 127 to 98
Due to this decline in facilities domestic steel producers have a shrinking
ability to meet national security production requirements in a national emergency
The US Department of Commerce Census Bureau regularly surveys plant capacity
and has found that steel producers are quickly shedding production capacity that
could be used in a national emergency The Census Bureau defines national
emergency production as the ldquogreatest level of production an establishment can
expect to sustain for one year or more under national emergency conditionsrdquo69 From
2011 to 2017 steel producers increased the utilization of the surge capacity they
would have during a national emergency from 542 percent to 682 percent (see
Figure 17) As steel producers use more of this emergency capacity there is an
increasingly limited ability to ramp up steel production to meet national security
needs during a national emergency
68 Department of ommerce ritical Materials Requirements in the US Steel Industry March 1983 at 16-17
69 US Dept of ommerce ensus ureau Survey of Plant apacity 2011-2017
49
0
10
20
30
40
50
60
70
80
2011 2012 2013 2014 2015 2016 2017
Figure 17 Steel Industry Utilization of Emergency Capacity (2011-2017 Quarter 1)
Source US Department of ommerce ensus ureau Survey of Plant apacity
Percent
The ability to increase steel production during a national emergency
continues to diminish as the number of steel production facilities continues to
decline If the US requires a similar increase in steel production as it did during
previous national emergencies domestic steel production capacity may be
insufficient to satisfy national security needs If a national emergency were to
occur at present utilization levels domestic steel producers would be able to
increase production by 146 percent
For comparison from 1938 through 1946 the US increased the production
of pig iron and ferro-alloys by 217 percent and increased the production of steel
ingots and castings by 210 percent to meet the demands of fighting a global war 70
From 1960 through 1973 during the Vietnam era the US increased steel
production by 152 percent 71 Should the US once again experience a conflict on
the scale of the Vietnam War steel production capacity may be slightly insufficient
70 US Dept of ommerce ensus ureau Statistical bstract of the United States 1948 Page 876
71 US Dept of ommerce ensus ureau Statistical bstract of the United States 1978 Page 830
50
to meet national security needs But if the US were to experience a conflict
requiring the production increase seen during the Second World War the existing
domestic steel production capacity would be unable to meet national security
requirements
Increasing steel production capacity once a large-scale national emergency
has arisen would take a significant amount of time According to the American Iron
and Steel Institute the replacement of a basic oxygen furnace facility takes more
than a year to complete Therefore the lack of spare domestic steel production
capacity and the possible inability to sufficiently increase production during a
national emergency may impair the national security of the United States
D Global Excess Steel Capacity is a Circumstance that Contributes to the
Weakening of the Domestic Economy
1 Free markets globally are adversely affected by substantial chronic
global excess steel production led by China
Numerous studies reports and investigations have documented the global excess
steel capacity with China having the largest installed capability (see Figure
18)727374 OECD analyses show that the worldrsquos nominal crude steelmaking capacity
reached about 24 billion metric tons in 2016 an increase of 127 percent compared
to the 2000 level Most of the capacity expansion was planned for construction and
manufacturing activities and to help build the infrastructure necessary for economic
development ndash most in non-OECD countries Furthermore the OECD reports that
while steel capacity increased at a steady rate world steel demand contracted sharply
in the aftermath of the global economic and financial crisis of 2008 Global demand
for steel recovered slowly in the years following 2008 However since 2013 global
steel demand has flattened thereby widening the capacitydemand gap By 2015 the
gap reached over 700 million metric tons
72 run L (2016) Overcapacity in Steel Chinarsquos Role in a Global Problem Washington D lliance for merican Manufacturing httpaamwebs3amazonawscomuploadsresourcesOvercapacityReport2016_R3pdf
73 Price Weld El-Sabaawi L Teslik (2016) apacity Runs Riot Washington D Wiley Rein LLP
74 OED Reports (2016) httpwwwoecdorgindustryind82nd-session-of-the-steel-committeehtm
51
The vast size of the capacitydemand gap means that steel demand alone
cannot increase enough to balance the global overcapacity problem which is
particularly prevalent in China Chinese excess capacity estimated at more than 300
million metric tons dwarfs total US production capacity (see Figure 19)75
The effect of global overcapacity and excess steel production on US steel
prices and import levels is discussed in greater detail in Appendix L While US
steel production capacity has remained flat since 2001 other steel producing nations
have increased their production capacity with China alone able to produce as much
steel as the rest of the world combined
75 OED High Level Meeting Excess apacity and Structural djustment in the Steel Sector pril 2016 httpwwwoecdorgstiindackground20document20No202_FINL_Meetingpdf
52
0
500
1000
1500
2000
2500 M
illio
ns
of
Met
ric
Ton
s
Figure 19 Steelmaking Capacity
World Total China United States
Source OECD
2009 2010 2011 2012 2013 2014 2015 2016 2017
Several countries (India Iran and Indonesia) in addition to China continue to
add production capacity despite slack global demand According to the OECD Steel
Committee Chairrsquos statement from March 2017 ldquoNew data suggest that nearly 40
million metric tons of gross capacity additions are currently underway and could
come on stream during the three-year period of 2017-19 while an additional 536
million metric tons of capacity additions are in the planning stages for possible start-
up during the same time periodrdquo76 This additional global steel capacity coming
online represents over 80 percent of existing US steelmaking production capacity
demonstrating that the import challenge to US industry is continuing to grow
2 Increasing global excess steel capacity will further weaken the internal
economy as US steel producers will face increasing import competition
These additions to worldwide steelmaking capacity will only exacerbate the
situation because they will further lower global operating utilization rates including
in the United States Growth in foreign government-subsidized steel production is
progressively weakening the financial health of the US steel industry as other steel
76 OED 82nd Session of the OED Steel ommittee ndash hairs Statement March 2017 httpwwwoecdorgstiind82-oecd-steel-chair-statementhtm
53
producing countries export more steel to the US to in part to offset the loss of
regional markets to Chinese steel (see Appendix L)
The US share of global production continues to steadily decline In the year
2000 when President Clinton signed into a law a statute granting China permanent
normal trade relations status77 the US share of global steel production stood at 12
percent78 Since that point in time the US share of global steel production continued
an inexorable decline as other countries and especially China began to increase
production The US share of global steel production fell to 8 percent in 200579 5
percent in 200980 and 48 percent in 201581 In contrast China commanded a 497
percent share of global steel production in 201582
If even half of the planned additional global capacity identified by the OECD
Steel Committee is built and the related new production finds its way into the US
it will drive the operating rate of US steel mills to less than 50 percent of capacity
This will cause a substantial and unsustainable negative cash situation that will
ultimately result in multiple corporate bankruptcies due to heavy debt loads and
related declines in steel production capacity and employment levels
77 Public Law 106-286 n act to authorize extension of nondiscriminatory treatment (normal trade relations treatment) to the Peoples Republic of hina and to establish a framework for relations between the United States and the Peoples Republic of hina October 10 2000 httpswwwgpogovfdsyspkgPLW-106publ286
78 US Dept of ommerce ensus ureau Statistical bstract of the United States 2012 Page 574
79 Id
80 Id
81 Steel Statistical Yearbook 2016 World Steel ssociation httpswwwworldsteelorgendamjcr37ad1117-fefc-4df3-b84f-6295478ae460Steel+Statistical+Yearbook+2016pdf
82 Steel Statistical Yearbook 2017 World Steel ssociation httpswwwworldsteelorgendamjcr3e275c73-6f11-4e7f-a5d8-23d9bc5c508fSteel+Statistical+Yearbook+2017pdf
54
VI CONCLUSION
The Secretary has determined that the displacement of domestic steel by
excessive imports and the consequent adverse impact of those quantities of steel
imports on the economic welfare of the domestic steel industry along with the
circumstance of global excess capacity in steel are ldquoweakening our internal
economyrdquo and therefore ldquothreaten to impairrdquo the national security as defined in
Section 232
The continued rising levels of imports of foreign steel threaten to impair the
national security by placing the US steel industry at substantial risk of displacing
the basic oxygen furnace and other steelmaking capacity and the related supply
chain needed to produce steel for critical infrastructure and national defense
In considering ldquothe impact of foreign competition on the economic welfare of
individual domestic [steel] industriesrdquo and other factors Congress expressly outlined
in Section 232 the Secretary has determined that the continued decline and
concentration in steel production capacity is ldquoweakening of our internal economy
and may impair national securityrdquo See 19 USC sect 1862(d)
Global excess steel capacity is a circumstance that contributes to the
ldquoweakening of our internal economyrdquo that ldquothreaten[s] to impairrdquo the national
security as defined in Section 232 Free markets globally are adversely affected by
substantial chronic global excess steel production led by China While US steel
production capacity has remained flat since 2001 other steel producing nations have
increased their production capacity with China alone able to produce as much steel
as the rest of the world combined This overhang of excess capacity means that US
steel producers for the foreseeable future will face increasing competition from
imported steel as other countries export more steel to the United States to bolster
their own economic objectives
Since defense and critical infrastructure requirements alone are not sufficient
to support a robust steel industry US steel producers must be financially viable and
competitive in the commercial market to be available to produce the needed steel
output in a timely and cost efficient manner In fact it is the ability to quickly shift
55
production capacity used for commercial products to defense and critical
infrastructure production that provides the United States a surge capability that is
vital to national security especially in an unexpected or extended conflict or national
emergency It is that capability which is now at serious risk as imports continue to
take business away from domestic producers these producers are in danger of falling
below minimum viable scale and are at risk of having to exit the market and
substantially close down production capacity often permanently
Steel producers in the United States are facing widespread harm from
mounting imports Growing global steel capacity flat or declining world demand
the openness of the US steel market and the price differential between US market
prices and global market prices (often caused by foreign government steel
intervention) ensures that the US will remain an attractive market for foreign steel
absent quotas or tariffs Excessive imports of steel now consistently above 30
percent of domestic demand have displaced domestic steel production the related
skilled workforce and threaten the ability of this critical industry to maintain
economic viability
A US steel industry that is not financially viable to invest in the latest
technologies facilities and long-term research and development nor retain skilled
workers while attracting a next-generation workforce will be unable to meet the
current and projected needs of the US military and critical infrastructure sectors
Moreover the market environment for US steel producers has deteriorated
dramatically since the 2001 Report when the Department concluded that imports of
iron ore and semi-finished steel do not ldquofundamentally threatenrdquo the ability of US
industry to meet national security needs83
The Departmentrsquos investigation indicates that the domestic steel industry has
declined to a point where further closures and consolidation of basic oxygen furnace
facilities represents a ldquoweakening of our internal economyrdquo as defined in Section
232 The more than 50 percent reduction in the number of basic oxygen furnace
83 2001 Report at 28 ndash 37 s noted supra note 16 the 2001 Report added the qualifier fundamentally which is not found in the statutory text The Secretary in this report uses the statutory standard of threatens to impair without such qualification
56
facilities ndash either through closures or idling of facilities due to import competition ndash
increases the chance of further closures that place the United States at serious risk
of being unable to increase production to the levels needed in past national
emergencies The displacement of domestic product by excessive imports is having
the serious effect of causing the domestic industry to operate at unsustainable levels
reducing employment diminishing research and development inhibiting capital
expenditures and causing a loss of vital skills and know-how The present capacity
operating rates for those remaining plants continue to be below those needed for
financial sustainability These conditions have been further exacerbated by the 22
percent surge in imports thus far in 2017 compared with 2016 Imports are now
consistently above 30 percent of US domestic demand
It is evident that the US steel industry is being substantially impacted by the
current levels of imported steel The displacement of domestic steel by imports has
the serious effect of placing the United States at risk of being unable meet national
security requirements The Secretary has determined that the ldquodisplacement of
domestic [steel] products by excessive importsrdquo of steel is having the ldquoserious effectrdquo
of causing the ldquoweakening of our internal economyrdquo See 19 USC sect 1862(d)
Therefore the Secretary recommends that the President take corrective action
pursuant to the authority granted by Section 232 See 19 USC sect 1862(c)
57
VII RECOMMENDATION
Prior significant actions to address steel imports (quotas andor tariffs) were
taken under various statutory authorities by President George W Bush President
William J Clinton (three times) President George H W Bush President Ronald W
Reagan (three times) President James E Carter (twice) and President Richard M
Nixon all at lower levels of import penetration than the present level which is above
30 percent
Due to the threat of steel imports to the national security as defined in Section
232 the Secretary recommends that the President take immediate action by adjusting
the level of imports through quotas or tariffs on steel imported into the United States
as well as direct additional actions to keep the US steel industry financially viable
and able to meet US national security needs The quota or tariff imposed should be
sufficient after accounting for any exclusions to enable the US steel producers to
be able to operate at about an 80 percent or better of the industryrsquos capacity
utilization rate based on available capacity in 2017
In 2016 US steel production was 786 million metric tons and US capacity
was 1133 million metric tons which represents a 694 percent capacity utilization
rate If current import trends for 2017 continue continued imports without any
action are projected to be 360 million metric tons an increase over 2016 of 60
million metric tons Even with US demand projected to increase to 1073 from
998 million metric tons increased imports mean US capacity utilization is forecast
to rise only to 723 percent a non-financially viable and unsustainable level of
operation
By reducing import penetration rates to approximately 21 percent US
industry would be able to operate at 80 percent of their capacity utilization
Achieving this level of capacity utilization based on the projected 2017 import levels
will require reducing imports from 36 million metric tons to about 23 million metric
tons If a reduction in imports can be combined with an increase in domestic steel
demand as can be reasonably expected rising economic growth rates combined with
the increased military spending and infrastructure proposals that the Trump
Administration has planned then US steel mills can be expected to reach a capacity
58
utilization level of 80 percent or greater This increase in US capacity utilization
will enable US steel mills to increase operations significantly in the short-term and
improve the financial viability of the industry over the long-term
Recommendation to Ensure Sustainable Capacity Utilization and
Financial Health
Impose a Quota or Tariff on all steel products covered in this investigation
imported into the United States to remove the threatened impairment to
national security The Secretary recommends adjusting the level of imports through
a quota or tariff on steel imported into the United States
Alternative 1 ndash Global Quota or Tariff
1A Global Quota
Impose quotas on all imported steel products at a specified percent of the 2017
import level applied on a country and steel product basis
According to the Global Trade Analysis Project (GTAP) Model produced by
Purdue University a 63 percent quota would be expected to reduce steel imports by
37 percent (133 million metric tons) from 2017 levels Based on imports from
January to October import levels for 2017 are projected to reach 360 million metric
tons The quotas adjusted as necessary would result in imports equaling about 227
million metric tons which will enable an 80 percent capacity utilization rate at 2017
demand levels (including exports) Application of an annual quota will reduce the
impact of the surge in steel imports that has occurred since the beginning of 2017
1B Global Tariff
Apply a tariff rate on all imported steel products in addition to any
antidumping or countervailing duty collections applicable to any imported steel
product
Similar to what is anticipated under a quota according to the Global Trade
Analysis Project (GTAP) Model produced by Purdue University a 24 percent tariff
on all steel imports would be expected to reduce imports by 37 percent (ie a
59
reduction of 133 million metric tons from 2017 levels of 360 million metric tons) 84
This tariff rate would thus result in imports equaling about 227 million metric tons
which will enable an 80 percent capacity utilization rate at 2017 demand levels
(including exports)85
Alternative 2 ndashTariffs on a Subset of Countries
Apply a tariff rate on all imported steel products from Brazil South Korea
Russia Turkey India Vietnam China Thailand South Africa Egypt Malaysia and
Costa Rica in addition to any antidumping or countervailing duty collections
applicable to any steel products from those countries All other countries would be
limited to 100 percent of their 2017 import level
According to the Global Trade Analysis Project (GTAP) Model produced by
Purdue University a 53 percent tariff on all steel imports from this subset of
countries would be expected to reduce imports by 133 million metric tons from 2017
import levels from the targeted countries This action would enable an increase in
domestic production to achieve an 80 percent capacity utilization rate at 2017
demand levels (including exports) The countries identified are projected to account
for less than 4 percent of US steel exports in 2017
Exemptions
In selecting an alternative the President could determine that specific
countries should be exempted from the proposed 63 percent quota or 24 percent tariff
by granting those specific countries 100 percent of their prior imports in 2017 based
on an overriding economic or security interest of the United States The Secretary
recommends that any such determination should be made at the outset and a
corresponding adjustment be made to the final quota or tariff imposed on the
84 Due to general equilibrium effects the overall import level would need to decrease by more than the corresponding increase in domestic production to offset the negative effects of price or exchange rate changes on export demand
85 The elasticity factor is an estimate not a certainty variation of 01 in the elasticity factor would change the tonnage reduction by about 375000 tons For example imports would fall by an additional 375000 tons under a demand elasticity of -17 instead of -16 and a 25 percent tariff
60
remaining countries This would ensure that overall imports of steel to the United
States remain at or below the level needed to enable the domestic steel industry to
operate as a whole at an 80 percent or greater capacity utilization rate The limitation
to 100 percent of each exempted countryrsquos 2017 imports is necessary to prevent
exempted countries from producing additional steel for export to the United States
or encouraging other countries to seek to trans-ship steel to the United States through
the exempted countries
It is possible to provide exemptions from either the quota or tariff and still
meet the necessary objective of increasing US steel capacity utilization to a
financially viable target of 80 percent However to do so would require a reduction
in the quota or increase in the tariff applied to the remaining countries to offset the
effect of the exempted import tonnage
Exclusions
The Secretary recommends an appeal process by which affected US parties
could seek an exclusion from the tariff or quota imposed The Secretary would grant
exclusions based on a demonstrated (1) lack of sufficient US production capacity
of comparable products or (2) specific national security based considerations This
appeal process would include a public comment period on each exclusion request
and in general would be completed within 90 days of a completed application being
filed with the Secretary
An exclusion may be granted for a period to be determined by the Secretary
and may be terminated if the conditions that gave rise to the exclusion change The
US Department of Commerce will lead the appeal process in coordination with the
Department of Defense and other agencies as appropriate Should exclusions be
granted the Secretary would consider at the time whether the quota or tariff for the
remaining products needs to be adjusted to increase US steel capacity utilization to
a financially viable target of 80 percent
61
THE EFFECT OF IMPORTS OF STEEL ON THE NATIONAL SECURITY
TABLE OF CONTENTS I EXECUTIVE SUMMARY 1
II LEGAL FRAMEWORK 11
III INVESTIGATION PROCESS 18
A Initiation of Investigation 18
B Public Hearing 18
C Public Comments 18
D Interagency Consultation 19
IV PRODUCT SCOPE OF THE INVESTIGATION 21
V FINDINGS 23
A Steel is Important to US National Security 23
1 Steel is Needed for National Defense Requirements 232 Steel is Required for US Critical Infrastructure 233 Domestic Steel Production is Essential for National Security Applications 244 Domestic Steel Production Depends on a Healthy and Competitive US Industry 255 Steel Consumed in Critical Industries 25
B Imports in Such Quantities as are Presently Found Adversely Impact the EconomicWelfare of the US Steel Industry 27
1 Imports of Steel Products Continue to Increase 272 High Import Penetration 293 High Import to Export Ratio 304 Steel Prices 315 Steel Mill Closures 336 Declining Employment Trend Since 1998 357 Trade Actions ndash Antidumping and Countervailing Duties 368 Loss of Domestic Opportunities to Bidders Using Imported Steel 369 Financial Distress 3710 Capital Expenditures 40
C Displacement of Domestic Steel by Excessive Quantities of Imports has the Serious Effectof Weakening Our Internal Economy 41
1 Domestic Steel Production Capacity is Stagnant and Concentrated 412 Production is Well Below Demand 46
3 Utilization Rates are Well Below Economically Viable Levels 474 Declining Steel Production Facilities Limits Capacity Available for a NationalEmergency 49
D Global Excess Steel Capacity is a Circumstance that Contributes to the Weakening of theDomestic Economy 51
1 Free markets globally are adversely affected by substantial chronic global excess steelproduction led by China 512 Increasing global excess steel capacity will further weaken the internal economy as USsteel producers will face increasing import competition 53
VI CONCLUSION 55
VII RECOMMENDATION 58
Prepared by Bureau of Industry and Securityhttpwwwbisdocgov
APPENDICES
APPENDIX A Section 232 Investigation Notification Letter to Secretary of Defense James Mattis (April 19 2017) Department of Defense Response to Notification (May 8 2017)
APPENDIX B Presidential Memorandum for the Secretary of Commerce - Steel Imports and Threats to National Security (April 20 2017)
APPENDIX C Federal Register - Notice Request for Public Comments and Public Hearing on Section 232 National Security Investigation of Imports of Steel (April 21 2017)
APPENDIX D Federal Register - Notice on Procedures for Attending or Viewing Remotely the Public Hearing on Section 232 National Security Investigation of Imports of Steel (May 17 2017)
APPENDIX E Public Hearing Witnesses
APPENDIX F Public Hearing Testimonies
APPENDIX G Public Comments
APPENDIX H Uses of Steel for National Defense
APPENDIX I Uses of Steel for Critical Infrastructure
APPENDIX J US Government Steel Measures and Actions
APPENDIX K Steel Orders in Effect as of January 11 2018
APPENDIX L Global Excess Capacity in Steel Production
I EXECUTIVE SUMMARY
Overview
This report summarizes the findings of an investigation conducted by the US
Department of Commerce (the ldquoDepartmentrdquo) pursuant to Section 232 of the Trade
Expansion Act of 1962 as amended (19 USC sect1862 (ldquoSection 232rdquo)) into the
effect of imports of steel mill products (ldquosteelrdquo) on the national security of the United
States
In conducting this investigation the Secretary of Commerce (the ldquoSecretaryrdquo)
noted the Departmentrsquos prior investigations under Section 232 This report
incorporates the statutory analysis from the Departmentrsquos 2001 Report1 with respect
to applying the terms ldquonational defenserdquo and ldquonational securityrdquo in a manner that is
consistent with the statute and legislative intent2 As in the 2001 Report the
Secretary in this investigation determined that ldquonational securityrdquo for purposes of
Section 232 includes the ldquogeneral security and welfare of certain industries beyond
those necessary to satisfy national defense requirements which are critical to
minimum operations of the economy and governmentrdquo3
As required under Section 232 the Secretary examined the effect of imports
on national security requirements including domestic production needed for
projected national defense requirements the capacity of domestic industries to meet
such requirements existing and anticipated availabilities of the human resources
products raw materials and other supplies and services essential to the national
defense the requirements of growth of such industries and such supplies and
services including the investment exploration and development necessary to assure
such growth and the importation of goods in terms of their quantities availabilities
character and use as those affect such industries and the capacity of the United
States to meet national security requirements
1 Department of ommerce ureau of Export dministration- The Effect of Imports of Iron Ore and Semi-Finished Steel on the National Security- Oct 2001 (2001 Report)
2 Id at 5
3 Id
1
The Secretary also recognized the close relation of the economic welfare of
the United States to its national security the impact of foreign competition on the
economic welfare of individual domestic industries and any substantial
unemployment decrease in revenues of government loss of skills or any other
serious effects resulting from the displacement of any domestic products by
excessive imports without excluding other factors in determining whether a
weakening of the US economy by such imports may impair national security In
particular this report assesses whether steel is being imported ldquoin such quantitiesrdquo
and ldquounder such circumstancesrdquo as to ldquothreaten to impair the national securityrdquo4
Findings
In conducting the investigation the Secretary found
A Steel is Important to US National Security
1 National security includes projected national defense requirements for the US Department of Defense
2 National security also encompasses US critical infrastructure sectors including transportation systems the electric power grid water systems
and energy generation systems
3 Domestic steel production is essential for national security applications Statutory provisions illustrate that Congress believes domestic
production capability is essential for defense requirements and critical
infrastructure needs and ultimately to the national security of the United
States5 US Government actions on steel across earlier Administrations
4 19 US sect 1862(b)(3)()
5 See eg 15 US sect 271(a)(1)(The future well-being of the United States economy depends on a strong manufacturing base0)- 50 US sect 4502(a)(ongress finds that ndash (1) the security of the United States is dependent on the ability of the domestic industrial base to supply materials and services0 (2)() to provide for the protection and restoration of domestic critical infrastructure operations under emergency conditions0- and merican Recovery and Reinvestment ct PL 111-5 sect1605 123 Stat 303 (Feb 17 2009) (providing that none of the funds appropriated or made available by the act may be used for the construction alteration maintenance or repair of a public building or public work unless the iron steel and manufactured goods are produced in the United States)
2
further demonstrate domestic steel production is vital to national
security6
4 Domestic steel production depends on a healthy and competitive US industry The principal types of mills that produce steel are integrated
mills with basic oxygen furnaces (BOFs) mini-mills using electric arc
furnaces (EAFs) re-rollerconverter and metal coater facilities Basic
oxygen furnaces convert raw materials into steel and remain critical for
continued innovation in steel technology Covered in this report are five
categories of steel products that are used for national security
applications flat long semi-finished pipe and tube and stainless
5 The Department found that demand for steel in critical industries has increased since the Departmentrsquos last investigation in 2001 The 2001
Report determined that there was 3368 million tons of finished steel
consumed in critical industries per year in the United States based on
1997 data7 The Department updated that analysis for this report using
2007 data (the latest available) and determined that domestic
consumption in critical industries has increased significantly with 54
million metric tons of steel now being consumed annually in critical
industries
B Imports in Such Quantities as are Presently Found Adversely Impact the Economic Welfare of the US Steel Industry
1 The United States is the worldrsquos largest steel importer In the first ten months of 2017 steel imports have increased at a double-digit rate over
2016 accounting for more than 30 percent of US consumption
Notwithstanding numerous anti-dumping and countervailing duty orders
which are limited in scope imports of most types of steel continue to
increase
6 See infra section V()(3) and ppendix J
7 2001 Report at 14 The 2001 Report is not clear whether it used short tons or metric tons If short tons were used then the metric ton equivalent is 3056 million metric tons
3
2 Import penetration levels for flat semi-finished stainless long and pipe and tube products continue on an upward trend above 30 percent of
domestic consumption
3 Imports are nearly four times US exports
4 Imports are priced substantially lower than US produced steel
5 Excessive steel imports have adversely impacted the steel industry Numerous US steel mill closures a substantial decline in employment
lost domestic sales and market share and marginal annual net income for
US-based steel companies illustrate the decline of the US steel industry
C Displacement of Domestic Steel by Excessive Quantities of Imports has the
Serious Effect of Weakening our Internal Economy
1 As steel imports have increased US steel production capacity has been stagnant and production has decreased
2 Since 2000 foreign competition and the displacement of domestic steel by excessive imports have resulted in the closure of six basic oxygen furnace
facilities and the idling of four more (which is more than a 50 percent
reduction in the number of such facilities) a 35 percent decrease in
employment in the steel industry and caused the domestic steel industry
as a whole to operate on average with negative net income since 2009
3 The declining steel capacity utilization rate is not economically sustainable Utilization rates of 80 percent or greater are necessary to
sustain adequate profitability and continued capital investment research
and development and workforce enhancement in the steel sector
D Global Excess Steel Capacity is a Circumstance that Contributes to the
Weakening of the Domestic Economy
1 In the steel sector free markets globally are adversely affected by substantial chronic global excess steel production led by China The
worldrsquos nominal crude steelmaking capacity reached about 24 billion
metric tons in 2016 an increase of 127 percent compared to the capacity
4
level in 2000 while steel demand grew at a much smaller rate In 2016
there was a 737 million metric ton global gap between steelmaking
capacity and steel crude demand which means there is unlikely to be any
market-driven reduction in steel exports to the United States in the near
future 8
2 While US steel production capacity has remained flat since 2001 other steel producing nations have increased their production capacity with
China alone able to produce as much steel as the rest of the world
combined This overhang of excess capacity means that US steel
producers for the foreseeable future will face increasing competition
from imported steel as other countries export more steel to the United
States to bolster their own economic objectives and offset loss of markets
to Chinese steel exports
Conclusion
Based on these findings the Secretary of Commerce concludes that the
present quantities and circumstance of steel imports are ldquoweakening our internal
economyrdquo and threaten to impair the national security as defined in Section 232 The
Secretary considered the Departmentrsquos narrower investigation of iron ore and semi-
finished steel imports in 2001 which recommended no action be taken and finds
that several important factors ndash the broader scope of the investigation the level of
global excess capacity the level of imports the reduction in basic oxygen furnace
facilities since 2001 and the potential impact of further plant closures on capacity
needed in a national emergency support recommending action under Section 232
In light of this conclusion the Secretary has determined that the only effective means
of removing the threat of impairment is to reduce imports to a level that should in
combination with good management enable US steel mills to operate at 80 percent
or more of their rated production capacity
Source Global Forum report- httpwwwbmwideRedaktionENDownloadsglobal-forum-on-steel-excess-
capacity-reportpdf
5
8
Recommendation
Prior significant actions to address steel imports using quotas andor tariffs
were taken under various statutory authorities by President George W Bush
President William J Clinton (three times) President George H W Bush President
Ronald W Reagan (three times) President James E Carter (twice) and President
Richard M Nixon all at lower levels of import penetration than the present level
which is greater than 30 percent
Due to the threat as defined in Section 232 to national security from steel
imports the Secretary recommends that the President take immediate action by
adjusting the level of these imports through quotas or tariffs The quotas or tariffs
imposed should be sufficient even after any exceptions (if granted) to enable US
steel producers to operate at an 80 percent or better average capacity utilization rate
based on available capacity in 2017 (see Figure 1)
6
Figure 1 Import Levels and US Steel Mill Capacity Utilization Rates
Steel Market Snapshot (millions of metric tons) 2011-2016
Average 2017
Annualized
Total Demand for Steel in US (production + imports-exports) 1055 1073
US Annual Capacity 1144 1133
US Annual Production (liquid) 846 819
Capacity Utilization Rate (percentage) 740 723
Imports and Exports (millions of metric tons)
Imports of Steel to US (including semi-finished) 318 360
Exports of Steel from the US 108 101
Percent Import Penetration 301 338
Production at Various Utilization Rates (millions of metric tons)
Maximum Capacity 1144 1133
Production at 75 Capacity Utilization 858 850
Production at 80 Capacity Utilization 915 906
Production at 85 Capacity Utilization 972 963
Import Levels and Domestic Production Targets Based on 80 Capacity Utilization
General Equilibrium (GTAP Model ndash Includes Reduction in Exports and Demand)
Maximum Import Level (mmt) 227
Estimated Import Penetration 22
Estimated Production (mmt) 906
Alternative 1A Quota Applied to 2017 Import Levels 63
Alternative 1B Tariff Rate Applied to All Imports 24
Numbers may differ slightly due to rounding Sources United States Department of Commerce Bureau of the Census American Iron and Steel Institute Calculations based on industry and trade data
The Secretary recommends that the President impose a quota or tariff on all
steel products covered in this investigation imported into the United States to remove
the threatened impairment to national security
Alternative 1 ndash Global Quota or Tariff
1A Global Quota
Impose quotas on all imported steel products at a specified percent of the 2017
import level applied on a country and steel product basis
7
According to the Global Trade Analysis Project (GTAP) Model9 produced by
Purdue University a 63 percent quota would be expected to reduce steel imports by
about 37 percent (133 million metric tons) from 2017 levels Based on imports from
January to October import levels for 2017 are projected to reach 360 million metric
tons This action would result in imports equaling about 227 million metric tons
which will enable an 80 percent capacity utilization rate at 2017 demand levels
(including exports)
1B Global Tariff
Apply a tariff rate on all imported steel products in addition to any
antidumping or countervailing duty collections applicable to any imported steel
product
According to the Global Trade Analysis Project (GTAP) Model produced by
Purdue University a 24 percent tariff on all steel imports would be expected to
reduce imports by 37 percent (ie a reduction of 133 million metric tons from 2017
levels of 360 million metric tons) This tariff rate would thus result in imports
equaling about 227 million metric tons which will enable an 80 percent capacity
utilization rate at 2017 demand levels (including exports)
Alternative 2 ndash Tariffs on a Subset of Countries
Apply a tariff rate on all imported steel products from Brazil South Korea
Russia Turkey India Vietnam China Thailand South Africa Egypt Malaysia and
Costa Rica in addition to any antidumping or countervailing duty collections
applicable to any steel products from those countries All other countries would be
limited to 100 percent of their 2017 import level
According to the Global Trade Analysis Project (GTAP) Model produced by
Purdue University a 53 percent tariff on all steel imports from this subset of
countries would be expected to reduce imports by 133 million metric tons from 2017
The standard GTP Model is a static multiregional multisector computable general equilibrium model with perfect competition and constant returns to scale The model is based on optimizing behavior by economic agents The standard GTP closure allows all prices and wages in the economy to adjust so as to ensure supply equals demand in all markets including the labor market The estimates in this report were made using the GTP 10 model which has a 2014 base
8
9
import levels from the targeted countries This action would enable an increase in
domestic production to achieve an 80 percent capacity utilization rate at 2017
demand levels (including exports) The countries identified are projected to account
for less than 4 percent of US steel exports in 2017
Exemptions
In selecting an alternative the President could determine that specific
countries should be exempted from the proposed 63 percent quota or 24 percent tariff
by granting those specific countries 100 percent of their prior imports in 2017 based
on an overriding economic or security interest of the United States The Secretary
recommends that any such determination should be made at the outset and a
corresponding adjustment be made to the final quota or tariff imposed on the
remaining countries This would ensure that overall imports of steel to the United
States remain at or below the level needed to enable the domestic steel industry to
operate as a whole at an 80 percent or greater capacity utilization rate The limitation
to 100 percent of each exempted countryrsquos 2017 imports is necessary to prevent
exempted countries from producing additional steel for export to the United States
or encouraging other countries to seek to trans-ship steel to the United States through
the exempted countries
It is possible to provide exemptions from either the quota or tariff and still
meet the necessary objective of increasing US steel capacity utilization to a
financially viable target of 80 percent However to do so would require a reduction
in the quota or increase in the tariff applied to the remaining countries to offset the
effect of the exempted import tonnage
Exclusions
The Secretary recommends an appeal process by which affected US parties
could seek an exclusion from the tariff or quota imposed The Secretary would grant
exclusions based on a demonstrated (1) lack of sufficient US production capacity
of comparable products or (2) specific national security based considerations This
appeal process would include a public comment period on each exclusion request
9
and in general would be completed within 90 days of a completed application being
filed with the Secretary
An exclusion may be granted for a period to be determined by the Secretary
and may be terminated if the conditions that gave rise to the exclusion change The
US Department of Commerce will lead the appeal process in coordination with the
Department of Defense and other agencies as appropriate Should exclusions be
granted the Secretary would consider at the time whether the quota or tariff for the
remaining products needs to be adjusted to increase US steel capacity utilization to
a financially viable target of 80 percent
10
II LEGAL FRAMEWORK
I Section 232 Requirements
Section 232 provides the Secretary with the authority to conduct
investigations to determine the effect on the national security of the United States of
imports of any article It authorizes the Secretary to conduct an investigation if
requested by the head of any department or agency upon application of an interested
party or upon his own motion See 19 USC sect 1862(b)(1)(A)
Section 232 directs the Secretary to submit to the President a report with
recommendations for ldquoaction or inaction under this sectionrdquo and requires the
Secretary to advise the President if any article ldquois being imported into the United
States in such quantities or under such circumstances as to threaten to impair the
national securityrdquo See 19 USC sect 1862(b)(3)(A)
Section 232(d) directs the Secretary and the President to in light of the
requirements of national security and without excluding other relevant factors give
consideration to the domestic production needed for projected national defense
requirements and the capacity of the United States to meet national security
requirements See 19 USC sect 1862(d)
Section 232(d) also directs the Secretary and the President to ldquorecognize the
close relation of the economic welfare of the Nation to our national security and
helliptake into consideration the impact of foreign competition on the economic welfare
of individual domestic industriesrdquo by examining whether any substantial
unemployment decrease in revenues of government loss of skills or investment or
other serious effects resulting from the displacement of any domestic products by
excessive imports or other factors result in a ldquoweakening of our internal economyrdquo
that may impair the national security See 19 USC sect 1862(d)
Once an investigation has been initiated Section 232 mandates that the
Secretary provide notice to the Secretary of Defense that such an investigation has
been initiated Section 232 also requires the Secretary to do the following
(1) ldquoConsult with the Secretary of Defense regarding the methodological and policy questions raised in [the] investigationrdquo
11
(2) ldquoSeek information and advice from and consult with appropriate
officers of the United Statesrdquo and
(3) ldquoIf it is appropriate and after reasonable notice hold public hearings or
otherwise afford interested parties an opportunity to present
information and advice relevant to such investigationrdquo10 See 19 USC
sect 1862(b)(2)(A)(i)-(iii)
As detailed in Parts III and V of this report each of the legal requirements set
forth above has been satisfied
In conducting the investigation Section 232 permits the Secretary to request
that the Secretary of Defense provide an assessment of the defense requirements of
the article that is the subject of the investigation See 19 USC sect 1862(b)(2)(B)
Upon completion of a Section 232 investigation the Secretary is required to
submit a report to the President no later than 270 days after the date on which the
investigation was initiated See 19 USC sect 1862(b)(3)(A) The required report
must
(1) Set forth ldquothe findings of such investigation with respect to the effect of the importation of such article in such quantities or under such
circumstances upon the national securityrdquo
(2) Set forth ldquobased on such findings the recommendations of the Secretary for action or inaction under this sectionrdquo and
(3) ldquoIf the Secretary finds that such article is being imported into the United States in such quantities or under such circumstances as to threaten to
impair the national security so advise the Presidentrdquo See 19 USC
sect 1862(b)(3)(A)
10 Department regulations (i) set forth additional authority and specific procedures for such input from interested parties see 15 FR sectsect 7057 and 7058 and (ii) provide that the Secretary may vary or dispense with those procedures in emergency situations or when in the judgment of the Department national security interests require it Id sect 7059
12
All unclassified and non-proprietary portions of the report submitted by the
Secretary to the President must be published
Within 90 days after receiving a report in which the Secretary finds that an
article is being imported into the United States in such quantities or under such
circumstances as to threaten to impair the national security the President shall
(1) ldquoDetermine whether the President concurs with the finding of the Secretaryrdquo and
(2) ldquoIf the President concurs determine the nature and duration of the action that in the judgment of the President must be taken to adjust the
imports of the article and its derivatives so that such imports will not
threaten to impair the national securityrdquo See 19 USC sect
1862(c)(1)(A)
II Discussion
While Section 232 does not contain a definition of ldquonational securityrdquo both
Section 232 and its implementing regulations at 15 CFR Part 705 contain non-
exclusive lists of factors that Commerce must consider in evaluating the effect of
imports on the national security Congress in Section 232 explicitly determined that
ldquonational securityrdquo includes but is not limited to ldquonational defenserdquo requirements
See 19 USC sect 1862(d) The Department in 2001 determined that ldquonational
defenserdquo includes both defense of the United States directly and the ldquoability to
project military capabilities globallyrdquo11
The Department also concluded in 2001 that ldquoin addition to the satisfaction of
national defense requirements the term ldquonational securityrdquo can be interpreted more
broadly to include the general security and welfare of certain industries beyond
those necessary to satisfy national defense requirements that are critical to the
minimum operations of the economy and governmentrdquo The Department called
these ldquocritical industriesrdquo12 This report once again uses these reasonable
11 Department of ommerce ureau of Export dministration- The Effect of Imports of Iron Ore and Semi-Finished Steel on the National Security- Oct 2001 (2001 Report)
12 Id
13
interpretations of ldquonational defenserdquo and ldquonational securityrdquo However this report
uses the more recent 16 critical infrastructure sectors identified in Presidential Policy
Directive 2113 instead of the 28 critical industry sectors used by the Bureau of Export
Administration in the 2001 Report14
Section 232 directs the Secretary to determine whether imports of any article
are being made ldquoin such quantities or under such circumstancesrdquo that those imports
ldquothreaten to impair the national securityrdquo See 19 USC sect 1862(b)(3)(A) The
statutory construction makes clear that either the quantities or the circumstances
standing alone may be sufficient to support an affirmative finding They may also
be considered together particularly where the circumstances act to prolong or
magnify the impact of the quantities being imported
The statute does not define a threshold for when ldquosuch quantitiesrdquo of imports
are sufficient to threaten to impair the national security nor does it define the
ldquocircumstancesrdquo that might qualify
Likewise the statute does not require a finding that the quantities or
circumstances are impairing the national security Instead the threshold question
under Section 232 is whether those quantities or circumstances ldquothreaten to impair
the national securityrdquo See 19 USC sect 1862(b)(3)(A) This formulation strongly
suggests that Congress expected an affirmative finding under Section 232 would
occur before there is actual impairment of the national security 15
Section 232(d) contains a considerable list of factors for the Secretary to
consider in determining if imports ldquothreaten to impair the national securityrdquo16 of the
United States and this list is mirrored in the implementing regulations See 19
13 Presidential Policy Directive 21- ritical Infrastructure Security and Resilience- February 12 2013 (PPD-21)
14 See Op it at 16
15 The 2001 Report used the phrase fundamentally threaten to impair when discussing how imports may threaten to impair national security See 2001 Report at 7 and 37 ecause the term fundamentally is not included in the statutory text and could be perceived as establishing a higher threshold the Secretary expressly does not use the qualifier in this report The statutory threshold in Section 232(b)(3)() is unambiguously threaten to impair and the Secretary adopts that threshold without qualification 19 US sect 1862(b)(3)() The statute also uses the formulation may impair in Section 232(d) Id at 1862(d)
16 19 US sect 1862(b)(3)()
14
USC sect 1862(d) and 15 CFR sect 7054 Congress was careful to note twice in
Section 232(d) that the list they provided while mandatory is not exclusive17
Congressrsquo illustrative list is focused on the ability of the United States to maintain
the domestic capacity to provide the articles in question as needed to maintain the
national security of the United States18 Congress broke the list of factors into two
equal parts using two separate sentences The first sentence focuses directly on
ldquonational defenserdquo requirements thus making clear that ldquonational defenserdquo is a
subset of the broader term ldquonational securityrdquo The second sentence focuses on the
broader economy and expressly directs that the Secretary and the President ldquoshall
recognize the close relation of the economic welfare of the Nation to our national
securityrdquo19 See 19 USC sect 1862(d)
Two of the factors listed in the second sentence of Section 232(d) are most
relevant in this investigation Both are directed at how ldquosuch quantitiesrdquo of imports
threaten to impair national security See 19 USC sect 1862(b)(3)(A) In
administering Section 232 the Secretary and the President are required to ldquotake into
consideration the impact of foreign competition on the economic welfare of
individual domestic industriesrdquo and any ldquoserious effects resulting from the
displacement of any domestic products by excessive importsrdquo in ldquodetermining
whether such weakening of our internal economy may impair the national securityrdquo
17 See 19 US sect 1862(d) (the Secretary and the President shall in light of the requirements of national security and without excluding other relevant factors0 and serious effects resulting from the displacement of any domestic products by excessive imports shall be considered without excluding other factors0 )
18 This reading is supported by ongressional findings in other statutes See eg 15 US sect 271(a)(1)(The future well-being of the United States economy depends on a strong manufacturing base0) and 50 US sect 4502(a)(ongress finds that ndash (1) the security of the United States is dependent on the ability of the domestic industrial base to supply materials and services0 (2)() to provide for the protection and restoration of domestic critical infrastructure operations under emergency conditions0 (3)0 the national defense preparedness effort of the United States Government requires ndash () the development of domestic productive capacity to meet ndash (ii) unique technological requirements0 (7) much of the industrial capacity that is relied upon by the United States Government for military production and other national defense purposes is deeply and directly influenced by ndash () the overall competitiveness of the industrial economy of the United States- and () the ability of industries in the United States in general to produce internationally competitive products and operate profitably while maintaining adequate research and development to preserve competitiveness with respect to military and civilian production- and (8) the inability of industries in the United States especially smaller subcontractors and suppliers to provide vital parts and components and other materials would impair the ability to sustain the rmed Forces of the United States in combat for longer than a short period )
19 ccord 50 US sect 4502(a)
15
See 19 USC sect 1862(d) Since the 2001 investigation foreign competition and the
displacement of domestic steel by excessive imports have resulted in the closure of
six basic oxygen furnace facilities and the idling of four more (which is more than a
50 percent reduction in the number of such facilities) a 35 percent decrease in
employment in the steel industry and caused the domestic steel industry as a whole
to operate on average with negative net income since 2009
Another factor not on the list that the Secretary finds to be a relevant is the
presence of massive excess capacity for producing steel This excess capacity results
in steel imports occurring ldquounder such circumstancesrdquo that they threaten to impair
the national security See 19 USC sect 1862(b)(3)(A) The circumstance of excess
global steel production capacity is a factor because while US production capacity
has remained flat since 2001 other steel producing nations have increased their
production capacity with China alone able to produce as much as the rest of the
world combined This overhang of global excess capacity means that US steel
producers for the foreseeable future will continue to lose market share to imported
steel as other countries export more steel to the United States to bolster their own
economic objectives and offset loss of markets to Chinese steel exports
It is these three factors ndash displacement of domestic steel by excessive imports
and the consequent adverse impact on the economic welfare of the domestic steel
industry along with global excess capacity in steel ndash that the Secretary has concluded
create a persistent threat of further plant closures that could leave the United States
unable in a national emergency to produce sufficient steel to meet national defense
and critical industry needs The Secretary finds this ldquoweakening of our internal
economy may impair the national securityrdquo as defined in Section 232 See 19 USC
1862(d)
The Secretary also considered whether the source of the imports affects the
analysis under Section 232 In the 2001 Report ldquothe Department found that iron ore
and semi-finished steel are imported from reliable foreign sourcesrdquo and concluded
that ldquoeven if the United States were dependent on imports of iron ore and semi-
finished steel imports would not threaten to impair national securityrdquo 2001 Report
at 27 However because Congress in Section 232 chose to explicitly direct the
Secretary to consider whether the ldquoimpact of foreign competitionrdquo and
ldquothe
16
displacement of any domestic products by excessive importsrdquo are ldquoweakening our
internal economyrdquo but made no reference to an assessment of the sources of imports
it appears likely that Congress recognized adverse impacts might be caused by
imports from allies or other reliable sources20 As a result the fact that some or all
of the imports causing the harm are from reliable sources does not compel a finding
that those imports do not threaten to impair national security21
After careful examination of the facts in this investigation the Secretary has
concluded that excessive imports of steel in the present circumstances do threaten to
impair national security under Section 232 Several important factors ndash the broader
scope of the investigation22 the level of global excess capacity the level of imports
the reduction in basic oxygen furnace facilities since 2001 and the potential impact
of further plant closures on capacity needed in a national emergency ndash support a
recommendation different from the one adopted in the 2001 Report
20 When ongress adopted Section 232(d) in 1962 the immediately preceding section was Section 231 19 US sect 1861 which required the President as soon as practicable to suspend most-favored-nation tariff treatment for imports from communist countries Given the bipolar nature of the world at the time the absence of a distinction between communist and non-communist countries in Section 232 suggests that ongress expected Section 232 would be applied to imports from all countriesmdashincluding allies and other reliable sources
21 To the extent that the 2001 Report or other prior Department reports under Section 232 can be read to
conclude that imports from reliable sources cannot impair the national security when the Secretary finds those
imports are causing substantial unemployment decrease in revenues of government loss of skills or
investment or other serious effects resulting from the displacement of any domestic products by excessive
imports the Secretary expressly rejects such a reading
22 This investigation examines the import of a broad range of steel products ndash flat long pipe and tube semi-
finished and stainless ndash whereas the 2001 Report addressed only semi-finished steel products and iron ore
which is not part of this investigation s the 2001 Report noted at the time semi-finished imports accounted
for a small percentage (approximately 7 percent) of total US semi-finished steel consumption 2001 Report
at 31 The 2001 Report also stated that whether imports have harmed or threaten to harm US producers writ
large is beyond the scope of the Departments inquiry and need not be resolved here Id at 37 This
investigation is focused on the larger inquiry that the 2001 Report expressly did not reach
17
III INVESTIGATION PROCESS
A Initiation of Investigation
On April 19 2017 US Secretary of Commerce Wilbur Ross initiated an
investigation to determine the effect of imported steel on national security under
Section 232 of the Trade Expansion Act of 1962 as amended (19 USC sect 1862)
Pursuant to Section 232(b)(1)(B) the Department notified the US
Department of Defense with an April 19 2017 letter from Secretary Ross to
Secretary James Mattis23
On April 20 2017 President Donald Trump signed a Presidential
Memorandum directing Secretary Ross to proceed expeditiously in conducting his
investigation and submit a report on his findings to the President24
On April 21 2017 the Department published in the Federal Register a notice
about the initiation of this investigation to determine the effect of imports of steel on
the national security The notice also announced the opening of the public comment
period as well as a public hearing to be held on May 24 201725
B Public Hearing
The Department held a public hearing to elicit further information concerning
this investigation in Washington DC on May 24 2017 The Department heard
testimony from 37 witnesses at the hearing A full list of witnesses and copies of
their testimony are included in Appendices E and F
C Public Comments
On April 21 2017 the Department invited interested parties to submit written
comments opinions data information or advice relevant to the criteria listed in
23 19 US sect 1862(b)(1)() See ppendix Section 232 Investigation Notification Letter to Secretary of Defense James Mattis (pril 19 2017) - Department of Defense Response to Notification (May 8 2017)
24 See ppendix Presidential Memorandum for the Secretary of ommerce - Steel Imports and Threats to National Security (pril 20 2017)
25 See ppendices and D for Federal Register Notice Federal Register Vol 82 No 79 19205-19207 and See Federal Register Vol 82 No 98 23529-23530
18
Section 7054 of the National Security Industrial Base Regulations (15 CFR sect
7054) as they affect the requirements of national security including the following
(a) Quantity of the articles subject to the investigation and other circumstances
related to the importation of such articles (b) Domestic production capacity needed
for these articles to meet projected national defense requirements (c) The capacity
of domestic industries to meet projected national defense requirements (d) Existing
and anticipated availability of human resources products raw materials production
equipment facilities and other supplies and services essential to the national
defense (e) Growth requirements of domestic industries needed to meet national
defense requirements and the supplies and services including the investment
exploration and development necessary to assure such growth (f) The impact of
foreign competition on the economic welfare of any domestic industry essential to
our national security (g) The displacement of any domestic products causing
substantial unemployment decrease in the revenues of government loss of
investment or specialized skills and productive capacity or other serious effects (h)
Relevant factors that are causing or will cause a weakening of our national economy
and (i) Any other relevant factors See Federal Register Vol 82 No 79 19205-
19207
The public comment period ended on May 31 2017 The Department
received 201 written public comment submissions concerning this investigation All
public comments were carefully reviewed and factored into the investigation
process For a listing of all public comments see Appendix G
D Interagency Consultation
In addition to the required notification provided by the April 19 2017 letter
from Secretary Ross to Secretary Mattis Department staff carried out the
consultations required under Section 232(b)(2)26 Staff consulted with their
counterparts in the Department of Defense regarding any methodological and policy
questions that arose during the investigation Discussions were held with the US
Army Materiel Command the Defense Logistics Agency the US NavyNaval Air
26 19 US sect 1862(b)(2)
19
Systems Command and the Under Secretary of Defense for Acquisitions amp
Logistics Manufacturing and Industrial Base Policy
Discussions were also held with ldquoappropriate officers of the United Statesrdquo
including the Department of State Department of the Treasury Department of the
InteriorUS Geological Survey the Department of Homeland SecurityUS
Customs and Border Protection the International Trade Commission and the Office
of the United States Trade Representative 27
27 Id
20
IV PRODUCT SCOPE OF THE INVESTIGATION28 29
For this report the product scope covers steel mill products (ldquosteelrdquo) which
are defined at the Harmonized System (ldquoHSrdquo) 6-digit level as 720610 through
721650 721699 through 730110 730210 730240 through 730290 and 730410
through 730690 including any subsequent revisions to these HS codes The
following discontinued HS codes have been included for purposes of reporting
historical data (prior to 2007) 722520 722693 722694 722910 730410 730421
730610 730620 and 730660
These steel products are all produced by US steel companies and support
various applications across the defense critical infrastructure and commercial
sectors Generally these products fall into one of the following five product
categories (including but not limited to)
(1) Carbon and Alloy Flat Product (Flat Products) Produced by rolling semi-
finished steel through varying sets of rolls Includes sheets strips and plates
Flat products are covered under the following 6-digit HS codes 720810
29 Note that import data for steel products includes what are believed to be very small amounts of iron as well as steel both of which are included in the HS codes covered in the scope
As discussed in Part II ldquonational securityrdquo under Section 232 includes both
(1) national defense and (2) critical infrastructure needs
1 Steel is Needed for National Defense Requirements
Steel articles are critical to the nationrsquos overall defense objectives30 The US
Department of Defense (DoD) has a large and ongoing need for a range of steel
products that are used in fabricating weapons and related systems for the nationrsquos
defense31 DoD requirements ndash which currently require about three percent of US
steel production ndash are met by steel companies that also support the requirements for
critical infrastructure and commercial industries
The free market system in the United States requires commercially viable steel
producers to meet defense needs No company could afford to construct and operate
a modern steel mill solely to supply defense needs because those needs are too
diverse In order to supply those diverse national defense needs US steel mills
must attract sufficient commercial (ie non-defense) business The commercial
revenue supports construction operation and maintenance of production capacity
as well as the upgrades research and development required to continue to supply
defense needs in the future See Appendix H for examples
2 Steel is Required for US Critical Infrastructure
Steel also is needed to satisfy requirements for ldquothose industries that the US
Government has determined are critical to minimum operations of the economy and
governmentrdquo32 In the 2001 Report the Department identified 28 ldquocritical
industriesrdquo33 The Critical Infrastructure Assurance Office that identified the
30 ccord 2001 Report at 1 12
31 ISI 2017 public policy agenda available from httpwwwsteelorg~mediaFilesISIReportsISI-2017-
Public-Policy-gendapdfla=en
32 2001 Report at 14 See also 2001 Report at 16 Table 2 for a listing of the 28 critical industries
33 Id
23
ldquocritical industriesrdquo is no longer in existence so for this investigation the Department
instead relied on the industries identified by the US Government in the 2013
Presidential Policy Directive 21 (PPD-21) 34 The Secretary believes that the range
of industries identified in PPD-21 is comparable to the range of critical industries
analyzed in the 2001 Report
Pursuant to PPD-21 there are 16 designated critical infrastructure sectors in
the United States many of which use high volumes of steel (see Appendix I)35 The
16 sectors include chemical production communications dams energy food
production nuclear reactors transportation systems water and waste water systems
Increased quantities of steel will be needed for various critical infrastructure
applications in the coming years The American Society of Civil Engineers
estimates that the United States needs to invest $45 trillion in infrastructure by 2025
and a substantial portion of these projects require steel content36
3 Domestic Steel Production is Essential for National Security
Applications
Domestic steel production is essential for national security Congress in
Section 232(d) directed the Secretary of Commerce and the President to consider
domestic production and the economic welfare of the United States in determining
whether imports threaten to impair national security
In the case of steel the history of US Government actions to ensure the
continued viability of the US steel industry demonstrates that across decades and
Administrations there has been consensus that domestic steel production is vital to
national security
34 PPD-21 can be viewed at httpsobamawhitehousearchivesgovthe-press-office20130212presidential-policy-directive-critical-infrastructure-security-and-resil
35 Department of Homeland Security ritical Infrastructure Sectors httpswwwdhsgovcritical-infrastructure-sectors
36 2017 Infrastructure Report ard merican Society of ivil Engineers httpswwwinfrastructurereportcardorgwp-contentuploads2016102017-Infrastructure-Report-ardpdf
24
Prior significant actions under various statutory authorities to address steel
imports using quotas or tariffs were taken by President George W Bush President
William J Clinton (three times) President George H W Bush President Ronald W
Reagan (three times) President James E Carter (twice) and President Richard M
Nixon all at lower levels of import penetration than at present In the 1970s action
was taken to limit import penetration to approximately 19 percent In the 1980s
import penetration had reached 21 percent and the US Government enacted
correcting measures In the 1990s and 2000s import penetration again reached up to
23 percent which prompted the US Government to take additional actions37 In
2016 import penetration averaged 30 percent and for the first nine months of 2017
imports have consistently averaged over 30 percent of US domestic demand
4 Domestic Steel Production Depends on a Healthy and Competitive
US Industry
US steel producers would be unable to survive purely on defense or critical
infrastructure steel needs In the steel industry it is commercial and industrial
customer sales that generate the relatively steady production needed for
manufacturing efficiency and the revenue volume needed to sustain the business
Sales for critical infrastructure and defense applications are often less predictable
cyclical and limited in volume
Steel manufacturers operating in the United States however have seen their
commercial and industrial business steadily eroded by a growing influx of lower-
priced imported product from countries where steel manufacturing often is
subsidized directly or indirectly The Department of Commerce currently has 164
antidumping and countervailing duty determinations in effect and has 20 additional
cases under investigation to address specific cases See Appendix K
5 Steel Consumed in Critical Industries
In this investigation the issue before the Department is whether steel imports
ldquothreaten to impairrdquo national security See 19 USC sect 1862 As discussed in Part
II the Secretary has determined that in the present case the relevant factors are the
37 See ppendix J for additional detail on US Government actions on steel in the past
25
ldquoserious effects resulting from the displacement of hellip domestic [steel] products by
excessive importsrdquo and the ldquoimpact of foreign competition on the economic welfare
of individual domestic [steel] industriesrdquo that when combined with the circumstance
of massive global excess capacity causes a ldquoweakening of our internal economyrdquo
that ldquomay impair the national securityrdquo38
In a free market system the ability of the domestic steel industry to continue
meeting national security needs depends on the continued capability of the US steel
industry to compete fairly in the commercial marketplace and maintain a financially
viable domestic manufacturing capability This includes the need to have an
adequately skilled workforce for manufacturing as well as to conduct research and
development for future products39 A continued loss of viable commercial
production capabilities and related skilled workforce will jeopardize the US steel
industryrsquos ability to meet the full spectrum of national security requirements
The Department in 2001 determined that the ldquocritical industriesrdquo sector which
is analogous to the more robust critical infrastructure sectors identified pursuant to
PPD-21 would require ldquono more than 3368 million tons of finished steel per yearrdquo40
based on 3088 percent of domestic consumption being used in industries related to
critical infrastructure The Department has now updated the ldquocritical industriesrdquo
calculation from the 2001 Report41 using Census Bureau steel usage figures from
2007 which are the latest available See Appendix I for more detailed information
on steel needs for critical infrastructure
38 19 US sect 1862(d)
39 See 50 US sect 4502(a)(ongress finds that ndash 0 (7) much of the industrial capacity that is relied upon by the United States Government for military production and other national defense purposes is deeply and directly influenced by ndash () the overall competitiveness of the industrial economy of the United States- and the ability of industries in the United States in general to produce internationally competitive products and operate profitably while maintaining adequate research and development to preserve competitiveness with respect to military and civilian production0)
40 2001 Report at 14 The report is not clear whether it is referring to short tons or metric tons While not crucial to the analysis if the figure is in short tons then the equivalent amount in metric tons would be 3056 million metric tons
41 2001 Report at 16 (Table 2)
26
The updated analysis in Appendix I shows that 491 percent of domestic steel
consumption in 2007 was used in critical industries Domestic production in 2007
was 110 million metric tons The 491 percent of domestic consumption used in
critical industries equals 54 million metric tons compared to 3056 million metric
tons (or 3368 million short tons) used in critical industries in 1997 Thus in 10 years
the demand for steel in critical industries increased by 63 percent
B Imports in Such Quantities as are Presently Found Adversely Impact the
Economic Welfare of the US Steel Industry
In the steel sector foreign competition is characterized by substantial and
sustained global overcapacity and production in excess of foreign domestic demand
1 Imports of Steel Products Continue to Increase
The United States is the worldrsquos largest steel importer The top 20 sources of
US imports of steel products accounted for approximately 91 percent of the roughly
36 million metric tons of steel the United States is expected to import in 2017 (see
Figure 2)
Total US imports rose from 259 million metric tons in 2011 peaking at 402
million metric tons in 2014 at the height of the shale hydrocarbon drilling boom For
2017 (first ten months) imports are increasing at a double-digit rate over 2016
pushing finished steel imports consistently over 30 percent of US consumption
27
-
Figure 2 Top US Imports of All Steel Products
Imports for Domestic Consumption Quantity In Metric Tons Ranked By 2017
2017 Rank
Country 2011 2017
(Annualized) Change 2011
2017 (Annualized)
World 25994621 35927141 38
1 Canada 5539448 5800008 5
2 Brazil 2820927 4678530 66
3 South Korea 2572981 3653934 42
4 Mexico 2625104 3249292 24
5 Russia 1269717 3123691 146
6 Turkey 665303 2249456 238
7 Japan 1824393 1781147 -2
8 Germany 978230 1370669 40
9 Taiwan 588036 1251767 113
10 India 735802 854026 16
11 China 1132292 784393 -31
12 Vietnam 120134 727643 506
13 Netherlands 517773 589930 14
14 Italy 276809 515459 86
15 Thailand 72183 417389 478
16 Spain 195907 403091 106
17 United Kingdom 400244 354389 -11
18 South Africa 123001 350425 185
19 Sweden 267685 299170 12
20 United Arab Emirates 63316 290221 358
Top 20 Total 22789285 32744630 44
Source United States Department of Commerce Bureau of the Census Foreign Trade Division IHS Global Trade Atlas Database Revised Statistics for 2011 - 2017 2017 data is annualized based on YTD 2017 through October
As shown in Appendix K antidumping and countervailing duty actions can
address specific instances of unfairly traded steel products However given the large
number of countries from which the United States imports steel and the myriad of
different products involved it could take years to identify and investigate every
instance of unfairly traded steel or attempts to transship or evade remedial duties
28
Moreover US industry has already spent hundreds of millions of dollars in
recent years on ADCVD cases with seemingly no end in sight to their outlays
Smaller steel manufacturers are financially unable to afford these type of cases or
are hesitant to file cases in light of possible market entry retaliation in foreign
markets for finished steel products42
2 High Import Penetration
In contrast to the situation in the 2001 Report where imports of semi-finished
steel represented approximately 7 percent of domestic consumption 43 imports of
finished steel products (ie not including semi-finished steel) currently represent
over 25 percent of US consumption (see Figure 3)44 If imports of semi-finished
products are included the import penetration level has been above 30 percent for the
first ten months of 2017 Import penetration of steel pipe and tube was 74 percent
Figure 3 US Import Penetration of Finished Steel Products (Excludes Semi-Finished)
Source American Iron and Steel Institute YTD data source is through October 2016 and October 2017 Excludes semi-finished imports
42 ongress has specifically expressed concern about the need to maintain small suppliers and the potential adverse impact on military readiness caused by the loss of small suppliers See 50 US sect 4502(a)(8)
43 2001 Report at 31
44 ISIs statistical yearbook reports that about 8 percent of US shipments are made of imported substrate
29
3 High Import to Export Ratio
US imports of steel products which displace demand for domestic steel and
lower production at US plants reached nearly four times the level of exports of
US steel products in 2016 (see Figure 4) The expansion of steel production
capacity outside of the United States in the last decade (Asia the Middle East and
South America) much of it subsidized by national governments continues to
depress world steel prices while making it increasingly difficult for US companies
to export their steel products While US steel producers saw a mild increase in steel
exports from 2005 to 2013 more recently sales to foreign customers have been
declining Exports fell to nine million metric tons in 2016 from a 20-year high of 12
million metric tons annually from 2011 to 2013 Most US steel exports are auto
industry related and are sent to Canada (50 percent by weight in 2016) and Mexico
(39 percent by weight in 2016) Flat products represent the majority of these exports
ndash 57 percent of US steel exports for Canada and 64 percent of steel exports for
North Europe Domestic Hot Rolled Coil 65954 61441 56841 42019 45529 60490
South Europe Domestic Steel Rebar 63659 59834 55166 39411 42768 56853
000
10000
20000
30000
40000
50000
60000
70000
80000
USD
MT
Source Bloomberg Platts Antaike 2017 prices are through December 20 2017
Figure 6 Regional Comparison of Hot Rolled Coil Bench Mark Prices (USDMT)
In 2015 steel prices fell globally As the OECD noted the combined effect
of weakening global steel demand including in the United States growing exports
in many economies and decreases in steelmaking costs led to a very sharp decline
32
in steel prices in 2015 Notwithstanding these effects prices for steel in the US
remained substantially higher than in any other area However relative to prices
between 2010 and 2013 prices are still relatively depressed
Global excess steel production weakens the pricing power of US steel
producers US steel producersrsquo costs are higher than the costs for producers in other
regions due to higher taxes healthcare environmental and other regulatory
expenses Higher US steel prices incentivize importing lower-cost foreign steel
Moreover excess production and lower prices in regions proximate to state
subsidized enterprises displace purchases from market based steel exporters and add
pressure on those market based suppliers to export to the US The effect of global
excess steel production on US steel prices and import levels is discussed in greater
detail in Appendix L
5 Steel Mill Closures
US steel mill closures continue eroding overall US steel mill capacity and
employment Many US steel mills have been driven out of business due to
declining steel prices global overcapacity and unfairly traded steel Since 2000 the
United States has lost over 25 percent of its basic oxygen furnace facilities with the
closure of six facilities RG Steel in Sparrows Point Maryland RG Steel in
Steubenville Ohio RG Steel in Warren Ohio ArcelorMittal in East Chicago
Indiana ArcelorMittal in Weirton West Virginia and US Steel in Fairfield
Alabama
In addition four electric arc furnace steel facilities have closed Evraz in
Claymont Delaware ArcelorMittal in Georgetown South Carolina Gerdau in Sand
Springs Oklahoma and Republic Steel in Lorain Ohio Most recently
ArcelorMittal has announced the closure of its plate rolling mill in Conshohocken
Pennsylvania because of sagging commercial sales attributed to surging imports of
low-cost steel product and flat defense demand45
The closures of these facilities have had a significant impact on the US
industrial workforce and local economies RG Steel suffered three closures
45 owden M rcelor Mittal to Shut P Plate Mill merican Metal market September 18 2017
33
Sparrows Point Maryland Steubenville Ohio and Warren Ohio After filing for
bankruptcy in 2012 more than 2000 employees were displaced in Maryland alone
and another 2000 in the Midwest The company cited weak demand in the steel
industry as well as lack of financing as key contributors to the closure46
Closures of smaller steel mills have had equally devastating impacts on
employment Gerdau Sand Springs in Oklahoma lost 300 employees after closing
in 2009 because of a long-term drop in demand for steel47 Sand Springs was the
last remaining steel plant in Oklahoma and had been in production since the 1920s
In 2013 at least 345 employees were laid off in response to the closure of the
Claymont steel mill in Delaware The Governor of Delaware Jack Markell
attributed the financial difficulties of the facility to ldquosubdued market demand and the
high volume of importsrdquo48
Similar difficulties were cited by the ArcelorMittalrsquos Georgetown South
Carolina facility and US Steelrsquos location in Fairfield Alabama both of which
closed in 2015 Layoffs for these two corporations totaled 226 and more than 1100
employees respectively Both companies attributed the layoffs to financial losses
and ultimately to facility closures due to the rise in competition from inexpensive
imports49
Even temporary idling of steel plants threatens the US steel industry as there
are significant financial costs with re-opening a steel mill Multiple US facilities
remain idled there are four idled basic oxygen furnace facilities two each in
Kentucky and Illinois representing almost one third of the remaining basic oxygen
46 usiness Journal Unforeseen onditions loses Warren Steel Holdings January 12 2016 httpbusinessjournaldailycomutilities-cut-to-warren-steel-holdings- altimore rew Six reasons why the Sparrows Point steel mill collapsed May 25 2012 httpsbaltimorebrewcom20120525six-reasons-why-the-sparrows-point-steel-mill-collapsed
47 News on 6 Sand Springs Steel Plant May lose June 9 2009 httpwwwnewson6comstory10500785sand-springs-steel-plant-may-close
48 usiness Insider Shutdown of Russian Steel Mill in Delaware ould Send a Message bout US Trade October 17 2013 httpwwwbusinessinsidercomevraz-closes-claymont-steel-2013-10
49 Lcom US Steel lays off 200 more workers in Fairfield March 18 2016 httpwwwalcombusinessindexssf201603us_steel_lays_off_200_more_worhtml
34
furnace facilities in United States50 In addition there are idled pipe and tube mills
in Texas Ohio and Alabama Once production is halted at these facilities it is not
always possible to bring back the highly skilled workforce needed to operate them
When steel mill restarts do occur additional costs are often incurred for specialized
worker training and production ramp-up
In addition when a steel mill closes at a given location the workers find other
occupations move to other steel mills or remain indefinitely unemployed After a
significant period of unemployment much of the specialized skill required by steel
mill workers is forgotten Furthermore it is typically not easy to find and recruit
displaced workers who may live hundreds or thousands of miles away
6 Declining Employment Trend Since 1998
US steel industry employment has declined 35 percent (216400 in 1998 to
139800 in January 2016 - December 2016) including 14100 lost jobs between 2015
and 2016 While employment numbers increased slightly in certain years the trend
is dramatically downward (see Figure 7) Layoffs defer formal plant closings but
are an indication of financial distress Layoffs in the last two years have been
particularly acute in steel producers with pipe and tubular facilities In addition to
layoffs there are permanent closures and bankruptcies in the industry 51
The loss of skilled workers is especially detrimental to the long-term health
and competitiveness of the industry The unstable and declining employment
outlook for the industry also dissuades younger workers from wanting to participate
in the future US steel industry The inability to rapidly add skilled workers to the
industry negatively affects current manufacturing capabilities This is especially
problematic in the event of a major production surge or mobilization
Source Bureau of Labor Statistics using the annual average of seasonally adjusted employees NAICS Codes 3311 and 3312 updated 11222017
Figure 7 Combined Steel Industry Employment (Yearly Average)
7 Trade Actions ndash Antidumping and Countervailing Duties
The number of US antidumping and countervailing duty measures in effect
illustrates the scope of the problem confronting the US steel industry In 1998 at
the height of that periods steel crisis there were just over 100 antidumping and
countervailing duty cases against finished steel products52 Today there are 164
antidumping and countervailing duty orders in effect for steel with another 20 steel
investigations currently ongoing and another waiting to take effect through
publication in the Federal Register (see Appendix K for a full listing of Steel
Antidumping and Countervailing Duty Orders in Effect) This represents a 60
percent increase in cases since the last time the Department investigated steel in
2001
8 Loss of Domestic Opportunities to Bidders Using Imported Steel
Despite efforts to level the playing field through ADCVD orders there are
numerous examples of US steel producers being unable to fairly compete with
foreign suppliers including the lack of ability to bid on some critical US
infrastructure projects Due to unfair competition particularly from foreign state-
52 Global Steel Trade Structural Problems and Future Solutions- Department of ommerce- July 2000
36
owned enterprises US steel producers have lost out on US business opportunities
Some examples include Chinese companies providing steel for the eastern span of
the San Francisco-Oakland Bay Bridge as well as the Alexander Hamilton Bridge
over the Harlem River in New York53
The Alliance for American Manufacturingrsquos statement before the
Congressional Steel Caucus (March 2017) identified three other recent infrastructure
projects in New York that have used or will use heavily subsidized or possibly
dumped foreign steel the Verrazano-Narrows Bridge LaGuardia Airport and the
Holland Tunnel Two major US cities ndash Boston and Chicago ndash have contracted
with Chinese companies to build new subway cars primarily constructed with
imported steel for their respective transportation systems54
9 Financial Distress
Rising levels of imports of steel continue to weaken the US steel industryrsquos
financial health Years of running on low-profit margins or at a loss have weakened
an industry that continues to face an ever-increasing wave of steel imports The US
industry as a whole has operated on average with negative net income from 2009-
2016 Net income for US-owned steel companies has averaged only $162 million
annually since 2010 challenging the financial viability of this vital industry (see
Figure 8)
53 New York Times ridge omes to San Francisco With a Made-in-hina Label June 25 2011 httpwwwnytimescom20110626businessglobal26bridgehtml
54 Reuters hinas RR lands $13 billion hina rail car project March 10 2016 httpwwwreuterscomarticleus-crrc-usa-idUSKN0W17I
37
The Stern School of Business at New York University calculates that US steel
industry participants in the last five years experienced negative net income of 178
percent Compounded growth in revenue for the past five years in the steel industry
has been a negative 7 percent55 The loss of revenue has caused US steel
manufacturers both large and small to defer or eliminate production facility capital
investments and funding for research and development Even though there was a
slight uptick in net income for the first quarter in 2017 over the fourth quarter of
2016 margins remain poor compared to historic levels
Not only have earnings before interest taxes depreciation and amortization
(EBITDA) been shallow for steel producers in the United States many of them are
burdened with high levels of debt as much as 119 times of earnings for one major
producer (see Figure 9)56 While some companies are starting to pay down debt
55 Historical (ompounded nnual) Growth Rates by Sector swath Damodaran New York University Stern School
of usiness January 2017 (see httppagessternnyuedu~adamodarNew_Home_Pagedatafile histgrhtml) 56 Nucor operates mini-mills that use electric arc furnaces to produce high demand steel products primarily with recycled steel scrap From a financial perspective this business model allows Nucor to be highly price competitive but the company produces a narrower range of flat steel products than integrated steel mills The
mini-mills can weather bad economic times because they have lower energy costs and can regulate production
38
others have not been able to do so primarily because of slack demand for
domestically produced steel in the face of competition from imported products
Absent increases in steel production volume and pricing one leading law firm
specializing in insolvency White amp Case observes that some steelmakers in the
United States may soon have to renegotiate loan agreements to extend maturities
those that are not able to may have to consider Chapter 11 bankruptcy57
No capital intensive industry can survive with such poor margins over the
longer term The extensive leverage in the industry shown in Figure 9 adds to the
more easily asic oxygen furnace plants have higher fixed operating costs because they directly convert iron ore and other raw materials along with scrap into steel using more energy-intensive processes
57 Losing Strength US Steel Industry nalysis Scott Griesman White ase pril 16 2016 (see httpswwwwhitecasecompublicationsarticlelosing-strength-us-steel-industry-analysis)
39
likelihood of further closures if the present high level of imports continues to force
US steel mills to operate well below profitable capacity utilization rates
10 Capital Expenditures
The ability of US manufacturers of iron and steel products to fund capital
expenditures for new production plants as well as facility modernization and
advanced manufacturing equipment has been limited by falling revenue and reduced
profits As shown in Figure 10 annual capital expenditures for companies making
iron and steel ingot bars rods plate and other semi-finished products wavered from
$57 billion to $51 billion for 2010-2012 before ramping to $71 billion in 2013
Figure 10 Annual Capital Expenditures
Iron Steel and Ferroalloys Steel NAICS Codes 3311 and 3312 Combined
Millions of Current Dollars
Annual Capital Expenditures Survey 2010 2011 2012 2013 2014 2015
A Structures [New amp Used Structures Combined] 1026 1322 1564 1157 724 580
B Equipment [New amp Used Equipment Combined] 4634 4572 3592 5954 3139 2531
C Total Capital Expenditures 5661 5894 5157 7111 3863 3110
D (Unweighted) Payroll of Reporters Total Payroll of Firms Classified in Industry group
86 84 80 61 86 84
Source US Census Bureau Annual Capital Expenditures Survey wwwcensusgovprograms-surveysaceshtml
Confronted with receding orders for products and declines in income in 2013
iron and steel companies operating production facilities in the United States started
curtailing capital investments Total capital spending dropped to $387 billion in
2014 and slid further to $311 billion in 2015 ndash 32 percent below 2010 levels of $566
billion
The decline in capital expenditures reflected similar drops in net sales which
plummeted from $1296 billion in 2014 to $102 billion in 2015 Income after taxes
40
for US iron and steel manufacturers fell from $248 billion in the same two-year
period to a massive loss of $35 billion in 2015
C Displacement of Domestic Steel by Excessive Quantities of Imports has the
Serious Effect of Weakening Our Internal Economy
1 Domestic Steel Production Capacity is Stagnant and Concentrated
According to the OECD US steel production capacity has remained stagnant
at an average of approximately 1143 million metric tons for more than a decade
from 2006-2016 (see Figure 11) For 2016 the rated maximum capacity was 113
million metric tons for existing basic oxygen furnace and electric arc furnace
Source Organization for Economic Cooperation and Development (OECD) 2017 capacity is a forecast
41
42
The present situation with respect to basic oxygen furnace production is
significantly worse than the situation assessed by the Department in the 2001 Report
As shown in Figure 13 below the number of basic oxygen furnace facilities and units
has declined precipitously since 1995 In 2000 there were 105 companies that
produced raw steel at 144 locations59 while today there are only 38 companies
producing steel at 93 locations a 64 percent and 36 percent reduction respectively
Most importantly in 2000 thirteen companies ldquooperated integrated steel mills
with an average of 35 blast furnaces in continuous operation during the yearrdquo60 while
today there are only three companies operating 13 basic oxygen furnaces These are
77 percent and 60 percent reductions respectively As a result today only 26 percent
of domestic steel is produced from raw materials in the United States as compared
to 53 percent in 2000
As noted earlier since 2000 there has been over a 25 percent reduction in the
number of basic oxygen furnaces operating in the United States and 33 percent of
the remaining basic oxygen furnaces are currently idled In the Secretaryrsquos view a
further reduction in basic oxygen furnace capacity which is especially important to
the ability of domestic industry to meet national security needs is inevitable if the
present imports continue or increase
This would be a serious ldquoweakening of our internal
economyrdquo and place the United States in a position where it is unable to be certain
59 2001 Report at 21
60 Id
43
it could meet demands for national defense and critical industries in a national 61emergency
Figure 13 Basic Oxygen and Electric Arc Facilities and Units Located in the United States 1975 - 2016
Year asic Oxygen Furnace Facilities
asic Oxygen Furnace Units
Electric rc Furnace Facilities
Electric rc Furnace Units
1975 38 90 -- --
1980 33 78 -- --
1985 27 66 -- --
1990 24 61 127 246
1995 22 56 116 218
2000 19 50 122 174
2005 17 46 115 169
2010 16 44 108 164
2015 13 31 98 154
2016 13 31 98 154 Source US Department of CommerceBIS American Iron and Steel Institute Association for Iron amp Steel Technology Steel Manufacturers Association August 2017 Estimated
Basic Oxygen Furnace Basic Oxygen Furnaces (BOF) are the dominant steelmaking technology globally accounting for 74 of the worlds total output of crude steel in 2016 OF share of production in the US was 33 in 2016 and has been slowly declining due primarily to the advent of the Greenfield electric arc furnace (EF) flat-rolled mills The primary raw materials for the BOF are liquid hot metal (iron) from the blast furnace and steel scrap [1] These are charged into the BOF vessel Oxygen (gt995 pure) is blown into the OF at supersonic velocities It oxidizes the carbon and silicon contained in the hot metal liberating great quantities of heat which melts the scrap Source Steelorg
Electric Arc Furnace The Electric Arc Furnace (EAF) operates as a batch melting process producing batches of molten steel known heats The EF process uses steel scrap and iron units melting them using electricity to make new steel EF output accounted for 66 of US steel production in 2016 Source Steelorg
[1 The last Furnace chemically reduces and physically converts iron oxides into liquid iron called hot metal The blast furnace is a huge steel stack lined with refractory brick where iron ore coke and limestone are dumped into the top and preheated air is blown into the bottom The raw materials require six to eight hours to descend to the bottom of the furnace where they become the final product of liquid slag and liquid iron Source Steelorg
In contrast to the situation in the United States the leading global producers
of steel (Brazil South Korea Japan Russia Germany and especially China)
primarily rely on basic oxygen furnace capacity rather than electric arc furnace
capacity (see Figure 14) Each of these economic competitors to the United States
possess critical research development and production capabilities that the United
61 See infra sections 4 and 5 for a further discussion of the inability to meet surge requirements in an emergency
44
rsquo
States is in danger of losing if imports continue to force US steel producers to
operate at uneconomic capacity utilization levels
A further reduction in domestic basic oxygen furnace capacity would put the
United States at serious risk of becoming dependent on foreign steel to support its
critical industries and defense needs Allowing this decline to continue represents a
ldquoweakening of our internal economy that may impair national securityrdquo which the
Congress has directed the Secretary to advise the President of under the Section 232
See 19 USC sect 1862(d)
Figure 14 The Top 20 Countries Exporting to the US ndash BOF vs EAF Capacity
Rank Top Import Sources in 2016 in Tonnage
Terms
2015 OF Share
2015 EF Share
2015 Other Share
pprox ountry s verage apacity Utilization in 2016
(OED) World 7420 2520 050 67
1 Canada 5380 4620 62
2 Brazil 7820 2020 57
3 South Korea 6960 3040 80
4 Mexico 2970 7030 75
5 Turkey 3500 6500 65
6 Japan 7710 2290 80
7 Russia 6630 3050 310 76
8 Germany 7040 2960 72 (EU 28)
9 Taiwan 6230 3770 75
10 Vietnam 2500 5990 1520 32
11 China 9390 610 69
12 Netherlands 9860 150 72 (EU 28)
13 Italy 2130 7820 72 (EU 28)
14 United Kingdom 8300 1700 72 (EU 28)
15 France 6560 3440 72 (EU 28)
16 India 4290 5710 75
17 Australia 7760 2240 63
18 Spain 3170 6830 72 (EU 28)
19 Sweden 6610 3390 72 (EU 28)
20 South Africa 5650 4350 585 Source World Steel- Production Share Figures for 2015 US ensus ureau (ccessed Via HIS) ndash Import Growth Rates OED 2017 Q2 Market ssessment ndash pproximate apacity Utilization
This is not a hypothetical situation The Department of Defense already finds
itself without domestic suppliers for some particular types of steel used in defense
45
products including tire rod steel used in military vehicles and trucks62 While the
United States has many allies that produce steel relying on foreign owned facilities
located outside the United States introduces significant risk and potential delay for
the development of new steel technologies and production of needed steel products
particularly in times of emergency The Secretary notes that the authority for the
Department of Defense to place its order ahead of commercial orders on a mandatory
basis does not extend to foreign-owned facilities outside the United States63
In the case of critical infrastructure the United States is down to only one
remaining producer of electrical steel in the United States (AK Steel ndash which is
highly leveraged) Electrical steel is necessary for power distribution transformers
for all types of energy ndash including solar nuclear wind coal and natural gas ndash across
the country If domestic electrical steel production as well as transformer and
generator production is not maintained in the US the US will become entirely
dependent on foreign producers to supply these critical materials and products64
Without an assured domestic supply of these products the United States cannot be
certain that it can effectively respond to large power disruptions affecting civilian
populations critical infrastructure and US defense industrial production
capabilities in a timely manner
2 Production is Well Below Demand
Demand for steel products in the United States (see Figure 15) increased from
1001 million metric tons in 2011 to 1175 million metric tons in 2014 then declined
to 998 million metric tons in 2016 Demand in 2017 is projected to rebound to
1077 million metric tons During the 2011 to 2016 period US production of steel
products dropped from 864 million metric tons in 2011 to 786 million metric tons
in 2016 with a four percent increase expected in 2017
62 Letter from Defense Logistics gency olumbus OH to ISOTE ugust 1 2017
63 See Defense Priorities and llocations System Program (DPS) wwwdcmamilDPS
64 United States ongress ongressional Steel aucus Statement of Roger Newport EO K Steel orporation (on behalf of the merican Iron and Steel Institute) March 29 2017
46
For the six-year period US domestic steel production supplied only 70
percent of the average demand even though available US domestic steel production
capacity during that period could have on average supplied up to 100 percent of
demand (US steel producers would be running at 92 percent capacity utilization for
this period) with approximately 13 million metric tons of additional capacity
remaining
Figure 15 US Steel Market Snapshot (millions of metric tons)
2011 2012 2013 2014 2015 2016 2017 YTD
2017 nnualized
Total Demand for Steel in US (Production + Imports - Exports)
US Annual Production (Liquid) 864 887 869 882 788 786 615 819
Sources United States Department of ommerce ureau of the ensus merican Iron and Steel Institute alculations based on industry and trade data
3 Utilization Rates are Well Below Economically Viable Levels
Overall steel mill production capacity utilization has declined from 87 percent
in 1998 to 814 percent in 2008 to 694 percent in 2016 (see Figure 16) For the
most recent six-year period (2011- 2016) the average utilization rate was 74 percent
Industry analysts note that utilization of 80 percent or more is typically
necessary for sustained profitability among other factors65 For most capital and
energy-intensive US steel producers capacity levels of 80 percent or higher are
required to maintain facilities carry out periodic modernization service company
debt and fund research and development
65 Market Realist Why steel investors are mindful of capacity utilization rates October 2 2014 httpmarketrealistcom201410investors-mindful-capacity-utilization-rate See also httpmarketrealistcom201509upstream-exposure-impact-steel-companies
47
When steel factory utilization falls costs per unit of steel product rises
reducing profit margins and product pricing flexibility Higher capacity utilization
usually results in lower per-unit product costs and higher overall profit66 Over 80
percent is a healthy capacity utilization rate and a rate at which most companies
would be profitable
The US steel industry uses 80 percent as a benchmark for minimum
operational efficiency Moreover the steel industry is capable of reaching and
sustaining 80 percent capacity utilization or higher During the 2002-2008 period
US steel companies operated at an average 874 percent level 67
These industry assessments are consistent with a 1983 report on ldquoCritical
Materials Requirements in the US Steel Industryrdquo in which the Department
66 Houston hronical apacity Utilization and Effects on Product and Profit httpsmallbusinesschroncomcapacity-utilization-effects-product-profit-67046html- steel industry sources
67 httpmarketrealistcom201509upstream-exposure-impact-steel-companieshtml (Its important to note how changes in capacity utilization rates impact a companys earnings For example we see a big jump in earnings when utilization rates improve from 80 percent to 85 percent However incremental benefits are lower when utilization rates increase from 90 percent to 95 percent )
48
explained that ldquo[c]apability utilization or capacity use which in effect describes the
efficiency of an industrys use of capital is a prime determinant of profitability
Domestic steel producers were operating at about 55 percent capability for the first
half of 1982 The comparable rate for the first half of 1981 was 85 percent This
current rate is probably well below a breakeven point for most producers whereas
1981 was profitable for nearly all producersrdquo68
4 Declining Steel Production Facilities Limits Capacity Available for a
National Emergency
The number of steel production facilities located in the US continues to
decline As shown earlier in Figure 13 from 1975 to 2016 the number of basic
oxygen furnace facilities decreased from 38 to 13 Similarly from 1990 to 2016
the number of electric arc furnace facilities decreased from 127 to 98
Due to this decline in facilities domestic steel producers have a shrinking
ability to meet national security production requirements in a national emergency
The US Department of Commerce Census Bureau regularly surveys plant capacity
and has found that steel producers are quickly shedding production capacity that
could be used in a national emergency The Census Bureau defines national
emergency production as the ldquogreatest level of production an establishment can
expect to sustain for one year or more under national emergency conditionsrdquo69 From
2011 to 2017 steel producers increased the utilization of the surge capacity they
would have during a national emergency from 542 percent to 682 percent (see
Figure 17) As steel producers use more of this emergency capacity there is an
increasingly limited ability to ramp up steel production to meet national security
needs during a national emergency
68 Department of ommerce ritical Materials Requirements in the US Steel Industry March 1983 at 16-17
69 US Dept of ommerce ensus ureau Survey of Plant apacity 2011-2017
49
0
10
20
30
40
50
60
70
80
2011 2012 2013 2014 2015 2016 2017
Figure 17 Steel Industry Utilization of Emergency Capacity (2011-2017 Quarter 1)
Source US Department of ommerce ensus ureau Survey of Plant apacity
Percent
The ability to increase steel production during a national emergency
continues to diminish as the number of steel production facilities continues to
decline If the US requires a similar increase in steel production as it did during
previous national emergencies domestic steel production capacity may be
insufficient to satisfy national security needs If a national emergency were to
occur at present utilization levels domestic steel producers would be able to
increase production by 146 percent
For comparison from 1938 through 1946 the US increased the production
of pig iron and ferro-alloys by 217 percent and increased the production of steel
ingots and castings by 210 percent to meet the demands of fighting a global war 70
From 1960 through 1973 during the Vietnam era the US increased steel
production by 152 percent 71 Should the US once again experience a conflict on
the scale of the Vietnam War steel production capacity may be slightly insufficient
70 US Dept of ommerce ensus ureau Statistical bstract of the United States 1948 Page 876
71 US Dept of ommerce ensus ureau Statistical bstract of the United States 1978 Page 830
50
to meet national security needs But if the US were to experience a conflict
requiring the production increase seen during the Second World War the existing
domestic steel production capacity would be unable to meet national security
requirements
Increasing steel production capacity once a large-scale national emergency
has arisen would take a significant amount of time According to the American Iron
and Steel Institute the replacement of a basic oxygen furnace facility takes more
than a year to complete Therefore the lack of spare domestic steel production
capacity and the possible inability to sufficiently increase production during a
national emergency may impair the national security of the United States
D Global Excess Steel Capacity is a Circumstance that Contributes to the
Weakening of the Domestic Economy
1 Free markets globally are adversely affected by substantial chronic
global excess steel production led by China
Numerous studies reports and investigations have documented the global excess
steel capacity with China having the largest installed capability (see Figure
18)727374 OECD analyses show that the worldrsquos nominal crude steelmaking capacity
reached about 24 billion metric tons in 2016 an increase of 127 percent compared
to the 2000 level Most of the capacity expansion was planned for construction and
manufacturing activities and to help build the infrastructure necessary for economic
development ndash most in non-OECD countries Furthermore the OECD reports that
while steel capacity increased at a steady rate world steel demand contracted sharply
in the aftermath of the global economic and financial crisis of 2008 Global demand
for steel recovered slowly in the years following 2008 However since 2013 global
steel demand has flattened thereby widening the capacitydemand gap By 2015 the
gap reached over 700 million metric tons
72 run L (2016) Overcapacity in Steel Chinarsquos Role in a Global Problem Washington D lliance for merican Manufacturing httpaamwebs3amazonawscomuploadsresourcesOvercapacityReport2016_R3pdf
73 Price Weld El-Sabaawi L Teslik (2016) apacity Runs Riot Washington D Wiley Rein LLP
74 OED Reports (2016) httpwwwoecdorgindustryind82nd-session-of-the-steel-committeehtm
51
The vast size of the capacitydemand gap means that steel demand alone
cannot increase enough to balance the global overcapacity problem which is
particularly prevalent in China Chinese excess capacity estimated at more than 300
million metric tons dwarfs total US production capacity (see Figure 19)75
The effect of global overcapacity and excess steel production on US steel
prices and import levels is discussed in greater detail in Appendix L While US
steel production capacity has remained flat since 2001 other steel producing nations
have increased their production capacity with China alone able to produce as much
steel as the rest of the world combined
75 OED High Level Meeting Excess apacity and Structural djustment in the Steel Sector pril 2016 httpwwwoecdorgstiindackground20document20No202_FINL_Meetingpdf
52
0
500
1000
1500
2000
2500 M
illio
ns
of
Met
ric
Ton
s
Figure 19 Steelmaking Capacity
World Total China United States
Source OECD
2009 2010 2011 2012 2013 2014 2015 2016 2017
Several countries (India Iran and Indonesia) in addition to China continue to
add production capacity despite slack global demand According to the OECD Steel
Committee Chairrsquos statement from March 2017 ldquoNew data suggest that nearly 40
million metric tons of gross capacity additions are currently underway and could
come on stream during the three-year period of 2017-19 while an additional 536
million metric tons of capacity additions are in the planning stages for possible start-
up during the same time periodrdquo76 This additional global steel capacity coming
online represents over 80 percent of existing US steelmaking production capacity
demonstrating that the import challenge to US industry is continuing to grow
2 Increasing global excess steel capacity will further weaken the internal
economy as US steel producers will face increasing import competition
These additions to worldwide steelmaking capacity will only exacerbate the
situation because they will further lower global operating utilization rates including
in the United States Growth in foreign government-subsidized steel production is
progressively weakening the financial health of the US steel industry as other steel
76 OED 82nd Session of the OED Steel ommittee ndash hairs Statement March 2017 httpwwwoecdorgstiind82-oecd-steel-chair-statementhtm
53
producing countries export more steel to the US to in part to offset the loss of
regional markets to Chinese steel (see Appendix L)
The US share of global production continues to steadily decline In the year
2000 when President Clinton signed into a law a statute granting China permanent
normal trade relations status77 the US share of global steel production stood at 12
percent78 Since that point in time the US share of global steel production continued
an inexorable decline as other countries and especially China began to increase
production The US share of global steel production fell to 8 percent in 200579 5
percent in 200980 and 48 percent in 201581 In contrast China commanded a 497
percent share of global steel production in 201582
If even half of the planned additional global capacity identified by the OECD
Steel Committee is built and the related new production finds its way into the US
it will drive the operating rate of US steel mills to less than 50 percent of capacity
This will cause a substantial and unsustainable negative cash situation that will
ultimately result in multiple corporate bankruptcies due to heavy debt loads and
related declines in steel production capacity and employment levels
77 Public Law 106-286 n act to authorize extension of nondiscriminatory treatment (normal trade relations treatment) to the Peoples Republic of hina and to establish a framework for relations between the United States and the Peoples Republic of hina October 10 2000 httpswwwgpogovfdsyspkgPLW-106publ286
78 US Dept of ommerce ensus ureau Statistical bstract of the United States 2012 Page 574
79 Id
80 Id
81 Steel Statistical Yearbook 2016 World Steel ssociation httpswwwworldsteelorgendamjcr37ad1117-fefc-4df3-b84f-6295478ae460Steel+Statistical+Yearbook+2016pdf
82 Steel Statistical Yearbook 2017 World Steel ssociation httpswwwworldsteelorgendamjcr3e275c73-6f11-4e7f-a5d8-23d9bc5c508fSteel+Statistical+Yearbook+2017pdf
54
VI CONCLUSION
The Secretary has determined that the displacement of domestic steel by
excessive imports and the consequent adverse impact of those quantities of steel
imports on the economic welfare of the domestic steel industry along with the
circumstance of global excess capacity in steel are ldquoweakening our internal
economyrdquo and therefore ldquothreaten to impairrdquo the national security as defined in
Section 232
The continued rising levels of imports of foreign steel threaten to impair the
national security by placing the US steel industry at substantial risk of displacing
the basic oxygen furnace and other steelmaking capacity and the related supply
chain needed to produce steel for critical infrastructure and national defense
In considering ldquothe impact of foreign competition on the economic welfare of
individual domestic [steel] industriesrdquo and other factors Congress expressly outlined
in Section 232 the Secretary has determined that the continued decline and
concentration in steel production capacity is ldquoweakening of our internal economy
and may impair national securityrdquo See 19 USC sect 1862(d)
Global excess steel capacity is a circumstance that contributes to the
ldquoweakening of our internal economyrdquo that ldquothreaten[s] to impairrdquo the national
security as defined in Section 232 Free markets globally are adversely affected by
substantial chronic global excess steel production led by China While US steel
production capacity has remained flat since 2001 other steel producing nations have
increased their production capacity with China alone able to produce as much steel
as the rest of the world combined This overhang of excess capacity means that US
steel producers for the foreseeable future will face increasing competition from
imported steel as other countries export more steel to the United States to bolster
their own economic objectives
Since defense and critical infrastructure requirements alone are not sufficient
to support a robust steel industry US steel producers must be financially viable and
competitive in the commercial market to be available to produce the needed steel
output in a timely and cost efficient manner In fact it is the ability to quickly shift
55
production capacity used for commercial products to defense and critical
infrastructure production that provides the United States a surge capability that is
vital to national security especially in an unexpected or extended conflict or national
emergency It is that capability which is now at serious risk as imports continue to
take business away from domestic producers these producers are in danger of falling
below minimum viable scale and are at risk of having to exit the market and
substantially close down production capacity often permanently
Steel producers in the United States are facing widespread harm from
mounting imports Growing global steel capacity flat or declining world demand
the openness of the US steel market and the price differential between US market
prices and global market prices (often caused by foreign government steel
intervention) ensures that the US will remain an attractive market for foreign steel
absent quotas or tariffs Excessive imports of steel now consistently above 30
percent of domestic demand have displaced domestic steel production the related
skilled workforce and threaten the ability of this critical industry to maintain
economic viability
A US steel industry that is not financially viable to invest in the latest
technologies facilities and long-term research and development nor retain skilled
workers while attracting a next-generation workforce will be unable to meet the
current and projected needs of the US military and critical infrastructure sectors
Moreover the market environment for US steel producers has deteriorated
dramatically since the 2001 Report when the Department concluded that imports of
iron ore and semi-finished steel do not ldquofundamentally threatenrdquo the ability of US
industry to meet national security needs83
The Departmentrsquos investigation indicates that the domestic steel industry has
declined to a point where further closures and consolidation of basic oxygen furnace
facilities represents a ldquoweakening of our internal economyrdquo as defined in Section
232 The more than 50 percent reduction in the number of basic oxygen furnace
83 2001 Report at 28 ndash 37 s noted supra note 16 the 2001 Report added the qualifier fundamentally which is not found in the statutory text The Secretary in this report uses the statutory standard of threatens to impair without such qualification
56
facilities ndash either through closures or idling of facilities due to import competition ndash
increases the chance of further closures that place the United States at serious risk
of being unable to increase production to the levels needed in past national
emergencies The displacement of domestic product by excessive imports is having
the serious effect of causing the domestic industry to operate at unsustainable levels
reducing employment diminishing research and development inhibiting capital
expenditures and causing a loss of vital skills and know-how The present capacity
operating rates for those remaining plants continue to be below those needed for
financial sustainability These conditions have been further exacerbated by the 22
percent surge in imports thus far in 2017 compared with 2016 Imports are now
consistently above 30 percent of US domestic demand
It is evident that the US steel industry is being substantially impacted by the
current levels of imported steel The displacement of domestic steel by imports has
the serious effect of placing the United States at risk of being unable meet national
security requirements The Secretary has determined that the ldquodisplacement of
domestic [steel] products by excessive importsrdquo of steel is having the ldquoserious effectrdquo
of causing the ldquoweakening of our internal economyrdquo See 19 USC sect 1862(d)
Therefore the Secretary recommends that the President take corrective action
pursuant to the authority granted by Section 232 See 19 USC sect 1862(c)
57
VII RECOMMENDATION
Prior significant actions to address steel imports (quotas andor tariffs) were
taken under various statutory authorities by President George W Bush President
William J Clinton (three times) President George H W Bush President Ronald W
Reagan (three times) President James E Carter (twice) and President Richard M
Nixon all at lower levels of import penetration than the present level which is above
30 percent
Due to the threat of steel imports to the national security as defined in Section
232 the Secretary recommends that the President take immediate action by adjusting
the level of imports through quotas or tariffs on steel imported into the United States
as well as direct additional actions to keep the US steel industry financially viable
and able to meet US national security needs The quota or tariff imposed should be
sufficient after accounting for any exclusions to enable the US steel producers to
be able to operate at about an 80 percent or better of the industryrsquos capacity
utilization rate based on available capacity in 2017
In 2016 US steel production was 786 million metric tons and US capacity
was 1133 million metric tons which represents a 694 percent capacity utilization
rate If current import trends for 2017 continue continued imports without any
action are projected to be 360 million metric tons an increase over 2016 of 60
million metric tons Even with US demand projected to increase to 1073 from
998 million metric tons increased imports mean US capacity utilization is forecast
to rise only to 723 percent a non-financially viable and unsustainable level of
operation
By reducing import penetration rates to approximately 21 percent US
industry would be able to operate at 80 percent of their capacity utilization
Achieving this level of capacity utilization based on the projected 2017 import levels
will require reducing imports from 36 million metric tons to about 23 million metric
tons If a reduction in imports can be combined with an increase in domestic steel
demand as can be reasonably expected rising economic growth rates combined with
the increased military spending and infrastructure proposals that the Trump
Administration has planned then US steel mills can be expected to reach a capacity
58
utilization level of 80 percent or greater This increase in US capacity utilization
will enable US steel mills to increase operations significantly in the short-term and
improve the financial viability of the industry over the long-term
Recommendation to Ensure Sustainable Capacity Utilization and
Financial Health
Impose a Quota or Tariff on all steel products covered in this investigation
imported into the United States to remove the threatened impairment to
national security The Secretary recommends adjusting the level of imports through
a quota or tariff on steel imported into the United States
Alternative 1 ndash Global Quota or Tariff
1A Global Quota
Impose quotas on all imported steel products at a specified percent of the 2017
import level applied on a country and steel product basis
According to the Global Trade Analysis Project (GTAP) Model produced by
Purdue University a 63 percent quota would be expected to reduce steel imports by
37 percent (133 million metric tons) from 2017 levels Based on imports from
January to October import levels for 2017 are projected to reach 360 million metric
tons The quotas adjusted as necessary would result in imports equaling about 227
million metric tons which will enable an 80 percent capacity utilization rate at 2017
demand levels (including exports) Application of an annual quota will reduce the
impact of the surge in steel imports that has occurred since the beginning of 2017
1B Global Tariff
Apply a tariff rate on all imported steel products in addition to any
antidumping or countervailing duty collections applicable to any imported steel
product
Similar to what is anticipated under a quota according to the Global Trade
Analysis Project (GTAP) Model produced by Purdue University a 24 percent tariff
on all steel imports would be expected to reduce imports by 37 percent (ie a
59
reduction of 133 million metric tons from 2017 levels of 360 million metric tons) 84
This tariff rate would thus result in imports equaling about 227 million metric tons
which will enable an 80 percent capacity utilization rate at 2017 demand levels
(including exports)85
Alternative 2 ndashTariffs on a Subset of Countries
Apply a tariff rate on all imported steel products from Brazil South Korea
Russia Turkey India Vietnam China Thailand South Africa Egypt Malaysia and
Costa Rica in addition to any antidumping or countervailing duty collections
applicable to any steel products from those countries All other countries would be
limited to 100 percent of their 2017 import level
According to the Global Trade Analysis Project (GTAP) Model produced by
Purdue University a 53 percent tariff on all steel imports from this subset of
countries would be expected to reduce imports by 133 million metric tons from 2017
import levels from the targeted countries This action would enable an increase in
domestic production to achieve an 80 percent capacity utilization rate at 2017
demand levels (including exports) The countries identified are projected to account
for less than 4 percent of US steel exports in 2017
Exemptions
In selecting an alternative the President could determine that specific
countries should be exempted from the proposed 63 percent quota or 24 percent tariff
by granting those specific countries 100 percent of their prior imports in 2017 based
on an overriding economic or security interest of the United States The Secretary
recommends that any such determination should be made at the outset and a
corresponding adjustment be made to the final quota or tariff imposed on the
84 Due to general equilibrium effects the overall import level would need to decrease by more than the corresponding increase in domestic production to offset the negative effects of price or exchange rate changes on export demand
85 The elasticity factor is an estimate not a certainty variation of 01 in the elasticity factor would change the tonnage reduction by about 375000 tons For example imports would fall by an additional 375000 tons under a demand elasticity of -17 instead of -16 and a 25 percent tariff
60
remaining countries This would ensure that overall imports of steel to the United
States remain at or below the level needed to enable the domestic steel industry to
operate as a whole at an 80 percent or greater capacity utilization rate The limitation
to 100 percent of each exempted countryrsquos 2017 imports is necessary to prevent
exempted countries from producing additional steel for export to the United States
or encouraging other countries to seek to trans-ship steel to the United States through
the exempted countries
It is possible to provide exemptions from either the quota or tariff and still
meet the necessary objective of increasing US steel capacity utilization to a
financially viable target of 80 percent However to do so would require a reduction
in the quota or increase in the tariff applied to the remaining countries to offset the
effect of the exempted import tonnage
Exclusions
The Secretary recommends an appeal process by which affected US parties
could seek an exclusion from the tariff or quota imposed The Secretary would grant
exclusions based on a demonstrated (1) lack of sufficient US production capacity
of comparable products or (2) specific national security based considerations This
appeal process would include a public comment period on each exclusion request
and in general would be completed within 90 days of a completed application being
filed with the Secretary
An exclusion may be granted for a period to be determined by the Secretary
and may be terminated if the conditions that gave rise to the exclusion change The
US Department of Commerce will lead the appeal process in coordination with the
Department of Defense and other agencies as appropriate Should exclusions be
granted the Secretary would consider at the time whether the quota or tariff for the
remaining products needs to be adjusted to increase US steel capacity utilization to
a financially viable target of 80 percent
61
import levels from the targeted countries This action would enable an increase in
domestic production to achieve an 80 percent capacity utilization rate at 2017
demand levels (including exports) The countries identified are projected to account
for less than 4 percent of US steel exports in 2017
Exemptions
In selecting an alternative the President could determine that specific
countries should be exempted from the proposed 63 percent quota or 24 percent tariff
by granting those specific countries 100 percent of their prior imports in 2017 based
on an overriding economic or security interest of the United States The Secretary
recommends that any such determination should be made at the outset and a
corresponding adjustment be made to the final quota or tariff imposed on the
remaining countries This would ensure that overall imports of steel to the United
States remain at or below the level needed to enable the domestic steel industry to
operate as a whole at an 80 percent or greater capacity utilization rate The limitation
to 100 percent of each exempted countryrsquos 2017 imports is necessary to prevent
exempted countries from producing additional steel for export to the United States
or encouraging other countries to seek to trans-ship steel to the United States through
the exempted countries
It is possible to provide exemptions from either the quota or tariff and still
meet the necessary objective of increasing US steel capacity utilization to a
financially viable target of 80 percent However to do so would require a reduction
in the quota or increase in the tariff applied to the remaining countries to offset the
effect of the exempted import tonnage
Exclusions
The Secretary recommends an appeal process by which affected US parties
could seek an exclusion from the tariff or quota imposed The Secretary would grant
exclusions based on a demonstrated (1) lack of sufficient US production capacity
of comparable products or (2) specific national security based considerations This
appeal process would include a public comment period on each exclusion request
9
and in general would be completed within 90 days of a completed application being
filed with the Secretary
An exclusion may be granted for a period to be determined by the Secretary
and may be terminated if the conditions that gave rise to the exclusion change The
US Department of Commerce will lead the appeal process in coordination with the
Department of Defense and other agencies as appropriate Should exclusions be
granted the Secretary would consider at the time whether the quota or tariff for the
remaining products needs to be adjusted to increase US steel capacity utilization to
a financially viable target of 80 percent
10
II LEGAL FRAMEWORK
I Section 232 Requirements
Section 232 provides the Secretary with the authority to conduct
investigations to determine the effect on the national security of the United States of
imports of any article It authorizes the Secretary to conduct an investigation if
requested by the head of any department or agency upon application of an interested
party or upon his own motion See 19 USC sect 1862(b)(1)(A)
Section 232 directs the Secretary to submit to the President a report with
recommendations for ldquoaction or inaction under this sectionrdquo and requires the
Secretary to advise the President if any article ldquois being imported into the United
States in such quantities or under such circumstances as to threaten to impair the
national securityrdquo See 19 USC sect 1862(b)(3)(A)
Section 232(d) directs the Secretary and the President to in light of the
requirements of national security and without excluding other relevant factors give
consideration to the domestic production needed for projected national defense
requirements and the capacity of the United States to meet national security
requirements See 19 USC sect 1862(d)
Section 232(d) also directs the Secretary and the President to ldquorecognize the
close relation of the economic welfare of the Nation to our national security and
helliptake into consideration the impact of foreign competition on the economic welfare
of individual domestic industriesrdquo by examining whether any substantial
unemployment decrease in revenues of government loss of skills or investment or
other serious effects resulting from the displacement of any domestic products by
excessive imports or other factors result in a ldquoweakening of our internal economyrdquo
that may impair the national security See 19 USC sect 1862(d)
Once an investigation has been initiated Section 232 mandates that the
Secretary provide notice to the Secretary of Defense that such an investigation has
been initiated Section 232 also requires the Secretary to do the following
(1) ldquoConsult with the Secretary of Defense regarding the methodological and policy questions raised in [the] investigationrdquo
11
(2) ldquoSeek information and advice from and consult with appropriate
officers of the United Statesrdquo and
(3) ldquoIf it is appropriate and after reasonable notice hold public hearings or
otherwise afford interested parties an opportunity to present
information and advice relevant to such investigationrdquo10 See 19 USC
sect 1862(b)(2)(A)(i)-(iii)
As detailed in Parts III and V of this report each of the legal requirements set
forth above has been satisfied
In conducting the investigation Section 232 permits the Secretary to request
that the Secretary of Defense provide an assessment of the defense requirements of
the article that is the subject of the investigation See 19 USC sect 1862(b)(2)(B)
Upon completion of a Section 232 investigation the Secretary is required to
submit a report to the President no later than 270 days after the date on which the
investigation was initiated See 19 USC sect 1862(b)(3)(A) The required report
must
(1) Set forth ldquothe findings of such investigation with respect to the effect of the importation of such article in such quantities or under such
circumstances upon the national securityrdquo
(2) Set forth ldquobased on such findings the recommendations of the Secretary for action or inaction under this sectionrdquo and
(3) ldquoIf the Secretary finds that such article is being imported into the United States in such quantities or under such circumstances as to threaten to
impair the national security so advise the Presidentrdquo See 19 USC
sect 1862(b)(3)(A)
10 Department regulations (i) set forth additional authority and specific procedures for such input from interested parties see 15 FR sectsect 7057 and 7058 and (ii) provide that the Secretary may vary or dispense with those procedures in emergency situations or when in the judgment of the Department national security interests require it Id sect 7059
12
All unclassified and non-proprietary portions of the report submitted by the
Secretary to the President must be published
Within 90 days after receiving a report in which the Secretary finds that an
article is being imported into the United States in such quantities or under such
circumstances as to threaten to impair the national security the President shall
(1) ldquoDetermine whether the President concurs with the finding of the Secretaryrdquo and
(2) ldquoIf the President concurs determine the nature and duration of the action that in the judgment of the President must be taken to adjust the
imports of the article and its derivatives so that such imports will not
threaten to impair the national securityrdquo See 19 USC sect
1862(c)(1)(A)
II Discussion
While Section 232 does not contain a definition of ldquonational securityrdquo both
Section 232 and its implementing regulations at 15 CFR Part 705 contain non-
exclusive lists of factors that Commerce must consider in evaluating the effect of
imports on the national security Congress in Section 232 explicitly determined that
ldquonational securityrdquo includes but is not limited to ldquonational defenserdquo requirements
See 19 USC sect 1862(d) The Department in 2001 determined that ldquonational
defenserdquo includes both defense of the United States directly and the ldquoability to
project military capabilities globallyrdquo11
The Department also concluded in 2001 that ldquoin addition to the satisfaction of
national defense requirements the term ldquonational securityrdquo can be interpreted more
broadly to include the general security and welfare of certain industries beyond
those necessary to satisfy national defense requirements that are critical to the
minimum operations of the economy and governmentrdquo The Department called
these ldquocritical industriesrdquo12 This report once again uses these reasonable
11 Department of ommerce ureau of Export dministration- The Effect of Imports of Iron Ore and Semi-Finished Steel on the National Security- Oct 2001 (2001 Report)
12 Id
13
interpretations of ldquonational defenserdquo and ldquonational securityrdquo However this report
uses the more recent 16 critical infrastructure sectors identified in Presidential Policy
Directive 2113 instead of the 28 critical industry sectors used by the Bureau of Export
Administration in the 2001 Report14
Section 232 directs the Secretary to determine whether imports of any article
are being made ldquoin such quantities or under such circumstancesrdquo that those imports
ldquothreaten to impair the national securityrdquo See 19 USC sect 1862(b)(3)(A) The
statutory construction makes clear that either the quantities or the circumstances
standing alone may be sufficient to support an affirmative finding They may also
be considered together particularly where the circumstances act to prolong or
magnify the impact of the quantities being imported
The statute does not define a threshold for when ldquosuch quantitiesrdquo of imports
are sufficient to threaten to impair the national security nor does it define the
ldquocircumstancesrdquo that might qualify
Likewise the statute does not require a finding that the quantities or
circumstances are impairing the national security Instead the threshold question
under Section 232 is whether those quantities or circumstances ldquothreaten to impair
the national securityrdquo See 19 USC sect 1862(b)(3)(A) This formulation strongly
suggests that Congress expected an affirmative finding under Section 232 would
occur before there is actual impairment of the national security 15
Section 232(d) contains a considerable list of factors for the Secretary to
consider in determining if imports ldquothreaten to impair the national securityrdquo16 of the
United States and this list is mirrored in the implementing regulations See 19
13 Presidential Policy Directive 21- ritical Infrastructure Security and Resilience- February 12 2013 (PPD-21)
14 See Op it at 16
15 The 2001 Report used the phrase fundamentally threaten to impair when discussing how imports may threaten to impair national security See 2001 Report at 7 and 37 ecause the term fundamentally is not included in the statutory text and could be perceived as establishing a higher threshold the Secretary expressly does not use the qualifier in this report The statutory threshold in Section 232(b)(3)() is unambiguously threaten to impair and the Secretary adopts that threshold without qualification 19 US sect 1862(b)(3)() The statute also uses the formulation may impair in Section 232(d) Id at 1862(d)
16 19 US sect 1862(b)(3)()
14
USC sect 1862(d) and 15 CFR sect 7054 Congress was careful to note twice in
Section 232(d) that the list they provided while mandatory is not exclusive17
Congressrsquo illustrative list is focused on the ability of the United States to maintain
the domestic capacity to provide the articles in question as needed to maintain the
national security of the United States18 Congress broke the list of factors into two
equal parts using two separate sentences The first sentence focuses directly on
ldquonational defenserdquo requirements thus making clear that ldquonational defenserdquo is a
subset of the broader term ldquonational securityrdquo The second sentence focuses on the
broader economy and expressly directs that the Secretary and the President ldquoshall
recognize the close relation of the economic welfare of the Nation to our national
securityrdquo19 See 19 USC sect 1862(d)
Two of the factors listed in the second sentence of Section 232(d) are most
relevant in this investigation Both are directed at how ldquosuch quantitiesrdquo of imports
threaten to impair national security See 19 USC sect 1862(b)(3)(A) In
administering Section 232 the Secretary and the President are required to ldquotake into
consideration the impact of foreign competition on the economic welfare of
individual domestic industriesrdquo and any ldquoserious effects resulting from the
displacement of any domestic products by excessive importsrdquo in ldquodetermining
whether such weakening of our internal economy may impair the national securityrdquo
17 See 19 US sect 1862(d) (the Secretary and the President shall in light of the requirements of national security and without excluding other relevant factors0 and serious effects resulting from the displacement of any domestic products by excessive imports shall be considered without excluding other factors0 )
18 This reading is supported by ongressional findings in other statutes See eg 15 US sect 271(a)(1)(The future well-being of the United States economy depends on a strong manufacturing base0) and 50 US sect 4502(a)(ongress finds that ndash (1) the security of the United States is dependent on the ability of the domestic industrial base to supply materials and services0 (2)() to provide for the protection and restoration of domestic critical infrastructure operations under emergency conditions0 (3)0 the national defense preparedness effort of the United States Government requires ndash () the development of domestic productive capacity to meet ndash (ii) unique technological requirements0 (7) much of the industrial capacity that is relied upon by the United States Government for military production and other national defense purposes is deeply and directly influenced by ndash () the overall competitiveness of the industrial economy of the United States- and () the ability of industries in the United States in general to produce internationally competitive products and operate profitably while maintaining adequate research and development to preserve competitiveness with respect to military and civilian production- and (8) the inability of industries in the United States especially smaller subcontractors and suppliers to provide vital parts and components and other materials would impair the ability to sustain the rmed Forces of the United States in combat for longer than a short period )
19 ccord 50 US sect 4502(a)
15
See 19 USC sect 1862(d) Since the 2001 investigation foreign competition and the
displacement of domestic steel by excessive imports have resulted in the closure of
six basic oxygen furnace facilities and the idling of four more (which is more than a
50 percent reduction in the number of such facilities) a 35 percent decrease in
employment in the steel industry and caused the domestic steel industry as a whole
to operate on average with negative net income since 2009
Another factor not on the list that the Secretary finds to be a relevant is the
presence of massive excess capacity for producing steel This excess capacity results
in steel imports occurring ldquounder such circumstancesrdquo that they threaten to impair
the national security See 19 USC sect 1862(b)(3)(A) The circumstance of excess
global steel production capacity is a factor because while US production capacity
has remained flat since 2001 other steel producing nations have increased their
production capacity with China alone able to produce as much as the rest of the
world combined This overhang of global excess capacity means that US steel
producers for the foreseeable future will continue to lose market share to imported
steel as other countries export more steel to the United States to bolster their own
economic objectives and offset loss of markets to Chinese steel exports
It is these three factors ndash displacement of domestic steel by excessive imports
and the consequent adverse impact on the economic welfare of the domestic steel
industry along with global excess capacity in steel ndash that the Secretary has concluded
create a persistent threat of further plant closures that could leave the United States
unable in a national emergency to produce sufficient steel to meet national defense
and critical industry needs The Secretary finds this ldquoweakening of our internal
economy may impair the national securityrdquo as defined in Section 232 See 19 USC
1862(d)
The Secretary also considered whether the source of the imports affects the
analysis under Section 232 In the 2001 Report ldquothe Department found that iron ore
and semi-finished steel are imported from reliable foreign sourcesrdquo and concluded
that ldquoeven if the United States were dependent on imports of iron ore and semi-
finished steel imports would not threaten to impair national securityrdquo 2001 Report
at 27 However because Congress in Section 232 chose to explicitly direct the
Secretary to consider whether the ldquoimpact of foreign competitionrdquo and
ldquothe
16
displacement of any domestic products by excessive importsrdquo are ldquoweakening our
internal economyrdquo but made no reference to an assessment of the sources of imports
it appears likely that Congress recognized adverse impacts might be caused by
imports from allies or other reliable sources20 As a result the fact that some or all
of the imports causing the harm are from reliable sources does not compel a finding
that those imports do not threaten to impair national security21
After careful examination of the facts in this investigation the Secretary has
concluded that excessive imports of steel in the present circumstances do threaten to
impair national security under Section 232 Several important factors ndash the broader
scope of the investigation22 the level of global excess capacity the level of imports
the reduction in basic oxygen furnace facilities since 2001 and the potential impact
of further plant closures on capacity needed in a national emergency ndash support a
recommendation different from the one adopted in the 2001 Report
20 When ongress adopted Section 232(d) in 1962 the immediately preceding section was Section 231 19 US sect 1861 which required the President as soon as practicable to suspend most-favored-nation tariff treatment for imports from communist countries Given the bipolar nature of the world at the time the absence of a distinction between communist and non-communist countries in Section 232 suggests that ongress expected Section 232 would be applied to imports from all countriesmdashincluding allies and other reliable sources
21 To the extent that the 2001 Report or other prior Department reports under Section 232 can be read to
conclude that imports from reliable sources cannot impair the national security when the Secretary finds those
imports are causing substantial unemployment decrease in revenues of government loss of skills or
investment or other serious effects resulting from the displacement of any domestic products by excessive
imports the Secretary expressly rejects such a reading
22 This investigation examines the import of a broad range of steel products ndash flat long pipe and tube semi-
finished and stainless ndash whereas the 2001 Report addressed only semi-finished steel products and iron ore
which is not part of this investigation s the 2001 Report noted at the time semi-finished imports accounted
for a small percentage (approximately 7 percent) of total US semi-finished steel consumption 2001 Report
at 31 The 2001 Report also stated that whether imports have harmed or threaten to harm US producers writ
large is beyond the scope of the Departments inquiry and need not be resolved here Id at 37 This
investigation is focused on the larger inquiry that the 2001 Report expressly did not reach
17
III INVESTIGATION PROCESS
A Initiation of Investigation
On April 19 2017 US Secretary of Commerce Wilbur Ross initiated an
investigation to determine the effect of imported steel on national security under
Section 232 of the Trade Expansion Act of 1962 as amended (19 USC sect 1862)
Pursuant to Section 232(b)(1)(B) the Department notified the US
Department of Defense with an April 19 2017 letter from Secretary Ross to
Secretary James Mattis23
On April 20 2017 President Donald Trump signed a Presidential
Memorandum directing Secretary Ross to proceed expeditiously in conducting his
investigation and submit a report on his findings to the President24
On April 21 2017 the Department published in the Federal Register a notice
about the initiation of this investigation to determine the effect of imports of steel on
the national security The notice also announced the opening of the public comment
period as well as a public hearing to be held on May 24 201725
B Public Hearing
The Department held a public hearing to elicit further information concerning
this investigation in Washington DC on May 24 2017 The Department heard
testimony from 37 witnesses at the hearing A full list of witnesses and copies of
their testimony are included in Appendices E and F
C Public Comments
On April 21 2017 the Department invited interested parties to submit written
comments opinions data information or advice relevant to the criteria listed in
23 19 US sect 1862(b)(1)() See ppendix Section 232 Investigation Notification Letter to Secretary of Defense James Mattis (pril 19 2017) - Department of Defense Response to Notification (May 8 2017)
24 See ppendix Presidential Memorandum for the Secretary of ommerce - Steel Imports and Threats to National Security (pril 20 2017)
25 See ppendices and D for Federal Register Notice Federal Register Vol 82 No 79 19205-19207 and See Federal Register Vol 82 No 98 23529-23530
18
Section 7054 of the National Security Industrial Base Regulations (15 CFR sect
7054) as they affect the requirements of national security including the following
(a) Quantity of the articles subject to the investigation and other circumstances
related to the importation of such articles (b) Domestic production capacity needed
for these articles to meet projected national defense requirements (c) The capacity
of domestic industries to meet projected national defense requirements (d) Existing
and anticipated availability of human resources products raw materials production
equipment facilities and other supplies and services essential to the national
defense (e) Growth requirements of domestic industries needed to meet national
defense requirements and the supplies and services including the investment
exploration and development necessary to assure such growth (f) The impact of
foreign competition on the economic welfare of any domestic industry essential to
our national security (g) The displacement of any domestic products causing
substantial unemployment decrease in the revenues of government loss of
investment or specialized skills and productive capacity or other serious effects (h)
Relevant factors that are causing or will cause a weakening of our national economy
and (i) Any other relevant factors See Federal Register Vol 82 No 79 19205-
19207
The public comment period ended on May 31 2017 The Department
received 201 written public comment submissions concerning this investigation All
public comments were carefully reviewed and factored into the investigation
process For a listing of all public comments see Appendix G
D Interagency Consultation
In addition to the required notification provided by the April 19 2017 letter
from Secretary Ross to Secretary Mattis Department staff carried out the
consultations required under Section 232(b)(2)26 Staff consulted with their
counterparts in the Department of Defense regarding any methodological and policy
questions that arose during the investigation Discussions were held with the US
Army Materiel Command the Defense Logistics Agency the US NavyNaval Air
26 19 US sect 1862(b)(2)
19
Systems Command and the Under Secretary of Defense for Acquisitions amp
Logistics Manufacturing and Industrial Base Policy
Discussions were also held with ldquoappropriate officers of the United Statesrdquo
including the Department of State Department of the Treasury Department of the
InteriorUS Geological Survey the Department of Homeland SecurityUS
Customs and Border Protection the International Trade Commission and the Office
of the United States Trade Representative 27
27 Id
20
IV PRODUCT SCOPE OF THE INVESTIGATION28 29
For this report the product scope covers steel mill products (ldquosteelrdquo) which
are defined at the Harmonized System (ldquoHSrdquo) 6-digit level as 720610 through
721650 721699 through 730110 730210 730240 through 730290 and 730410
through 730690 including any subsequent revisions to these HS codes The
following discontinued HS codes have been included for purposes of reporting
historical data (prior to 2007) 722520 722693 722694 722910 730410 730421
730610 730620 and 730660
These steel products are all produced by US steel companies and support
various applications across the defense critical infrastructure and commercial
sectors Generally these products fall into one of the following five product
categories (including but not limited to)
(1) Carbon and Alloy Flat Product (Flat Products) Produced by rolling semi-
finished steel through varying sets of rolls Includes sheets strips and plates
Flat products are covered under the following 6-digit HS codes 720810
29 Note that import data for steel products includes what are believed to be very small amounts of iron as well as steel both of which are included in the HS codes covered in the scope
As discussed in Part II ldquonational securityrdquo under Section 232 includes both
(1) national defense and (2) critical infrastructure needs
1 Steel is Needed for National Defense Requirements
Steel articles are critical to the nationrsquos overall defense objectives30 The US
Department of Defense (DoD) has a large and ongoing need for a range of steel
products that are used in fabricating weapons and related systems for the nationrsquos
defense31 DoD requirements ndash which currently require about three percent of US
steel production ndash are met by steel companies that also support the requirements for
critical infrastructure and commercial industries
The free market system in the United States requires commercially viable steel
producers to meet defense needs No company could afford to construct and operate
a modern steel mill solely to supply defense needs because those needs are too
diverse In order to supply those diverse national defense needs US steel mills
must attract sufficient commercial (ie non-defense) business The commercial
revenue supports construction operation and maintenance of production capacity
as well as the upgrades research and development required to continue to supply
defense needs in the future See Appendix H for examples
2 Steel is Required for US Critical Infrastructure
Steel also is needed to satisfy requirements for ldquothose industries that the US
Government has determined are critical to minimum operations of the economy and
governmentrdquo32 In the 2001 Report the Department identified 28 ldquocritical
industriesrdquo33 The Critical Infrastructure Assurance Office that identified the
30 ccord 2001 Report at 1 12
31 ISI 2017 public policy agenda available from httpwwwsteelorg~mediaFilesISIReportsISI-2017-
Public-Policy-gendapdfla=en
32 2001 Report at 14 See also 2001 Report at 16 Table 2 for a listing of the 28 critical industries
33 Id
23
ldquocritical industriesrdquo is no longer in existence so for this investigation the Department
instead relied on the industries identified by the US Government in the 2013
Presidential Policy Directive 21 (PPD-21) 34 The Secretary believes that the range
of industries identified in PPD-21 is comparable to the range of critical industries
analyzed in the 2001 Report
Pursuant to PPD-21 there are 16 designated critical infrastructure sectors in
the United States many of which use high volumes of steel (see Appendix I)35 The
16 sectors include chemical production communications dams energy food
production nuclear reactors transportation systems water and waste water systems
Increased quantities of steel will be needed for various critical infrastructure
applications in the coming years The American Society of Civil Engineers
estimates that the United States needs to invest $45 trillion in infrastructure by 2025
and a substantial portion of these projects require steel content36
3 Domestic Steel Production is Essential for National Security
Applications
Domestic steel production is essential for national security Congress in
Section 232(d) directed the Secretary of Commerce and the President to consider
domestic production and the economic welfare of the United States in determining
whether imports threaten to impair national security
In the case of steel the history of US Government actions to ensure the
continued viability of the US steel industry demonstrates that across decades and
Administrations there has been consensus that domestic steel production is vital to
national security
34 PPD-21 can be viewed at httpsobamawhitehousearchivesgovthe-press-office20130212presidential-policy-directive-critical-infrastructure-security-and-resil
35 Department of Homeland Security ritical Infrastructure Sectors httpswwwdhsgovcritical-infrastructure-sectors
36 2017 Infrastructure Report ard merican Society of ivil Engineers httpswwwinfrastructurereportcardorgwp-contentuploads2016102017-Infrastructure-Report-ardpdf
24
Prior significant actions under various statutory authorities to address steel
imports using quotas or tariffs were taken by President George W Bush President
William J Clinton (three times) President George H W Bush President Ronald W
Reagan (three times) President James E Carter (twice) and President Richard M
Nixon all at lower levels of import penetration than at present In the 1970s action
was taken to limit import penetration to approximately 19 percent In the 1980s
import penetration had reached 21 percent and the US Government enacted
correcting measures In the 1990s and 2000s import penetration again reached up to
23 percent which prompted the US Government to take additional actions37 In
2016 import penetration averaged 30 percent and for the first nine months of 2017
imports have consistently averaged over 30 percent of US domestic demand
4 Domestic Steel Production Depends on a Healthy and Competitive
US Industry
US steel producers would be unable to survive purely on defense or critical
infrastructure steel needs In the steel industry it is commercial and industrial
customer sales that generate the relatively steady production needed for
manufacturing efficiency and the revenue volume needed to sustain the business
Sales for critical infrastructure and defense applications are often less predictable
cyclical and limited in volume
Steel manufacturers operating in the United States however have seen their
commercial and industrial business steadily eroded by a growing influx of lower-
priced imported product from countries where steel manufacturing often is
subsidized directly or indirectly The Department of Commerce currently has 164
antidumping and countervailing duty determinations in effect and has 20 additional
cases under investigation to address specific cases See Appendix K
5 Steel Consumed in Critical Industries
In this investigation the issue before the Department is whether steel imports
ldquothreaten to impairrdquo national security See 19 USC sect 1862 As discussed in Part
II the Secretary has determined that in the present case the relevant factors are the
37 See ppendix J for additional detail on US Government actions on steel in the past
25
ldquoserious effects resulting from the displacement of hellip domestic [steel] products by
excessive importsrdquo and the ldquoimpact of foreign competition on the economic welfare
of individual domestic [steel] industriesrdquo that when combined with the circumstance
of massive global excess capacity causes a ldquoweakening of our internal economyrdquo
that ldquomay impair the national securityrdquo38
In a free market system the ability of the domestic steel industry to continue
meeting national security needs depends on the continued capability of the US steel
industry to compete fairly in the commercial marketplace and maintain a financially
viable domestic manufacturing capability This includes the need to have an
adequately skilled workforce for manufacturing as well as to conduct research and
development for future products39 A continued loss of viable commercial
production capabilities and related skilled workforce will jeopardize the US steel
industryrsquos ability to meet the full spectrum of national security requirements
The Department in 2001 determined that the ldquocritical industriesrdquo sector which
is analogous to the more robust critical infrastructure sectors identified pursuant to
PPD-21 would require ldquono more than 3368 million tons of finished steel per yearrdquo40
based on 3088 percent of domestic consumption being used in industries related to
critical infrastructure The Department has now updated the ldquocritical industriesrdquo
calculation from the 2001 Report41 using Census Bureau steel usage figures from
2007 which are the latest available See Appendix I for more detailed information
on steel needs for critical infrastructure
38 19 US sect 1862(d)
39 See 50 US sect 4502(a)(ongress finds that ndash 0 (7) much of the industrial capacity that is relied upon by the United States Government for military production and other national defense purposes is deeply and directly influenced by ndash () the overall competitiveness of the industrial economy of the United States- and the ability of industries in the United States in general to produce internationally competitive products and operate profitably while maintaining adequate research and development to preserve competitiveness with respect to military and civilian production0)
40 2001 Report at 14 The report is not clear whether it is referring to short tons or metric tons While not crucial to the analysis if the figure is in short tons then the equivalent amount in metric tons would be 3056 million metric tons
41 2001 Report at 16 (Table 2)
26
The updated analysis in Appendix I shows that 491 percent of domestic steel
consumption in 2007 was used in critical industries Domestic production in 2007
was 110 million metric tons The 491 percent of domestic consumption used in
critical industries equals 54 million metric tons compared to 3056 million metric
tons (or 3368 million short tons) used in critical industries in 1997 Thus in 10 years
the demand for steel in critical industries increased by 63 percent
B Imports in Such Quantities as are Presently Found Adversely Impact the
Economic Welfare of the US Steel Industry
In the steel sector foreign competition is characterized by substantial and
sustained global overcapacity and production in excess of foreign domestic demand
1 Imports of Steel Products Continue to Increase
The United States is the worldrsquos largest steel importer The top 20 sources of
US imports of steel products accounted for approximately 91 percent of the roughly
36 million metric tons of steel the United States is expected to import in 2017 (see
Figure 2)
Total US imports rose from 259 million metric tons in 2011 peaking at 402
million metric tons in 2014 at the height of the shale hydrocarbon drilling boom For
2017 (first ten months) imports are increasing at a double-digit rate over 2016
pushing finished steel imports consistently over 30 percent of US consumption
27
-
Figure 2 Top US Imports of All Steel Products
Imports for Domestic Consumption Quantity In Metric Tons Ranked By 2017
2017 Rank
Country 2011 2017
(Annualized) Change 2011
2017 (Annualized)
World 25994621 35927141 38
1 Canada 5539448 5800008 5
2 Brazil 2820927 4678530 66
3 South Korea 2572981 3653934 42
4 Mexico 2625104 3249292 24
5 Russia 1269717 3123691 146
6 Turkey 665303 2249456 238
7 Japan 1824393 1781147 -2
8 Germany 978230 1370669 40
9 Taiwan 588036 1251767 113
10 India 735802 854026 16
11 China 1132292 784393 -31
12 Vietnam 120134 727643 506
13 Netherlands 517773 589930 14
14 Italy 276809 515459 86
15 Thailand 72183 417389 478
16 Spain 195907 403091 106
17 United Kingdom 400244 354389 -11
18 South Africa 123001 350425 185
19 Sweden 267685 299170 12
20 United Arab Emirates 63316 290221 358
Top 20 Total 22789285 32744630 44
Source United States Department of Commerce Bureau of the Census Foreign Trade Division IHS Global Trade Atlas Database Revised Statistics for 2011 - 2017 2017 data is annualized based on YTD 2017 through October
As shown in Appendix K antidumping and countervailing duty actions can
address specific instances of unfairly traded steel products However given the large
number of countries from which the United States imports steel and the myriad of
different products involved it could take years to identify and investigate every
instance of unfairly traded steel or attempts to transship or evade remedial duties
28
Moreover US industry has already spent hundreds of millions of dollars in
recent years on ADCVD cases with seemingly no end in sight to their outlays
Smaller steel manufacturers are financially unable to afford these type of cases or
are hesitant to file cases in light of possible market entry retaliation in foreign
markets for finished steel products42
2 High Import Penetration
In contrast to the situation in the 2001 Report where imports of semi-finished
steel represented approximately 7 percent of domestic consumption 43 imports of
finished steel products (ie not including semi-finished steel) currently represent
over 25 percent of US consumption (see Figure 3)44 If imports of semi-finished
products are included the import penetration level has been above 30 percent for the
first ten months of 2017 Import penetration of steel pipe and tube was 74 percent
Figure 3 US Import Penetration of Finished Steel Products (Excludes Semi-Finished)
Source American Iron and Steel Institute YTD data source is through October 2016 and October 2017 Excludes semi-finished imports
42 ongress has specifically expressed concern about the need to maintain small suppliers and the potential adverse impact on military readiness caused by the loss of small suppliers See 50 US sect 4502(a)(8)
43 2001 Report at 31
44 ISIs statistical yearbook reports that about 8 percent of US shipments are made of imported substrate
29
3 High Import to Export Ratio
US imports of steel products which displace demand for domestic steel and
lower production at US plants reached nearly four times the level of exports of
US steel products in 2016 (see Figure 4) The expansion of steel production
capacity outside of the United States in the last decade (Asia the Middle East and
South America) much of it subsidized by national governments continues to
depress world steel prices while making it increasingly difficult for US companies
to export their steel products While US steel producers saw a mild increase in steel
exports from 2005 to 2013 more recently sales to foreign customers have been
declining Exports fell to nine million metric tons in 2016 from a 20-year high of 12
million metric tons annually from 2011 to 2013 Most US steel exports are auto
industry related and are sent to Canada (50 percent by weight in 2016) and Mexico
(39 percent by weight in 2016) Flat products represent the majority of these exports
ndash 57 percent of US steel exports for Canada and 64 percent of steel exports for
North Europe Domestic Hot Rolled Coil 65954 61441 56841 42019 45529 60490
South Europe Domestic Steel Rebar 63659 59834 55166 39411 42768 56853
000
10000
20000
30000
40000
50000
60000
70000
80000
USD
MT
Source Bloomberg Platts Antaike 2017 prices are through December 20 2017
Figure 6 Regional Comparison of Hot Rolled Coil Bench Mark Prices (USDMT)
In 2015 steel prices fell globally As the OECD noted the combined effect
of weakening global steel demand including in the United States growing exports
in many economies and decreases in steelmaking costs led to a very sharp decline
32
in steel prices in 2015 Notwithstanding these effects prices for steel in the US
remained substantially higher than in any other area However relative to prices
between 2010 and 2013 prices are still relatively depressed
Global excess steel production weakens the pricing power of US steel
producers US steel producersrsquo costs are higher than the costs for producers in other
regions due to higher taxes healthcare environmental and other regulatory
expenses Higher US steel prices incentivize importing lower-cost foreign steel
Moreover excess production and lower prices in regions proximate to state
subsidized enterprises displace purchases from market based steel exporters and add
pressure on those market based suppliers to export to the US The effect of global
excess steel production on US steel prices and import levels is discussed in greater
detail in Appendix L
5 Steel Mill Closures
US steel mill closures continue eroding overall US steel mill capacity and
employment Many US steel mills have been driven out of business due to
declining steel prices global overcapacity and unfairly traded steel Since 2000 the
United States has lost over 25 percent of its basic oxygen furnace facilities with the
closure of six facilities RG Steel in Sparrows Point Maryland RG Steel in
Steubenville Ohio RG Steel in Warren Ohio ArcelorMittal in East Chicago
Indiana ArcelorMittal in Weirton West Virginia and US Steel in Fairfield
Alabama
In addition four electric arc furnace steel facilities have closed Evraz in
Claymont Delaware ArcelorMittal in Georgetown South Carolina Gerdau in Sand
Springs Oklahoma and Republic Steel in Lorain Ohio Most recently
ArcelorMittal has announced the closure of its plate rolling mill in Conshohocken
Pennsylvania because of sagging commercial sales attributed to surging imports of
low-cost steel product and flat defense demand45
The closures of these facilities have had a significant impact on the US
industrial workforce and local economies RG Steel suffered three closures
45 owden M rcelor Mittal to Shut P Plate Mill merican Metal market September 18 2017
33
Sparrows Point Maryland Steubenville Ohio and Warren Ohio After filing for
bankruptcy in 2012 more than 2000 employees were displaced in Maryland alone
and another 2000 in the Midwest The company cited weak demand in the steel
industry as well as lack of financing as key contributors to the closure46
Closures of smaller steel mills have had equally devastating impacts on
employment Gerdau Sand Springs in Oklahoma lost 300 employees after closing
in 2009 because of a long-term drop in demand for steel47 Sand Springs was the
last remaining steel plant in Oklahoma and had been in production since the 1920s
In 2013 at least 345 employees were laid off in response to the closure of the
Claymont steel mill in Delaware The Governor of Delaware Jack Markell
attributed the financial difficulties of the facility to ldquosubdued market demand and the
high volume of importsrdquo48
Similar difficulties were cited by the ArcelorMittalrsquos Georgetown South
Carolina facility and US Steelrsquos location in Fairfield Alabama both of which
closed in 2015 Layoffs for these two corporations totaled 226 and more than 1100
employees respectively Both companies attributed the layoffs to financial losses
and ultimately to facility closures due to the rise in competition from inexpensive
imports49
Even temporary idling of steel plants threatens the US steel industry as there
are significant financial costs with re-opening a steel mill Multiple US facilities
remain idled there are four idled basic oxygen furnace facilities two each in
Kentucky and Illinois representing almost one third of the remaining basic oxygen
46 usiness Journal Unforeseen onditions loses Warren Steel Holdings January 12 2016 httpbusinessjournaldailycomutilities-cut-to-warren-steel-holdings- altimore rew Six reasons why the Sparrows Point steel mill collapsed May 25 2012 httpsbaltimorebrewcom20120525six-reasons-why-the-sparrows-point-steel-mill-collapsed
47 News on 6 Sand Springs Steel Plant May lose June 9 2009 httpwwwnewson6comstory10500785sand-springs-steel-plant-may-close
48 usiness Insider Shutdown of Russian Steel Mill in Delaware ould Send a Message bout US Trade October 17 2013 httpwwwbusinessinsidercomevraz-closes-claymont-steel-2013-10
49 Lcom US Steel lays off 200 more workers in Fairfield March 18 2016 httpwwwalcombusinessindexssf201603us_steel_lays_off_200_more_worhtml
34
furnace facilities in United States50 In addition there are idled pipe and tube mills
in Texas Ohio and Alabama Once production is halted at these facilities it is not
always possible to bring back the highly skilled workforce needed to operate them
When steel mill restarts do occur additional costs are often incurred for specialized
worker training and production ramp-up
In addition when a steel mill closes at a given location the workers find other
occupations move to other steel mills or remain indefinitely unemployed After a
significant period of unemployment much of the specialized skill required by steel
mill workers is forgotten Furthermore it is typically not easy to find and recruit
displaced workers who may live hundreds or thousands of miles away
6 Declining Employment Trend Since 1998
US steel industry employment has declined 35 percent (216400 in 1998 to
139800 in January 2016 - December 2016) including 14100 lost jobs between 2015
and 2016 While employment numbers increased slightly in certain years the trend
is dramatically downward (see Figure 7) Layoffs defer formal plant closings but
are an indication of financial distress Layoffs in the last two years have been
particularly acute in steel producers with pipe and tubular facilities In addition to
layoffs there are permanent closures and bankruptcies in the industry 51
The loss of skilled workers is especially detrimental to the long-term health
and competitiveness of the industry The unstable and declining employment
outlook for the industry also dissuades younger workers from wanting to participate
in the future US steel industry The inability to rapidly add skilled workers to the
industry negatively affects current manufacturing capabilities This is especially
problematic in the event of a major production surge or mobilization
Source Bureau of Labor Statistics using the annual average of seasonally adjusted employees NAICS Codes 3311 and 3312 updated 11222017
Figure 7 Combined Steel Industry Employment (Yearly Average)
7 Trade Actions ndash Antidumping and Countervailing Duties
The number of US antidumping and countervailing duty measures in effect
illustrates the scope of the problem confronting the US steel industry In 1998 at
the height of that periods steel crisis there were just over 100 antidumping and
countervailing duty cases against finished steel products52 Today there are 164
antidumping and countervailing duty orders in effect for steel with another 20 steel
investigations currently ongoing and another waiting to take effect through
publication in the Federal Register (see Appendix K for a full listing of Steel
Antidumping and Countervailing Duty Orders in Effect) This represents a 60
percent increase in cases since the last time the Department investigated steel in
2001
8 Loss of Domestic Opportunities to Bidders Using Imported Steel
Despite efforts to level the playing field through ADCVD orders there are
numerous examples of US steel producers being unable to fairly compete with
foreign suppliers including the lack of ability to bid on some critical US
infrastructure projects Due to unfair competition particularly from foreign state-
52 Global Steel Trade Structural Problems and Future Solutions- Department of ommerce- July 2000
36
owned enterprises US steel producers have lost out on US business opportunities
Some examples include Chinese companies providing steel for the eastern span of
the San Francisco-Oakland Bay Bridge as well as the Alexander Hamilton Bridge
over the Harlem River in New York53
The Alliance for American Manufacturingrsquos statement before the
Congressional Steel Caucus (March 2017) identified three other recent infrastructure
projects in New York that have used or will use heavily subsidized or possibly
dumped foreign steel the Verrazano-Narrows Bridge LaGuardia Airport and the
Holland Tunnel Two major US cities ndash Boston and Chicago ndash have contracted
with Chinese companies to build new subway cars primarily constructed with
imported steel for their respective transportation systems54
9 Financial Distress
Rising levels of imports of steel continue to weaken the US steel industryrsquos
financial health Years of running on low-profit margins or at a loss have weakened
an industry that continues to face an ever-increasing wave of steel imports The US
industry as a whole has operated on average with negative net income from 2009-
2016 Net income for US-owned steel companies has averaged only $162 million
annually since 2010 challenging the financial viability of this vital industry (see
Figure 8)
53 New York Times ridge omes to San Francisco With a Made-in-hina Label June 25 2011 httpwwwnytimescom20110626businessglobal26bridgehtml
54 Reuters hinas RR lands $13 billion hina rail car project March 10 2016 httpwwwreuterscomarticleus-crrc-usa-idUSKN0W17I
37
The Stern School of Business at New York University calculates that US steel
industry participants in the last five years experienced negative net income of 178
percent Compounded growth in revenue for the past five years in the steel industry
has been a negative 7 percent55 The loss of revenue has caused US steel
manufacturers both large and small to defer or eliminate production facility capital
investments and funding for research and development Even though there was a
slight uptick in net income for the first quarter in 2017 over the fourth quarter of
2016 margins remain poor compared to historic levels
Not only have earnings before interest taxes depreciation and amortization
(EBITDA) been shallow for steel producers in the United States many of them are
burdened with high levels of debt as much as 119 times of earnings for one major
producer (see Figure 9)56 While some companies are starting to pay down debt
55 Historical (ompounded nnual) Growth Rates by Sector swath Damodaran New York University Stern School
of usiness January 2017 (see httppagessternnyuedu~adamodarNew_Home_Pagedatafile histgrhtml) 56 Nucor operates mini-mills that use electric arc furnaces to produce high demand steel products primarily with recycled steel scrap From a financial perspective this business model allows Nucor to be highly price competitive but the company produces a narrower range of flat steel products than integrated steel mills The
mini-mills can weather bad economic times because they have lower energy costs and can regulate production
38
others have not been able to do so primarily because of slack demand for
domestically produced steel in the face of competition from imported products
Absent increases in steel production volume and pricing one leading law firm
specializing in insolvency White amp Case observes that some steelmakers in the
United States may soon have to renegotiate loan agreements to extend maturities
those that are not able to may have to consider Chapter 11 bankruptcy57
No capital intensive industry can survive with such poor margins over the
longer term The extensive leverage in the industry shown in Figure 9 adds to the
more easily asic oxygen furnace plants have higher fixed operating costs because they directly convert iron ore and other raw materials along with scrap into steel using more energy-intensive processes
57 Losing Strength US Steel Industry nalysis Scott Griesman White ase pril 16 2016 (see httpswwwwhitecasecompublicationsarticlelosing-strength-us-steel-industry-analysis)
39
likelihood of further closures if the present high level of imports continues to force
US steel mills to operate well below profitable capacity utilization rates
10 Capital Expenditures
The ability of US manufacturers of iron and steel products to fund capital
expenditures for new production plants as well as facility modernization and
advanced manufacturing equipment has been limited by falling revenue and reduced
profits As shown in Figure 10 annual capital expenditures for companies making
iron and steel ingot bars rods plate and other semi-finished products wavered from
$57 billion to $51 billion for 2010-2012 before ramping to $71 billion in 2013
Figure 10 Annual Capital Expenditures
Iron Steel and Ferroalloys Steel NAICS Codes 3311 and 3312 Combined
Millions of Current Dollars
Annual Capital Expenditures Survey 2010 2011 2012 2013 2014 2015
A Structures [New amp Used Structures Combined] 1026 1322 1564 1157 724 580
B Equipment [New amp Used Equipment Combined] 4634 4572 3592 5954 3139 2531
C Total Capital Expenditures 5661 5894 5157 7111 3863 3110
D (Unweighted) Payroll of Reporters Total Payroll of Firms Classified in Industry group
86 84 80 61 86 84
Source US Census Bureau Annual Capital Expenditures Survey wwwcensusgovprograms-surveysaceshtml
Confronted with receding orders for products and declines in income in 2013
iron and steel companies operating production facilities in the United States started
curtailing capital investments Total capital spending dropped to $387 billion in
2014 and slid further to $311 billion in 2015 ndash 32 percent below 2010 levels of $566
billion
The decline in capital expenditures reflected similar drops in net sales which
plummeted from $1296 billion in 2014 to $102 billion in 2015 Income after taxes
40
for US iron and steel manufacturers fell from $248 billion in the same two-year
period to a massive loss of $35 billion in 2015
C Displacement of Domestic Steel by Excessive Quantities of Imports has the
Serious Effect of Weakening Our Internal Economy
1 Domestic Steel Production Capacity is Stagnant and Concentrated
According to the OECD US steel production capacity has remained stagnant
at an average of approximately 1143 million metric tons for more than a decade
from 2006-2016 (see Figure 11) For 2016 the rated maximum capacity was 113
million metric tons for existing basic oxygen furnace and electric arc furnace
Source Organization for Economic Cooperation and Development (OECD) 2017 capacity is a forecast
41
42
The present situation with respect to basic oxygen furnace production is
significantly worse than the situation assessed by the Department in the 2001 Report
As shown in Figure 13 below the number of basic oxygen furnace facilities and units
has declined precipitously since 1995 In 2000 there were 105 companies that
produced raw steel at 144 locations59 while today there are only 38 companies
producing steel at 93 locations a 64 percent and 36 percent reduction respectively
Most importantly in 2000 thirteen companies ldquooperated integrated steel mills
with an average of 35 blast furnaces in continuous operation during the yearrdquo60 while
today there are only three companies operating 13 basic oxygen furnaces These are
77 percent and 60 percent reductions respectively As a result today only 26 percent
of domestic steel is produced from raw materials in the United States as compared
to 53 percent in 2000
As noted earlier since 2000 there has been over a 25 percent reduction in the
number of basic oxygen furnaces operating in the United States and 33 percent of
the remaining basic oxygen furnaces are currently idled In the Secretaryrsquos view a
further reduction in basic oxygen furnace capacity which is especially important to
the ability of domestic industry to meet national security needs is inevitable if the
present imports continue or increase
This would be a serious ldquoweakening of our internal
economyrdquo and place the United States in a position where it is unable to be certain
59 2001 Report at 21
60 Id
43
it could meet demands for national defense and critical industries in a national 61emergency
Figure 13 Basic Oxygen and Electric Arc Facilities and Units Located in the United States 1975 - 2016
Year asic Oxygen Furnace Facilities
asic Oxygen Furnace Units
Electric rc Furnace Facilities
Electric rc Furnace Units
1975 38 90 -- --
1980 33 78 -- --
1985 27 66 -- --
1990 24 61 127 246
1995 22 56 116 218
2000 19 50 122 174
2005 17 46 115 169
2010 16 44 108 164
2015 13 31 98 154
2016 13 31 98 154 Source US Department of CommerceBIS American Iron and Steel Institute Association for Iron amp Steel Technology Steel Manufacturers Association August 2017 Estimated
Basic Oxygen Furnace Basic Oxygen Furnaces (BOF) are the dominant steelmaking technology globally accounting for 74 of the worlds total output of crude steel in 2016 OF share of production in the US was 33 in 2016 and has been slowly declining due primarily to the advent of the Greenfield electric arc furnace (EF) flat-rolled mills The primary raw materials for the BOF are liquid hot metal (iron) from the blast furnace and steel scrap [1] These are charged into the BOF vessel Oxygen (gt995 pure) is blown into the OF at supersonic velocities It oxidizes the carbon and silicon contained in the hot metal liberating great quantities of heat which melts the scrap Source Steelorg
Electric Arc Furnace The Electric Arc Furnace (EAF) operates as a batch melting process producing batches of molten steel known heats The EF process uses steel scrap and iron units melting them using electricity to make new steel EF output accounted for 66 of US steel production in 2016 Source Steelorg
[1 The last Furnace chemically reduces and physically converts iron oxides into liquid iron called hot metal The blast furnace is a huge steel stack lined with refractory brick where iron ore coke and limestone are dumped into the top and preheated air is blown into the bottom The raw materials require six to eight hours to descend to the bottom of the furnace where they become the final product of liquid slag and liquid iron Source Steelorg
In contrast to the situation in the United States the leading global producers
of steel (Brazil South Korea Japan Russia Germany and especially China)
primarily rely on basic oxygen furnace capacity rather than electric arc furnace
capacity (see Figure 14) Each of these economic competitors to the United States
possess critical research development and production capabilities that the United
61 See infra sections 4 and 5 for a further discussion of the inability to meet surge requirements in an emergency
44
rsquo
States is in danger of losing if imports continue to force US steel producers to
operate at uneconomic capacity utilization levels
A further reduction in domestic basic oxygen furnace capacity would put the
United States at serious risk of becoming dependent on foreign steel to support its
critical industries and defense needs Allowing this decline to continue represents a
ldquoweakening of our internal economy that may impair national securityrdquo which the
Congress has directed the Secretary to advise the President of under the Section 232
See 19 USC sect 1862(d)
Figure 14 The Top 20 Countries Exporting to the US ndash BOF vs EAF Capacity
Rank Top Import Sources in 2016 in Tonnage
Terms
2015 OF Share
2015 EF Share
2015 Other Share
pprox ountry s verage apacity Utilization in 2016
(OED) World 7420 2520 050 67
1 Canada 5380 4620 62
2 Brazil 7820 2020 57
3 South Korea 6960 3040 80
4 Mexico 2970 7030 75
5 Turkey 3500 6500 65
6 Japan 7710 2290 80
7 Russia 6630 3050 310 76
8 Germany 7040 2960 72 (EU 28)
9 Taiwan 6230 3770 75
10 Vietnam 2500 5990 1520 32
11 China 9390 610 69
12 Netherlands 9860 150 72 (EU 28)
13 Italy 2130 7820 72 (EU 28)
14 United Kingdom 8300 1700 72 (EU 28)
15 France 6560 3440 72 (EU 28)
16 India 4290 5710 75
17 Australia 7760 2240 63
18 Spain 3170 6830 72 (EU 28)
19 Sweden 6610 3390 72 (EU 28)
20 South Africa 5650 4350 585 Source World Steel- Production Share Figures for 2015 US ensus ureau (ccessed Via HIS) ndash Import Growth Rates OED 2017 Q2 Market ssessment ndash pproximate apacity Utilization
This is not a hypothetical situation The Department of Defense already finds
itself without domestic suppliers for some particular types of steel used in defense
45
products including tire rod steel used in military vehicles and trucks62 While the
United States has many allies that produce steel relying on foreign owned facilities
located outside the United States introduces significant risk and potential delay for
the development of new steel technologies and production of needed steel products
particularly in times of emergency The Secretary notes that the authority for the
Department of Defense to place its order ahead of commercial orders on a mandatory
basis does not extend to foreign-owned facilities outside the United States63
In the case of critical infrastructure the United States is down to only one
remaining producer of electrical steel in the United States (AK Steel ndash which is
highly leveraged) Electrical steel is necessary for power distribution transformers
for all types of energy ndash including solar nuclear wind coal and natural gas ndash across
the country If domestic electrical steel production as well as transformer and
generator production is not maintained in the US the US will become entirely
dependent on foreign producers to supply these critical materials and products64
Without an assured domestic supply of these products the United States cannot be
certain that it can effectively respond to large power disruptions affecting civilian
populations critical infrastructure and US defense industrial production
capabilities in a timely manner
2 Production is Well Below Demand
Demand for steel products in the United States (see Figure 15) increased from
1001 million metric tons in 2011 to 1175 million metric tons in 2014 then declined
to 998 million metric tons in 2016 Demand in 2017 is projected to rebound to
1077 million metric tons During the 2011 to 2016 period US production of steel
products dropped from 864 million metric tons in 2011 to 786 million metric tons
in 2016 with a four percent increase expected in 2017
62 Letter from Defense Logistics gency olumbus OH to ISOTE ugust 1 2017
63 See Defense Priorities and llocations System Program (DPS) wwwdcmamilDPS
64 United States ongress ongressional Steel aucus Statement of Roger Newport EO K Steel orporation (on behalf of the merican Iron and Steel Institute) March 29 2017
46
For the six-year period US domestic steel production supplied only 70
percent of the average demand even though available US domestic steel production
capacity during that period could have on average supplied up to 100 percent of
demand (US steel producers would be running at 92 percent capacity utilization for
this period) with approximately 13 million metric tons of additional capacity
remaining
Figure 15 US Steel Market Snapshot (millions of metric tons)
2011 2012 2013 2014 2015 2016 2017 YTD
2017 nnualized
Total Demand for Steel in US (Production + Imports - Exports)
US Annual Production (Liquid) 864 887 869 882 788 786 615 819
Sources United States Department of ommerce ureau of the ensus merican Iron and Steel Institute alculations based on industry and trade data
3 Utilization Rates are Well Below Economically Viable Levels
Overall steel mill production capacity utilization has declined from 87 percent
in 1998 to 814 percent in 2008 to 694 percent in 2016 (see Figure 16) For the
most recent six-year period (2011- 2016) the average utilization rate was 74 percent
Industry analysts note that utilization of 80 percent or more is typically
necessary for sustained profitability among other factors65 For most capital and
energy-intensive US steel producers capacity levels of 80 percent or higher are
required to maintain facilities carry out periodic modernization service company
debt and fund research and development
65 Market Realist Why steel investors are mindful of capacity utilization rates October 2 2014 httpmarketrealistcom201410investors-mindful-capacity-utilization-rate See also httpmarketrealistcom201509upstream-exposure-impact-steel-companies
47
When steel factory utilization falls costs per unit of steel product rises
reducing profit margins and product pricing flexibility Higher capacity utilization
usually results in lower per-unit product costs and higher overall profit66 Over 80
percent is a healthy capacity utilization rate and a rate at which most companies
would be profitable
The US steel industry uses 80 percent as a benchmark for minimum
operational efficiency Moreover the steel industry is capable of reaching and
sustaining 80 percent capacity utilization or higher During the 2002-2008 period
US steel companies operated at an average 874 percent level 67
These industry assessments are consistent with a 1983 report on ldquoCritical
Materials Requirements in the US Steel Industryrdquo in which the Department
66 Houston hronical apacity Utilization and Effects on Product and Profit httpsmallbusinesschroncomcapacity-utilization-effects-product-profit-67046html- steel industry sources
67 httpmarketrealistcom201509upstream-exposure-impact-steel-companieshtml (Its important to note how changes in capacity utilization rates impact a companys earnings For example we see a big jump in earnings when utilization rates improve from 80 percent to 85 percent However incremental benefits are lower when utilization rates increase from 90 percent to 95 percent )
48
explained that ldquo[c]apability utilization or capacity use which in effect describes the
efficiency of an industrys use of capital is a prime determinant of profitability
Domestic steel producers were operating at about 55 percent capability for the first
half of 1982 The comparable rate for the first half of 1981 was 85 percent This
current rate is probably well below a breakeven point for most producers whereas
1981 was profitable for nearly all producersrdquo68
4 Declining Steel Production Facilities Limits Capacity Available for a
National Emergency
The number of steel production facilities located in the US continues to
decline As shown earlier in Figure 13 from 1975 to 2016 the number of basic
oxygen furnace facilities decreased from 38 to 13 Similarly from 1990 to 2016
the number of electric arc furnace facilities decreased from 127 to 98
Due to this decline in facilities domestic steel producers have a shrinking
ability to meet national security production requirements in a national emergency
The US Department of Commerce Census Bureau regularly surveys plant capacity
and has found that steel producers are quickly shedding production capacity that
could be used in a national emergency The Census Bureau defines national
emergency production as the ldquogreatest level of production an establishment can
expect to sustain for one year or more under national emergency conditionsrdquo69 From
2011 to 2017 steel producers increased the utilization of the surge capacity they
would have during a national emergency from 542 percent to 682 percent (see
Figure 17) As steel producers use more of this emergency capacity there is an
increasingly limited ability to ramp up steel production to meet national security
needs during a national emergency
68 Department of ommerce ritical Materials Requirements in the US Steel Industry March 1983 at 16-17
69 US Dept of ommerce ensus ureau Survey of Plant apacity 2011-2017
49
0
10
20
30
40
50
60
70
80
2011 2012 2013 2014 2015 2016 2017
Figure 17 Steel Industry Utilization of Emergency Capacity (2011-2017 Quarter 1)
Source US Department of ommerce ensus ureau Survey of Plant apacity
Percent
The ability to increase steel production during a national emergency
continues to diminish as the number of steel production facilities continues to
decline If the US requires a similar increase in steel production as it did during
previous national emergencies domestic steel production capacity may be
insufficient to satisfy national security needs If a national emergency were to
occur at present utilization levels domestic steel producers would be able to
increase production by 146 percent
For comparison from 1938 through 1946 the US increased the production
of pig iron and ferro-alloys by 217 percent and increased the production of steel
ingots and castings by 210 percent to meet the demands of fighting a global war 70
From 1960 through 1973 during the Vietnam era the US increased steel
production by 152 percent 71 Should the US once again experience a conflict on
the scale of the Vietnam War steel production capacity may be slightly insufficient
70 US Dept of ommerce ensus ureau Statistical bstract of the United States 1948 Page 876
71 US Dept of ommerce ensus ureau Statistical bstract of the United States 1978 Page 830
50
to meet national security needs But if the US were to experience a conflict
requiring the production increase seen during the Second World War the existing
domestic steel production capacity would be unable to meet national security
requirements
Increasing steel production capacity once a large-scale national emergency
has arisen would take a significant amount of time According to the American Iron
and Steel Institute the replacement of a basic oxygen furnace facility takes more
than a year to complete Therefore the lack of spare domestic steel production
capacity and the possible inability to sufficiently increase production during a
national emergency may impair the national security of the United States
D Global Excess Steel Capacity is a Circumstance that Contributes to the
Weakening of the Domestic Economy
1 Free markets globally are adversely affected by substantial chronic
global excess steel production led by China
Numerous studies reports and investigations have documented the global excess
steel capacity with China having the largest installed capability (see Figure
18)727374 OECD analyses show that the worldrsquos nominal crude steelmaking capacity
reached about 24 billion metric tons in 2016 an increase of 127 percent compared
to the 2000 level Most of the capacity expansion was planned for construction and
manufacturing activities and to help build the infrastructure necessary for economic
development ndash most in non-OECD countries Furthermore the OECD reports that
while steel capacity increased at a steady rate world steel demand contracted sharply
in the aftermath of the global economic and financial crisis of 2008 Global demand
for steel recovered slowly in the years following 2008 However since 2013 global
steel demand has flattened thereby widening the capacitydemand gap By 2015 the
gap reached over 700 million metric tons
72 run L (2016) Overcapacity in Steel Chinarsquos Role in a Global Problem Washington D lliance for merican Manufacturing httpaamwebs3amazonawscomuploadsresourcesOvercapacityReport2016_R3pdf
73 Price Weld El-Sabaawi L Teslik (2016) apacity Runs Riot Washington D Wiley Rein LLP
74 OED Reports (2016) httpwwwoecdorgindustryind82nd-session-of-the-steel-committeehtm
51
The vast size of the capacitydemand gap means that steel demand alone
cannot increase enough to balance the global overcapacity problem which is
particularly prevalent in China Chinese excess capacity estimated at more than 300
million metric tons dwarfs total US production capacity (see Figure 19)75
The effect of global overcapacity and excess steel production on US steel
prices and import levels is discussed in greater detail in Appendix L While US
steel production capacity has remained flat since 2001 other steel producing nations
have increased their production capacity with China alone able to produce as much
steel as the rest of the world combined
75 OED High Level Meeting Excess apacity and Structural djustment in the Steel Sector pril 2016 httpwwwoecdorgstiindackground20document20No202_FINL_Meetingpdf
52
0
500
1000
1500
2000
2500 M
illio
ns
of
Met
ric
Ton
s
Figure 19 Steelmaking Capacity
World Total China United States
Source OECD
2009 2010 2011 2012 2013 2014 2015 2016 2017
Several countries (India Iran and Indonesia) in addition to China continue to
add production capacity despite slack global demand According to the OECD Steel
Committee Chairrsquos statement from March 2017 ldquoNew data suggest that nearly 40
million metric tons of gross capacity additions are currently underway and could
come on stream during the three-year period of 2017-19 while an additional 536
million metric tons of capacity additions are in the planning stages for possible start-
up during the same time periodrdquo76 This additional global steel capacity coming
online represents over 80 percent of existing US steelmaking production capacity
demonstrating that the import challenge to US industry is continuing to grow
2 Increasing global excess steel capacity will further weaken the internal
economy as US steel producers will face increasing import competition
These additions to worldwide steelmaking capacity will only exacerbate the
situation because they will further lower global operating utilization rates including
in the United States Growth in foreign government-subsidized steel production is
progressively weakening the financial health of the US steel industry as other steel
76 OED 82nd Session of the OED Steel ommittee ndash hairs Statement March 2017 httpwwwoecdorgstiind82-oecd-steel-chair-statementhtm
53
producing countries export more steel to the US to in part to offset the loss of
regional markets to Chinese steel (see Appendix L)
The US share of global production continues to steadily decline In the year
2000 when President Clinton signed into a law a statute granting China permanent
normal trade relations status77 the US share of global steel production stood at 12
percent78 Since that point in time the US share of global steel production continued
an inexorable decline as other countries and especially China began to increase
production The US share of global steel production fell to 8 percent in 200579 5
percent in 200980 and 48 percent in 201581 In contrast China commanded a 497
percent share of global steel production in 201582
If even half of the planned additional global capacity identified by the OECD
Steel Committee is built and the related new production finds its way into the US
it will drive the operating rate of US steel mills to less than 50 percent of capacity
This will cause a substantial and unsustainable negative cash situation that will
ultimately result in multiple corporate bankruptcies due to heavy debt loads and
related declines in steel production capacity and employment levels
77 Public Law 106-286 n act to authorize extension of nondiscriminatory treatment (normal trade relations treatment) to the Peoples Republic of hina and to establish a framework for relations between the United States and the Peoples Republic of hina October 10 2000 httpswwwgpogovfdsyspkgPLW-106publ286
78 US Dept of ommerce ensus ureau Statistical bstract of the United States 2012 Page 574
79 Id
80 Id
81 Steel Statistical Yearbook 2016 World Steel ssociation httpswwwworldsteelorgendamjcr37ad1117-fefc-4df3-b84f-6295478ae460Steel+Statistical+Yearbook+2016pdf
82 Steel Statistical Yearbook 2017 World Steel ssociation httpswwwworldsteelorgendamjcr3e275c73-6f11-4e7f-a5d8-23d9bc5c508fSteel+Statistical+Yearbook+2017pdf
54
VI CONCLUSION
The Secretary has determined that the displacement of domestic steel by
excessive imports and the consequent adverse impact of those quantities of steel
imports on the economic welfare of the domestic steel industry along with the
circumstance of global excess capacity in steel are ldquoweakening our internal
economyrdquo and therefore ldquothreaten to impairrdquo the national security as defined in
Section 232
The continued rising levels of imports of foreign steel threaten to impair the
national security by placing the US steel industry at substantial risk of displacing
the basic oxygen furnace and other steelmaking capacity and the related supply
chain needed to produce steel for critical infrastructure and national defense
In considering ldquothe impact of foreign competition on the economic welfare of
individual domestic [steel] industriesrdquo and other factors Congress expressly outlined
in Section 232 the Secretary has determined that the continued decline and
concentration in steel production capacity is ldquoweakening of our internal economy
and may impair national securityrdquo See 19 USC sect 1862(d)
Global excess steel capacity is a circumstance that contributes to the
ldquoweakening of our internal economyrdquo that ldquothreaten[s] to impairrdquo the national
security as defined in Section 232 Free markets globally are adversely affected by
substantial chronic global excess steel production led by China While US steel
production capacity has remained flat since 2001 other steel producing nations have
increased their production capacity with China alone able to produce as much steel
as the rest of the world combined This overhang of excess capacity means that US
steel producers for the foreseeable future will face increasing competition from
imported steel as other countries export more steel to the United States to bolster
their own economic objectives
Since defense and critical infrastructure requirements alone are not sufficient
to support a robust steel industry US steel producers must be financially viable and
competitive in the commercial market to be available to produce the needed steel
output in a timely and cost efficient manner In fact it is the ability to quickly shift
55
production capacity used for commercial products to defense and critical
infrastructure production that provides the United States a surge capability that is
vital to national security especially in an unexpected or extended conflict or national
emergency It is that capability which is now at serious risk as imports continue to
take business away from domestic producers these producers are in danger of falling
below minimum viable scale and are at risk of having to exit the market and
substantially close down production capacity often permanently
Steel producers in the United States are facing widespread harm from
mounting imports Growing global steel capacity flat or declining world demand
the openness of the US steel market and the price differential between US market
prices and global market prices (often caused by foreign government steel
intervention) ensures that the US will remain an attractive market for foreign steel
absent quotas or tariffs Excessive imports of steel now consistently above 30
percent of domestic demand have displaced domestic steel production the related
skilled workforce and threaten the ability of this critical industry to maintain
economic viability
A US steel industry that is not financially viable to invest in the latest
technologies facilities and long-term research and development nor retain skilled
workers while attracting a next-generation workforce will be unable to meet the
current and projected needs of the US military and critical infrastructure sectors
Moreover the market environment for US steel producers has deteriorated
dramatically since the 2001 Report when the Department concluded that imports of
iron ore and semi-finished steel do not ldquofundamentally threatenrdquo the ability of US
industry to meet national security needs83
The Departmentrsquos investigation indicates that the domestic steel industry has
declined to a point where further closures and consolidation of basic oxygen furnace
facilities represents a ldquoweakening of our internal economyrdquo as defined in Section
232 The more than 50 percent reduction in the number of basic oxygen furnace
83 2001 Report at 28 ndash 37 s noted supra note 16 the 2001 Report added the qualifier fundamentally which is not found in the statutory text The Secretary in this report uses the statutory standard of threatens to impair without such qualification
56
facilities ndash either through closures or idling of facilities due to import competition ndash
increases the chance of further closures that place the United States at serious risk
of being unable to increase production to the levels needed in past national
emergencies The displacement of domestic product by excessive imports is having
the serious effect of causing the domestic industry to operate at unsustainable levels
reducing employment diminishing research and development inhibiting capital
expenditures and causing a loss of vital skills and know-how The present capacity
operating rates for those remaining plants continue to be below those needed for
financial sustainability These conditions have been further exacerbated by the 22
percent surge in imports thus far in 2017 compared with 2016 Imports are now
consistently above 30 percent of US domestic demand
It is evident that the US steel industry is being substantially impacted by the
current levels of imported steel The displacement of domestic steel by imports has
the serious effect of placing the United States at risk of being unable meet national
security requirements The Secretary has determined that the ldquodisplacement of
domestic [steel] products by excessive importsrdquo of steel is having the ldquoserious effectrdquo
of causing the ldquoweakening of our internal economyrdquo See 19 USC sect 1862(d)
Therefore the Secretary recommends that the President take corrective action
pursuant to the authority granted by Section 232 See 19 USC sect 1862(c)
57
VII RECOMMENDATION
Prior significant actions to address steel imports (quotas andor tariffs) were
taken under various statutory authorities by President George W Bush President
William J Clinton (three times) President George H W Bush President Ronald W
Reagan (three times) President James E Carter (twice) and President Richard M
Nixon all at lower levels of import penetration than the present level which is above
30 percent
Due to the threat of steel imports to the national security as defined in Section
232 the Secretary recommends that the President take immediate action by adjusting
the level of imports through quotas or tariffs on steel imported into the United States
as well as direct additional actions to keep the US steel industry financially viable
and able to meet US national security needs The quota or tariff imposed should be
sufficient after accounting for any exclusions to enable the US steel producers to
be able to operate at about an 80 percent or better of the industryrsquos capacity
utilization rate based on available capacity in 2017
In 2016 US steel production was 786 million metric tons and US capacity
was 1133 million metric tons which represents a 694 percent capacity utilization
rate If current import trends for 2017 continue continued imports without any
action are projected to be 360 million metric tons an increase over 2016 of 60
million metric tons Even with US demand projected to increase to 1073 from
998 million metric tons increased imports mean US capacity utilization is forecast
to rise only to 723 percent a non-financially viable and unsustainable level of
operation
By reducing import penetration rates to approximately 21 percent US
industry would be able to operate at 80 percent of their capacity utilization
Achieving this level of capacity utilization based on the projected 2017 import levels
will require reducing imports from 36 million metric tons to about 23 million metric
tons If a reduction in imports can be combined with an increase in domestic steel
demand as can be reasonably expected rising economic growth rates combined with
the increased military spending and infrastructure proposals that the Trump
Administration has planned then US steel mills can be expected to reach a capacity
58
utilization level of 80 percent or greater This increase in US capacity utilization
will enable US steel mills to increase operations significantly in the short-term and
improve the financial viability of the industry over the long-term
Recommendation to Ensure Sustainable Capacity Utilization and
Financial Health
Impose a Quota or Tariff on all steel products covered in this investigation
imported into the United States to remove the threatened impairment to
national security The Secretary recommends adjusting the level of imports through
a quota or tariff on steel imported into the United States
Alternative 1 ndash Global Quota or Tariff
1A Global Quota
Impose quotas on all imported steel products at a specified percent of the 2017
import level applied on a country and steel product basis
According to the Global Trade Analysis Project (GTAP) Model produced by
Purdue University a 63 percent quota would be expected to reduce steel imports by
37 percent (133 million metric tons) from 2017 levels Based on imports from
January to October import levels for 2017 are projected to reach 360 million metric
tons The quotas adjusted as necessary would result in imports equaling about 227
million metric tons which will enable an 80 percent capacity utilization rate at 2017
demand levels (including exports) Application of an annual quota will reduce the
impact of the surge in steel imports that has occurred since the beginning of 2017
1B Global Tariff
Apply a tariff rate on all imported steel products in addition to any
antidumping or countervailing duty collections applicable to any imported steel
product
Similar to what is anticipated under a quota according to the Global Trade
Analysis Project (GTAP) Model produced by Purdue University a 24 percent tariff
on all steel imports would be expected to reduce imports by 37 percent (ie a
59
reduction of 133 million metric tons from 2017 levels of 360 million metric tons) 84
This tariff rate would thus result in imports equaling about 227 million metric tons
which will enable an 80 percent capacity utilization rate at 2017 demand levels
(including exports)85
Alternative 2 ndashTariffs on a Subset of Countries
Apply a tariff rate on all imported steel products from Brazil South Korea
Russia Turkey India Vietnam China Thailand South Africa Egypt Malaysia and
Costa Rica in addition to any antidumping or countervailing duty collections
applicable to any steel products from those countries All other countries would be
limited to 100 percent of their 2017 import level
According to the Global Trade Analysis Project (GTAP) Model produced by
Purdue University a 53 percent tariff on all steel imports from this subset of
countries would be expected to reduce imports by 133 million metric tons from 2017
import levels from the targeted countries This action would enable an increase in
domestic production to achieve an 80 percent capacity utilization rate at 2017
demand levels (including exports) The countries identified are projected to account
for less than 4 percent of US steel exports in 2017
Exemptions
In selecting an alternative the President could determine that specific
countries should be exempted from the proposed 63 percent quota or 24 percent tariff
by granting those specific countries 100 percent of their prior imports in 2017 based
on an overriding economic or security interest of the United States The Secretary
recommends that any such determination should be made at the outset and a
corresponding adjustment be made to the final quota or tariff imposed on the
84 Due to general equilibrium effects the overall import level would need to decrease by more than the corresponding increase in domestic production to offset the negative effects of price or exchange rate changes on export demand
85 The elasticity factor is an estimate not a certainty variation of 01 in the elasticity factor would change the tonnage reduction by about 375000 tons For example imports would fall by an additional 375000 tons under a demand elasticity of -17 instead of -16 and a 25 percent tariff
60
remaining countries This would ensure that overall imports of steel to the United
States remain at or below the level needed to enable the domestic steel industry to
operate as a whole at an 80 percent or greater capacity utilization rate The limitation
to 100 percent of each exempted countryrsquos 2017 imports is necessary to prevent
exempted countries from producing additional steel for export to the United States
or encouraging other countries to seek to trans-ship steel to the United States through
the exempted countries
It is possible to provide exemptions from either the quota or tariff and still
meet the necessary objective of increasing US steel capacity utilization to a
financially viable target of 80 percent However to do so would require a reduction
in the quota or increase in the tariff applied to the remaining countries to offset the
effect of the exempted import tonnage
Exclusions
The Secretary recommends an appeal process by which affected US parties
could seek an exclusion from the tariff or quota imposed The Secretary would grant
exclusions based on a demonstrated (1) lack of sufficient US production capacity
of comparable products or (2) specific national security based considerations This
appeal process would include a public comment period on each exclusion request
and in general would be completed within 90 days of a completed application being
filed with the Secretary
An exclusion may be granted for a period to be determined by the Secretary
and may be terminated if the conditions that gave rise to the exclusion change The
US Department of Commerce will lead the appeal process in coordination with the
Department of Defense and other agencies as appropriate Should exclusions be
granted the Secretary would consider at the time whether the quota or tariff for the
remaining products needs to be adjusted to increase US steel capacity utilization to
a financially viable target of 80 percent
61
and in general would be completed within 90 days of a completed application being
filed with the Secretary
An exclusion may be granted for a period to be determined by the Secretary
and may be terminated if the conditions that gave rise to the exclusion change The
US Department of Commerce will lead the appeal process in coordination with the
Department of Defense and other agencies as appropriate Should exclusions be
granted the Secretary would consider at the time whether the quota or tariff for the
remaining products needs to be adjusted to increase US steel capacity utilization to
a financially viable target of 80 percent
10
II LEGAL FRAMEWORK
I Section 232 Requirements
Section 232 provides the Secretary with the authority to conduct
investigations to determine the effect on the national security of the United States of
imports of any article It authorizes the Secretary to conduct an investigation if
requested by the head of any department or agency upon application of an interested
party or upon his own motion See 19 USC sect 1862(b)(1)(A)
Section 232 directs the Secretary to submit to the President a report with
recommendations for ldquoaction or inaction under this sectionrdquo and requires the
Secretary to advise the President if any article ldquois being imported into the United
States in such quantities or under such circumstances as to threaten to impair the
national securityrdquo See 19 USC sect 1862(b)(3)(A)
Section 232(d) directs the Secretary and the President to in light of the
requirements of national security and without excluding other relevant factors give
consideration to the domestic production needed for projected national defense
requirements and the capacity of the United States to meet national security
requirements See 19 USC sect 1862(d)
Section 232(d) also directs the Secretary and the President to ldquorecognize the
close relation of the economic welfare of the Nation to our national security and
helliptake into consideration the impact of foreign competition on the economic welfare
of individual domestic industriesrdquo by examining whether any substantial
unemployment decrease in revenues of government loss of skills or investment or
other serious effects resulting from the displacement of any domestic products by
excessive imports or other factors result in a ldquoweakening of our internal economyrdquo
that may impair the national security See 19 USC sect 1862(d)
Once an investigation has been initiated Section 232 mandates that the
Secretary provide notice to the Secretary of Defense that such an investigation has
been initiated Section 232 also requires the Secretary to do the following
(1) ldquoConsult with the Secretary of Defense regarding the methodological and policy questions raised in [the] investigationrdquo
11
(2) ldquoSeek information and advice from and consult with appropriate
officers of the United Statesrdquo and
(3) ldquoIf it is appropriate and after reasonable notice hold public hearings or
otherwise afford interested parties an opportunity to present
information and advice relevant to such investigationrdquo10 See 19 USC
sect 1862(b)(2)(A)(i)-(iii)
As detailed in Parts III and V of this report each of the legal requirements set
forth above has been satisfied
In conducting the investigation Section 232 permits the Secretary to request
that the Secretary of Defense provide an assessment of the defense requirements of
the article that is the subject of the investigation See 19 USC sect 1862(b)(2)(B)
Upon completion of a Section 232 investigation the Secretary is required to
submit a report to the President no later than 270 days after the date on which the
investigation was initiated See 19 USC sect 1862(b)(3)(A) The required report
must
(1) Set forth ldquothe findings of such investigation with respect to the effect of the importation of such article in such quantities or under such
circumstances upon the national securityrdquo
(2) Set forth ldquobased on such findings the recommendations of the Secretary for action or inaction under this sectionrdquo and
(3) ldquoIf the Secretary finds that such article is being imported into the United States in such quantities or under such circumstances as to threaten to
impair the national security so advise the Presidentrdquo See 19 USC
sect 1862(b)(3)(A)
10 Department regulations (i) set forth additional authority and specific procedures for such input from interested parties see 15 FR sectsect 7057 and 7058 and (ii) provide that the Secretary may vary or dispense with those procedures in emergency situations or when in the judgment of the Department national security interests require it Id sect 7059
12
All unclassified and non-proprietary portions of the report submitted by the
Secretary to the President must be published
Within 90 days after receiving a report in which the Secretary finds that an
article is being imported into the United States in such quantities or under such
circumstances as to threaten to impair the national security the President shall
(1) ldquoDetermine whether the President concurs with the finding of the Secretaryrdquo and
(2) ldquoIf the President concurs determine the nature and duration of the action that in the judgment of the President must be taken to adjust the
imports of the article and its derivatives so that such imports will not
threaten to impair the national securityrdquo See 19 USC sect
1862(c)(1)(A)
II Discussion
While Section 232 does not contain a definition of ldquonational securityrdquo both
Section 232 and its implementing regulations at 15 CFR Part 705 contain non-
exclusive lists of factors that Commerce must consider in evaluating the effect of
imports on the national security Congress in Section 232 explicitly determined that
ldquonational securityrdquo includes but is not limited to ldquonational defenserdquo requirements
See 19 USC sect 1862(d) The Department in 2001 determined that ldquonational
defenserdquo includes both defense of the United States directly and the ldquoability to
project military capabilities globallyrdquo11
The Department also concluded in 2001 that ldquoin addition to the satisfaction of
national defense requirements the term ldquonational securityrdquo can be interpreted more
broadly to include the general security and welfare of certain industries beyond
those necessary to satisfy national defense requirements that are critical to the
minimum operations of the economy and governmentrdquo The Department called
these ldquocritical industriesrdquo12 This report once again uses these reasonable
11 Department of ommerce ureau of Export dministration- The Effect of Imports of Iron Ore and Semi-Finished Steel on the National Security- Oct 2001 (2001 Report)
12 Id
13
interpretations of ldquonational defenserdquo and ldquonational securityrdquo However this report
uses the more recent 16 critical infrastructure sectors identified in Presidential Policy
Directive 2113 instead of the 28 critical industry sectors used by the Bureau of Export
Administration in the 2001 Report14
Section 232 directs the Secretary to determine whether imports of any article
are being made ldquoin such quantities or under such circumstancesrdquo that those imports
ldquothreaten to impair the national securityrdquo See 19 USC sect 1862(b)(3)(A) The
statutory construction makes clear that either the quantities or the circumstances
standing alone may be sufficient to support an affirmative finding They may also
be considered together particularly where the circumstances act to prolong or
magnify the impact of the quantities being imported
The statute does not define a threshold for when ldquosuch quantitiesrdquo of imports
are sufficient to threaten to impair the national security nor does it define the
ldquocircumstancesrdquo that might qualify
Likewise the statute does not require a finding that the quantities or
circumstances are impairing the national security Instead the threshold question
under Section 232 is whether those quantities or circumstances ldquothreaten to impair
the national securityrdquo See 19 USC sect 1862(b)(3)(A) This formulation strongly
suggests that Congress expected an affirmative finding under Section 232 would
occur before there is actual impairment of the national security 15
Section 232(d) contains a considerable list of factors for the Secretary to
consider in determining if imports ldquothreaten to impair the national securityrdquo16 of the
United States and this list is mirrored in the implementing regulations See 19
13 Presidential Policy Directive 21- ritical Infrastructure Security and Resilience- February 12 2013 (PPD-21)
14 See Op it at 16
15 The 2001 Report used the phrase fundamentally threaten to impair when discussing how imports may threaten to impair national security See 2001 Report at 7 and 37 ecause the term fundamentally is not included in the statutory text and could be perceived as establishing a higher threshold the Secretary expressly does not use the qualifier in this report The statutory threshold in Section 232(b)(3)() is unambiguously threaten to impair and the Secretary adopts that threshold without qualification 19 US sect 1862(b)(3)() The statute also uses the formulation may impair in Section 232(d) Id at 1862(d)
16 19 US sect 1862(b)(3)()
14
USC sect 1862(d) and 15 CFR sect 7054 Congress was careful to note twice in
Section 232(d) that the list they provided while mandatory is not exclusive17
Congressrsquo illustrative list is focused on the ability of the United States to maintain
the domestic capacity to provide the articles in question as needed to maintain the
national security of the United States18 Congress broke the list of factors into two
equal parts using two separate sentences The first sentence focuses directly on
ldquonational defenserdquo requirements thus making clear that ldquonational defenserdquo is a
subset of the broader term ldquonational securityrdquo The second sentence focuses on the
broader economy and expressly directs that the Secretary and the President ldquoshall
recognize the close relation of the economic welfare of the Nation to our national
securityrdquo19 See 19 USC sect 1862(d)
Two of the factors listed in the second sentence of Section 232(d) are most
relevant in this investigation Both are directed at how ldquosuch quantitiesrdquo of imports
threaten to impair national security See 19 USC sect 1862(b)(3)(A) In
administering Section 232 the Secretary and the President are required to ldquotake into
consideration the impact of foreign competition on the economic welfare of
individual domestic industriesrdquo and any ldquoserious effects resulting from the
displacement of any domestic products by excessive importsrdquo in ldquodetermining
whether such weakening of our internal economy may impair the national securityrdquo
17 See 19 US sect 1862(d) (the Secretary and the President shall in light of the requirements of national security and without excluding other relevant factors0 and serious effects resulting from the displacement of any domestic products by excessive imports shall be considered without excluding other factors0 )
18 This reading is supported by ongressional findings in other statutes See eg 15 US sect 271(a)(1)(The future well-being of the United States economy depends on a strong manufacturing base0) and 50 US sect 4502(a)(ongress finds that ndash (1) the security of the United States is dependent on the ability of the domestic industrial base to supply materials and services0 (2)() to provide for the protection and restoration of domestic critical infrastructure operations under emergency conditions0 (3)0 the national defense preparedness effort of the United States Government requires ndash () the development of domestic productive capacity to meet ndash (ii) unique technological requirements0 (7) much of the industrial capacity that is relied upon by the United States Government for military production and other national defense purposes is deeply and directly influenced by ndash () the overall competitiveness of the industrial economy of the United States- and () the ability of industries in the United States in general to produce internationally competitive products and operate profitably while maintaining adequate research and development to preserve competitiveness with respect to military and civilian production- and (8) the inability of industries in the United States especially smaller subcontractors and suppliers to provide vital parts and components and other materials would impair the ability to sustain the rmed Forces of the United States in combat for longer than a short period )
19 ccord 50 US sect 4502(a)
15
See 19 USC sect 1862(d) Since the 2001 investigation foreign competition and the
displacement of domestic steel by excessive imports have resulted in the closure of
six basic oxygen furnace facilities and the idling of four more (which is more than a
50 percent reduction in the number of such facilities) a 35 percent decrease in
employment in the steel industry and caused the domestic steel industry as a whole
to operate on average with negative net income since 2009
Another factor not on the list that the Secretary finds to be a relevant is the
presence of massive excess capacity for producing steel This excess capacity results
in steel imports occurring ldquounder such circumstancesrdquo that they threaten to impair
the national security See 19 USC sect 1862(b)(3)(A) The circumstance of excess
global steel production capacity is a factor because while US production capacity
has remained flat since 2001 other steel producing nations have increased their
production capacity with China alone able to produce as much as the rest of the
world combined This overhang of global excess capacity means that US steel
producers for the foreseeable future will continue to lose market share to imported
steel as other countries export more steel to the United States to bolster their own
economic objectives and offset loss of markets to Chinese steel exports
It is these three factors ndash displacement of domestic steel by excessive imports
and the consequent adverse impact on the economic welfare of the domestic steel
industry along with global excess capacity in steel ndash that the Secretary has concluded
create a persistent threat of further plant closures that could leave the United States
unable in a national emergency to produce sufficient steel to meet national defense
and critical industry needs The Secretary finds this ldquoweakening of our internal
economy may impair the national securityrdquo as defined in Section 232 See 19 USC
1862(d)
The Secretary also considered whether the source of the imports affects the
analysis under Section 232 In the 2001 Report ldquothe Department found that iron ore
and semi-finished steel are imported from reliable foreign sourcesrdquo and concluded
that ldquoeven if the United States were dependent on imports of iron ore and semi-
finished steel imports would not threaten to impair national securityrdquo 2001 Report
at 27 However because Congress in Section 232 chose to explicitly direct the
Secretary to consider whether the ldquoimpact of foreign competitionrdquo and
ldquothe
16
displacement of any domestic products by excessive importsrdquo are ldquoweakening our
internal economyrdquo but made no reference to an assessment of the sources of imports
it appears likely that Congress recognized adverse impacts might be caused by
imports from allies or other reliable sources20 As a result the fact that some or all
of the imports causing the harm are from reliable sources does not compel a finding
that those imports do not threaten to impair national security21
After careful examination of the facts in this investigation the Secretary has
concluded that excessive imports of steel in the present circumstances do threaten to
impair national security under Section 232 Several important factors ndash the broader
scope of the investigation22 the level of global excess capacity the level of imports
the reduction in basic oxygen furnace facilities since 2001 and the potential impact
of further plant closures on capacity needed in a national emergency ndash support a
recommendation different from the one adopted in the 2001 Report
20 When ongress adopted Section 232(d) in 1962 the immediately preceding section was Section 231 19 US sect 1861 which required the President as soon as practicable to suspend most-favored-nation tariff treatment for imports from communist countries Given the bipolar nature of the world at the time the absence of a distinction between communist and non-communist countries in Section 232 suggests that ongress expected Section 232 would be applied to imports from all countriesmdashincluding allies and other reliable sources
21 To the extent that the 2001 Report or other prior Department reports under Section 232 can be read to
conclude that imports from reliable sources cannot impair the national security when the Secretary finds those
imports are causing substantial unemployment decrease in revenues of government loss of skills or
investment or other serious effects resulting from the displacement of any domestic products by excessive
imports the Secretary expressly rejects such a reading
22 This investigation examines the import of a broad range of steel products ndash flat long pipe and tube semi-
finished and stainless ndash whereas the 2001 Report addressed only semi-finished steel products and iron ore
which is not part of this investigation s the 2001 Report noted at the time semi-finished imports accounted
for a small percentage (approximately 7 percent) of total US semi-finished steel consumption 2001 Report
at 31 The 2001 Report also stated that whether imports have harmed or threaten to harm US producers writ
large is beyond the scope of the Departments inquiry and need not be resolved here Id at 37 This
investigation is focused on the larger inquiry that the 2001 Report expressly did not reach
17
III INVESTIGATION PROCESS
A Initiation of Investigation
On April 19 2017 US Secretary of Commerce Wilbur Ross initiated an
investigation to determine the effect of imported steel on national security under
Section 232 of the Trade Expansion Act of 1962 as amended (19 USC sect 1862)
Pursuant to Section 232(b)(1)(B) the Department notified the US
Department of Defense with an April 19 2017 letter from Secretary Ross to
Secretary James Mattis23
On April 20 2017 President Donald Trump signed a Presidential
Memorandum directing Secretary Ross to proceed expeditiously in conducting his
investigation and submit a report on his findings to the President24
On April 21 2017 the Department published in the Federal Register a notice
about the initiation of this investigation to determine the effect of imports of steel on
the national security The notice also announced the opening of the public comment
period as well as a public hearing to be held on May 24 201725
B Public Hearing
The Department held a public hearing to elicit further information concerning
this investigation in Washington DC on May 24 2017 The Department heard
testimony from 37 witnesses at the hearing A full list of witnesses and copies of
their testimony are included in Appendices E and F
C Public Comments
On April 21 2017 the Department invited interested parties to submit written
comments opinions data information or advice relevant to the criteria listed in
23 19 US sect 1862(b)(1)() See ppendix Section 232 Investigation Notification Letter to Secretary of Defense James Mattis (pril 19 2017) - Department of Defense Response to Notification (May 8 2017)
24 See ppendix Presidential Memorandum for the Secretary of ommerce - Steel Imports and Threats to National Security (pril 20 2017)
25 See ppendices and D for Federal Register Notice Federal Register Vol 82 No 79 19205-19207 and See Federal Register Vol 82 No 98 23529-23530
18
Section 7054 of the National Security Industrial Base Regulations (15 CFR sect
7054) as they affect the requirements of national security including the following
(a) Quantity of the articles subject to the investigation and other circumstances
related to the importation of such articles (b) Domestic production capacity needed
for these articles to meet projected national defense requirements (c) The capacity
of domestic industries to meet projected national defense requirements (d) Existing
and anticipated availability of human resources products raw materials production
equipment facilities and other supplies and services essential to the national
defense (e) Growth requirements of domestic industries needed to meet national
defense requirements and the supplies and services including the investment
exploration and development necessary to assure such growth (f) The impact of
foreign competition on the economic welfare of any domestic industry essential to
our national security (g) The displacement of any domestic products causing
substantial unemployment decrease in the revenues of government loss of
investment or specialized skills and productive capacity or other serious effects (h)
Relevant factors that are causing or will cause a weakening of our national economy
and (i) Any other relevant factors See Federal Register Vol 82 No 79 19205-
19207
The public comment period ended on May 31 2017 The Department
received 201 written public comment submissions concerning this investigation All
public comments were carefully reviewed and factored into the investigation
process For a listing of all public comments see Appendix G
D Interagency Consultation
In addition to the required notification provided by the April 19 2017 letter
from Secretary Ross to Secretary Mattis Department staff carried out the
consultations required under Section 232(b)(2)26 Staff consulted with their
counterparts in the Department of Defense regarding any methodological and policy
questions that arose during the investigation Discussions were held with the US
Army Materiel Command the Defense Logistics Agency the US NavyNaval Air
26 19 US sect 1862(b)(2)
19
Systems Command and the Under Secretary of Defense for Acquisitions amp
Logistics Manufacturing and Industrial Base Policy
Discussions were also held with ldquoappropriate officers of the United Statesrdquo
including the Department of State Department of the Treasury Department of the
InteriorUS Geological Survey the Department of Homeland SecurityUS
Customs and Border Protection the International Trade Commission and the Office
of the United States Trade Representative 27
27 Id
20
IV PRODUCT SCOPE OF THE INVESTIGATION28 29
For this report the product scope covers steel mill products (ldquosteelrdquo) which
are defined at the Harmonized System (ldquoHSrdquo) 6-digit level as 720610 through
721650 721699 through 730110 730210 730240 through 730290 and 730410
through 730690 including any subsequent revisions to these HS codes The
following discontinued HS codes have been included for purposes of reporting
historical data (prior to 2007) 722520 722693 722694 722910 730410 730421
730610 730620 and 730660
These steel products are all produced by US steel companies and support
various applications across the defense critical infrastructure and commercial
sectors Generally these products fall into one of the following five product
categories (including but not limited to)
(1) Carbon and Alloy Flat Product (Flat Products) Produced by rolling semi-
finished steel through varying sets of rolls Includes sheets strips and plates
Flat products are covered under the following 6-digit HS codes 720810
29 Note that import data for steel products includes what are believed to be very small amounts of iron as well as steel both of which are included in the HS codes covered in the scope
As discussed in Part II ldquonational securityrdquo under Section 232 includes both
(1) national defense and (2) critical infrastructure needs
1 Steel is Needed for National Defense Requirements
Steel articles are critical to the nationrsquos overall defense objectives30 The US
Department of Defense (DoD) has a large and ongoing need for a range of steel
products that are used in fabricating weapons and related systems for the nationrsquos
defense31 DoD requirements ndash which currently require about three percent of US
steel production ndash are met by steel companies that also support the requirements for
critical infrastructure and commercial industries
The free market system in the United States requires commercially viable steel
producers to meet defense needs No company could afford to construct and operate
a modern steel mill solely to supply defense needs because those needs are too
diverse In order to supply those diverse national defense needs US steel mills
must attract sufficient commercial (ie non-defense) business The commercial
revenue supports construction operation and maintenance of production capacity
as well as the upgrades research and development required to continue to supply
defense needs in the future See Appendix H for examples
2 Steel is Required for US Critical Infrastructure
Steel also is needed to satisfy requirements for ldquothose industries that the US
Government has determined are critical to minimum operations of the economy and
governmentrdquo32 In the 2001 Report the Department identified 28 ldquocritical
industriesrdquo33 The Critical Infrastructure Assurance Office that identified the
30 ccord 2001 Report at 1 12
31 ISI 2017 public policy agenda available from httpwwwsteelorg~mediaFilesISIReportsISI-2017-
Public-Policy-gendapdfla=en
32 2001 Report at 14 See also 2001 Report at 16 Table 2 for a listing of the 28 critical industries
33 Id
23
ldquocritical industriesrdquo is no longer in existence so for this investigation the Department
instead relied on the industries identified by the US Government in the 2013
Presidential Policy Directive 21 (PPD-21) 34 The Secretary believes that the range
of industries identified in PPD-21 is comparable to the range of critical industries
analyzed in the 2001 Report
Pursuant to PPD-21 there are 16 designated critical infrastructure sectors in
the United States many of which use high volumes of steel (see Appendix I)35 The
16 sectors include chemical production communications dams energy food
production nuclear reactors transportation systems water and waste water systems
Increased quantities of steel will be needed for various critical infrastructure
applications in the coming years The American Society of Civil Engineers
estimates that the United States needs to invest $45 trillion in infrastructure by 2025
and a substantial portion of these projects require steel content36
3 Domestic Steel Production is Essential for National Security
Applications
Domestic steel production is essential for national security Congress in
Section 232(d) directed the Secretary of Commerce and the President to consider
domestic production and the economic welfare of the United States in determining
whether imports threaten to impair national security
In the case of steel the history of US Government actions to ensure the
continued viability of the US steel industry demonstrates that across decades and
Administrations there has been consensus that domestic steel production is vital to
national security
34 PPD-21 can be viewed at httpsobamawhitehousearchivesgovthe-press-office20130212presidential-policy-directive-critical-infrastructure-security-and-resil
35 Department of Homeland Security ritical Infrastructure Sectors httpswwwdhsgovcritical-infrastructure-sectors
36 2017 Infrastructure Report ard merican Society of ivil Engineers httpswwwinfrastructurereportcardorgwp-contentuploads2016102017-Infrastructure-Report-ardpdf
24
Prior significant actions under various statutory authorities to address steel
imports using quotas or tariffs were taken by President George W Bush President
William J Clinton (three times) President George H W Bush President Ronald W
Reagan (three times) President James E Carter (twice) and President Richard M
Nixon all at lower levels of import penetration than at present In the 1970s action
was taken to limit import penetration to approximately 19 percent In the 1980s
import penetration had reached 21 percent and the US Government enacted
correcting measures In the 1990s and 2000s import penetration again reached up to
23 percent which prompted the US Government to take additional actions37 In
2016 import penetration averaged 30 percent and for the first nine months of 2017
imports have consistently averaged over 30 percent of US domestic demand
4 Domestic Steel Production Depends on a Healthy and Competitive
US Industry
US steel producers would be unable to survive purely on defense or critical
infrastructure steel needs In the steel industry it is commercial and industrial
customer sales that generate the relatively steady production needed for
manufacturing efficiency and the revenue volume needed to sustain the business
Sales for critical infrastructure and defense applications are often less predictable
cyclical and limited in volume
Steel manufacturers operating in the United States however have seen their
commercial and industrial business steadily eroded by a growing influx of lower-
priced imported product from countries where steel manufacturing often is
subsidized directly or indirectly The Department of Commerce currently has 164
antidumping and countervailing duty determinations in effect and has 20 additional
cases under investigation to address specific cases See Appendix K
5 Steel Consumed in Critical Industries
In this investigation the issue before the Department is whether steel imports
ldquothreaten to impairrdquo national security See 19 USC sect 1862 As discussed in Part
II the Secretary has determined that in the present case the relevant factors are the
37 See ppendix J for additional detail on US Government actions on steel in the past
25
ldquoserious effects resulting from the displacement of hellip domestic [steel] products by
excessive importsrdquo and the ldquoimpact of foreign competition on the economic welfare
of individual domestic [steel] industriesrdquo that when combined with the circumstance
of massive global excess capacity causes a ldquoweakening of our internal economyrdquo
that ldquomay impair the national securityrdquo38
In a free market system the ability of the domestic steel industry to continue
meeting national security needs depends on the continued capability of the US steel
industry to compete fairly in the commercial marketplace and maintain a financially
viable domestic manufacturing capability This includes the need to have an
adequately skilled workforce for manufacturing as well as to conduct research and
development for future products39 A continued loss of viable commercial
production capabilities and related skilled workforce will jeopardize the US steel
industryrsquos ability to meet the full spectrum of national security requirements
The Department in 2001 determined that the ldquocritical industriesrdquo sector which
is analogous to the more robust critical infrastructure sectors identified pursuant to
PPD-21 would require ldquono more than 3368 million tons of finished steel per yearrdquo40
based on 3088 percent of domestic consumption being used in industries related to
critical infrastructure The Department has now updated the ldquocritical industriesrdquo
calculation from the 2001 Report41 using Census Bureau steel usage figures from
2007 which are the latest available See Appendix I for more detailed information
on steel needs for critical infrastructure
38 19 US sect 1862(d)
39 See 50 US sect 4502(a)(ongress finds that ndash 0 (7) much of the industrial capacity that is relied upon by the United States Government for military production and other national defense purposes is deeply and directly influenced by ndash () the overall competitiveness of the industrial economy of the United States- and the ability of industries in the United States in general to produce internationally competitive products and operate profitably while maintaining adequate research and development to preserve competitiveness with respect to military and civilian production0)
40 2001 Report at 14 The report is not clear whether it is referring to short tons or metric tons While not crucial to the analysis if the figure is in short tons then the equivalent amount in metric tons would be 3056 million metric tons
41 2001 Report at 16 (Table 2)
26
The updated analysis in Appendix I shows that 491 percent of domestic steel
consumption in 2007 was used in critical industries Domestic production in 2007
was 110 million metric tons The 491 percent of domestic consumption used in
critical industries equals 54 million metric tons compared to 3056 million metric
tons (or 3368 million short tons) used in critical industries in 1997 Thus in 10 years
the demand for steel in critical industries increased by 63 percent
B Imports in Such Quantities as are Presently Found Adversely Impact the
Economic Welfare of the US Steel Industry
In the steel sector foreign competition is characterized by substantial and
sustained global overcapacity and production in excess of foreign domestic demand
1 Imports of Steel Products Continue to Increase
The United States is the worldrsquos largest steel importer The top 20 sources of
US imports of steel products accounted for approximately 91 percent of the roughly
36 million metric tons of steel the United States is expected to import in 2017 (see
Figure 2)
Total US imports rose from 259 million metric tons in 2011 peaking at 402
million metric tons in 2014 at the height of the shale hydrocarbon drilling boom For
2017 (first ten months) imports are increasing at a double-digit rate over 2016
pushing finished steel imports consistently over 30 percent of US consumption
27
-
Figure 2 Top US Imports of All Steel Products
Imports for Domestic Consumption Quantity In Metric Tons Ranked By 2017
2017 Rank
Country 2011 2017
(Annualized) Change 2011
2017 (Annualized)
World 25994621 35927141 38
1 Canada 5539448 5800008 5
2 Brazil 2820927 4678530 66
3 South Korea 2572981 3653934 42
4 Mexico 2625104 3249292 24
5 Russia 1269717 3123691 146
6 Turkey 665303 2249456 238
7 Japan 1824393 1781147 -2
8 Germany 978230 1370669 40
9 Taiwan 588036 1251767 113
10 India 735802 854026 16
11 China 1132292 784393 -31
12 Vietnam 120134 727643 506
13 Netherlands 517773 589930 14
14 Italy 276809 515459 86
15 Thailand 72183 417389 478
16 Spain 195907 403091 106
17 United Kingdom 400244 354389 -11
18 South Africa 123001 350425 185
19 Sweden 267685 299170 12
20 United Arab Emirates 63316 290221 358
Top 20 Total 22789285 32744630 44
Source United States Department of Commerce Bureau of the Census Foreign Trade Division IHS Global Trade Atlas Database Revised Statistics for 2011 - 2017 2017 data is annualized based on YTD 2017 through October
As shown in Appendix K antidumping and countervailing duty actions can
address specific instances of unfairly traded steel products However given the large
number of countries from which the United States imports steel and the myriad of
different products involved it could take years to identify and investigate every
instance of unfairly traded steel or attempts to transship or evade remedial duties
28
Moreover US industry has already spent hundreds of millions of dollars in
recent years on ADCVD cases with seemingly no end in sight to their outlays
Smaller steel manufacturers are financially unable to afford these type of cases or
are hesitant to file cases in light of possible market entry retaliation in foreign
markets for finished steel products42
2 High Import Penetration
In contrast to the situation in the 2001 Report where imports of semi-finished
steel represented approximately 7 percent of domestic consumption 43 imports of
finished steel products (ie not including semi-finished steel) currently represent
over 25 percent of US consumption (see Figure 3)44 If imports of semi-finished
products are included the import penetration level has been above 30 percent for the
first ten months of 2017 Import penetration of steel pipe and tube was 74 percent
Figure 3 US Import Penetration of Finished Steel Products (Excludes Semi-Finished)
Source American Iron and Steel Institute YTD data source is through October 2016 and October 2017 Excludes semi-finished imports
42 ongress has specifically expressed concern about the need to maintain small suppliers and the potential adverse impact on military readiness caused by the loss of small suppliers See 50 US sect 4502(a)(8)
43 2001 Report at 31
44 ISIs statistical yearbook reports that about 8 percent of US shipments are made of imported substrate
29
3 High Import to Export Ratio
US imports of steel products which displace demand for domestic steel and
lower production at US plants reached nearly four times the level of exports of
US steel products in 2016 (see Figure 4) The expansion of steel production
capacity outside of the United States in the last decade (Asia the Middle East and
South America) much of it subsidized by national governments continues to
depress world steel prices while making it increasingly difficult for US companies
to export their steel products While US steel producers saw a mild increase in steel
exports from 2005 to 2013 more recently sales to foreign customers have been
declining Exports fell to nine million metric tons in 2016 from a 20-year high of 12
million metric tons annually from 2011 to 2013 Most US steel exports are auto
industry related and are sent to Canada (50 percent by weight in 2016) and Mexico
(39 percent by weight in 2016) Flat products represent the majority of these exports
ndash 57 percent of US steel exports for Canada and 64 percent of steel exports for
North Europe Domestic Hot Rolled Coil 65954 61441 56841 42019 45529 60490
South Europe Domestic Steel Rebar 63659 59834 55166 39411 42768 56853
000
10000
20000
30000
40000
50000
60000
70000
80000
USD
MT
Source Bloomberg Platts Antaike 2017 prices are through December 20 2017
Figure 6 Regional Comparison of Hot Rolled Coil Bench Mark Prices (USDMT)
In 2015 steel prices fell globally As the OECD noted the combined effect
of weakening global steel demand including in the United States growing exports
in many economies and decreases in steelmaking costs led to a very sharp decline
32
in steel prices in 2015 Notwithstanding these effects prices for steel in the US
remained substantially higher than in any other area However relative to prices
between 2010 and 2013 prices are still relatively depressed
Global excess steel production weakens the pricing power of US steel
producers US steel producersrsquo costs are higher than the costs for producers in other
regions due to higher taxes healthcare environmental and other regulatory
expenses Higher US steel prices incentivize importing lower-cost foreign steel
Moreover excess production and lower prices in regions proximate to state
subsidized enterprises displace purchases from market based steel exporters and add
pressure on those market based suppliers to export to the US The effect of global
excess steel production on US steel prices and import levels is discussed in greater
detail in Appendix L
5 Steel Mill Closures
US steel mill closures continue eroding overall US steel mill capacity and
employment Many US steel mills have been driven out of business due to
declining steel prices global overcapacity and unfairly traded steel Since 2000 the
United States has lost over 25 percent of its basic oxygen furnace facilities with the
closure of six facilities RG Steel in Sparrows Point Maryland RG Steel in
Steubenville Ohio RG Steel in Warren Ohio ArcelorMittal in East Chicago
Indiana ArcelorMittal in Weirton West Virginia and US Steel in Fairfield
Alabama
In addition four electric arc furnace steel facilities have closed Evraz in
Claymont Delaware ArcelorMittal in Georgetown South Carolina Gerdau in Sand
Springs Oklahoma and Republic Steel in Lorain Ohio Most recently
ArcelorMittal has announced the closure of its plate rolling mill in Conshohocken
Pennsylvania because of sagging commercial sales attributed to surging imports of
low-cost steel product and flat defense demand45
The closures of these facilities have had a significant impact on the US
industrial workforce and local economies RG Steel suffered three closures
45 owden M rcelor Mittal to Shut P Plate Mill merican Metal market September 18 2017
33
Sparrows Point Maryland Steubenville Ohio and Warren Ohio After filing for
bankruptcy in 2012 more than 2000 employees were displaced in Maryland alone
and another 2000 in the Midwest The company cited weak demand in the steel
industry as well as lack of financing as key contributors to the closure46
Closures of smaller steel mills have had equally devastating impacts on
employment Gerdau Sand Springs in Oklahoma lost 300 employees after closing
in 2009 because of a long-term drop in demand for steel47 Sand Springs was the
last remaining steel plant in Oklahoma and had been in production since the 1920s
In 2013 at least 345 employees were laid off in response to the closure of the
Claymont steel mill in Delaware The Governor of Delaware Jack Markell
attributed the financial difficulties of the facility to ldquosubdued market demand and the
high volume of importsrdquo48
Similar difficulties were cited by the ArcelorMittalrsquos Georgetown South
Carolina facility and US Steelrsquos location in Fairfield Alabama both of which
closed in 2015 Layoffs for these two corporations totaled 226 and more than 1100
employees respectively Both companies attributed the layoffs to financial losses
and ultimately to facility closures due to the rise in competition from inexpensive
imports49
Even temporary idling of steel plants threatens the US steel industry as there
are significant financial costs with re-opening a steel mill Multiple US facilities
remain idled there are four idled basic oxygen furnace facilities two each in
Kentucky and Illinois representing almost one third of the remaining basic oxygen
46 usiness Journal Unforeseen onditions loses Warren Steel Holdings January 12 2016 httpbusinessjournaldailycomutilities-cut-to-warren-steel-holdings- altimore rew Six reasons why the Sparrows Point steel mill collapsed May 25 2012 httpsbaltimorebrewcom20120525six-reasons-why-the-sparrows-point-steel-mill-collapsed
47 News on 6 Sand Springs Steel Plant May lose June 9 2009 httpwwwnewson6comstory10500785sand-springs-steel-plant-may-close
48 usiness Insider Shutdown of Russian Steel Mill in Delaware ould Send a Message bout US Trade October 17 2013 httpwwwbusinessinsidercomevraz-closes-claymont-steel-2013-10
49 Lcom US Steel lays off 200 more workers in Fairfield March 18 2016 httpwwwalcombusinessindexssf201603us_steel_lays_off_200_more_worhtml
34
furnace facilities in United States50 In addition there are idled pipe and tube mills
in Texas Ohio and Alabama Once production is halted at these facilities it is not
always possible to bring back the highly skilled workforce needed to operate them
When steel mill restarts do occur additional costs are often incurred for specialized
worker training and production ramp-up
In addition when a steel mill closes at a given location the workers find other
occupations move to other steel mills or remain indefinitely unemployed After a
significant period of unemployment much of the specialized skill required by steel
mill workers is forgotten Furthermore it is typically not easy to find and recruit
displaced workers who may live hundreds or thousands of miles away
6 Declining Employment Trend Since 1998
US steel industry employment has declined 35 percent (216400 in 1998 to
139800 in January 2016 - December 2016) including 14100 lost jobs between 2015
and 2016 While employment numbers increased slightly in certain years the trend
is dramatically downward (see Figure 7) Layoffs defer formal plant closings but
are an indication of financial distress Layoffs in the last two years have been
particularly acute in steel producers with pipe and tubular facilities In addition to
layoffs there are permanent closures and bankruptcies in the industry 51
The loss of skilled workers is especially detrimental to the long-term health
and competitiveness of the industry The unstable and declining employment
outlook for the industry also dissuades younger workers from wanting to participate
in the future US steel industry The inability to rapidly add skilled workers to the
industry negatively affects current manufacturing capabilities This is especially
problematic in the event of a major production surge or mobilization
Source Bureau of Labor Statistics using the annual average of seasonally adjusted employees NAICS Codes 3311 and 3312 updated 11222017
Figure 7 Combined Steel Industry Employment (Yearly Average)
7 Trade Actions ndash Antidumping and Countervailing Duties
The number of US antidumping and countervailing duty measures in effect
illustrates the scope of the problem confronting the US steel industry In 1998 at
the height of that periods steel crisis there were just over 100 antidumping and
countervailing duty cases against finished steel products52 Today there are 164
antidumping and countervailing duty orders in effect for steel with another 20 steel
investigations currently ongoing and another waiting to take effect through
publication in the Federal Register (see Appendix K for a full listing of Steel
Antidumping and Countervailing Duty Orders in Effect) This represents a 60
percent increase in cases since the last time the Department investigated steel in
2001
8 Loss of Domestic Opportunities to Bidders Using Imported Steel
Despite efforts to level the playing field through ADCVD orders there are
numerous examples of US steel producers being unable to fairly compete with
foreign suppliers including the lack of ability to bid on some critical US
infrastructure projects Due to unfair competition particularly from foreign state-
52 Global Steel Trade Structural Problems and Future Solutions- Department of ommerce- July 2000
36
owned enterprises US steel producers have lost out on US business opportunities
Some examples include Chinese companies providing steel for the eastern span of
the San Francisco-Oakland Bay Bridge as well as the Alexander Hamilton Bridge
over the Harlem River in New York53
The Alliance for American Manufacturingrsquos statement before the
Congressional Steel Caucus (March 2017) identified three other recent infrastructure
projects in New York that have used or will use heavily subsidized or possibly
dumped foreign steel the Verrazano-Narrows Bridge LaGuardia Airport and the
Holland Tunnel Two major US cities ndash Boston and Chicago ndash have contracted
with Chinese companies to build new subway cars primarily constructed with
imported steel for their respective transportation systems54
9 Financial Distress
Rising levels of imports of steel continue to weaken the US steel industryrsquos
financial health Years of running on low-profit margins or at a loss have weakened
an industry that continues to face an ever-increasing wave of steel imports The US
industry as a whole has operated on average with negative net income from 2009-
2016 Net income for US-owned steel companies has averaged only $162 million
annually since 2010 challenging the financial viability of this vital industry (see
Figure 8)
53 New York Times ridge omes to San Francisco With a Made-in-hina Label June 25 2011 httpwwwnytimescom20110626businessglobal26bridgehtml
54 Reuters hinas RR lands $13 billion hina rail car project March 10 2016 httpwwwreuterscomarticleus-crrc-usa-idUSKN0W17I
37
The Stern School of Business at New York University calculates that US steel
industry participants in the last five years experienced negative net income of 178
percent Compounded growth in revenue for the past five years in the steel industry
has been a negative 7 percent55 The loss of revenue has caused US steel
manufacturers both large and small to defer or eliminate production facility capital
investments and funding for research and development Even though there was a
slight uptick in net income for the first quarter in 2017 over the fourth quarter of
2016 margins remain poor compared to historic levels
Not only have earnings before interest taxes depreciation and amortization
(EBITDA) been shallow for steel producers in the United States many of them are
burdened with high levels of debt as much as 119 times of earnings for one major
producer (see Figure 9)56 While some companies are starting to pay down debt
55 Historical (ompounded nnual) Growth Rates by Sector swath Damodaran New York University Stern School
of usiness January 2017 (see httppagessternnyuedu~adamodarNew_Home_Pagedatafile histgrhtml) 56 Nucor operates mini-mills that use electric arc furnaces to produce high demand steel products primarily with recycled steel scrap From a financial perspective this business model allows Nucor to be highly price competitive but the company produces a narrower range of flat steel products than integrated steel mills The
mini-mills can weather bad economic times because they have lower energy costs and can regulate production
38
others have not been able to do so primarily because of slack demand for
domestically produced steel in the face of competition from imported products
Absent increases in steel production volume and pricing one leading law firm
specializing in insolvency White amp Case observes that some steelmakers in the
United States may soon have to renegotiate loan agreements to extend maturities
those that are not able to may have to consider Chapter 11 bankruptcy57
No capital intensive industry can survive with such poor margins over the
longer term The extensive leverage in the industry shown in Figure 9 adds to the
more easily asic oxygen furnace plants have higher fixed operating costs because they directly convert iron ore and other raw materials along with scrap into steel using more energy-intensive processes
57 Losing Strength US Steel Industry nalysis Scott Griesman White ase pril 16 2016 (see httpswwwwhitecasecompublicationsarticlelosing-strength-us-steel-industry-analysis)
39
likelihood of further closures if the present high level of imports continues to force
US steel mills to operate well below profitable capacity utilization rates
10 Capital Expenditures
The ability of US manufacturers of iron and steel products to fund capital
expenditures for new production plants as well as facility modernization and
advanced manufacturing equipment has been limited by falling revenue and reduced
profits As shown in Figure 10 annual capital expenditures for companies making
iron and steel ingot bars rods plate and other semi-finished products wavered from
$57 billion to $51 billion for 2010-2012 before ramping to $71 billion in 2013
Figure 10 Annual Capital Expenditures
Iron Steel and Ferroalloys Steel NAICS Codes 3311 and 3312 Combined
Millions of Current Dollars
Annual Capital Expenditures Survey 2010 2011 2012 2013 2014 2015
A Structures [New amp Used Structures Combined] 1026 1322 1564 1157 724 580
B Equipment [New amp Used Equipment Combined] 4634 4572 3592 5954 3139 2531
C Total Capital Expenditures 5661 5894 5157 7111 3863 3110
D (Unweighted) Payroll of Reporters Total Payroll of Firms Classified in Industry group
86 84 80 61 86 84
Source US Census Bureau Annual Capital Expenditures Survey wwwcensusgovprograms-surveysaceshtml
Confronted with receding orders for products and declines in income in 2013
iron and steel companies operating production facilities in the United States started
curtailing capital investments Total capital spending dropped to $387 billion in
2014 and slid further to $311 billion in 2015 ndash 32 percent below 2010 levels of $566
billion
The decline in capital expenditures reflected similar drops in net sales which
plummeted from $1296 billion in 2014 to $102 billion in 2015 Income after taxes
40
for US iron and steel manufacturers fell from $248 billion in the same two-year
period to a massive loss of $35 billion in 2015
C Displacement of Domestic Steel by Excessive Quantities of Imports has the
Serious Effect of Weakening Our Internal Economy
1 Domestic Steel Production Capacity is Stagnant and Concentrated
According to the OECD US steel production capacity has remained stagnant
at an average of approximately 1143 million metric tons for more than a decade
from 2006-2016 (see Figure 11) For 2016 the rated maximum capacity was 113
million metric tons for existing basic oxygen furnace and electric arc furnace
Source Organization for Economic Cooperation and Development (OECD) 2017 capacity is a forecast
41
42
The present situation with respect to basic oxygen furnace production is
significantly worse than the situation assessed by the Department in the 2001 Report
As shown in Figure 13 below the number of basic oxygen furnace facilities and units
has declined precipitously since 1995 In 2000 there were 105 companies that
produced raw steel at 144 locations59 while today there are only 38 companies
producing steel at 93 locations a 64 percent and 36 percent reduction respectively
Most importantly in 2000 thirteen companies ldquooperated integrated steel mills
with an average of 35 blast furnaces in continuous operation during the yearrdquo60 while
today there are only three companies operating 13 basic oxygen furnaces These are
77 percent and 60 percent reductions respectively As a result today only 26 percent
of domestic steel is produced from raw materials in the United States as compared
to 53 percent in 2000
As noted earlier since 2000 there has been over a 25 percent reduction in the
number of basic oxygen furnaces operating in the United States and 33 percent of
the remaining basic oxygen furnaces are currently idled In the Secretaryrsquos view a
further reduction in basic oxygen furnace capacity which is especially important to
the ability of domestic industry to meet national security needs is inevitable if the
present imports continue or increase
This would be a serious ldquoweakening of our internal
economyrdquo and place the United States in a position where it is unable to be certain
59 2001 Report at 21
60 Id
43
it could meet demands for national defense and critical industries in a national 61emergency
Figure 13 Basic Oxygen and Electric Arc Facilities and Units Located in the United States 1975 - 2016
Year asic Oxygen Furnace Facilities
asic Oxygen Furnace Units
Electric rc Furnace Facilities
Electric rc Furnace Units
1975 38 90 -- --
1980 33 78 -- --
1985 27 66 -- --
1990 24 61 127 246
1995 22 56 116 218
2000 19 50 122 174
2005 17 46 115 169
2010 16 44 108 164
2015 13 31 98 154
2016 13 31 98 154 Source US Department of CommerceBIS American Iron and Steel Institute Association for Iron amp Steel Technology Steel Manufacturers Association August 2017 Estimated
Basic Oxygen Furnace Basic Oxygen Furnaces (BOF) are the dominant steelmaking technology globally accounting for 74 of the worlds total output of crude steel in 2016 OF share of production in the US was 33 in 2016 and has been slowly declining due primarily to the advent of the Greenfield electric arc furnace (EF) flat-rolled mills The primary raw materials for the BOF are liquid hot metal (iron) from the blast furnace and steel scrap [1] These are charged into the BOF vessel Oxygen (gt995 pure) is blown into the OF at supersonic velocities It oxidizes the carbon and silicon contained in the hot metal liberating great quantities of heat which melts the scrap Source Steelorg
Electric Arc Furnace The Electric Arc Furnace (EAF) operates as a batch melting process producing batches of molten steel known heats The EF process uses steel scrap and iron units melting them using electricity to make new steel EF output accounted for 66 of US steel production in 2016 Source Steelorg
[1 The last Furnace chemically reduces and physically converts iron oxides into liquid iron called hot metal The blast furnace is a huge steel stack lined with refractory brick where iron ore coke and limestone are dumped into the top and preheated air is blown into the bottom The raw materials require six to eight hours to descend to the bottom of the furnace where they become the final product of liquid slag and liquid iron Source Steelorg
In contrast to the situation in the United States the leading global producers
of steel (Brazil South Korea Japan Russia Germany and especially China)
primarily rely on basic oxygen furnace capacity rather than electric arc furnace
capacity (see Figure 14) Each of these economic competitors to the United States
possess critical research development and production capabilities that the United
61 See infra sections 4 and 5 for a further discussion of the inability to meet surge requirements in an emergency
44
rsquo
States is in danger of losing if imports continue to force US steel producers to
operate at uneconomic capacity utilization levels
A further reduction in domestic basic oxygen furnace capacity would put the
United States at serious risk of becoming dependent on foreign steel to support its
critical industries and defense needs Allowing this decline to continue represents a
ldquoweakening of our internal economy that may impair national securityrdquo which the
Congress has directed the Secretary to advise the President of under the Section 232
See 19 USC sect 1862(d)
Figure 14 The Top 20 Countries Exporting to the US ndash BOF vs EAF Capacity
Rank Top Import Sources in 2016 in Tonnage
Terms
2015 OF Share
2015 EF Share
2015 Other Share
pprox ountry s verage apacity Utilization in 2016
(OED) World 7420 2520 050 67
1 Canada 5380 4620 62
2 Brazil 7820 2020 57
3 South Korea 6960 3040 80
4 Mexico 2970 7030 75
5 Turkey 3500 6500 65
6 Japan 7710 2290 80
7 Russia 6630 3050 310 76
8 Germany 7040 2960 72 (EU 28)
9 Taiwan 6230 3770 75
10 Vietnam 2500 5990 1520 32
11 China 9390 610 69
12 Netherlands 9860 150 72 (EU 28)
13 Italy 2130 7820 72 (EU 28)
14 United Kingdom 8300 1700 72 (EU 28)
15 France 6560 3440 72 (EU 28)
16 India 4290 5710 75
17 Australia 7760 2240 63
18 Spain 3170 6830 72 (EU 28)
19 Sweden 6610 3390 72 (EU 28)
20 South Africa 5650 4350 585 Source World Steel- Production Share Figures for 2015 US ensus ureau (ccessed Via HIS) ndash Import Growth Rates OED 2017 Q2 Market ssessment ndash pproximate apacity Utilization
This is not a hypothetical situation The Department of Defense already finds
itself without domestic suppliers for some particular types of steel used in defense
45
products including tire rod steel used in military vehicles and trucks62 While the
United States has many allies that produce steel relying on foreign owned facilities
located outside the United States introduces significant risk and potential delay for
the development of new steel technologies and production of needed steel products
particularly in times of emergency The Secretary notes that the authority for the
Department of Defense to place its order ahead of commercial orders on a mandatory
basis does not extend to foreign-owned facilities outside the United States63
In the case of critical infrastructure the United States is down to only one
remaining producer of electrical steel in the United States (AK Steel ndash which is
highly leveraged) Electrical steel is necessary for power distribution transformers
for all types of energy ndash including solar nuclear wind coal and natural gas ndash across
the country If domestic electrical steel production as well as transformer and
generator production is not maintained in the US the US will become entirely
dependent on foreign producers to supply these critical materials and products64
Without an assured domestic supply of these products the United States cannot be
certain that it can effectively respond to large power disruptions affecting civilian
populations critical infrastructure and US defense industrial production
capabilities in a timely manner
2 Production is Well Below Demand
Demand for steel products in the United States (see Figure 15) increased from
1001 million metric tons in 2011 to 1175 million metric tons in 2014 then declined
to 998 million metric tons in 2016 Demand in 2017 is projected to rebound to
1077 million metric tons During the 2011 to 2016 period US production of steel
products dropped from 864 million metric tons in 2011 to 786 million metric tons
in 2016 with a four percent increase expected in 2017
62 Letter from Defense Logistics gency olumbus OH to ISOTE ugust 1 2017
63 See Defense Priorities and llocations System Program (DPS) wwwdcmamilDPS
64 United States ongress ongressional Steel aucus Statement of Roger Newport EO K Steel orporation (on behalf of the merican Iron and Steel Institute) March 29 2017
46
For the six-year period US domestic steel production supplied only 70
percent of the average demand even though available US domestic steel production
capacity during that period could have on average supplied up to 100 percent of
demand (US steel producers would be running at 92 percent capacity utilization for
this period) with approximately 13 million metric tons of additional capacity
remaining
Figure 15 US Steel Market Snapshot (millions of metric tons)
2011 2012 2013 2014 2015 2016 2017 YTD
2017 nnualized
Total Demand for Steel in US (Production + Imports - Exports)
US Annual Production (Liquid) 864 887 869 882 788 786 615 819
Sources United States Department of ommerce ureau of the ensus merican Iron and Steel Institute alculations based on industry and trade data
3 Utilization Rates are Well Below Economically Viable Levels
Overall steel mill production capacity utilization has declined from 87 percent
in 1998 to 814 percent in 2008 to 694 percent in 2016 (see Figure 16) For the
most recent six-year period (2011- 2016) the average utilization rate was 74 percent
Industry analysts note that utilization of 80 percent or more is typically
necessary for sustained profitability among other factors65 For most capital and
energy-intensive US steel producers capacity levels of 80 percent or higher are
required to maintain facilities carry out periodic modernization service company
debt and fund research and development
65 Market Realist Why steel investors are mindful of capacity utilization rates October 2 2014 httpmarketrealistcom201410investors-mindful-capacity-utilization-rate See also httpmarketrealistcom201509upstream-exposure-impact-steel-companies
47
When steel factory utilization falls costs per unit of steel product rises
reducing profit margins and product pricing flexibility Higher capacity utilization
usually results in lower per-unit product costs and higher overall profit66 Over 80
percent is a healthy capacity utilization rate and a rate at which most companies
would be profitable
The US steel industry uses 80 percent as a benchmark for minimum
operational efficiency Moreover the steel industry is capable of reaching and
sustaining 80 percent capacity utilization or higher During the 2002-2008 period
US steel companies operated at an average 874 percent level 67
These industry assessments are consistent with a 1983 report on ldquoCritical
Materials Requirements in the US Steel Industryrdquo in which the Department
66 Houston hronical apacity Utilization and Effects on Product and Profit httpsmallbusinesschroncomcapacity-utilization-effects-product-profit-67046html- steel industry sources
67 httpmarketrealistcom201509upstream-exposure-impact-steel-companieshtml (Its important to note how changes in capacity utilization rates impact a companys earnings For example we see a big jump in earnings when utilization rates improve from 80 percent to 85 percent However incremental benefits are lower when utilization rates increase from 90 percent to 95 percent )
48
explained that ldquo[c]apability utilization or capacity use which in effect describes the
efficiency of an industrys use of capital is a prime determinant of profitability
Domestic steel producers were operating at about 55 percent capability for the first
half of 1982 The comparable rate for the first half of 1981 was 85 percent This
current rate is probably well below a breakeven point for most producers whereas
1981 was profitable for nearly all producersrdquo68
4 Declining Steel Production Facilities Limits Capacity Available for a
National Emergency
The number of steel production facilities located in the US continues to
decline As shown earlier in Figure 13 from 1975 to 2016 the number of basic
oxygen furnace facilities decreased from 38 to 13 Similarly from 1990 to 2016
the number of electric arc furnace facilities decreased from 127 to 98
Due to this decline in facilities domestic steel producers have a shrinking
ability to meet national security production requirements in a national emergency
The US Department of Commerce Census Bureau regularly surveys plant capacity
and has found that steel producers are quickly shedding production capacity that
could be used in a national emergency The Census Bureau defines national
emergency production as the ldquogreatest level of production an establishment can
expect to sustain for one year or more under national emergency conditionsrdquo69 From
2011 to 2017 steel producers increased the utilization of the surge capacity they
would have during a national emergency from 542 percent to 682 percent (see
Figure 17) As steel producers use more of this emergency capacity there is an
increasingly limited ability to ramp up steel production to meet national security
needs during a national emergency
68 Department of ommerce ritical Materials Requirements in the US Steel Industry March 1983 at 16-17
69 US Dept of ommerce ensus ureau Survey of Plant apacity 2011-2017
49
0
10
20
30
40
50
60
70
80
2011 2012 2013 2014 2015 2016 2017
Figure 17 Steel Industry Utilization of Emergency Capacity (2011-2017 Quarter 1)
Source US Department of ommerce ensus ureau Survey of Plant apacity
Percent
The ability to increase steel production during a national emergency
continues to diminish as the number of steel production facilities continues to
decline If the US requires a similar increase in steel production as it did during
previous national emergencies domestic steel production capacity may be
insufficient to satisfy national security needs If a national emergency were to
occur at present utilization levels domestic steel producers would be able to
increase production by 146 percent
For comparison from 1938 through 1946 the US increased the production
of pig iron and ferro-alloys by 217 percent and increased the production of steel
ingots and castings by 210 percent to meet the demands of fighting a global war 70
From 1960 through 1973 during the Vietnam era the US increased steel
production by 152 percent 71 Should the US once again experience a conflict on
the scale of the Vietnam War steel production capacity may be slightly insufficient
70 US Dept of ommerce ensus ureau Statistical bstract of the United States 1948 Page 876
71 US Dept of ommerce ensus ureau Statistical bstract of the United States 1978 Page 830
50
to meet national security needs But if the US were to experience a conflict
requiring the production increase seen during the Second World War the existing
domestic steel production capacity would be unable to meet national security
requirements
Increasing steel production capacity once a large-scale national emergency
has arisen would take a significant amount of time According to the American Iron
and Steel Institute the replacement of a basic oxygen furnace facility takes more
than a year to complete Therefore the lack of spare domestic steel production
capacity and the possible inability to sufficiently increase production during a
national emergency may impair the national security of the United States
D Global Excess Steel Capacity is a Circumstance that Contributes to the
Weakening of the Domestic Economy
1 Free markets globally are adversely affected by substantial chronic
global excess steel production led by China
Numerous studies reports and investigations have documented the global excess
steel capacity with China having the largest installed capability (see Figure
18)727374 OECD analyses show that the worldrsquos nominal crude steelmaking capacity
reached about 24 billion metric tons in 2016 an increase of 127 percent compared
to the 2000 level Most of the capacity expansion was planned for construction and
manufacturing activities and to help build the infrastructure necessary for economic
development ndash most in non-OECD countries Furthermore the OECD reports that
while steel capacity increased at a steady rate world steel demand contracted sharply
in the aftermath of the global economic and financial crisis of 2008 Global demand
for steel recovered slowly in the years following 2008 However since 2013 global
steel demand has flattened thereby widening the capacitydemand gap By 2015 the
gap reached over 700 million metric tons
72 run L (2016) Overcapacity in Steel Chinarsquos Role in a Global Problem Washington D lliance for merican Manufacturing httpaamwebs3amazonawscomuploadsresourcesOvercapacityReport2016_R3pdf
73 Price Weld El-Sabaawi L Teslik (2016) apacity Runs Riot Washington D Wiley Rein LLP
74 OED Reports (2016) httpwwwoecdorgindustryind82nd-session-of-the-steel-committeehtm
51
The vast size of the capacitydemand gap means that steel demand alone
cannot increase enough to balance the global overcapacity problem which is
particularly prevalent in China Chinese excess capacity estimated at more than 300
million metric tons dwarfs total US production capacity (see Figure 19)75
The effect of global overcapacity and excess steel production on US steel
prices and import levels is discussed in greater detail in Appendix L While US
steel production capacity has remained flat since 2001 other steel producing nations
have increased their production capacity with China alone able to produce as much
steel as the rest of the world combined
75 OED High Level Meeting Excess apacity and Structural djustment in the Steel Sector pril 2016 httpwwwoecdorgstiindackground20document20No202_FINL_Meetingpdf
52
0
500
1000
1500
2000
2500 M
illio
ns
of
Met
ric
Ton
s
Figure 19 Steelmaking Capacity
World Total China United States
Source OECD
2009 2010 2011 2012 2013 2014 2015 2016 2017
Several countries (India Iran and Indonesia) in addition to China continue to
add production capacity despite slack global demand According to the OECD Steel
Committee Chairrsquos statement from March 2017 ldquoNew data suggest that nearly 40
million metric tons of gross capacity additions are currently underway and could
come on stream during the three-year period of 2017-19 while an additional 536
million metric tons of capacity additions are in the planning stages for possible start-
up during the same time periodrdquo76 This additional global steel capacity coming
online represents over 80 percent of existing US steelmaking production capacity
demonstrating that the import challenge to US industry is continuing to grow
2 Increasing global excess steel capacity will further weaken the internal
economy as US steel producers will face increasing import competition
These additions to worldwide steelmaking capacity will only exacerbate the
situation because they will further lower global operating utilization rates including
in the United States Growth in foreign government-subsidized steel production is
progressively weakening the financial health of the US steel industry as other steel
76 OED 82nd Session of the OED Steel ommittee ndash hairs Statement March 2017 httpwwwoecdorgstiind82-oecd-steel-chair-statementhtm
53
producing countries export more steel to the US to in part to offset the loss of
regional markets to Chinese steel (see Appendix L)
The US share of global production continues to steadily decline In the year
2000 when President Clinton signed into a law a statute granting China permanent
normal trade relations status77 the US share of global steel production stood at 12
percent78 Since that point in time the US share of global steel production continued
an inexorable decline as other countries and especially China began to increase
production The US share of global steel production fell to 8 percent in 200579 5
percent in 200980 and 48 percent in 201581 In contrast China commanded a 497
percent share of global steel production in 201582
If even half of the planned additional global capacity identified by the OECD
Steel Committee is built and the related new production finds its way into the US
it will drive the operating rate of US steel mills to less than 50 percent of capacity
This will cause a substantial and unsustainable negative cash situation that will
ultimately result in multiple corporate bankruptcies due to heavy debt loads and
related declines in steel production capacity and employment levels
77 Public Law 106-286 n act to authorize extension of nondiscriminatory treatment (normal trade relations treatment) to the Peoples Republic of hina and to establish a framework for relations between the United States and the Peoples Republic of hina October 10 2000 httpswwwgpogovfdsyspkgPLW-106publ286
78 US Dept of ommerce ensus ureau Statistical bstract of the United States 2012 Page 574
79 Id
80 Id
81 Steel Statistical Yearbook 2016 World Steel ssociation httpswwwworldsteelorgendamjcr37ad1117-fefc-4df3-b84f-6295478ae460Steel+Statistical+Yearbook+2016pdf
82 Steel Statistical Yearbook 2017 World Steel ssociation httpswwwworldsteelorgendamjcr3e275c73-6f11-4e7f-a5d8-23d9bc5c508fSteel+Statistical+Yearbook+2017pdf
54
VI CONCLUSION
The Secretary has determined that the displacement of domestic steel by
excessive imports and the consequent adverse impact of those quantities of steel
imports on the economic welfare of the domestic steel industry along with the
circumstance of global excess capacity in steel are ldquoweakening our internal
economyrdquo and therefore ldquothreaten to impairrdquo the national security as defined in
Section 232
The continued rising levels of imports of foreign steel threaten to impair the
national security by placing the US steel industry at substantial risk of displacing
the basic oxygen furnace and other steelmaking capacity and the related supply
chain needed to produce steel for critical infrastructure and national defense
In considering ldquothe impact of foreign competition on the economic welfare of
individual domestic [steel] industriesrdquo and other factors Congress expressly outlined
in Section 232 the Secretary has determined that the continued decline and
concentration in steel production capacity is ldquoweakening of our internal economy
and may impair national securityrdquo See 19 USC sect 1862(d)
Global excess steel capacity is a circumstance that contributes to the
ldquoweakening of our internal economyrdquo that ldquothreaten[s] to impairrdquo the national
security as defined in Section 232 Free markets globally are adversely affected by
substantial chronic global excess steel production led by China While US steel
production capacity has remained flat since 2001 other steel producing nations have
increased their production capacity with China alone able to produce as much steel
as the rest of the world combined This overhang of excess capacity means that US
steel producers for the foreseeable future will face increasing competition from
imported steel as other countries export more steel to the United States to bolster
their own economic objectives
Since defense and critical infrastructure requirements alone are not sufficient
to support a robust steel industry US steel producers must be financially viable and
competitive in the commercial market to be available to produce the needed steel
output in a timely and cost efficient manner In fact it is the ability to quickly shift
55
production capacity used for commercial products to defense and critical
infrastructure production that provides the United States a surge capability that is
vital to national security especially in an unexpected or extended conflict or national
emergency It is that capability which is now at serious risk as imports continue to
take business away from domestic producers these producers are in danger of falling
below minimum viable scale and are at risk of having to exit the market and
substantially close down production capacity often permanently
Steel producers in the United States are facing widespread harm from
mounting imports Growing global steel capacity flat or declining world demand
the openness of the US steel market and the price differential between US market
prices and global market prices (often caused by foreign government steel
intervention) ensures that the US will remain an attractive market for foreign steel
absent quotas or tariffs Excessive imports of steel now consistently above 30
percent of domestic demand have displaced domestic steel production the related
skilled workforce and threaten the ability of this critical industry to maintain
economic viability
A US steel industry that is not financially viable to invest in the latest
technologies facilities and long-term research and development nor retain skilled
workers while attracting a next-generation workforce will be unable to meet the
current and projected needs of the US military and critical infrastructure sectors
Moreover the market environment for US steel producers has deteriorated
dramatically since the 2001 Report when the Department concluded that imports of
iron ore and semi-finished steel do not ldquofundamentally threatenrdquo the ability of US
industry to meet national security needs83
The Departmentrsquos investigation indicates that the domestic steel industry has
declined to a point where further closures and consolidation of basic oxygen furnace
facilities represents a ldquoweakening of our internal economyrdquo as defined in Section
232 The more than 50 percent reduction in the number of basic oxygen furnace
83 2001 Report at 28 ndash 37 s noted supra note 16 the 2001 Report added the qualifier fundamentally which is not found in the statutory text The Secretary in this report uses the statutory standard of threatens to impair without such qualification
56
facilities ndash either through closures or idling of facilities due to import competition ndash
increases the chance of further closures that place the United States at serious risk
of being unable to increase production to the levels needed in past national
emergencies The displacement of domestic product by excessive imports is having
the serious effect of causing the domestic industry to operate at unsustainable levels
reducing employment diminishing research and development inhibiting capital
expenditures and causing a loss of vital skills and know-how The present capacity
operating rates for those remaining plants continue to be below those needed for
financial sustainability These conditions have been further exacerbated by the 22
percent surge in imports thus far in 2017 compared with 2016 Imports are now
consistently above 30 percent of US domestic demand
It is evident that the US steel industry is being substantially impacted by the
current levels of imported steel The displacement of domestic steel by imports has
the serious effect of placing the United States at risk of being unable meet national
security requirements The Secretary has determined that the ldquodisplacement of
domestic [steel] products by excessive importsrdquo of steel is having the ldquoserious effectrdquo
of causing the ldquoweakening of our internal economyrdquo See 19 USC sect 1862(d)
Therefore the Secretary recommends that the President take corrective action
pursuant to the authority granted by Section 232 See 19 USC sect 1862(c)
57
VII RECOMMENDATION
Prior significant actions to address steel imports (quotas andor tariffs) were
taken under various statutory authorities by President George W Bush President
William J Clinton (three times) President George H W Bush President Ronald W
Reagan (three times) President James E Carter (twice) and President Richard M
Nixon all at lower levels of import penetration than the present level which is above
30 percent
Due to the threat of steel imports to the national security as defined in Section
232 the Secretary recommends that the President take immediate action by adjusting
the level of imports through quotas or tariffs on steel imported into the United States
as well as direct additional actions to keep the US steel industry financially viable
and able to meet US national security needs The quota or tariff imposed should be
sufficient after accounting for any exclusions to enable the US steel producers to
be able to operate at about an 80 percent or better of the industryrsquos capacity
utilization rate based on available capacity in 2017
In 2016 US steel production was 786 million metric tons and US capacity
was 1133 million metric tons which represents a 694 percent capacity utilization
rate If current import trends for 2017 continue continued imports without any
action are projected to be 360 million metric tons an increase over 2016 of 60
million metric tons Even with US demand projected to increase to 1073 from
998 million metric tons increased imports mean US capacity utilization is forecast
to rise only to 723 percent a non-financially viable and unsustainable level of
operation
By reducing import penetration rates to approximately 21 percent US
industry would be able to operate at 80 percent of their capacity utilization
Achieving this level of capacity utilization based on the projected 2017 import levels
will require reducing imports from 36 million metric tons to about 23 million metric
tons If a reduction in imports can be combined with an increase in domestic steel
demand as can be reasonably expected rising economic growth rates combined with
the increased military spending and infrastructure proposals that the Trump
Administration has planned then US steel mills can be expected to reach a capacity
58
utilization level of 80 percent or greater This increase in US capacity utilization
will enable US steel mills to increase operations significantly in the short-term and
improve the financial viability of the industry over the long-term
Recommendation to Ensure Sustainable Capacity Utilization and
Financial Health
Impose a Quota or Tariff on all steel products covered in this investigation
imported into the United States to remove the threatened impairment to
national security The Secretary recommends adjusting the level of imports through
a quota or tariff on steel imported into the United States
Alternative 1 ndash Global Quota or Tariff
1A Global Quota
Impose quotas on all imported steel products at a specified percent of the 2017
import level applied on a country and steel product basis
According to the Global Trade Analysis Project (GTAP) Model produced by
Purdue University a 63 percent quota would be expected to reduce steel imports by
37 percent (133 million metric tons) from 2017 levels Based on imports from
January to October import levels for 2017 are projected to reach 360 million metric
tons The quotas adjusted as necessary would result in imports equaling about 227
million metric tons which will enable an 80 percent capacity utilization rate at 2017
demand levels (including exports) Application of an annual quota will reduce the
impact of the surge in steel imports that has occurred since the beginning of 2017
1B Global Tariff
Apply a tariff rate on all imported steel products in addition to any
antidumping or countervailing duty collections applicable to any imported steel
product
Similar to what is anticipated under a quota according to the Global Trade
Analysis Project (GTAP) Model produced by Purdue University a 24 percent tariff
on all steel imports would be expected to reduce imports by 37 percent (ie a
59
reduction of 133 million metric tons from 2017 levels of 360 million metric tons) 84
This tariff rate would thus result in imports equaling about 227 million metric tons
which will enable an 80 percent capacity utilization rate at 2017 demand levels
(including exports)85
Alternative 2 ndashTariffs on a Subset of Countries
Apply a tariff rate on all imported steel products from Brazil South Korea
Russia Turkey India Vietnam China Thailand South Africa Egypt Malaysia and
Costa Rica in addition to any antidumping or countervailing duty collections
applicable to any steel products from those countries All other countries would be
limited to 100 percent of their 2017 import level
According to the Global Trade Analysis Project (GTAP) Model produced by
Purdue University a 53 percent tariff on all steel imports from this subset of
countries would be expected to reduce imports by 133 million metric tons from 2017
import levels from the targeted countries This action would enable an increase in
domestic production to achieve an 80 percent capacity utilization rate at 2017
demand levels (including exports) The countries identified are projected to account
for less than 4 percent of US steel exports in 2017
Exemptions
In selecting an alternative the President could determine that specific
countries should be exempted from the proposed 63 percent quota or 24 percent tariff
by granting those specific countries 100 percent of their prior imports in 2017 based
on an overriding economic or security interest of the United States The Secretary
recommends that any such determination should be made at the outset and a
corresponding adjustment be made to the final quota or tariff imposed on the
84 Due to general equilibrium effects the overall import level would need to decrease by more than the corresponding increase in domestic production to offset the negative effects of price or exchange rate changes on export demand
85 The elasticity factor is an estimate not a certainty variation of 01 in the elasticity factor would change the tonnage reduction by about 375000 tons For example imports would fall by an additional 375000 tons under a demand elasticity of -17 instead of -16 and a 25 percent tariff
60
remaining countries This would ensure that overall imports of steel to the United
States remain at or below the level needed to enable the domestic steel industry to
operate as a whole at an 80 percent or greater capacity utilization rate The limitation
to 100 percent of each exempted countryrsquos 2017 imports is necessary to prevent
exempted countries from producing additional steel for export to the United States
or encouraging other countries to seek to trans-ship steel to the United States through
the exempted countries
It is possible to provide exemptions from either the quota or tariff and still
meet the necessary objective of increasing US steel capacity utilization to a
financially viable target of 80 percent However to do so would require a reduction
in the quota or increase in the tariff applied to the remaining countries to offset the
effect of the exempted import tonnage
Exclusions
The Secretary recommends an appeal process by which affected US parties
could seek an exclusion from the tariff or quota imposed The Secretary would grant
exclusions based on a demonstrated (1) lack of sufficient US production capacity
of comparable products or (2) specific national security based considerations This
appeal process would include a public comment period on each exclusion request
and in general would be completed within 90 days of a completed application being
filed with the Secretary
An exclusion may be granted for a period to be determined by the Secretary
and may be terminated if the conditions that gave rise to the exclusion change The
US Department of Commerce will lead the appeal process in coordination with the
Department of Defense and other agencies as appropriate Should exclusions be
granted the Secretary would consider at the time whether the quota or tariff for the
remaining products needs to be adjusted to increase US steel capacity utilization to
a financially viable target of 80 percent
61
IV PRODUCT SCOPE OF THE INVESTIGATION28 29
For this report the product scope covers steel mill products (ldquosteelrdquo) which
are defined at the Harmonized System (ldquoHSrdquo) 6-digit level as 720610 through
721650 721699 through 730110 730210 730240 through 730290 and 730410
through 730690 including any subsequent revisions to these HS codes The
following discontinued HS codes have been included for purposes of reporting
historical data (prior to 2007) 722520 722693 722694 722910 730410 730421
730610 730620 and 730660
These steel products are all produced by US steel companies and support
various applications across the defense critical infrastructure and commercial
sectors Generally these products fall into one of the following five product
categories (including but not limited to)
(1) Carbon and Alloy Flat Product (Flat Products) Produced by rolling semi-
finished steel through varying sets of rolls Includes sheets strips and plates
Flat products are covered under the following 6-digit HS codes 720810
29 Note that import data for steel products includes what are believed to be very small amounts of iron as well as steel both of which are included in the HS codes covered in the scope
As discussed in Part II ldquonational securityrdquo under Section 232 includes both
(1) national defense and (2) critical infrastructure needs
1 Steel is Needed for National Defense Requirements
Steel articles are critical to the nationrsquos overall defense objectives30 The US
Department of Defense (DoD) has a large and ongoing need for a range of steel
products that are used in fabricating weapons and related systems for the nationrsquos
defense31 DoD requirements ndash which currently require about three percent of US
steel production ndash are met by steel companies that also support the requirements for
critical infrastructure and commercial industries
The free market system in the United States requires commercially viable steel
producers to meet defense needs No company could afford to construct and operate
a modern steel mill solely to supply defense needs because those needs are too
diverse In order to supply those diverse national defense needs US steel mills
must attract sufficient commercial (ie non-defense) business The commercial
revenue supports construction operation and maintenance of production capacity
as well as the upgrades research and development required to continue to supply
defense needs in the future See Appendix H for examples
2 Steel is Required for US Critical Infrastructure
Steel also is needed to satisfy requirements for ldquothose industries that the US
Government has determined are critical to minimum operations of the economy and
governmentrdquo32 In the 2001 Report the Department identified 28 ldquocritical
industriesrdquo33 The Critical Infrastructure Assurance Office that identified the
30 ccord 2001 Report at 1 12
31 ISI 2017 public policy agenda available from httpwwwsteelorg~mediaFilesISIReportsISI-2017-
Public-Policy-gendapdfla=en
32 2001 Report at 14 See also 2001 Report at 16 Table 2 for a listing of the 28 critical industries
33 Id
23
ldquocritical industriesrdquo is no longer in existence so for this investigation the Department
instead relied on the industries identified by the US Government in the 2013
Presidential Policy Directive 21 (PPD-21) 34 The Secretary believes that the range
of industries identified in PPD-21 is comparable to the range of critical industries
analyzed in the 2001 Report
Pursuant to PPD-21 there are 16 designated critical infrastructure sectors in
the United States many of which use high volumes of steel (see Appendix I)35 The
16 sectors include chemical production communications dams energy food
production nuclear reactors transportation systems water and waste water systems
Increased quantities of steel will be needed for various critical infrastructure
applications in the coming years The American Society of Civil Engineers
estimates that the United States needs to invest $45 trillion in infrastructure by 2025
and a substantial portion of these projects require steel content36
3 Domestic Steel Production is Essential for National Security
Applications
Domestic steel production is essential for national security Congress in
Section 232(d) directed the Secretary of Commerce and the President to consider
domestic production and the economic welfare of the United States in determining
whether imports threaten to impair national security
In the case of steel the history of US Government actions to ensure the
continued viability of the US steel industry demonstrates that across decades and
Administrations there has been consensus that domestic steel production is vital to
national security
34 PPD-21 can be viewed at httpsobamawhitehousearchivesgovthe-press-office20130212presidential-policy-directive-critical-infrastructure-security-and-resil
35 Department of Homeland Security ritical Infrastructure Sectors httpswwwdhsgovcritical-infrastructure-sectors
36 2017 Infrastructure Report ard merican Society of ivil Engineers httpswwwinfrastructurereportcardorgwp-contentuploads2016102017-Infrastructure-Report-ardpdf
24
Prior significant actions under various statutory authorities to address steel
imports using quotas or tariffs were taken by President George W Bush President
William J Clinton (three times) President George H W Bush President Ronald W
Reagan (three times) President James E Carter (twice) and President Richard M
Nixon all at lower levels of import penetration than at present In the 1970s action
was taken to limit import penetration to approximately 19 percent In the 1980s
import penetration had reached 21 percent and the US Government enacted
correcting measures In the 1990s and 2000s import penetration again reached up to
23 percent which prompted the US Government to take additional actions37 In
2016 import penetration averaged 30 percent and for the first nine months of 2017
imports have consistently averaged over 30 percent of US domestic demand
4 Domestic Steel Production Depends on a Healthy and Competitive
US Industry
US steel producers would be unable to survive purely on defense or critical
infrastructure steel needs In the steel industry it is commercial and industrial
customer sales that generate the relatively steady production needed for
manufacturing efficiency and the revenue volume needed to sustain the business
Sales for critical infrastructure and defense applications are often less predictable
cyclical and limited in volume
Steel manufacturers operating in the United States however have seen their
commercial and industrial business steadily eroded by a growing influx of lower-
priced imported product from countries where steel manufacturing often is
subsidized directly or indirectly The Department of Commerce currently has 164
antidumping and countervailing duty determinations in effect and has 20 additional
cases under investigation to address specific cases See Appendix K
5 Steel Consumed in Critical Industries
In this investigation the issue before the Department is whether steel imports
ldquothreaten to impairrdquo national security See 19 USC sect 1862 As discussed in Part
II the Secretary has determined that in the present case the relevant factors are the
37 See ppendix J for additional detail on US Government actions on steel in the past
25
ldquoserious effects resulting from the displacement of hellip domestic [steel] products by
excessive importsrdquo and the ldquoimpact of foreign competition on the economic welfare
of individual domestic [steel] industriesrdquo that when combined with the circumstance
of massive global excess capacity causes a ldquoweakening of our internal economyrdquo
that ldquomay impair the national securityrdquo38
In a free market system the ability of the domestic steel industry to continue
meeting national security needs depends on the continued capability of the US steel
industry to compete fairly in the commercial marketplace and maintain a financially
viable domestic manufacturing capability This includes the need to have an
adequately skilled workforce for manufacturing as well as to conduct research and
development for future products39 A continued loss of viable commercial
production capabilities and related skilled workforce will jeopardize the US steel
industryrsquos ability to meet the full spectrum of national security requirements
The Department in 2001 determined that the ldquocritical industriesrdquo sector which
is analogous to the more robust critical infrastructure sectors identified pursuant to
PPD-21 would require ldquono more than 3368 million tons of finished steel per yearrdquo40
based on 3088 percent of domestic consumption being used in industries related to
critical infrastructure The Department has now updated the ldquocritical industriesrdquo
calculation from the 2001 Report41 using Census Bureau steel usage figures from
2007 which are the latest available See Appendix I for more detailed information
on steel needs for critical infrastructure
38 19 US sect 1862(d)
39 See 50 US sect 4502(a)(ongress finds that ndash 0 (7) much of the industrial capacity that is relied upon by the United States Government for military production and other national defense purposes is deeply and directly influenced by ndash () the overall competitiveness of the industrial economy of the United States- and the ability of industries in the United States in general to produce internationally competitive products and operate profitably while maintaining adequate research and development to preserve competitiveness with respect to military and civilian production0)
40 2001 Report at 14 The report is not clear whether it is referring to short tons or metric tons While not crucial to the analysis if the figure is in short tons then the equivalent amount in metric tons would be 3056 million metric tons
41 2001 Report at 16 (Table 2)
26
The updated analysis in Appendix I shows that 491 percent of domestic steel
consumption in 2007 was used in critical industries Domestic production in 2007
was 110 million metric tons The 491 percent of domestic consumption used in
critical industries equals 54 million metric tons compared to 3056 million metric
tons (or 3368 million short tons) used in critical industries in 1997 Thus in 10 years
the demand for steel in critical industries increased by 63 percent
B Imports in Such Quantities as are Presently Found Adversely Impact the
Economic Welfare of the US Steel Industry
In the steel sector foreign competition is characterized by substantial and
sustained global overcapacity and production in excess of foreign domestic demand
1 Imports of Steel Products Continue to Increase
The United States is the worldrsquos largest steel importer The top 20 sources of
US imports of steel products accounted for approximately 91 percent of the roughly
36 million metric tons of steel the United States is expected to import in 2017 (see
Figure 2)
Total US imports rose from 259 million metric tons in 2011 peaking at 402
million metric tons in 2014 at the height of the shale hydrocarbon drilling boom For
2017 (first ten months) imports are increasing at a double-digit rate over 2016
pushing finished steel imports consistently over 30 percent of US consumption
27
-
Figure 2 Top US Imports of All Steel Products
Imports for Domestic Consumption Quantity In Metric Tons Ranked By 2017
2017 Rank
Country 2011 2017
(Annualized) Change 2011
2017 (Annualized)
World 25994621 35927141 38
1 Canada 5539448 5800008 5
2 Brazil 2820927 4678530 66
3 South Korea 2572981 3653934 42
4 Mexico 2625104 3249292 24
5 Russia 1269717 3123691 146
6 Turkey 665303 2249456 238
7 Japan 1824393 1781147 -2
8 Germany 978230 1370669 40
9 Taiwan 588036 1251767 113
10 India 735802 854026 16
11 China 1132292 784393 -31
12 Vietnam 120134 727643 506
13 Netherlands 517773 589930 14
14 Italy 276809 515459 86
15 Thailand 72183 417389 478
16 Spain 195907 403091 106
17 United Kingdom 400244 354389 -11
18 South Africa 123001 350425 185
19 Sweden 267685 299170 12
20 United Arab Emirates 63316 290221 358
Top 20 Total 22789285 32744630 44
Source United States Department of Commerce Bureau of the Census Foreign Trade Division IHS Global Trade Atlas Database Revised Statistics for 2011 - 2017 2017 data is annualized based on YTD 2017 through October
As shown in Appendix K antidumping and countervailing duty actions can
address specific instances of unfairly traded steel products However given the large
number of countries from which the United States imports steel and the myriad of
different products involved it could take years to identify and investigate every
instance of unfairly traded steel or attempts to transship or evade remedial duties
28
Moreover US industry has already spent hundreds of millions of dollars in
recent years on ADCVD cases with seemingly no end in sight to their outlays
Smaller steel manufacturers are financially unable to afford these type of cases or
are hesitant to file cases in light of possible market entry retaliation in foreign
markets for finished steel products42
2 High Import Penetration
In contrast to the situation in the 2001 Report where imports of semi-finished
steel represented approximately 7 percent of domestic consumption 43 imports of
finished steel products (ie not including semi-finished steel) currently represent
over 25 percent of US consumption (see Figure 3)44 If imports of semi-finished
products are included the import penetration level has been above 30 percent for the
first ten months of 2017 Import penetration of steel pipe and tube was 74 percent
Figure 3 US Import Penetration of Finished Steel Products (Excludes Semi-Finished)
Source American Iron and Steel Institute YTD data source is through October 2016 and October 2017 Excludes semi-finished imports
42 ongress has specifically expressed concern about the need to maintain small suppliers and the potential adverse impact on military readiness caused by the loss of small suppliers See 50 US sect 4502(a)(8)
43 2001 Report at 31
44 ISIs statistical yearbook reports that about 8 percent of US shipments are made of imported substrate
29
3 High Import to Export Ratio
US imports of steel products which displace demand for domestic steel and
lower production at US plants reached nearly four times the level of exports of
US steel products in 2016 (see Figure 4) The expansion of steel production
capacity outside of the United States in the last decade (Asia the Middle East and
South America) much of it subsidized by national governments continues to
depress world steel prices while making it increasingly difficult for US companies
to export their steel products While US steel producers saw a mild increase in steel
exports from 2005 to 2013 more recently sales to foreign customers have been
declining Exports fell to nine million metric tons in 2016 from a 20-year high of 12
million metric tons annually from 2011 to 2013 Most US steel exports are auto
industry related and are sent to Canada (50 percent by weight in 2016) and Mexico
(39 percent by weight in 2016) Flat products represent the majority of these exports
ndash 57 percent of US steel exports for Canada and 64 percent of steel exports for
North Europe Domestic Hot Rolled Coil 65954 61441 56841 42019 45529 60490
South Europe Domestic Steel Rebar 63659 59834 55166 39411 42768 56853
000
10000
20000
30000
40000
50000
60000
70000
80000
USD
MT
Source Bloomberg Platts Antaike 2017 prices are through December 20 2017
Figure 6 Regional Comparison of Hot Rolled Coil Bench Mark Prices (USDMT)
In 2015 steel prices fell globally As the OECD noted the combined effect
of weakening global steel demand including in the United States growing exports
in many economies and decreases in steelmaking costs led to a very sharp decline
32
in steel prices in 2015 Notwithstanding these effects prices for steel in the US
remained substantially higher than in any other area However relative to prices
between 2010 and 2013 prices are still relatively depressed
Global excess steel production weakens the pricing power of US steel
producers US steel producersrsquo costs are higher than the costs for producers in other
regions due to higher taxes healthcare environmental and other regulatory
expenses Higher US steel prices incentivize importing lower-cost foreign steel
Moreover excess production and lower prices in regions proximate to state
subsidized enterprises displace purchases from market based steel exporters and add
pressure on those market based suppliers to export to the US The effect of global
excess steel production on US steel prices and import levels is discussed in greater
detail in Appendix L
5 Steel Mill Closures
US steel mill closures continue eroding overall US steel mill capacity and
employment Many US steel mills have been driven out of business due to
declining steel prices global overcapacity and unfairly traded steel Since 2000 the
United States has lost over 25 percent of its basic oxygen furnace facilities with the
closure of six facilities RG Steel in Sparrows Point Maryland RG Steel in
Steubenville Ohio RG Steel in Warren Ohio ArcelorMittal in East Chicago
Indiana ArcelorMittal in Weirton West Virginia and US Steel in Fairfield
Alabama
In addition four electric arc furnace steel facilities have closed Evraz in
Claymont Delaware ArcelorMittal in Georgetown South Carolina Gerdau in Sand
Springs Oklahoma and Republic Steel in Lorain Ohio Most recently
ArcelorMittal has announced the closure of its plate rolling mill in Conshohocken
Pennsylvania because of sagging commercial sales attributed to surging imports of
low-cost steel product and flat defense demand45
The closures of these facilities have had a significant impact on the US
industrial workforce and local economies RG Steel suffered three closures
45 owden M rcelor Mittal to Shut P Plate Mill merican Metal market September 18 2017
33
Sparrows Point Maryland Steubenville Ohio and Warren Ohio After filing for
bankruptcy in 2012 more than 2000 employees were displaced in Maryland alone
and another 2000 in the Midwest The company cited weak demand in the steel
industry as well as lack of financing as key contributors to the closure46
Closures of smaller steel mills have had equally devastating impacts on
employment Gerdau Sand Springs in Oklahoma lost 300 employees after closing
in 2009 because of a long-term drop in demand for steel47 Sand Springs was the
last remaining steel plant in Oklahoma and had been in production since the 1920s
In 2013 at least 345 employees were laid off in response to the closure of the
Claymont steel mill in Delaware The Governor of Delaware Jack Markell
attributed the financial difficulties of the facility to ldquosubdued market demand and the
high volume of importsrdquo48
Similar difficulties were cited by the ArcelorMittalrsquos Georgetown South
Carolina facility and US Steelrsquos location in Fairfield Alabama both of which
closed in 2015 Layoffs for these two corporations totaled 226 and more than 1100
employees respectively Both companies attributed the layoffs to financial losses
and ultimately to facility closures due to the rise in competition from inexpensive
imports49
Even temporary idling of steel plants threatens the US steel industry as there
are significant financial costs with re-opening a steel mill Multiple US facilities
remain idled there are four idled basic oxygen furnace facilities two each in
Kentucky and Illinois representing almost one third of the remaining basic oxygen
46 usiness Journal Unforeseen onditions loses Warren Steel Holdings January 12 2016 httpbusinessjournaldailycomutilities-cut-to-warren-steel-holdings- altimore rew Six reasons why the Sparrows Point steel mill collapsed May 25 2012 httpsbaltimorebrewcom20120525six-reasons-why-the-sparrows-point-steel-mill-collapsed
47 News on 6 Sand Springs Steel Plant May lose June 9 2009 httpwwwnewson6comstory10500785sand-springs-steel-plant-may-close
48 usiness Insider Shutdown of Russian Steel Mill in Delaware ould Send a Message bout US Trade October 17 2013 httpwwwbusinessinsidercomevraz-closes-claymont-steel-2013-10
49 Lcom US Steel lays off 200 more workers in Fairfield March 18 2016 httpwwwalcombusinessindexssf201603us_steel_lays_off_200_more_worhtml
34
furnace facilities in United States50 In addition there are idled pipe and tube mills
in Texas Ohio and Alabama Once production is halted at these facilities it is not
always possible to bring back the highly skilled workforce needed to operate them
When steel mill restarts do occur additional costs are often incurred for specialized
worker training and production ramp-up
In addition when a steel mill closes at a given location the workers find other
occupations move to other steel mills or remain indefinitely unemployed After a
significant period of unemployment much of the specialized skill required by steel
mill workers is forgotten Furthermore it is typically not easy to find and recruit
displaced workers who may live hundreds or thousands of miles away
6 Declining Employment Trend Since 1998
US steel industry employment has declined 35 percent (216400 in 1998 to
139800 in January 2016 - December 2016) including 14100 lost jobs between 2015
and 2016 While employment numbers increased slightly in certain years the trend
is dramatically downward (see Figure 7) Layoffs defer formal plant closings but
are an indication of financial distress Layoffs in the last two years have been
particularly acute in steel producers with pipe and tubular facilities In addition to
layoffs there are permanent closures and bankruptcies in the industry 51
The loss of skilled workers is especially detrimental to the long-term health
and competitiveness of the industry The unstable and declining employment
outlook for the industry also dissuades younger workers from wanting to participate
in the future US steel industry The inability to rapidly add skilled workers to the
industry negatively affects current manufacturing capabilities This is especially
problematic in the event of a major production surge or mobilization
Source Bureau of Labor Statistics using the annual average of seasonally adjusted employees NAICS Codes 3311 and 3312 updated 11222017
Figure 7 Combined Steel Industry Employment (Yearly Average)
7 Trade Actions ndash Antidumping and Countervailing Duties
The number of US antidumping and countervailing duty measures in effect
illustrates the scope of the problem confronting the US steel industry In 1998 at
the height of that periods steel crisis there were just over 100 antidumping and
countervailing duty cases against finished steel products52 Today there are 164
antidumping and countervailing duty orders in effect for steel with another 20 steel
investigations currently ongoing and another waiting to take effect through
publication in the Federal Register (see Appendix K for a full listing of Steel
Antidumping and Countervailing Duty Orders in Effect) This represents a 60
percent increase in cases since the last time the Department investigated steel in
2001
8 Loss of Domestic Opportunities to Bidders Using Imported Steel
Despite efforts to level the playing field through ADCVD orders there are
numerous examples of US steel producers being unable to fairly compete with
foreign suppliers including the lack of ability to bid on some critical US
infrastructure projects Due to unfair competition particularly from foreign state-
52 Global Steel Trade Structural Problems and Future Solutions- Department of ommerce- July 2000
36
owned enterprises US steel producers have lost out on US business opportunities
Some examples include Chinese companies providing steel for the eastern span of
the San Francisco-Oakland Bay Bridge as well as the Alexander Hamilton Bridge
over the Harlem River in New York53
The Alliance for American Manufacturingrsquos statement before the
Congressional Steel Caucus (March 2017) identified three other recent infrastructure
projects in New York that have used or will use heavily subsidized or possibly
dumped foreign steel the Verrazano-Narrows Bridge LaGuardia Airport and the
Holland Tunnel Two major US cities ndash Boston and Chicago ndash have contracted
with Chinese companies to build new subway cars primarily constructed with
imported steel for their respective transportation systems54
9 Financial Distress
Rising levels of imports of steel continue to weaken the US steel industryrsquos
financial health Years of running on low-profit margins or at a loss have weakened
an industry that continues to face an ever-increasing wave of steel imports The US
industry as a whole has operated on average with negative net income from 2009-
2016 Net income for US-owned steel companies has averaged only $162 million
annually since 2010 challenging the financial viability of this vital industry (see
Figure 8)
53 New York Times ridge omes to San Francisco With a Made-in-hina Label June 25 2011 httpwwwnytimescom20110626businessglobal26bridgehtml
54 Reuters hinas RR lands $13 billion hina rail car project March 10 2016 httpwwwreuterscomarticleus-crrc-usa-idUSKN0W17I
37
The Stern School of Business at New York University calculates that US steel
industry participants in the last five years experienced negative net income of 178
percent Compounded growth in revenue for the past five years in the steel industry
has been a negative 7 percent55 The loss of revenue has caused US steel
manufacturers both large and small to defer or eliminate production facility capital
investments and funding for research and development Even though there was a
slight uptick in net income for the first quarter in 2017 over the fourth quarter of
2016 margins remain poor compared to historic levels
Not only have earnings before interest taxes depreciation and amortization
(EBITDA) been shallow for steel producers in the United States many of them are
burdened with high levels of debt as much as 119 times of earnings for one major
producer (see Figure 9)56 While some companies are starting to pay down debt
55 Historical (ompounded nnual) Growth Rates by Sector swath Damodaran New York University Stern School
of usiness January 2017 (see httppagessternnyuedu~adamodarNew_Home_Pagedatafile histgrhtml) 56 Nucor operates mini-mills that use electric arc furnaces to produce high demand steel products primarily with recycled steel scrap From a financial perspective this business model allows Nucor to be highly price competitive but the company produces a narrower range of flat steel products than integrated steel mills The
mini-mills can weather bad economic times because they have lower energy costs and can regulate production
38
others have not been able to do so primarily because of slack demand for
domestically produced steel in the face of competition from imported products
Absent increases in steel production volume and pricing one leading law firm
specializing in insolvency White amp Case observes that some steelmakers in the
United States may soon have to renegotiate loan agreements to extend maturities
those that are not able to may have to consider Chapter 11 bankruptcy57
No capital intensive industry can survive with such poor margins over the
longer term The extensive leverage in the industry shown in Figure 9 adds to the
more easily asic oxygen furnace plants have higher fixed operating costs because they directly convert iron ore and other raw materials along with scrap into steel using more energy-intensive processes
57 Losing Strength US Steel Industry nalysis Scott Griesman White ase pril 16 2016 (see httpswwwwhitecasecompublicationsarticlelosing-strength-us-steel-industry-analysis)
39
likelihood of further closures if the present high level of imports continues to force
US steel mills to operate well below profitable capacity utilization rates
10 Capital Expenditures
The ability of US manufacturers of iron and steel products to fund capital
expenditures for new production plants as well as facility modernization and
advanced manufacturing equipment has been limited by falling revenue and reduced
profits As shown in Figure 10 annual capital expenditures for companies making
iron and steel ingot bars rods plate and other semi-finished products wavered from
$57 billion to $51 billion for 2010-2012 before ramping to $71 billion in 2013
Figure 10 Annual Capital Expenditures
Iron Steel and Ferroalloys Steel NAICS Codes 3311 and 3312 Combined
Millions of Current Dollars
Annual Capital Expenditures Survey 2010 2011 2012 2013 2014 2015
A Structures [New amp Used Structures Combined] 1026 1322 1564 1157 724 580
B Equipment [New amp Used Equipment Combined] 4634 4572 3592 5954 3139 2531
C Total Capital Expenditures 5661 5894 5157 7111 3863 3110
D (Unweighted) Payroll of Reporters Total Payroll of Firms Classified in Industry group
86 84 80 61 86 84
Source US Census Bureau Annual Capital Expenditures Survey wwwcensusgovprograms-surveysaceshtml
Confronted with receding orders for products and declines in income in 2013
iron and steel companies operating production facilities in the United States started
curtailing capital investments Total capital spending dropped to $387 billion in
2014 and slid further to $311 billion in 2015 ndash 32 percent below 2010 levels of $566
billion
The decline in capital expenditures reflected similar drops in net sales which
plummeted from $1296 billion in 2014 to $102 billion in 2015 Income after taxes
40
for US iron and steel manufacturers fell from $248 billion in the same two-year
period to a massive loss of $35 billion in 2015
C Displacement of Domestic Steel by Excessive Quantities of Imports has the
Serious Effect of Weakening Our Internal Economy
1 Domestic Steel Production Capacity is Stagnant and Concentrated
According to the OECD US steel production capacity has remained stagnant
at an average of approximately 1143 million metric tons for more than a decade
from 2006-2016 (see Figure 11) For 2016 the rated maximum capacity was 113
million metric tons for existing basic oxygen furnace and electric arc furnace
Source Organization for Economic Cooperation and Development (OECD) 2017 capacity is a forecast
41
42
The present situation with respect to basic oxygen furnace production is
significantly worse than the situation assessed by the Department in the 2001 Report
As shown in Figure 13 below the number of basic oxygen furnace facilities and units
has declined precipitously since 1995 In 2000 there were 105 companies that
produced raw steel at 144 locations59 while today there are only 38 companies
producing steel at 93 locations a 64 percent and 36 percent reduction respectively
Most importantly in 2000 thirteen companies ldquooperated integrated steel mills
with an average of 35 blast furnaces in continuous operation during the yearrdquo60 while
today there are only three companies operating 13 basic oxygen furnaces These are
77 percent and 60 percent reductions respectively As a result today only 26 percent
of domestic steel is produced from raw materials in the United States as compared
to 53 percent in 2000
As noted earlier since 2000 there has been over a 25 percent reduction in the
number of basic oxygen furnaces operating in the United States and 33 percent of
the remaining basic oxygen furnaces are currently idled In the Secretaryrsquos view a
further reduction in basic oxygen furnace capacity which is especially important to
the ability of domestic industry to meet national security needs is inevitable if the
present imports continue or increase
This would be a serious ldquoweakening of our internal
economyrdquo and place the United States in a position where it is unable to be certain
59 2001 Report at 21
60 Id
43
it could meet demands for national defense and critical industries in a national 61emergency
Figure 13 Basic Oxygen and Electric Arc Facilities and Units Located in the United States 1975 - 2016
Year asic Oxygen Furnace Facilities
asic Oxygen Furnace Units
Electric rc Furnace Facilities
Electric rc Furnace Units
1975 38 90 -- --
1980 33 78 -- --
1985 27 66 -- --
1990 24 61 127 246
1995 22 56 116 218
2000 19 50 122 174
2005 17 46 115 169
2010 16 44 108 164
2015 13 31 98 154
2016 13 31 98 154 Source US Department of CommerceBIS American Iron and Steel Institute Association for Iron amp Steel Technology Steel Manufacturers Association August 2017 Estimated
Basic Oxygen Furnace Basic Oxygen Furnaces (BOF) are the dominant steelmaking technology globally accounting for 74 of the worlds total output of crude steel in 2016 OF share of production in the US was 33 in 2016 and has been slowly declining due primarily to the advent of the Greenfield electric arc furnace (EF) flat-rolled mills The primary raw materials for the BOF are liquid hot metal (iron) from the blast furnace and steel scrap [1] These are charged into the BOF vessel Oxygen (gt995 pure) is blown into the OF at supersonic velocities It oxidizes the carbon and silicon contained in the hot metal liberating great quantities of heat which melts the scrap Source Steelorg
Electric Arc Furnace The Electric Arc Furnace (EAF) operates as a batch melting process producing batches of molten steel known heats The EF process uses steel scrap and iron units melting them using electricity to make new steel EF output accounted for 66 of US steel production in 2016 Source Steelorg
[1 The last Furnace chemically reduces and physically converts iron oxides into liquid iron called hot metal The blast furnace is a huge steel stack lined with refractory brick where iron ore coke and limestone are dumped into the top and preheated air is blown into the bottom The raw materials require six to eight hours to descend to the bottom of the furnace where they become the final product of liquid slag and liquid iron Source Steelorg
In contrast to the situation in the United States the leading global producers
of steel (Brazil South Korea Japan Russia Germany and especially China)
primarily rely on basic oxygen furnace capacity rather than electric arc furnace
capacity (see Figure 14) Each of these economic competitors to the United States
possess critical research development and production capabilities that the United
61 See infra sections 4 and 5 for a further discussion of the inability to meet surge requirements in an emergency
44
rsquo
States is in danger of losing if imports continue to force US steel producers to
operate at uneconomic capacity utilization levels
A further reduction in domestic basic oxygen furnace capacity would put the
United States at serious risk of becoming dependent on foreign steel to support its
critical industries and defense needs Allowing this decline to continue represents a
ldquoweakening of our internal economy that may impair national securityrdquo which the
Congress has directed the Secretary to advise the President of under the Section 232
See 19 USC sect 1862(d)
Figure 14 The Top 20 Countries Exporting to the US ndash BOF vs EAF Capacity
Rank Top Import Sources in 2016 in Tonnage
Terms
2015 OF Share
2015 EF Share
2015 Other Share
pprox ountry s verage apacity Utilization in 2016
(OED) World 7420 2520 050 67
1 Canada 5380 4620 62
2 Brazil 7820 2020 57
3 South Korea 6960 3040 80
4 Mexico 2970 7030 75
5 Turkey 3500 6500 65
6 Japan 7710 2290 80
7 Russia 6630 3050 310 76
8 Germany 7040 2960 72 (EU 28)
9 Taiwan 6230 3770 75
10 Vietnam 2500 5990 1520 32
11 China 9390 610 69
12 Netherlands 9860 150 72 (EU 28)
13 Italy 2130 7820 72 (EU 28)
14 United Kingdom 8300 1700 72 (EU 28)
15 France 6560 3440 72 (EU 28)
16 India 4290 5710 75
17 Australia 7760 2240 63
18 Spain 3170 6830 72 (EU 28)
19 Sweden 6610 3390 72 (EU 28)
20 South Africa 5650 4350 585 Source World Steel- Production Share Figures for 2015 US ensus ureau (ccessed Via HIS) ndash Import Growth Rates OED 2017 Q2 Market ssessment ndash pproximate apacity Utilization
This is not a hypothetical situation The Department of Defense already finds
itself without domestic suppliers for some particular types of steel used in defense
45
products including tire rod steel used in military vehicles and trucks62 While the
United States has many allies that produce steel relying on foreign owned facilities
located outside the United States introduces significant risk and potential delay for
the development of new steel technologies and production of needed steel products
particularly in times of emergency The Secretary notes that the authority for the
Department of Defense to place its order ahead of commercial orders on a mandatory
basis does not extend to foreign-owned facilities outside the United States63
In the case of critical infrastructure the United States is down to only one
remaining producer of electrical steel in the United States (AK Steel ndash which is
highly leveraged) Electrical steel is necessary for power distribution transformers
for all types of energy ndash including solar nuclear wind coal and natural gas ndash across
the country If domestic electrical steel production as well as transformer and
generator production is not maintained in the US the US will become entirely
dependent on foreign producers to supply these critical materials and products64
Without an assured domestic supply of these products the United States cannot be
certain that it can effectively respond to large power disruptions affecting civilian
populations critical infrastructure and US defense industrial production
capabilities in a timely manner
2 Production is Well Below Demand
Demand for steel products in the United States (see Figure 15) increased from
1001 million metric tons in 2011 to 1175 million metric tons in 2014 then declined
to 998 million metric tons in 2016 Demand in 2017 is projected to rebound to
1077 million metric tons During the 2011 to 2016 period US production of steel
products dropped from 864 million metric tons in 2011 to 786 million metric tons
in 2016 with a four percent increase expected in 2017
62 Letter from Defense Logistics gency olumbus OH to ISOTE ugust 1 2017
63 See Defense Priorities and llocations System Program (DPS) wwwdcmamilDPS
64 United States ongress ongressional Steel aucus Statement of Roger Newport EO K Steel orporation (on behalf of the merican Iron and Steel Institute) March 29 2017
46
For the six-year period US domestic steel production supplied only 70
percent of the average demand even though available US domestic steel production
capacity during that period could have on average supplied up to 100 percent of
demand (US steel producers would be running at 92 percent capacity utilization for
this period) with approximately 13 million metric tons of additional capacity
remaining
Figure 15 US Steel Market Snapshot (millions of metric tons)
2011 2012 2013 2014 2015 2016 2017 YTD
2017 nnualized
Total Demand for Steel in US (Production + Imports - Exports)
US Annual Production (Liquid) 864 887 869 882 788 786 615 819
Sources United States Department of ommerce ureau of the ensus merican Iron and Steel Institute alculations based on industry and trade data
3 Utilization Rates are Well Below Economically Viable Levels
Overall steel mill production capacity utilization has declined from 87 percent
in 1998 to 814 percent in 2008 to 694 percent in 2016 (see Figure 16) For the
most recent six-year period (2011- 2016) the average utilization rate was 74 percent
Industry analysts note that utilization of 80 percent or more is typically
necessary for sustained profitability among other factors65 For most capital and
energy-intensive US steel producers capacity levels of 80 percent or higher are
required to maintain facilities carry out periodic modernization service company
debt and fund research and development
65 Market Realist Why steel investors are mindful of capacity utilization rates October 2 2014 httpmarketrealistcom201410investors-mindful-capacity-utilization-rate See also httpmarketrealistcom201509upstream-exposure-impact-steel-companies
47
When steel factory utilization falls costs per unit of steel product rises
reducing profit margins and product pricing flexibility Higher capacity utilization
usually results in lower per-unit product costs and higher overall profit66 Over 80
percent is a healthy capacity utilization rate and a rate at which most companies
would be profitable
The US steel industry uses 80 percent as a benchmark for minimum
operational efficiency Moreover the steel industry is capable of reaching and
sustaining 80 percent capacity utilization or higher During the 2002-2008 period
US steel companies operated at an average 874 percent level 67
These industry assessments are consistent with a 1983 report on ldquoCritical
Materials Requirements in the US Steel Industryrdquo in which the Department
66 Houston hronical apacity Utilization and Effects on Product and Profit httpsmallbusinesschroncomcapacity-utilization-effects-product-profit-67046html- steel industry sources
67 httpmarketrealistcom201509upstream-exposure-impact-steel-companieshtml (Its important to note how changes in capacity utilization rates impact a companys earnings For example we see a big jump in earnings when utilization rates improve from 80 percent to 85 percent However incremental benefits are lower when utilization rates increase from 90 percent to 95 percent )
48
explained that ldquo[c]apability utilization or capacity use which in effect describes the
efficiency of an industrys use of capital is a prime determinant of profitability
Domestic steel producers were operating at about 55 percent capability for the first
half of 1982 The comparable rate for the first half of 1981 was 85 percent This
current rate is probably well below a breakeven point for most producers whereas
1981 was profitable for nearly all producersrdquo68
4 Declining Steel Production Facilities Limits Capacity Available for a
National Emergency
The number of steel production facilities located in the US continues to
decline As shown earlier in Figure 13 from 1975 to 2016 the number of basic
oxygen furnace facilities decreased from 38 to 13 Similarly from 1990 to 2016
the number of electric arc furnace facilities decreased from 127 to 98
Due to this decline in facilities domestic steel producers have a shrinking
ability to meet national security production requirements in a national emergency
The US Department of Commerce Census Bureau regularly surveys plant capacity
and has found that steel producers are quickly shedding production capacity that
could be used in a national emergency The Census Bureau defines national
emergency production as the ldquogreatest level of production an establishment can
expect to sustain for one year or more under national emergency conditionsrdquo69 From
2011 to 2017 steel producers increased the utilization of the surge capacity they
would have during a national emergency from 542 percent to 682 percent (see
Figure 17) As steel producers use more of this emergency capacity there is an
increasingly limited ability to ramp up steel production to meet national security
needs during a national emergency
68 Department of ommerce ritical Materials Requirements in the US Steel Industry March 1983 at 16-17
69 US Dept of ommerce ensus ureau Survey of Plant apacity 2011-2017
49
0
10
20
30
40
50
60
70
80
2011 2012 2013 2014 2015 2016 2017
Figure 17 Steel Industry Utilization of Emergency Capacity (2011-2017 Quarter 1)
Source US Department of ommerce ensus ureau Survey of Plant apacity
Percent
The ability to increase steel production during a national emergency
continues to diminish as the number of steel production facilities continues to
decline If the US requires a similar increase in steel production as it did during
previous national emergencies domestic steel production capacity may be
insufficient to satisfy national security needs If a national emergency were to
occur at present utilization levels domestic steel producers would be able to
increase production by 146 percent
For comparison from 1938 through 1946 the US increased the production
of pig iron and ferro-alloys by 217 percent and increased the production of steel
ingots and castings by 210 percent to meet the demands of fighting a global war 70
From 1960 through 1973 during the Vietnam era the US increased steel
production by 152 percent 71 Should the US once again experience a conflict on
the scale of the Vietnam War steel production capacity may be slightly insufficient
70 US Dept of ommerce ensus ureau Statistical bstract of the United States 1948 Page 876
71 US Dept of ommerce ensus ureau Statistical bstract of the United States 1978 Page 830
50
to meet national security needs But if the US were to experience a conflict
requiring the production increase seen during the Second World War the existing
domestic steel production capacity would be unable to meet national security
requirements
Increasing steel production capacity once a large-scale national emergency
has arisen would take a significant amount of time According to the American Iron
and Steel Institute the replacement of a basic oxygen furnace facility takes more
than a year to complete Therefore the lack of spare domestic steel production
capacity and the possible inability to sufficiently increase production during a
national emergency may impair the national security of the United States
D Global Excess Steel Capacity is a Circumstance that Contributes to the
Weakening of the Domestic Economy
1 Free markets globally are adversely affected by substantial chronic
global excess steel production led by China
Numerous studies reports and investigations have documented the global excess
steel capacity with China having the largest installed capability (see Figure
18)727374 OECD analyses show that the worldrsquos nominal crude steelmaking capacity
reached about 24 billion metric tons in 2016 an increase of 127 percent compared
to the 2000 level Most of the capacity expansion was planned for construction and
manufacturing activities and to help build the infrastructure necessary for economic
development ndash most in non-OECD countries Furthermore the OECD reports that
while steel capacity increased at a steady rate world steel demand contracted sharply
in the aftermath of the global economic and financial crisis of 2008 Global demand
for steel recovered slowly in the years following 2008 However since 2013 global
steel demand has flattened thereby widening the capacitydemand gap By 2015 the
gap reached over 700 million metric tons
72 run L (2016) Overcapacity in Steel Chinarsquos Role in a Global Problem Washington D lliance for merican Manufacturing httpaamwebs3amazonawscomuploadsresourcesOvercapacityReport2016_R3pdf
73 Price Weld El-Sabaawi L Teslik (2016) apacity Runs Riot Washington D Wiley Rein LLP
74 OED Reports (2016) httpwwwoecdorgindustryind82nd-session-of-the-steel-committeehtm
51
The vast size of the capacitydemand gap means that steel demand alone
cannot increase enough to balance the global overcapacity problem which is
particularly prevalent in China Chinese excess capacity estimated at more than 300
million metric tons dwarfs total US production capacity (see Figure 19)75
The effect of global overcapacity and excess steel production on US steel
prices and import levels is discussed in greater detail in Appendix L While US
steel production capacity has remained flat since 2001 other steel producing nations
have increased their production capacity with China alone able to produce as much
steel as the rest of the world combined
75 OED High Level Meeting Excess apacity and Structural djustment in the Steel Sector pril 2016 httpwwwoecdorgstiindackground20document20No202_FINL_Meetingpdf
52
0
500
1000
1500
2000
2500 M
illio
ns
of
Met
ric
Ton
s
Figure 19 Steelmaking Capacity
World Total China United States
Source OECD
2009 2010 2011 2012 2013 2014 2015 2016 2017
Several countries (India Iran and Indonesia) in addition to China continue to
add production capacity despite slack global demand According to the OECD Steel
Committee Chairrsquos statement from March 2017 ldquoNew data suggest that nearly 40
million metric tons of gross capacity additions are currently underway and could
come on stream during the three-year period of 2017-19 while an additional 536
million metric tons of capacity additions are in the planning stages for possible start-
up during the same time periodrdquo76 This additional global steel capacity coming
online represents over 80 percent of existing US steelmaking production capacity
demonstrating that the import challenge to US industry is continuing to grow
2 Increasing global excess steel capacity will further weaken the internal
economy as US steel producers will face increasing import competition
These additions to worldwide steelmaking capacity will only exacerbate the
situation because they will further lower global operating utilization rates including
in the United States Growth in foreign government-subsidized steel production is
progressively weakening the financial health of the US steel industry as other steel
76 OED 82nd Session of the OED Steel ommittee ndash hairs Statement March 2017 httpwwwoecdorgstiind82-oecd-steel-chair-statementhtm
53
producing countries export more steel to the US to in part to offset the loss of
regional markets to Chinese steel (see Appendix L)
The US share of global production continues to steadily decline In the year
2000 when President Clinton signed into a law a statute granting China permanent
normal trade relations status77 the US share of global steel production stood at 12
percent78 Since that point in time the US share of global steel production continued
an inexorable decline as other countries and especially China began to increase
production The US share of global steel production fell to 8 percent in 200579 5
percent in 200980 and 48 percent in 201581 In contrast China commanded a 497
percent share of global steel production in 201582
If even half of the planned additional global capacity identified by the OECD
Steel Committee is built and the related new production finds its way into the US
it will drive the operating rate of US steel mills to less than 50 percent of capacity
This will cause a substantial and unsustainable negative cash situation that will
ultimately result in multiple corporate bankruptcies due to heavy debt loads and
related declines in steel production capacity and employment levels
77 Public Law 106-286 n act to authorize extension of nondiscriminatory treatment (normal trade relations treatment) to the Peoples Republic of hina and to establish a framework for relations between the United States and the Peoples Republic of hina October 10 2000 httpswwwgpogovfdsyspkgPLW-106publ286
78 US Dept of ommerce ensus ureau Statistical bstract of the United States 2012 Page 574
79 Id
80 Id
81 Steel Statistical Yearbook 2016 World Steel ssociation httpswwwworldsteelorgendamjcr37ad1117-fefc-4df3-b84f-6295478ae460Steel+Statistical+Yearbook+2016pdf
82 Steel Statistical Yearbook 2017 World Steel ssociation httpswwwworldsteelorgendamjcr3e275c73-6f11-4e7f-a5d8-23d9bc5c508fSteel+Statistical+Yearbook+2017pdf
54
VI CONCLUSION
The Secretary has determined that the displacement of domestic steel by
excessive imports and the consequent adverse impact of those quantities of steel
imports on the economic welfare of the domestic steel industry along with the
circumstance of global excess capacity in steel are ldquoweakening our internal
economyrdquo and therefore ldquothreaten to impairrdquo the national security as defined in
Section 232
The continued rising levels of imports of foreign steel threaten to impair the
national security by placing the US steel industry at substantial risk of displacing
the basic oxygen furnace and other steelmaking capacity and the related supply
chain needed to produce steel for critical infrastructure and national defense
In considering ldquothe impact of foreign competition on the economic welfare of
individual domestic [steel] industriesrdquo and other factors Congress expressly outlined
in Section 232 the Secretary has determined that the continued decline and
concentration in steel production capacity is ldquoweakening of our internal economy
and may impair national securityrdquo See 19 USC sect 1862(d)
Global excess steel capacity is a circumstance that contributes to the
ldquoweakening of our internal economyrdquo that ldquothreaten[s] to impairrdquo the national
security as defined in Section 232 Free markets globally are adversely affected by
substantial chronic global excess steel production led by China While US steel
production capacity has remained flat since 2001 other steel producing nations have
increased their production capacity with China alone able to produce as much steel
as the rest of the world combined This overhang of excess capacity means that US
steel producers for the foreseeable future will face increasing competition from
imported steel as other countries export more steel to the United States to bolster
their own economic objectives
Since defense and critical infrastructure requirements alone are not sufficient
to support a robust steel industry US steel producers must be financially viable and
competitive in the commercial market to be available to produce the needed steel
output in a timely and cost efficient manner In fact it is the ability to quickly shift
55
production capacity used for commercial products to defense and critical
infrastructure production that provides the United States a surge capability that is
vital to national security especially in an unexpected or extended conflict or national
emergency It is that capability which is now at serious risk as imports continue to
take business away from domestic producers these producers are in danger of falling
below minimum viable scale and are at risk of having to exit the market and
substantially close down production capacity often permanently
Steel producers in the United States are facing widespread harm from
mounting imports Growing global steel capacity flat or declining world demand
the openness of the US steel market and the price differential between US market
prices and global market prices (often caused by foreign government steel
intervention) ensures that the US will remain an attractive market for foreign steel
absent quotas or tariffs Excessive imports of steel now consistently above 30
percent of domestic demand have displaced domestic steel production the related
skilled workforce and threaten the ability of this critical industry to maintain
economic viability
A US steel industry that is not financially viable to invest in the latest
technologies facilities and long-term research and development nor retain skilled
workers while attracting a next-generation workforce will be unable to meet the
current and projected needs of the US military and critical infrastructure sectors
Moreover the market environment for US steel producers has deteriorated
dramatically since the 2001 Report when the Department concluded that imports of
iron ore and semi-finished steel do not ldquofundamentally threatenrdquo the ability of US
industry to meet national security needs83
The Departmentrsquos investigation indicates that the domestic steel industry has
declined to a point where further closures and consolidation of basic oxygen furnace
facilities represents a ldquoweakening of our internal economyrdquo as defined in Section
232 The more than 50 percent reduction in the number of basic oxygen furnace
83 2001 Report at 28 ndash 37 s noted supra note 16 the 2001 Report added the qualifier fundamentally which is not found in the statutory text The Secretary in this report uses the statutory standard of threatens to impair without such qualification
56
facilities ndash either through closures or idling of facilities due to import competition ndash
increases the chance of further closures that place the United States at serious risk
of being unable to increase production to the levels needed in past national
emergencies The displacement of domestic product by excessive imports is having
the serious effect of causing the domestic industry to operate at unsustainable levels
reducing employment diminishing research and development inhibiting capital
expenditures and causing a loss of vital skills and know-how The present capacity
operating rates for those remaining plants continue to be below those needed for
financial sustainability These conditions have been further exacerbated by the 22
percent surge in imports thus far in 2017 compared with 2016 Imports are now
consistently above 30 percent of US domestic demand
It is evident that the US steel industry is being substantially impacted by the
current levels of imported steel The displacement of domestic steel by imports has
the serious effect of placing the United States at risk of being unable meet national
security requirements The Secretary has determined that the ldquodisplacement of
domestic [steel] products by excessive importsrdquo of steel is having the ldquoserious effectrdquo
of causing the ldquoweakening of our internal economyrdquo See 19 USC sect 1862(d)
Therefore the Secretary recommends that the President take corrective action
pursuant to the authority granted by Section 232 See 19 USC sect 1862(c)
57
VII RECOMMENDATION
Prior significant actions to address steel imports (quotas andor tariffs) were
taken under various statutory authorities by President George W Bush President
William J Clinton (three times) President George H W Bush President Ronald W
Reagan (three times) President James E Carter (twice) and President Richard M
Nixon all at lower levels of import penetration than the present level which is above
30 percent
Due to the threat of steel imports to the national security as defined in Section
232 the Secretary recommends that the President take immediate action by adjusting
the level of imports through quotas or tariffs on steel imported into the United States
as well as direct additional actions to keep the US steel industry financially viable
and able to meet US national security needs The quota or tariff imposed should be
sufficient after accounting for any exclusions to enable the US steel producers to
be able to operate at about an 80 percent or better of the industryrsquos capacity
utilization rate based on available capacity in 2017
In 2016 US steel production was 786 million metric tons and US capacity
was 1133 million metric tons which represents a 694 percent capacity utilization
rate If current import trends for 2017 continue continued imports without any
action are projected to be 360 million metric tons an increase over 2016 of 60
million metric tons Even with US demand projected to increase to 1073 from
998 million metric tons increased imports mean US capacity utilization is forecast
to rise only to 723 percent a non-financially viable and unsustainable level of
operation
By reducing import penetration rates to approximately 21 percent US
industry would be able to operate at 80 percent of their capacity utilization
Achieving this level of capacity utilization based on the projected 2017 import levels
will require reducing imports from 36 million metric tons to about 23 million metric
tons If a reduction in imports can be combined with an increase in domestic steel
demand as can be reasonably expected rising economic growth rates combined with
the increased military spending and infrastructure proposals that the Trump
Administration has planned then US steel mills can be expected to reach a capacity
58
utilization level of 80 percent or greater This increase in US capacity utilization
will enable US steel mills to increase operations significantly in the short-term and
improve the financial viability of the industry over the long-term
Recommendation to Ensure Sustainable Capacity Utilization and
Financial Health
Impose a Quota or Tariff on all steel products covered in this investigation
imported into the United States to remove the threatened impairment to
national security The Secretary recommends adjusting the level of imports through
a quota or tariff on steel imported into the United States
Alternative 1 ndash Global Quota or Tariff
1A Global Quota
Impose quotas on all imported steel products at a specified percent of the 2017
import level applied on a country and steel product basis
According to the Global Trade Analysis Project (GTAP) Model produced by
Purdue University a 63 percent quota would be expected to reduce steel imports by
37 percent (133 million metric tons) from 2017 levels Based on imports from
January to October import levels for 2017 are projected to reach 360 million metric
tons The quotas adjusted as necessary would result in imports equaling about 227
million metric tons which will enable an 80 percent capacity utilization rate at 2017
demand levels (including exports) Application of an annual quota will reduce the
impact of the surge in steel imports that has occurred since the beginning of 2017
1B Global Tariff
Apply a tariff rate on all imported steel products in addition to any
antidumping or countervailing duty collections applicable to any imported steel
product
Similar to what is anticipated under a quota according to the Global Trade
Analysis Project (GTAP) Model produced by Purdue University a 24 percent tariff
on all steel imports would be expected to reduce imports by 37 percent (ie a
59
reduction of 133 million metric tons from 2017 levels of 360 million metric tons) 84
This tariff rate would thus result in imports equaling about 227 million metric tons
which will enable an 80 percent capacity utilization rate at 2017 demand levels
(including exports)85
Alternative 2 ndashTariffs on a Subset of Countries
Apply a tariff rate on all imported steel products from Brazil South Korea
Russia Turkey India Vietnam China Thailand South Africa Egypt Malaysia and
Costa Rica in addition to any antidumping or countervailing duty collections
applicable to any steel products from those countries All other countries would be
limited to 100 percent of their 2017 import level
According to the Global Trade Analysis Project (GTAP) Model produced by
Purdue University a 53 percent tariff on all steel imports from this subset of
countries would be expected to reduce imports by 133 million metric tons from 2017
import levels from the targeted countries This action would enable an increase in
domestic production to achieve an 80 percent capacity utilization rate at 2017
demand levels (including exports) The countries identified are projected to account
for less than 4 percent of US steel exports in 2017
Exemptions
In selecting an alternative the President could determine that specific
countries should be exempted from the proposed 63 percent quota or 24 percent tariff
by granting those specific countries 100 percent of their prior imports in 2017 based
on an overriding economic or security interest of the United States The Secretary
recommends that any such determination should be made at the outset and a
corresponding adjustment be made to the final quota or tariff imposed on the
84 Due to general equilibrium effects the overall import level would need to decrease by more than the corresponding increase in domestic production to offset the negative effects of price or exchange rate changes on export demand
85 The elasticity factor is an estimate not a certainty variation of 01 in the elasticity factor would change the tonnage reduction by about 375000 tons For example imports would fall by an additional 375000 tons under a demand elasticity of -17 instead of -16 and a 25 percent tariff
60
remaining countries This would ensure that overall imports of steel to the United
States remain at or below the level needed to enable the domestic steel industry to
operate as a whole at an 80 percent or greater capacity utilization rate The limitation
to 100 percent of each exempted countryrsquos 2017 imports is necessary to prevent
exempted countries from producing additional steel for export to the United States
or encouraging other countries to seek to trans-ship steel to the United States through
the exempted countries
It is possible to provide exemptions from either the quota or tariff and still
meet the necessary objective of increasing US steel capacity utilization to a
financially viable target of 80 percent However to do so would require a reduction
in the quota or increase in the tariff applied to the remaining countries to offset the
effect of the exempted import tonnage
Exclusions
The Secretary recommends an appeal process by which affected US parties
could seek an exclusion from the tariff or quota imposed The Secretary would grant
exclusions based on a demonstrated (1) lack of sufficient US production capacity
of comparable products or (2) specific national security based considerations This
appeal process would include a public comment period on each exclusion request
and in general would be completed within 90 days of a completed application being
filed with the Secretary
An exclusion may be granted for a period to be determined by the Secretary
and may be terminated if the conditions that gave rise to the exclusion change The
US Department of Commerce will lead the appeal process in coordination with the
Department of Defense and other agencies as appropriate Should exclusions be
granted the Secretary would consider at the time whether the quota or tariff for the
remaining products needs to be adjusted to increase US steel capacity utilization to
a financially viable target of 80 percent
61
V FINDINGS
A Steel is Important to US National Security
As discussed in Part II ldquonational securityrdquo under Section 232 includes both
(1) national defense and (2) critical infrastructure needs
1 Steel is Needed for National Defense Requirements
Steel articles are critical to the nationrsquos overall defense objectives30 The US
Department of Defense (DoD) has a large and ongoing need for a range of steel
products that are used in fabricating weapons and related systems for the nationrsquos
defense31 DoD requirements ndash which currently require about three percent of US
steel production ndash are met by steel companies that also support the requirements for
critical infrastructure and commercial industries
The free market system in the United States requires commercially viable steel
producers to meet defense needs No company could afford to construct and operate
a modern steel mill solely to supply defense needs because those needs are too
diverse In order to supply those diverse national defense needs US steel mills
must attract sufficient commercial (ie non-defense) business The commercial
revenue supports construction operation and maintenance of production capacity
as well as the upgrades research and development required to continue to supply
defense needs in the future See Appendix H for examples
2 Steel is Required for US Critical Infrastructure
Steel also is needed to satisfy requirements for ldquothose industries that the US
Government has determined are critical to minimum operations of the economy and
governmentrdquo32 In the 2001 Report the Department identified 28 ldquocritical
industriesrdquo33 The Critical Infrastructure Assurance Office that identified the
30 ccord 2001 Report at 1 12
31 ISI 2017 public policy agenda available from httpwwwsteelorg~mediaFilesISIReportsISI-2017-
Public-Policy-gendapdfla=en
32 2001 Report at 14 See also 2001 Report at 16 Table 2 for a listing of the 28 critical industries
33 Id
23
ldquocritical industriesrdquo is no longer in existence so for this investigation the Department
instead relied on the industries identified by the US Government in the 2013
Presidential Policy Directive 21 (PPD-21) 34 The Secretary believes that the range
of industries identified in PPD-21 is comparable to the range of critical industries
analyzed in the 2001 Report
Pursuant to PPD-21 there are 16 designated critical infrastructure sectors in
the United States many of which use high volumes of steel (see Appendix I)35 The
16 sectors include chemical production communications dams energy food
production nuclear reactors transportation systems water and waste water systems
Increased quantities of steel will be needed for various critical infrastructure
applications in the coming years The American Society of Civil Engineers
estimates that the United States needs to invest $45 trillion in infrastructure by 2025
and a substantial portion of these projects require steel content36
3 Domestic Steel Production is Essential for National Security
Applications
Domestic steel production is essential for national security Congress in
Section 232(d) directed the Secretary of Commerce and the President to consider
domestic production and the economic welfare of the United States in determining
whether imports threaten to impair national security
In the case of steel the history of US Government actions to ensure the
continued viability of the US steel industry demonstrates that across decades and
Administrations there has been consensus that domestic steel production is vital to
national security
34 PPD-21 can be viewed at httpsobamawhitehousearchivesgovthe-press-office20130212presidential-policy-directive-critical-infrastructure-security-and-resil
35 Department of Homeland Security ritical Infrastructure Sectors httpswwwdhsgovcritical-infrastructure-sectors
36 2017 Infrastructure Report ard merican Society of ivil Engineers httpswwwinfrastructurereportcardorgwp-contentuploads2016102017-Infrastructure-Report-ardpdf
24
Prior significant actions under various statutory authorities to address steel
imports using quotas or tariffs were taken by President George W Bush President
William J Clinton (three times) President George H W Bush President Ronald W
Reagan (three times) President James E Carter (twice) and President Richard M
Nixon all at lower levels of import penetration than at present In the 1970s action
was taken to limit import penetration to approximately 19 percent In the 1980s
import penetration had reached 21 percent and the US Government enacted
correcting measures In the 1990s and 2000s import penetration again reached up to
23 percent which prompted the US Government to take additional actions37 In
2016 import penetration averaged 30 percent and for the first nine months of 2017
imports have consistently averaged over 30 percent of US domestic demand
4 Domestic Steel Production Depends on a Healthy and Competitive
US Industry
US steel producers would be unable to survive purely on defense or critical
infrastructure steel needs In the steel industry it is commercial and industrial
customer sales that generate the relatively steady production needed for
manufacturing efficiency and the revenue volume needed to sustain the business
Sales for critical infrastructure and defense applications are often less predictable
cyclical and limited in volume
Steel manufacturers operating in the United States however have seen their
commercial and industrial business steadily eroded by a growing influx of lower-
priced imported product from countries where steel manufacturing often is
subsidized directly or indirectly The Department of Commerce currently has 164
antidumping and countervailing duty determinations in effect and has 20 additional
cases under investigation to address specific cases See Appendix K
5 Steel Consumed in Critical Industries
In this investigation the issue before the Department is whether steel imports
ldquothreaten to impairrdquo national security See 19 USC sect 1862 As discussed in Part
II the Secretary has determined that in the present case the relevant factors are the
37 See ppendix J for additional detail on US Government actions on steel in the past
25
ldquoserious effects resulting from the displacement of hellip domestic [steel] products by
excessive importsrdquo and the ldquoimpact of foreign competition on the economic welfare
of individual domestic [steel] industriesrdquo that when combined with the circumstance
of massive global excess capacity causes a ldquoweakening of our internal economyrdquo
that ldquomay impair the national securityrdquo38
In a free market system the ability of the domestic steel industry to continue
meeting national security needs depends on the continued capability of the US steel
industry to compete fairly in the commercial marketplace and maintain a financially
viable domestic manufacturing capability This includes the need to have an
adequately skilled workforce for manufacturing as well as to conduct research and
development for future products39 A continued loss of viable commercial
production capabilities and related skilled workforce will jeopardize the US steel
industryrsquos ability to meet the full spectrum of national security requirements
The Department in 2001 determined that the ldquocritical industriesrdquo sector which
is analogous to the more robust critical infrastructure sectors identified pursuant to
PPD-21 would require ldquono more than 3368 million tons of finished steel per yearrdquo40
based on 3088 percent of domestic consumption being used in industries related to
critical infrastructure The Department has now updated the ldquocritical industriesrdquo
calculation from the 2001 Report41 using Census Bureau steel usage figures from
2007 which are the latest available See Appendix I for more detailed information
on steel needs for critical infrastructure
38 19 US sect 1862(d)
39 See 50 US sect 4502(a)(ongress finds that ndash 0 (7) much of the industrial capacity that is relied upon by the United States Government for military production and other national defense purposes is deeply and directly influenced by ndash () the overall competitiveness of the industrial economy of the United States- and the ability of industries in the United States in general to produce internationally competitive products and operate profitably while maintaining adequate research and development to preserve competitiveness with respect to military and civilian production0)
40 2001 Report at 14 The report is not clear whether it is referring to short tons or metric tons While not crucial to the analysis if the figure is in short tons then the equivalent amount in metric tons would be 3056 million metric tons
41 2001 Report at 16 (Table 2)
26
The updated analysis in Appendix I shows that 491 percent of domestic steel
consumption in 2007 was used in critical industries Domestic production in 2007
was 110 million metric tons The 491 percent of domestic consumption used in
critical industries equals 54 million metric tons compared to 3056 million metric
tons (or 3368 million short tons) used in critical industries in 1997 Thus in 10 years
the demand for steel in critical industries increased by 63 percent
B Imports in Such Quantities as are Presently Found Adversely Impact the
Economic Welfare of the US Steel Industry
In the steel sector foreign competition is characterized by substantial and
sustained global overcapacity and production in excess of foreign domestic demand
1 Imports of Steel Products Continue to Increase
The United States is the worldrsquos largest steel importer The top 20 sources of
US imports of steel products accounted for approximately 91 percent of the roughly
36 million metric tons of steel the United States is expected to import in 2017 (see
Figure 2)
Total US imports rose from 259 million metric tons in 2011 peaking at 402
million metric tons in 2014 at the height of the shale hydrocarbon drilling boom For
2017 (first ten months) imports are increasing at a double-digit rate over 2016
pushing finished steel imports consistently over 30 percent of US consumption
27
-
Figure 2 Top US Imports of All Steel Products
Imports for Domestic Consumption Quantity In Metric Tons Ranked By 2017
2017 Rank
Country 2011 2017
(Annualized) Change 2011
2017 (Annualized)
World 25994621 35927141 38
1 Canada 5539448 5800008 5
2 Brazil 2820927 4678530 66
3 South Korea 2572981 3653934 42
4 Mexico 2625104 3249292 24
5 Russia 1269717 3123691 146
6 Turkey 665303 2249456 238
7 Japan 1824393 1781147 -2
8 Germany 978230 1370669 40
9 Taiwan 588036 1251767 113
10 India 735802 854026 16
11 China 1132292 784393 -31
12 Vietnam 120134 727643 506
13 Netherlands 517773 589930 14
14 Italy 276809 515459 86
15 Thailand 72183 417389 478
16 Spain 195907 403091 106
17 United Kingdom 400244 354389 -11
18 South Africa 123001 350425 185
19 Sweden 267685 299170 12
20 United Arab Emirates 63316 290221 358
Top 20 Total 22789285 32744630 44
Source United States Department of Commerce Bureau of the Census Foreign Trade Division IHS Global Trade Atlas Database Revised Statistics for 2011 - 2017 2017 data is annualized based on YTD 2017 through October
As shown in Appendix K antidumping and countervailing duty actions can
address specific instances of unfairly traded steel products However given the large
number of countries from which the United States imports steel and the myriad of
different products involved it could take years to identify and investigate every
instance of unfairly traded steel or attempts to transship or evade remedial duties
28
Moreover US industry has already spent hundreds of millions of dollars in
recent years on ADCVD cases with seemingly no end in sight to their outlays
Smaller steel manufacturers are financially unable to afford these type of cases or
are hesitant to file cases in light of possible market entry retaliation in foreign
markets for finished steel products42
2 High Import Penetration
In contrast to the situation in the 2001 Report where imports of semi-finished
steel represented approximately 7 percent of domestic consumption 43 imports of
finished steel products (ie not including semi-finished steel) currently represent
over 25 percent of US consumption (see Figure 3)44 If imports of semi-finished
products are included the import penetration level has been above 30 percent for the
first ten months of 2017 Import penetration of steel pipe and tube was 74 percent
Figure 3 US Import Penetration of Finished Steel Products (Excludes Semi-Finished)
Source American Iron and Steel Institute YTD data source is through October 2016 and October 2017 Excludes semi-finished imports
42 ongress has specifically expressed concern about the need to maintain small suppliers and the potential adverse impact on military readiness caused by the loss of small suppliers See 50 US sect 4502(a)(8)
43 2001 Report at 31
44 ISIs statistical yearbook reports that about 8 percent of US shipments are made of imported substrate
29
3 High Import to Export Ratio
US imports of steel products which displace demand for domestic steel and
lower production at US plants reached nearly four times the level of exports of
US steel products in 2016 (see Figure 4) The expansion of steel production
capacity outside of the United States in the last decade (Asia the Middle East and
South America) much of it subsidized by national governments continues to
depress world steel prices while making it increasingly difficult for US companies
to export their steel products While US steel producers saw a mild increase in steel
exports from 2005 to 2013 more recently sales to foreign customers have been
declining Exports fell to nine million metric tons in 2016 from a 20-year high of 12
million metric tons annually from 2011 to 2013 Most US steel exports are auto
industry related and are sent to Canada (50 percent by weight in 2016) and Mexico
(39 percent by weight in 2016) Flat products represent the majority of these exports
ndash 57 percent of US steel exports for Canada and 64 percent of steel exports for
North Europe Domestic Hot Rolled Coil 65954 61441 56841 42019 45529 60490
South Europe Domestic Steel Rebar 63659 59834 55166 39411 42768 56853
000
10000
20000
30000
40000
50000
60000
70000
80000
USD
MT
Source Bloomberg Platts Antaike 2017 prices are through December 20 2017
Figure 6 Regional Comparison of Hot Rolled Coil Bench Mark Prices (USDMT)
In 2015 steel prices fell globally As the OECD noted the combined effect
of weakening global steel demand including in the United States growing exports
in many economies and decreases in steelmaking costs led to a very sharp decline
32
in steel prices in 2015 Notwithstanding these effects prices for steel in the US
remained substantially higher than in any other area However relative to prices
between 2010 and 2013 prices are still relatively depressed
Global excess steel production weakens the pricing power of US steel
producers US steel producersrsquo costs are higher than the costs for producers in other
regions due to higher taxes healthcare environmental and other regulatory
expenses Higher US steel prices incentivize importing lower-cost foreign steel
Moreover excess production and lower prices in regions proximate to state
subsidized enterprises displace purchases from market based steel exporters and add
pressure on those market based suppliers to export to the US The effect of global
excess steel production on US steel prices and import levels is discussed in greater
detail in Appendix L
5 Steel Mill Closures
US steel mill closures continue eroding overall US steel mill capacity and
employment Many US steel mills have been driven out of business due to
declining steel prices global overcapacity and unfairly traded steel Since 2000 the
United States has lost over 25 percent of its basic oxygen furnace facilities with the
closure of six facilities RG Steel in Sparrows Point Maryland RG Steel in
Steubenville Ohio RG Steel in Warren Ohio ArcelorMittal in East Chicago
Indiana ArcelorMittal in Weirton West Virginia and US Steel in Fairfield
Alabama
In addition four electric arc furnace steel facilities have closed Evraz in
Claymont Delaware ArcelorMittal in Georgetown South Carolina Gerdau in Sand
Springs Oklahoma and Republic Steel in Lorain Ohio Most recently
ArcelorMittal has announced the closure of its plate rolling mill in Conshohocken
Pennsylvania because of sagging commercial sales attributed to surging imports of
low-cost steel product and flat defense demand45
The closures of these facilities have had a significant impact on the US
industrial workforce and local economies RG Steel suffered three closures
45 owden M rcelor Mittal to Shut P Plate Mill merican Metal market September 18 2017
33
Sparrows Point Maryland Steubenville Ohio and Warren Ohio After filing for
bankruptcy in 2012 more than 2000 employees were displaced in Maryland alone
and another 2000 in the Midwest The company cited weak demand in the steel
industry as well as lack of financing as key contributors to the closure46
Closures of smaller steel mills have had equally devastating impacts on
employment Gerdau Sand Springs in Oklahoma lost 300 employees after closing
in 2009 because of a long-term drop in demand for steel47 Sand Springs was the
last remaining steel plant in Oklahoma and had been in production since the 1920s
In 2013 at least 345 employees were laid off in response to the closure of the
Claymont steel mill in Delaware The Governor of Delaware Jack Markell
attributed the financial difficulties of the facility to ldquosubdued market demand and the
high volume of importsrdquo48
Similar difficulties were cited by the ArcelorMittalrsquos Georgetown South
Carolina facility and US Steelrsquos location in Fairfield Alabama both of which
closed in 2015 Layoffs for these two corporations totaled 226 and more than 1100
employees respectively Both companies attributed the layoffs to financial losses
and ultimately to facility closures due to the rise in competition from inexpensive
imports49
Even temporary idling of steel plants threatens the US steel industry as there
are significant financial costs with re-opening a steel mill Multiple US facilities
remain idled there are four idled basic oxygen furnace facilities two each in
Kentucky and Illinois representing almost one third of the remaining basic oxygen
46 usiness Journal Unforeseen onditions loses Warren Steel Holdings January 12 2016 httpbusinessjournaldailycomutilities-cut-to-warren-steel-holdings- altimore rew Six reasons why the Sparrows Point steel mill collapsed May 25 2012 httpsbaltimorebrewcom20120525six-reasons-why-the-sparrows-point-steel-mill-collapsed
47 News on 6 Sand Springs Steel Plant May lose June 9 2009 httpwwwnewson6comstory10500785sand-springs-steel-plant-may-close
48 usiness Insider Shutdown of Russian Steel Mill in Delaware ould Send a Message bout US Trade October 17 2013 httpwwwbusinessinsidercomevraz-closes-claymont-steel-2013-10
49 Lcom US Steel lays off 200 more workers in Fairfield March 18 2016 httpwwwalcombusinessindexssf201603us_steel_lays_off_200_more_worhtml
34
furnace facilities in United States50 In addition there are idled pipe and tube mills
in Texas Ohio and Alabama Once production is halted at these facilities it is not
always possible to bring back the highly skilled workforce needed to operate them
When steel mill restarts do occur additional costs are often incurred for specialized
worker training and production ramp-up
In addition when a steel mill closes at a given location the workers find other
occupations move to other steel mills or remain indefinitely unemployed After a
significant period of unemployment much of the specialized skill required by steel
mill workers is forgotten Furthermore it is typically not easy to find and recruit
displaced workers who may live hundreds or thousands of miles away
6 Declining Employment Trend Since 1998
US steel industry employment has declined 35 percent (216400 in 1998 to
139800 in January 2016 - December 2016) including 14100 lost jobs between 2015
and 2016 While employment numbers increased slightly in certain years the trend
is dramatically downward (see Figure 7) Layoffs defer formal plant closings but
are an indication of financial distress Layoffs in the last two years have been
particularly acute in steel producers with pipe and tubular facilities In addition to
layoffs there are permanent closures and bankruptcies in the industry 51
The loss of skilled workers is especially detrimental to the long-term health
and competitiveness of the industry The unstable and declining employment
outlook for the industry also dissuades younger workers from wanting to participate
in the future US steel industry The inability to rapidly add skilled workers to the
industry negatively affects current manufacturing capabilities This is especially
problematic in the event of a major production surge or mobilization
Source Bureau of Labor Statistics using the annual average of seasonally adjusted employees NAICS Codes 3311 and 3312 updated 11222017
Figure 7 Combined Steel Industry Employment (Yearly Average)
7 Trade Actions ndash Antidumping and Countervailing Duties
The number of US antidumping and countervailing duty measures in effect
illustrates the scope of the problem confronting the US steel industry In 1998 at
the height of that periods steel crisis there were just over 100 antidumping and
countervailing duty cases against finished steel products52 Today there are 164
antidumping and countervailing duty orders in effect for steel with another 20 steel
investigations currently ongoing and another waiting to take effect through
publication in the Federal Register (see Appendix K for a full listing of Steel
Antidumping and Countervailing Duty Orders in Effect) This represents a 60
percent increase in cases since the last time the Department investigated steel in
2001
8 Loss of Domestic Opportunities to Bidders Using Imported Steel
Despite efforts to level the playing field through ADCVD orders there are
numerous examples of US steel producers being unable to fairly compete with
foreign suppliers including the lack of ability to bid on some critical US
infrastructure projects Due to unfair competition particularly from foreign state-
52 Global Steel Trade Structural Problems and Future Solutions- Department of ommerce- July 2000
36
owned enterprises US steel producers have lost out on US business opportunities
Some examples include Chinese companies providing steel for the eastern span of
the San Francisco-Oakland Bay Bridge as well as the Alexander Hamilton Bridge
over the Harlem River in New York53
The Alliance for American Manufacturingrsquos statement before the
Congressional Steel Caucus (March 2017) identified three other recent infrastructure
projects in New York that have used or will use heavily subsidized or possibly
dumped foreign steel the Verrazano-Narrows Bridge LaGuardia Airport and the
Holland Tunnel Two major US cities ndash Boston and Chicago ndash have contracted
with Chinese companies to build new subway cars primarily constructed with
imported steel for their respective transportation systems54
9 Financial Distress
Rising levels of imports of steel continue to weaken the US steel industryrsquos
financial health Years of running on low-profit margins or at a loss have weakened
an industry that continues to face an ever-increasing wave of steel imports The US
industry as a whole has operated on average with negative net income from 2009-
2016 Net income for US-owned steel companies has averaged only $162 million
annually since 2010 challenging the financial viability of this vital industry (see
Figure 8)
53 New York Times ridge omes to San Francisco With a Made-in-hina Label June 25 2011 httpwwwnytimescom20110626businessglobal26bridgehtml
54 Reuters hinas RR lands $13 billion hina rail car project March 10 2016 httpwwwreuterscomarticleus-crrc-usa-idUSKN0W17I
37
The Stern School of Business at New York University calculates that US steel
industry participants in the last five years experienced negative net income of 178
percent Compounded growth in revenue for the past five years in the steel industry
has been a negative 7 percent55 The loss of revenue has caused US steel
manufacturers both large and small to defer or eliminate production facility capital
investments and funding for research and development Even though there was a
slight uptick in net income for the first quarter in 2017 over the fourth quarter of
2016 margins remain poor compared to historic levels
Not only have earnings before interest taxes depreciation and amortization
(EBITDA) been shallow for steel producers in the United States many of them are
burdened with high levels of debt as much as 119 times of earnings for one major
producer (see Figure 9)56 While some companies are starting to pay down debt
55 Historical (ompounded nnual) Growth Rates by Sector swath Damodaran New York University Stern School
of usiness January 2017 (see httppagessternnyuedu~adamodarNew_Home_Pagedatafile histgrhtml) 56 Nucor operates mini-mills that use electric arc furnaces to produce high demand steel products primarily with recycled steel scrap From a financial perspective this business model allows Nucor to be highly price competitive but the company produces a narrower range of flat steel products than integrated steel mills The
mini-mills can weather bad economic times because they have lower energy costs and can regulate production
38
others have not been able to do so primarily because of slack demand for
domestically produced steel in the face of competition from imported products
Absent increases in steel production volume and pricing one leading law firm
specializing in insolvency White amp Case observes that some steelmakers in the
United States may soon have to renegotiate loan agreements to extend maturities
those that are not able to may have to consider Chapter 11 bankruptcy57
No capital intensive industry can survive with such poor margins over the
longer term The extensive leverage in the industry shown in Figure 9 adds to the
more easily asic oxygen furnace plants have higher fixed operating costs because they directly convert iron ore and other raw materials along with scrap into steel using more energy-intensive processes
57 Losing Strength US Steel Industry nalysis Scott Griesman White ase pril 16 2016 (see httpswwwwhitecasecompublicationsarticlelosing-strength-us-steel-industry-analysis)
39
likelihood of further closures if the present high level of imports continues to force
US steel mills to operate well below profitable capacity utilization rates
10 Capital Expenditures
The ability of US manufacturers of iron and steel products to fund capital
expenditures for new production plants as well as facility modernization and
advanced manufacturing equipment has been limited by falling revenue and reduced
profits As shown in Figure 10 annual capital expenditures for companies making
iron and steel ingot bars rods plate and other semi-finished products wavered from
$57 billion to $51 billion for 2010-2012 before ramping to $71 billion in 2013
Figure 10 Annual Capital Expenditures
Iron Steel and Ferroalloys Steel NAICS Codes 3311 and 3312 Combined
Millions of Current Dollars
Annual Capital Expenditures Survey 2010 2011 2012 2013 2014 2015
A Structures [New amp Used Structures Combined] 1026 1322 1564 1157 724 580
B Equipment [New amp Used Equipment Combined] 4634 4572 3592 5954 3139 2531
C Total Capital Expenditures 5661 5894 5157 7111 3863 3110
D (Unweighted) Payroll of Reporters Total Payroll of Firms Classified in Industry group
86 84 80 61 86 84
Source US Census Bureau Annual Capital Expenditures Survey wwwcensusgovprograms-surveysaceshtml
Confronted with receding orders for products and declines in income in 2013
iron and steel companies operating production facilities in the United States started
curtailing capital investments Total capital spending dropped to $387 billion in
2014 and slid further to $311 billion in 2015 ndash 32 percent below 2010 levels of $566
billion
The decline in capital expenditures reflected similar drops in net sales which
plummeted from $1296 billion in 2014 to $102 billion in 2015 Income after taxes
40
for US iron and steel manufacturers fell from $248 billion in the same two-year
period to a massive loss of $35 billion in 2015
C Displacement of Domestic Steel by Excessive Quantities of Imports has the
Serious Effect of Weakening Our Internal Economy
1 Domestic Steel Production Capacity is Stagnant and Concentrated
According to the OECD US steel production capacity has remained stagnant
at an average of approximately 1143 million metric tons for more than a decade
from 2006-2016 (see Figure 11) For 2016 the rated maximum capacity was 113
million metric tons for existing basic oxygen furnace and electric arc furnace
Source Organization for Economic Cooperation and Development (OECD) 2017 capacity is a forecast
41
42
The present situation with respect to basic oxygen furnace production is
significantly worse than the situation assessed by the Department in the 2001 Report
As shown in Figure 13 below the number of basic oxygen furnace facilities and units
has declined precipitously since 1995 In 2000 there were 105 companies that
produced raw steel at 144 locations59 while today there are only 38 companies
producing steel at 93 locations a 64 percent and 36 percent reduction respectively
Most importantly in 2000 thirteen companies ldquooperated integrated steel mills
with an average of 35 blast furnaces in continuous operation during the yearrdquo60 while
today there are only three companies operating 13 basic oxygen furnaces These are
77 percent and 60 percent reductions respectively As a result today only 26 percent
of domestic steel is produced from raw materials in the United States as compared
to 53 percent in 2000
As noted earlier since 2000 there has been over a 25 percent reduction in the
number of basic oxygen furnaces operating in the United States and 33 percent of
the remaining basic oxygen furnaces are currently idled In the Secretaryrsquos view a
further reduction in basic oxygen furnace capacity which is especially important to
the ability of domestic industry to meet national security needs is inevitable if the
present imports continue or increase
This would be a serious ldquoweakening of our internal
economyrdquo and place the United States in a position where it is unable to be certain
59 2001 Report at 21
60 Id
43
it could meet demands for national defense and critical industries in a national 61emergency
Figure 13 Basic Oxygen and Electric Arc Facilities and Units Located in the United States 1975 - 2016
Year asic Oxygen Furnace Facilities
asic Oxygen Furnace Units
Electric rc Furnace Facilities
Electric rc Furnace Units
1975 38 90 -- --
1980 33 78 -- --
1985 27 66 -- --
1990 24 61 127 246
1995 22 56 116 218
2000 19 50 122 174
2005 17 46 115 169
2010 16 44 108 164
2015 13 31 98 154
2016 13 31 98 154 Source US Department of CommerceBIS American Iron and Steel Institute Association for Iron amp Steel Technology Steel Manufacturers Association August 2017 Estimated
Basic Oxygen Furnace Basic Oxygen Furnaces (BOF) are the dominant steelmaking technology globally accounting for 74 of the worlds total output of crude steel in 2016 OF share of production in the US was 33 in 2016 and has been slowly declining due primarily to the advent of the Greenfield electric arc furnace (EF) flat-rolled mills The primary raw materials for the BOF are liquid hot metal (iron) from the blast furnace and steel scrap [1] These are charged into the BOF vessel Oxygen (gt995 pure) is blown into the OF at supersonic velocities It oxidizes the carbon and silicon contained in the hot metal liberating great quantities of heat which melts the scrap Source Steelorg
Electric Arc Furnace The Electric Arc Furnace (EAF) operates as a batch melting process producing batches of molten steel known heats The EF process uses steel scrap and iron units melting them using electricity to make new steel EF output accounted for 66 of US steel production in 2016 Source Steelorg
[1 The last Furnace chemically reduces and physically converts iron oxides into liquid iron called hot metal The blast furnace is a huge steel stack lined with refractory brick where iron ore coke and limestone are dumped into the top and preheated air is blown into the bottom The raw materials require six to eight hours to descend to the bottom of the furnace where they become the final product of liquid slag and liquid iron Source Steelorg
In contrast to the situation in the United States the leading global producers
of steel (Brazil South Korea Japan Russia Germany and especially China)
primarily rely on basic oxygen furnace capacity rather than electric arc furnace
capacity (see Figure 14) Each of these economic competitors to the United States
possess critical research development and production capabilities that the United
61 See infra sections 4 and 5 for a further discussion of the inability to meet surge requirements in an emergency
44
rsquo
States is in danger of losing if imports continue to force US steel producers to
operate at uneconomic capacity utilization levels
A further reduction in domestic basic oxygen furnace capacity would put the
United States at serious risk of becoming dependent on foreign steel to support its
critical industries and defense needs Allowing this decline to continue represents a
ldquoweakening of our internal economy that may impair national securityrdquo which the
Congress has directed the Secretary to advise the President of under the Section 232
See 19 USC sect 1862(d)
Figure 14 The Top 20 Countries Exporting to the US ndash BOF vs EAF Capacity
Rank Top Import Sources in 2016 in Tonnage
Terms
2015 OF Share
2015 EF Share
2015 Other Share
pprox ountry s verage apacity Utilization in 2016
(OED) World 7420 2520 050 67
1 Canada 5380 4620 62
2 Brazil 7820 2020 57
3 South Korea 6960 3040 80
4 Mexico 2970 7030 75
5 Turkey 3500 6500 65
6 Japan 7710 2290 80
7 Russia 6630 3050 310 76
8 Germany 7040 2960 72 (EU 28)
9 Taiwan 6230 3770 75
10 Vietnam 2500 5990 1520 32
11 China 9390 610 69
12 Netherlands 9860 150 72 (EU 28)
13 Italy 2130 7820 72 (EU 28)
14 United Kingdom 8300 1700 72 (EU 28)
15 France 6560 3440 72 (EU 28)
16 India 4290 5710 75
17 Australia 7760 2240 63
18 Spain 3170 6830 72 (EU 28)
19 Sweden 6610 3390 72 (EU 28)
20 South Africa 5650 4350 585 Source World Steel- Production Share Figures for 2015 US ensus ureau (ccessed Via HIS) ndash Import Growth Rates OED 2017 Q2 Market ssessment ndash pproximate apacity Utilization
This is not a hypothetical situation The Department of Defense already finds
itself without domestic suppliers for some particular types of steel used in defense
45
products including tire rod steel used in military vehicles and trucks62 While the
United States has many allies that produce steel relying on foreign owned facilities
located outside the United States introduces significant risk and potential delay for
the development of new steel technologies and production of needed steel products
particularly in times of emergency The Secretary notes that the authority for the
Department of Defense to place its order ahead of commercial orders on a mandatory
basis does not extend to foreign-owned facilities outside the United States63
In the case of critical infrastructure the United States is down to only one
remaining producer of electrical steel in the United States (AK Steel ndash which is
highly leveraged) Electrical steel is necessary for power distribution transformers
for all types of energy ndash including solar nuclear wind coal and natural gas ndash across
the country If domestic electrical steel production as well as transformer and
generator production is not maintained in the US the US will become entirely
dependent on foreign producers to supply these critical materials and products64
Without an assured domestic supply of these products the United States cannot be
certain that it can effectively respond to large power disruptions affecting civilian
populations critical infrastructure and US defense industrial production
capabilities in a timely manner
2 Production is Well Below Demand
Demand for steel products in the United States (see Figure 15) increased from
1001 million metric tons in 2011 to 1175 million metric tons in 2014 then declined
to 998 million metric tons in 2016 Demand in 2017 is projected to rebound to
1077 million metric tons During the 2011 to 2016 period US production of steel
products dropped from 864 million metric tons in 2011 to 786 million metric tons
in 2016 with a four percent increase expected in 2017
62 Letter from Defense Logistics gency olumbus OH to ISOTE ugust 1 2017
63 See Defense Priorities and llocations System Program (DPS) wwwdcmamilDPS
64 United States ongress ongressional Steel aucus Statement of Roger Newport EO K Steel orporation (on behalf of the merican Iron and Steel Institute) March 29 2017
46
For the six-year period US domestic steel production supplied only 70
percent of the average demand even though available US domestic steel production
capacity during that period could have on average supplied up to 100 percent of
demand (US steel producers would be running at 92 percent capacity utilization for
this period) with approximately 13 million metric tons of additional capacity
remaining
Figure 15 US Steel Market Snapshot (millions of metric tons)
2011 2012 2013 2014 2015 2016 2017 YTD
2017 nnualized
Total Demand for Steel in US (Production + Imports - Exports)
US Annual Production (Liquid) 864 887 869 882 788 786 615 819
Sources United States Department of ommerce ureau of the ensus merican Iron and Steel Institute alculations based on industry and trade data
3 Utilization Rates are Well Below Economically Viable Levels
Overall steel mill production capacity utilization has declined from 87 percent
in 1998 to 814 percent in 2008 to 694 percent in 2016 (see Figure 16) For the
most recent six-year period (2011- 2016) the average utilization rate was 74 percent
Industry analysts note that utilization of 80 percent or more is typically
necessary for sustained profitability among other factors65 For most capital and
energy-intensive US steel producers capacity levels of 80 percent or higher are
required to maintain facilities carry out periodic modernization service company
debt and fund research and development
65 Market Realist Why steel investors are mindful of capacity utilization rates October 2 2014 httpmarketrealistcom201410investors-mindful-capacity-utilization-rate See also httpmarketrealistcom201509upstream-exposure-impact-steel-companies
47
When steel factory utilization falls costs per unit of steel product rises
reducing profit margins and product pricing flexibility Higher capacity utilization
usually results in lower per-unit product costs and higher overall profit66 Over 80
percent is a healthy capacity utilization rate and a rate at which most companies
would be profitable
The US steel industry uses 80 percent as a benchmark for minimum
operational efficiency Moreover the steel industry is capable of reaching and
sustaining 80 percent capacity utilization or higher During the 2002-2008 period
US steel companies operated at an average 874 percent level 67
These industry assessments are consistent with a 1983 report on ldquoCritical
Materials Requirements in the US Steel Industryrdquo in which the Department
66 Houston hronical apacity Utilization and Effects on Product and Profit httpsmallbusinesschroncomcapacity-utilization-effects-product-profit-67046html- steel industry sources
67 httpmarketrealistcom201509upstream-exposure-impact-steel-companieshtml (Its important to note how changes in capacity utilization rates impact a companys earnings For example we see a big jump in earnings when utilization rates improve from 80 percent to 85 percent However incremental benefits are lower when utilization rates increase from 90 percent to 95 percent )
48
explained that ldquo[c]apability utilization or capacity use which in effect describes the
efficiency of an industrys use of capital is a prime determinant of profitability
Domestic steel producers were operating at about 55 percent capability for the first
half of 1982 The comparable rate for the first half of 1981 was 85 percent This
current rate is probably well below a breakeven point for most producers whereas
1981 was profitable for nearly all producersrdquo68
4 Declining Steel Production Facilities Limits Capacity Available for a
National Emergency
The number of steel production facilities located in the US continues to
decline As shown earlier in Figure 13 from 1975 to 2016 the number of basic
oxygen furnace facilities decreased from 38 to 13 Similarly from 1990 to 2016
the number of electric arc furnace facilities decreased from 127 to 98
Due to this decline in facilities domestic steel producers have a shrinking
ability to meet national security production requirements in a national emergency
The US Department of Commerce Census Bureau regularly surveys plant capacity
and has found that steel producers are quickly shedding production capacity that
could be used in a national emergency The Census Bureau defines national
emergency production as the ldquogreatest level of production an establishment can
expect to sustain for one year or more under national emergency conditionsrdquo69 From
2011 to 2017 steel producers increased the utilization of the surge capacity they
would have during a national emergency from 542 percent to 682 percent (see
Figure 17) As steel producers use more of this emergency capacity there is an
increasingly limited ability to ramp up steel production to meet national security
needs during a national emergency
68 Department of ommerce ritical Materials Requirements in the US Steel Industry March 1983 at 16-17
69 US Dept of ommerce ensus ureau Survey of Plant apacity 2011-2017
49
0
10
20
30
40
50
60
70
80
2011 2012 2013 2014 2015 2016 2017
Figure 17 Steel Industry Utilization of Emergency Capacity (2011-2017 Quarter 1)
Source US Department of ommerce ensus ureau Survey of Plant apacity
Percent
The ability to increase steel production during a national emergency
continues to diminish as the number of steel production facilities continues to
decline If the US requires a similar increase in steel production as it did during
previous national emergencies domestic steel production capacity may be
insufficient to satisfy national security needs If a national emergency were to
occur at present utilization levels domestic steel producers would be able to
increase production by 146 percent
For comparison from 1938 through 1946 the US increased the production
of pig iron and ferro-alloys by 217 percent and increased the production of steel
ingots and castings by 210 percent to meet the demands of fighting a global war 70
From 1960 through 1973 during the Vietnam era the US increased steel
production by 152 percent 71 Should the US once again experience a conflict on
the scale of the Vietnam War steel production capacity may be slightly insufficient
70 US Dept of ommerce ensus ureau Statistical bstract of the United States 1948 Page 876
71 US Dept of ommerce ensus ureau Statistical bstract of the United States 1978 Page 830
50
to meet national security needs But if the US were to experience a conflict
requiring the production increase seen during the Second World War the existing
domestic steel production capacity would be unable to meet national security
requirements
Increasing steel production capacity once a large-scale national emergency
has arisen would take a significant amount of time According to the American Iron
and Steel Institute the replacement of a basic oxygen furnace facility takes more
than a year to complete Therefore the lack of spare domestic steel production
capacity and the possible inability to sufficiently increase production during a
national emergency may impair the national security of the United States
D Global Excess Steel Capacity is a Circumstance that Contributes to the
Weakening of the Domestic Economy
1 Free markets globally are adversely affected by substantial chronic
global excess steel production led by China
Numerous studies reports and investigations have documented the global excess
steel capacity with China having the largest installed capability (see Figure
18)727374 OECD analyses show that the worldrsquos nominal crude steelmaking capacity
reached about 24 billion metric tons in 2016 an increase of 127 percent compared
to the 2000 level Most of the capacity expansion was planned for construction and
manufacturing activities and to help build the infrastructure necessary for economic
development ndash most in non-OECD countries Furthermore the OECD reports that
while steel capacity increased at a steady rate world steel demand contracted sharply
in the aftermath of the global economic and financial crisis of 2008 Global demand
for steel recovered slowly in the years following 2008 However since 2013 global
steel demand has flattened thereby widening the capacitydemand gap By 2015 the
gap reached over 700 million metric tons
72 run L (2016) Overcapacity in Steel Chinarsquos Role in a Global Problem Washington D lliance for merican Manufacturing httpaamwebs3amazonawscomuploadsresourcesOvercapacityReport2016_R3pdf
73 Price Weld El-Sabaawi L Teslik (2016) apacity Runs Riot Washington D Wiley Rein LLP
74 OED Reports (2016) httpwwwoecdorgindustryind82nd-session-of-the-steel-committeehtm
51
The vast size of the capacitydemand gap means that steel demand alone
cannot increase enough to balance the global overcapacity problem which is
particularly prevalent in China Chinese excess capacity estimated at more than 300
million metric tons dwarfs total US production capacity (see Figure 19)75
The effect of global overcapacity and excess steel production on US steel
prices and import levels is discussed in greater detail in Appendix L While US
steel production capacity has remained flat since 2001 other steel producing nations
have increased their production capacity with China alone able to produce as much
steel as the rest of the world combined
75 OED High Level Meeting Excess apacity and Structural djustment in the Steel Sector pril 2016 httpwwwoecdorgstiindackground20document20No202_FINL_Meetingpdf
52
0
500
1000
1500
2000
2500 M
illio
ns
of
Met
ric
Ton
s
Figure 19 Steelmaking Capacity
World Total China United States
Source OECD
2009 2010 2011 2012 2013 2014 2015 2016 2017
Several countries (India Iran and Indonesia) in addition to China continue to
add production capacity despite slack global demand According to the OECD Steel
Committee Chairrsquos statement from March 2017 ldquoNew data suggest that nearly 40
million metric tons of gross capacity additions are currently underway and could
come on stream during the three-year period of 2017-19 while an additional 536
million metric tons of capacity additions are in the planning stages for possible start-
up during the same time periodrdquo76 This additional global steel capacity coming
online represents over 80 percent of existing US steelmaking production capacity
demonstrating that the import challenge to US industry is continuing to grow
2 Increasing global excess steel capacity will further weaken the internal
economy as US steel producers will face increasing import competition
These additions to worldwide steelmaking capacity will only exacerbate the
situation because they will further lower global operating utilization rates including
in the United States Growth in foreign government-subsidized steel production is
progressively weakening the financial health of the US steel industry as other steel
76 OED 82nd Session of the OED Steel ommittee ndash hairs Statement March 2017 httpwwwoecdorgstiind82-oecd-steel-chair-statementhtm
53
producing countries export more steel to the US to in part to offset the loss of
regional markets to Chinese steel (see Appendix L)
The US share of global production continues to steadily decline In the year
2000 when President Clinton signed into a law a statute granting China permanent
normal trade relations status77 the US share of global steel production stood at 12
percent78 Since that point in time the US share of global steel production continued
an inexorable decline as other countries and especially China began to increase
production The US share of global steel production fell to 8 percent in 200579 5
percent in 200980 and 48 percent in 201581 In contrast China commanded a 497
percent share of global steel production in 201582
If even half of the planned additional global capacity identified by the OECD
Steel Committee is built and the related new production finds its way into the US
it will drive the operating rate of US steel mills to less than 50 percent of capacity
This will cause a substantial and unsustainable negative cash situation that will
ultimately result in multiple corporate bankruptcies due to heavy debt loads and
related declines in steel production capacity and employment levels
77 Public Law 106-286 n act to authorize extension of nondiscriminatory treatment (normal trade relations treatment) to the Peoples Republic of hina and to establish a framework for relations between the United States and the Peoples Republic of hina October 10 2000 httpswwwgpogovfdsyspkgPLW-106publ286
78 US Dept of ommerce ensus ureau Statistical bstract of the United States 2012 Page 574
79 Id
80 Id
81 Steel Statistical Yearbook 2016 World Steel ssociation httpswwwworldsteelorgendamjcr37ad1117-fefc-4df3-b84f-6295478ae460Steel+Statistical+Yearbook+2016pdf
82 Steel Statistical Yearbook 2017 World Steel ssociation httpswwwworldsteelorgendamjcr3e275c73-6f11-4e7f-a5d8-23d9bc5c508fSteel+Statistical+Yearbook+2017pdf
54
VI CONCLUSION
The Secretary has determined that the displacement of domestic steel by
excessive imports and the consequent adverse impact of those quantities of steel
imports on the economic welfare of the domestic steel industry along with the
circumstance of global excess capacity in steel are ldquoweakening our internal
economyrdquo and therefore ldquothreaten to impairrdquo the national security as defined in
Section 232
The continued rising levels of imports of foreign steel threaten to impair the
national security by placing the US steel industry at substantial risk of displacing
the basic oxygen furnace and other steelmaking capacity and the related supply
chain needed to produce steel for critical infrastructure and national defense
In considering ldquothe impact of foreign competition on the economic welfare of
individual domestic [steel] industriesrdquo and other factors Congress expressly outlined
in Section 232 the Secretary has determined that the continued decline and
concentration in steel production capacity is ldquoweakening of our internal economy
and may impair national securityrdquo See 19 USC sect 1862(d)
Global excess steel capacity is a circumstance that contributes to the
ldquoweakening of our internal economyrdquo that ldquothreaten[s] to impairrdquo the national
security as defined in Section 232 Free markets globally are adversely affected by
substantial chronic global excess steel production led by China While US steel
production capacity has remained flat since 2001 other steel producing nations have
increased their production capacity with China alone able to produce as much steel
as the rest of the world combined This overhang of excess capacity means that US
steel producers for the foreseeable future will face increasing competition from
imported steel as other countries export more steel to the United States to bolster
their own economic objectives
Since defense and critical infrastructure requirements alone are not sufficient
to support a robust steel industry US steel producers must be financially viable and
competitive in the commercial market to be available to produce the needed steel
output in a timely and cost efficient manner In fact it is the ability to quickly shift
55
production capacity used for commercial products to defense and critical
infrastructure production that provides the United States a surge capability that is
vital to national security especially in an unexpected or extended conflict or national
emergency It is that capability which is now at serious risk as imports continue to
take business away from domestic producers these producers are in danger of falling
below minimum viable scale and are at risk of having to exit the market and
substantially close down production capacity often permanently
Steel producers in the United States are facing widespread harm from
mounting imports Growing global steel capacity flat or declining world demand
the openness of the US steel market and the price differential between US market
prices and global market prices (often caused by foreign government steel
intervention) ensures that the US will remain an attractive market for foreign steel
absent quotas or tariffs Excessive imports of steel now consistently above 30
percent of domestic demand have displaced domestic steel production the related
skilled workforce and threaten the ability of this critical industry to maintain
economic viability
A US steel industry that is not financially viable to invest in the latest
technologies facilities and long-term research and development nor retain skilled
workers while attracting a next-generation workforce will be unable to meet the
current and projected needs of the US military and critical infrastructure sectors
Moreover the market environment for US steel producers has deteriorated
dramatically since the 2001 Report when the Department concluded that imports of
iron ore and semi-finished steel do not ldquofundamentally threatenrdquo the ability of US
industry to meet national security needs83
The Departmentrsquos investigation indicates that the domestic steel industry has
declined to a point where further closures and consolidation of basic oxygen furnace
facilities represents a ldquoweakening of our internal economyrdquo as defined in Section
232 The more than 50 percent reduction in the number of basic oxygen furnace
83 2001 Report at 28 ndash 37 s noted supra note 16 the 2001 Report added the qualifier fundamentally which is not found in the statutory text The Secretary in this report uses the statutory standard of threatens to impair without such qualification
56
facilities ndash either through closures or idling of facilities due to import competition ndash
increases the chance of further closures that place the United States at serious risk
of being unable to increase production to the levels needed in past national
emergencies The displacement of domestic product by excessive imports is having
the serious effect of causing the domestic industry to operate at unsustainable levels
reducing employment diminishing research and development inhibiting capital
expenditures and causing a loss of vital skills and know-how The present capacity
operating rates for those remaining plants continue to be below those needed for
financial sustainability These conditions have been further exacerbated by the 22
percent surge in imports thus far in 2017 compared with 2016 Imports are now
consistently above 30 percent of US domestic demand
It is evident that the US steel industry is being substantially impacted by the
current levels of imported steel The displacement of domestic steel by imports has
the serious effect of placing the United States at risk of being unable meet national
security requirements The Secretary has determined that the ldquodisplacement of
domestic [steel] products by excessive importsrdquo of steel is having the ldquoserious effectrdquo
of causing the ldquoweakening of our internal economyrdquo See 19 USC sect 1862(d)
Therefore the Secretary recommends that the President take corrective action
pursuant to the authority granted by Section 232 See 19 USC sect 1862(c)
57
VII RECOMMENDATION
Prior significant actions to address steel imports (quotas andor tariffs) were
taken under various statutory authorities by President George W Bush President
William J Clinton (three times) President George H W Bush President Ronald W
Reagan (three times) President James E Carter (twice) and President Richard M
Nixon all at lower levels of import penetration than the present level which is above
30 percent
Due to the threat of steel imports to the national security as defined in Section
232 the Secretary recommends that the President take immediate action by adjusting
the level of imports through quotas or tariffs on steel imported into the United States
as well as direct additional actions to keep the US steel industry financially viable
and able to meet US national security needs The quota or tariff imposed should be
sufficient after accounting for any exclusions to enable the US steel producers to
be able to operate at about an 80 percent or better of the industryrsquos capacity
utilization rate based on available capacity in 2017
In 2016 US steel production was 786 million metric tons and US capacity
was 1133 million metric tons which represents a 694 percent capacity utilization
rate If current import trends for 2017 continue continued imports without any
action are projected to be 360 million metric tons an increase over 2016 of 60
million metric tons Even with US demand projected to increase to 1073 from
998 million metric tons increased imports mean US capacity utilization is forecast
to rise only to 723 percent a non-financially viable and unsustainable level of
operation
By reducing import penetration rates to approximately 21 percent US
industry would be able to operate at 80 percent of their capacity utilization
Achieving this level of capacity utilization based on the projected 2017 import levels
will require reducing imports from 36 million metric tons to about 23 million metric
tons If a reduction in imports can be combined with an increase in domestic steel
demand as can be reasonably expected rising economic growth rates combined with
the increased military spending and infrastructure proposals that the Trump
Administration has planned then US steel mills can be expected to reach a capacity
58
utilization level of 80 percent or greater This increase in US capacity utilization
will enable US steel mills to increase operations significantly in the short-term and
improve the financial viability of the industry over the long-term
Recommendation to Ensure Sustainable Capacity Utilization and
Financial Health
Impose a Quota or Tariff on all steel products covered in this investigation
imported into the United States to remove the threatened impairment to
national security The Secretary recommends adjusting the level of imports through
a quota or tariff on steel imported into the United States
Alternative 1 ndash Global Quota or Tariff
1A Global Quota
Impose quotas on all imported steel products at a specified percent of the 2017
import level applied on a country and steel product basis
According to the Global Trade Analysis Project (GTAP) Model produced by
Purdue University a 63 percent quota would be expected to reduce steel imports by
37 percent (133 million metric tons) from 2017 levels Based on imports from
January to October import levels for 2017 are projected to reach 360 million metric
tons The quotas adjusted as necessary would result in imports equaling about 227
million metric tons which will enable an 80 percent capacity utilization rate at 2017
demand levels (including exports) Application of an annual quota will reduce the
impact of the surge in steel imports that has occurred since the beginning of 2017
1B Global Tariff
Apply a tariff rate on all imported steel products in addition to any
antidumping or countervailing duty collections applicable to any imported steel
product
Similar to what is anticipated under a quota according to the Global Trade
Analysis Project (GTAP) Model produced by Purdue University a 24 percent tariff
on all steel imports would be expected to reduce imports by 37 percent (ie a
59
reduction of 133 million metric tons from 2017 levels of 360 million metric tons) 84
This tariff rate would thus result in imports equaling about 227 million metric tons
which will enable an 80 percent capacity utilization rate at 2017 demand levels
(including exports)85
Alternative 2 ndashTariffs on a Subset of Countries
Apply a tariff rate on all imported steel products from Brazil South Korea
Russia Turkey India Vietnam China Thailand South Africa Egypt Malaysia and
Costa Rica in addition to any antidumping or countervailing duty collections
applicable to any steel products from those countries All other countries would be
limited to 100 percent of their 2017 import level
According to the Global Trade Analysis Project (GTAP) Model produced by
Purdue University a 53 percent tariff on all steel imports from this subset of
countries would be expected to reduce imports by 133 million metric tons from 2017
import levels from the targeted countries This action would enable an increase in
domestic production to achieve an 80 percent capacity utilization rate at 2017
demand levels (including exports) The countries identified are projected to account
for less than 4 percent of US steel exports in 2017
Exemptions
In selecting an alternative the President could determine that specific
countries should be exempted from the proposed 63 percent quota or 24 percent tariff
by granting those specific countries 100 percent of their prior imports in 2017 based
on an overriding economic or security interest of the United States The Secretary
recommends that any such determination should be made at the outset and a
corresponding adjustment be made to the final quota or tariff imposed on the
84 Due to general equilibrium effects the overall import level would need to decrease by more than the corresponding increase in domestic production to offset the negative effects of price or exchange rate changes on export demand
85 The elasticity factor is an estimate not a certainty variation of 01 in the elasticity factor would change the tonnage reduction by about 375000 tons For example imports would fall by an additional 375000 tons under a demand elasticity of -17 instead of -16 and a 25 percent tariff
60
remaining countries This would ensure that overall imports of steel to the United
States remain at or below the level needed to enable the domestic steel industry to
operate as a whole at an 80 percent or greater capacity utilization rate The limitation
to 100 percent of each exempted countryrsquos 2017 imports is necessary to prevent
exempted countries from producing additional steel for export to the United States
or encouraging other countries to seek to trans-ship steel to the United States through
the exempted countries
It is possible to provide exemptions from either the quota or tariff and still
meet the necessary objective of increasing US steel capacity utilization to a
financially viable target of 80 percent However to do so would require a reduction
in the quota or increase in the tariff applied to the remaining countries to offset the
effect of the exempted import tonnage
Exclusions
The Secretary recommends an appeal process by which affected US parties
could seek an exclusion from the tariff or quota imposed The Secretary would grant
exclusions based on a demonstrated (1) lack of sufficient US production capacity
of comparable products or (2) specific national security based considerations This
appeal process would include a public comment period on each exclusion request
and in general would be completed within 90 days of a completed application being
filed with the Secretary
An exclusion may be granted for a period to be determined by the Secretary
and may be terminated if the conditions that gave rise to the exclusion change The
US Department of Commerce will lead the appeal process in coordination with the
Department of Defense and other agencies as appropriate Should exclusions be
granted the Secretary would consider at the time whether the quota or tariff for the
remaining products needs to be adjusted to increase US steel capacity utilization to
a financially viable target of 80 percent
61
twentieth of the size of line pipe imports Canada represents the largest destination
for US line pipe exports with 39 percent of 2016 exports going to Canada followed
by Mexico with 13 percent
4 Steel Prices
Hot-rolled coil prices are a benchmark price indicator for a common type of
steel (see Figure 5) Hot rolled coil is considered a ldquobenchmarkrdquo because it is a
commodity product with a fairly common definition globally
North Europe Domestic Hot Rolled Coil 65954 61441 56841 42019 45529 60490
South Europe Domestic Steel Rebar 63659 59834 55166 39411 42768 56853
000
10000
20000
30000
40000
50000
60000
70000
80000
USD
MT
Source Bloomberg Platts Antaike 2017 prices are through December 20 2017
Figure 6 Regional Comparison of Hot Rolled Coil Bench Mark Prices (USDMT)
In 2015 steel prices fell globally As the OECD noted the combined effect
of weakening global steel demand including in the United States growing exports
in many economies and decreases in steelmaking costs led to a very sharp decline
32
in steel prices in 2015 Notwithstanding these effects prices for steel in the US
remained substantially higher than in any other area However relative to prices
between 2010 and 2013 prices are still relatively depressed
Global excess steel production weakens the pricing power of US steel
producers US steel producersrsquo costs are higher than the costs for producers in other
regions due to higher taxes healthcare environmental and other regulatory
expenses Higher US steel prices incentivize importing lower-cost foreign steel
Moreover excess production and lower prices in regions proximate to state
subsidized enterprises displace purchases from market based steel exporters and add
pressure on those market based suppliers to export to the US The effect of global
excess steel production on US steel prices and import levels is discussed in greater
detail in Appendix L
5 Steel Mill Closures
US steel mill closures continue eroding overall US steel mill capacity and
employment Many US steel mills have been driven out of business due to
declining steel prices global overcapacity and unfairly traded steel Since 2000 the
United States has lost over 25 percent of its basic oxygen furnace facilities with the
closure of six facilities RG Steel in Sparrows Point Maryland RG Steel in
Steubenville Ohio RG Steel in Warren Ohio ArcelorMittal in East Chicago
Indiana ArcelorMittal in Weirton West Virginia and US Steel in Fairfield
Alabama
In addition four electric arc furnace steel facilities have closed Evraz in
Claymont Delaware ArcelorMittal in Georgetown South Carolina Gerdau in Sand
Springs Oklahoma and Republic Steel in Lorain Ohio Most recently
ArcelorMittal has announced the closure of its plate rolling mill in Conshohocken
Pennsylvania because of sagging commercial sales attributed to surging imports of
low-cost steel product and flat defense demand45
The closures of these facilities have had a significant impact on the US
industrial workforce and local economies RG Steel suffered three closures
45 owden M rcelor Mittal to Shut P Plate Mill merican Metal market September 18 2017
33
Sparrows Point Maryland Steubenville Ohio and Warren Ohio After filing for
bankruptcy in 2012 more than 2000 employees were displaced in Maryland alone
and another 2000 in the Midwest The company cited weak demand in the steel
industry as well as lack of financing as key contributors to the closure46
Closures of smaller steel mills have had equally devastating impacts on
employment Gerdau Sand Springs in Oklahoma lost 300 employees after closing
in 2009 because of a long-term drop in demand for steel47 Sand Springs was the
last remaining steel plant in Oklahoma and had been in production since the 1920s
In 2013 at least 345 employees were laid off in response to the closure of the
Claymont steel mill in Delaware The Governor of Delaware Jack Markell
attributed the financial difficulties of the facility to ldquosubdued market demand and the
high volume of importsrdquo48
Similar difficulties were cited by the ArcelorMittalrsquos Georgetown South
Carolina facility and US Steelrsquos location in Fairfield Alabama both of which
closed in 2015 Layoffs for these two corporations totaled 226 and more than 1100
employees respectively Both companies attributed the layoffs to financial losses
and ultimately to facility closures due to the rise in competition from inexpensive
imports49
Even temporary idling of steel plants threatens the US steel industry as there
are significant financial costs with re-opening a steel mill Multiple US facilities
remain idled there are four idled basic oxygen furnace facilities two each in
Kentucky and Illinois representing almost one third of the remaining basic oxygen
46 usiness Journal Unforeseen onditions loses Warren Steel Holdings January 12 2016 httpbusinessjournaldailycomutilities-cut-to-warren-steel-holdings- altimore rew Six reasons why the Sparrows Point steel mill collapsed May 25 2012 httpsbaltimorebrewcom20120525six-reasons-why-the-sparrows-point-steel-mill-collapsed
47 News on 6 Sand Springs Steel Plant May lose June 9 2009 httpwwwnewson6comstory10500785sand-springs-steel-plant-may-close
48 usiness Insider Shutdown of Russian Steel Mill in Delaware ould Send a Message bout US Trade October 17 2013 httpwwwbusinessinsidercomevraz-closes-claymont-steel-2013-10
49 Lcom US Steel lays off 200 more workers in Fairfield March 18 2016 httpwwwalcombusinessindexssf201603us_steel_lays_off_200_more_worhtml
34
furnace facilities in United States50 In addition there are idled pipe and tube mills
in Texas Ohio and Alabama Once production is halted at these facilities it is not
always possible to bring back the highly skilled workforce needed to operate them
When steel mill restarts do occur additional costs are often incurred for specialized
worker training and production ramp-up
In addition when a steel mill closes at a given location the workers find other
occupations move to other steel mills or remain indefinitely unemployed After a
significant period of unemployment much of the specialized skill required by steel
mill workers is forgotten Furthermore it is typically not easy to find and recruit
displaced workers who may live hundreds or thousands of miles away
6 Declining Employment Trend Since 1998
US steel industry employment has declined 35 percent (216400 in 1998 to
139800 in January 2016 - December 2016) including 14100 lost jobs between 2015
and 2016 While employment numbers increased slightly in certain years the trend
is dramatically downward (see Figure 7) Layoffs defer formal plant closings but
are an indication of financial distress Layoffs in the last two years have been
particularly acute in steel producers with pipe and tubular facilities In addition to
layoffs there are permanent closures and bankruptcies in the industry 51
The loss of skilled workers is especially detrimental to the long-term health
and competitiveness of the industry The unstable and declining employment
outlook for the industry also dissuades younger workers from wanting to participate
in the future US steel industry The inability to rapidly add skilled workers to the
industry negatively affects current manufacturing capabilities This is especially
problematic in the event of a major production surge or mobilization
Source Bureau of Labor Statistics using the annual average of seasonally adjusted employees NAICS Codes 3311 and 3312 updated 11222017
Figure 7 Combined Steel Industry Employment (Yearly Average)
7 Trade Actions ndash Antidumping and Countervailing Duties
The number of US antidumping and countervailing duty measures in effect
illustrates the scope of the problem confronting the US steel industry In 1998 at
the height of that periods steel crisis there were just over 100 antidumping and
countervailing duty cases against finished steel products52 Today there are 164
antidumping and countervailing duty orders in effect for steel with another 20 steel
investigations currently ongoing and another waiting to take effect through
publication in the Federal Register (see Appendix K for a full listing of Steel
Antidumping and Countervailing Duty Orders in Effect) This represents a 60
percent increase in cases since the last time the Department investigated steel in
2001
8 Loss of Domestic Opportunities to Bidders Using Imported Steel
Despite efforts to level the playing field through ADCVD orders there are
numerous examples of US steel producers being unable to fairly compete with
foreign suppliers including the lack of ability to bid on some critical US
infrastructure projects Due to unfair competition particularly from foreign state-
52 Global Steel Trade Structural Problems and Future Solutions- Department of ommerce- July 2000
36
owned enterprises US steel producers have lost out on US business opportunities
Some examples include Chinese companies providing steel for the eastern span of
the San Francisco-Oakland Bay Bridge as well as the Alexander Hamilton Bridge
over the Harlem River in New York53
The Alliance for American Manufacturingrsquos statement before the
Congressional Steel Caucus (March 2017) identified three other recent infrastructure
projects in New York that have used or will use heavily subsidized or possibly
dumped foreign steel the Verrazano-Narrows Bridge LaGuardia Airport and the
Holland Tunnel Two major US cities ndash Boston and Chicago ndash have contracted
with Chinese companies to build new subway cars primarily constructed with
imported steel for their respective transportation systems54
9 Financial Distress
Rising levels of imports of steel continue to weaken the US steel industryrsquos
financial health Years of running on low-profit margins or at a loss have weakened
an industry that continues to face an ever-increasing wave of steel imports The US
industry as a whole has operated on average with negative net income from 2009-
2016 Net income for US-owned steel companies has averaged only $162 million
annually since 2010 challenging the financial viability of this vital industry (see
Figure 8)
53 New York Times ridge omes to San Francisco With a Made-in-hina Label June 25 2011 httpwwwnytimescom20110626businessglobal26bridgehtml
54 Reuters hinas RR lands $13 billion hina rail car project March 10 2016 httpwwwreuterscomarticleus-crrc-usa-idUSKN0W17I
37
The Stern School of Business at New York University calculates that US steel
industry participants in the last five years experienced negative net income of 178
percent Compounded growth in revenue for the past five years in the steel industry
has been a negative 7 percent55 The loss of revenue has caused US steel
manufacturers both large and small to defer or eliminate production facility capital
investments and funding for research and development Even though there was a
slight uptick in net income for the first quarter in 2017 over the fourth quarter of
2016 margins remain poor compared to historic levels
Not only have earnings before interest taxes depreciation and amortization
(EBITDA) been shallow for steel producers in the United States many of them are
burdened with high levels of debt as much as 119 times of earnings for one major
producer (see Figure 9)56 While some companies are starting to pay down debt
55 Historical (ompounded nnual) Growth Rates by Sector swath Damodaran New York University Stern School
of usiness January 2017 (see httppagessternnyuedu~adamodarNew_Home_Pagedatafile histgrhtml) 56 Nucor operates mini-mills that use electric arc furnaces to produce high demand steel products primarily with recycled steel scrap From a financial perspective this business model allows Nucor to be highly price competitive but the company produces a narrower range of flat steel products than integrated steel mills The
mini-mills can weather bad economic times because they have lower energy costs and can regulate production
38
others have not been able to do so primarily because of slack demand for
domestically produced steel in the face of competition from imported products
Absent increases in steel production volume and pricing one leading law firm
specializing in insolvency White amp Case observes that some steelmakers in the
United States may soon have to renegotiate loan agreements to extend maturities
those that are not able to may have to consider Chapter 11 bankruptcy57
No capital intensive industry can survive with such poor margins over the
longer term The extensive leverage in the industry shown in Figure 9 adds to the
more easily asic oxygen furnace plants have higher fixed operating costs because they directly convert iron ore and other raw materials along with scrap into steel using more energy-intensive processes
57 Losing Strength US Steel Industry nalysis Scott Griesman White ase pril 16 2016 (see httpswwwwhitecasecompublicationsarticlelosing-strength-us-steel-industry-analysis)
39
likelihood of further closures if the present high level of imports continues to force
US steel mills to operate well below profitable capacity utilization rates
10 Capital Expenditures
The ability of US manufacturers of iron and steel products to fund capital
expenditures for new production plants as well as facility modernization and
advanced manufacturing equipment has been limited by falling revenue and reduced
profits As shown in Figure 10 annual capital expenditures for companies making
iron and steel ingot bars rods plate and other semi-finished products wavered from
$57 billion to $51 billion for 2010-2012 before ramping to $71 billion in 2013
Figure 10 Annual Capital Expenditures
Iron Steel and Ferroalloys Steel NAICS Codes 3311 and 3312 Combined
Millions of Current Dollars
Annual Capital Expenditures Survey 2010 2011 2012 2013 2014 2015
A Structures [New amp Used Structures Combined] 1026 1322 1564 1157 724 580
B Equipment [New amp Used Equipment Combined] 4634 4572 3592 5954 3139 2531
C Total Capital Expenditures 5661 5894 5157 7111 3863 3110
D (Unweighted) Payroll of Reporters Total Payroll of Firms Classified in Industry group
86 84 80 61 86 84
Source US Census Bureau Annual Capital Expenditures Survey wwwcensusgovprograms-surveysaceshtml
Confronted with receding orders for products and declines in income in 2013
iron and steel companies operating production facilities in the United States started
curtailing capital investments Total capital spending dropped to $387 billion in
2014 and slid further to $311 billion in 2015 ndash 32 percent below 2010 levels of $566
billion
The decline in capital expenditures reflected similar drops in net sales which
plummeted from $1296 billion in 2014 to $102 billion in 2015 Income after taxes
40
for US iron and steel manufacturers fell from $248 billion in the same two-year
period to a massive loss of $35 billion in 2015
C Displacement of Domestic Steel by Excessive Quantities of Imports has the
Serious Effect of Weakening Our Internal Economy
1 Domestic Steel Production Capacity is Stagnant and Concentrated
According to the OECD US steel production capacity has remained stagnant
at an average of approximately 1143 million metric tons for more than a decade
from 2006-2016 (see Figure 11) For 2016 the rated maximum capacity was 113
million metric tons for existing basic oxygen furnace and electric arc furnace
Source Organization for Economic Cooperation and Development (OECD) 2017 capacity is a forecast
41
42
The present situation with respect to basic oxygen furnace production is
significantly worse than the situation assessed by the Department in the 2001 Report
As shown in Figure 13 below the number of basic oxygen furnace facilities and units
has declined precipitously since 1995 In 2000 there were 105 companies that
produced raw steel at 144 locations59 while today there are only 38 companies
producing steel at 93 locations a 64 percent and 36 percent reduction respectively
Most importantly in 2000 thirteen companies ldquooperated integrated steel mills
with an average of 35 blast furnaces in continuous operation during the yearrdquo60 while
today there are only three companies operating 13 basic oxygen furnaces These are
77 percent and 60 percent reductions respectively As a result today only 26 percent
of domestic steel is produced from raw materials in the United States as compared
to 53 percent in 2000
As noted earlier since 2000 there has been over a 25 percent reduction in the
number of basic oxygen furnaces operating in the United States and 33 percent of
the remaining basic oxygen furnaces are currently idled In the Secretaryrsquos view a
further reduction in basic oxygen furnace capacity which is especially important to
the ability of domestic industry to meet national security needs is inevitable if the
present imports continue or increase
This would be a serious ldquoweakening of our internal
economyrdquo and place the United States in a position where it is unable to be certain
59 2001 Report at 21
60 Id
43
it could meet demands for national defense and critical industries in a national 61emergency
Figure 13 Basic Oxygen and Electric Arc Facilities and Units Located in the United States 1975 - 2016
Year asic Oxygen Furnace Facilities
asic Oxygen Furnace Units
Electric rc Furnace Facilities
Electric rc Furnace Units
1975 38 90 -- --
1980 33 78 -- --
1985 27 66 -- --
1990 24 61 127 246
1995 22 56 116 218
2000 19 50 122 174
2005 17 46 115 169
2010 16 44 108 164
2015 13 31 98 154
2016 13 31 98 154 Source US Department of CommerceBIS American Iron and Steel Institute Association for Iron amp Steel Technology Steel Manufacturers Association August 2017 Estimated
Basic Oxygen Furnace Basic Oxygen Furnaces (BOF) are the dominant steelmaking technology globally accounting for 74 of the worlds total output of crude steel in 2016 OF share of production in the US was 33 in 2016 and has been slowly declining due primarily to the advent of the Greenfield electric arc furnace (EF) flat-rolled mills The primary raw materials for the BOF are liquid hot metal (iron) from the blast furnace and steel scrap [1] These are charged into the BOF vessel Oxygen (gt995 pure) is blown into the OF at supersonic velocities It oxidizes the carbon and silicon contained in the hot metal liberating great quantities of heat which melts the scrap Source Steelorg
Electric Arc Furnace The Electric Arc Furnace (EAF) operates as a batch melting process producing batches of molten steel known heats The EF process uses steel scrap and iron units melting them using electricity to make new steel EF output accounted for 66 of US steel production in 2016 Source Steelorg
[1 The last Furnace chemically reduces and physically converts iron oxides into liquid iron called hot metal The blast furnace is a huge steel stack lined with refractory brick where iron ore coke and limestone are dumped into the top and preheated air is blown into the bottom The raw materials require six to eight hours to descend to the bottom of the furnace where they become the final product of liquid slag and liquid iron Source Steelorg
In contrast to the situation in the United States the leading global producers
of steel (Brazil South Korea Japan Russia Germany and especially China)
primarily rely on basic oxygen furnace capacity rather than electric arc furnace
capacity (see Figure 14) Each of these economic competitors to the United States
possess critical research development and production capabilities that the United
61 See infra sections 4 and 5 for a further discussion of the inability to meet surge requirements in an emergency
44
rsquo
States is in danger of losing if imports continue to force US steel producers to
operate at uneconomic capacity utilization levels
A further reduction in domestic basic oxygen furnace capacity would put the
United States at serious risk of becoming dependent on foreign steel to support its
critical industries and defense needs Allowing this decline to continue represents a
ldquoweakening of our internal economy that may impair national securityrdquo which the
Congress has directed the Secretary to advise the President of under the Section 232
See 19 USC sect 1862(d)
Figure 14 The Top 20 Countries Exporting to the US ndash BOF vs EAF Capacity
Rank Top Import Sources in 2016 in Tonnage
Terms
2015 OF Share
2015 EF Share
2015 Other Share
pprox ountry s verage apacity Utilization in 2016
(OED) World 7420 2520 050 67
1 Canada 5380 4620 62
2 Brazil 7820 2020 57
3 South Korea 6960 3040 80
4 Mexico 2970 7030 75
5 Turkey 3500 6500 65
6 Japan 7710 2290 80
7 Russia 6630 3050 310 76
8 Germany 7040 2960 72 (EU 28)
9 Taiwan 6230 3770 75
10 Vietnam 2500 5990 1520 32
11 China 9390 610 69
12 Netherlands 9860 150 72 (EU 28)
13 Italy 2130 7820 72 (EU 28)
14 United Kingdom 8300 1700 72 (EU 28)
15 France 6560 3440 72 (EU 28)
16 India 4290 5710 75
17 Australia 7760 2240 63
18 Spain 3170 6830 72 (EU 28)
19 Sweden 6610 3390 72 (EU 28)
20 South Africa 5650 4350 585 Source World Steel- Production Share Figures for 2015 US ensus ureau (ccessed Via HIS) ndash Import Growth Rates OED 2017 Q2 Market ssessment ndash pproximate apacity Utilization
This is not a hypothetical situation The Department of Defense already finds
itself without domestic suppliers for some particular types of steel used in defense
45
products including tire rod steel used in military vehicles and trucks62 While the
United States has many allies that produce steel relying on foreign owned facilities
located outside the United States introduces significant risk and potential delay for
the development of new steel technologies and production of needed steel products
particularly in times of emergency The Secretary notes that the authority for the
Department of Defense to place its order ahead of commercial orders on a mandatory
basis does not extend to foreign-owned facilities outside the United States63
In the case of critical infrastructure the United States is down to only one
remaining producer of electrical steel in the United States (AK Steel ndash which is
highly leveraged) Electrical steel is necessary for power distribution transformers
for all types of energy ndash including solar nuclear wind coal and natural gas ndash across
the country If domestic electrical steel production as well as transformer and
generator production is not maintained in the US the US will become entirely
dependent on foreign producers to supply these critical materials and products64
Without an assured domestic supply of these products the United States cannot be
certain that it can effectively respond to large power disruptions affecting civilian
populations critical infrastructure and US defense industrial production
capabilities in a timely manner
2 Production is Well Below Demand
Demand for steel products in the United States (see Figure 15) increased from
1001 million metric tons in 2011 to 1175 million metric tons in 2014 then declined
to 998 million metric tons in 2016 Demand in 2017 is projected to rebound to
1077 million metric tons During the 2011 to 2016 period US production of steel
products dropped from 864 million metric tons in 2011 to 786 million metric tons
in 2016 with a four percent increase expected in 2017
62 Letter from Defense Logistics gency olumbus OH to ISOTE ugust 1 2017
63 See Defense Priorities and llocations System Program (DPS) wwwdcmamilDPS
64 United States ongress ongressional Steel aucus Statement of Roger Newport EO K Steel orporation (on behalf of the merican Iron and Steel Institute) March 29 2017
46
For the six-year period US domestic steel production supplied only 70
percent of the average demand even though available US domestic steel production
capacity during that period could have on average supplied up to 100 percent of
demand (US steel producers would be running at 92 percent capacity utilization for
this period) with approximately 13 million metric tons of additional capacity
remaining
Figure 15 US Steel Market Snapshot (millions of metric tons)
2011 2012 2013 2014 2015 2016 2017 YTD
2017 nnualized
Total Demand for Steel in US (Production + Imports - Exports)
US Annual Production (Liquid) 864 887 869 882 788 786 615 819
Sources United States Department of ommerce ureau of the ensus merican Iron and Steel Institute alculations based on industry and trade data
3 Utilization Rates are Well Below Economically Viable Levels
Overall steel mill production capacity utilization has declined from 87 percent
in 1998 to 814 percent in 2008 to 694 percent in 2016 (see Figure 16) For the
most recent six-year period (2011- 2016) the average utilization rate was 74 percent
Industry analysts note that utilization of 80 percent or more is typically
necessary for sustained profitability among other factors65 For most capital and
energy-intensive US steel producers capacity levels of 80 percent or higher are
required to maintain facilities carry out periodic modernization service company
debt and fund research and development
65 Market Realist Why steel investors are mindful of capacity utilization rates October 2 2014 httpmarketrealistcom201410investors-mindful-capacity-utilization-rate See also httpmarketrealistcom201509upstream-exposure-impact-steel-companies
47
When steel factory utilization falls costs per unit of steel product rises
reducing profit margins and product pricing flexibility Higher capacity utilization
usually results in lower per-unit product costs and higher overall profit66 Over 80
percent is a healthy capacity utilization rate and a rate at which most companies
would be profitable
The US steel industry uses 80 percent as a benchmark for minimum
operational efficiency Moreover the steel industry is capable of reaching and
sustaining 80 percent capacity utilization or higher During the 2002-2008 period
US steel companies operated at an average 874 percent level 67
These industry assessments are consistent with a 1983 report on ldquoCritical
Materials Requirements in the US Steel Industryrdquo in which the Department
66 Houston hronical apacity Utilization and Effects on Product and Profit httpsmallbusinesschroncomcapacity-utilization-effects-product-profit-67046html- steel industry sources
67 httpmarketrealistcom201509upstream-exposure-impact-steel-companieshtml (Its important to note how changes in capacity utilization rates impact a companys earnings For example we see a big jump in earnings when utilization rates improve from 80 percent to 85 percent However incremental benefits are lower when utilization rates increase from 90 percent to 95 percent )
48
explained that ldquo[c]apability utilization or capacity use which in effect describes the
efficiency of an industrys use of capital is a prime determinant of profitability
Domestic steel producers were operating at about 55 percent capability for the first
half of 1982 The comparable rate for the first half of 1981 was 85 percent This
current rate is probably well below a breakeven point for most producers whereas
1981 was profitable for nearly all producersrdquo68
4 Declining Steel Production Facilities Limits Capacity Available for a
National Emergency
The number of steel production facilities located in the US continues to
decline As shown earlier in Figure 13 from 1975 to 2016 the number of basic
oxygen furnace facilities decreased from 38 to 13 Similarly from 1990 to 2016
the number of electric arc furnace facilities decreased from 127 to 98
Due to this decline in facilities domestic steel producers have a shrinking
ability to meet national security production requirements in a national emergency
The US Department of Commerce Census Bureau regularly surveys plant capacity
and has found that steel producers are quickly shedding production capacity that
could be used in a national emergency The Census Bureau defines national
emergency production as the ldquogreatest level of production an establishment can
expect to sustain for one year or more under national emergency conditionsrdquo69 From
2011 to 2017 steel producers increased the utilization of the surge capacity they
would have during a national emergency from 542 percent to 682 percent (see
Figure 17) As steel producers use more of this emergency capacity there is an
increasingly limited ability to ramp up steel production to meet national security
needs during a national emergency
68 Department of ommerce ritical Materials Requirements in the US Steel Industry March 1983 at 16-17
69 US Dept of ommerce ensus ureau Survey of Plant apacity 2011-2017
49
0
10
20
30
40
50
60
70
80
2011 2012 2013 2014 2015 2016 2017
Figure 17 Steel Industry Utilization of Emergency Capacity (2011-2017 Quarter 1)
Source US Department of ommerce ensus ureau Survey of Plant apacity
Percent
The ability to increase steel production during a national emergency
continues to diminish as the number of steel production facilities continues to
decline If the US requires a similar increase in steel production as it did during
previous national emergencies domestic steel production capacity may be
insufficient to satisfy national security needs If a national emergency were to
occur at present utilization levels domestic steel producers would be able to
increase production by 146 percent
For comparison from 1938 through 1946 the US increased the production
of pig iron and ferro-alloys by 217 percent and increased the production of steel
ingots and castings by 210 percent to meet the demands of fighting a global war 70
From 1960 through 1973 during the Vietnam era the US increased steel
production by 152 percent 71 Should the US once again experience a conflict on
the scale of the Vietnam War steel production capacity may be slightly insufficient
70 US Dept of ommerce ensus ureau Statistical bstract of the United States 1948 Page 876
71 US Dept of ommerce ensus ureau Statistical bstract of the United States 1978 Page 830
50
to meet national security needs But if the US were to experience a conflict
requiring the production increase seen during the Second World War the existing
domestic steel production capacity would be unable to meet national security
requirements
Increasing steel production capacity once a large-scale national emergency
has arisen would take a significant amount of time According to the American Iron
and Steel Institute the replacement of a basic oxygen furnace facility takes more
than a year to complete Therefore the lack of spare domestic steel production
capacity and the possible inability to sufficiently increase production during a
national emergency may impair the national security of the United States
D Global Excess Steel Capacity is a Circumstance that Contributes to the
Weakening of the Domestic Economy
1 Free markets globally are adversely affected by substantial chronic
global excess steel production led by China
Numerous studies reports and investigations have documented the global excess
steel capacity with China having the largest installed capability (see Figure
18)727374 OECD analyses show that the worldrsquos nominal crude steelmaking capacity
reached about 24 billion metric tons in 2016 an increase of 127 percent compared
to the 2000 level Most of the capacity expansion was planned for construction and
manufacturing activities and to help build the infrastructure necessary for economic
development ndash most in non-OECD countries Furthermore the OECD reports that
while steel capacity increased at a steady rate world steel demand contracted sharply
in the aftermath of the global economic and financial crisis of 2008 Global demand
for steel recovered slowly in the years following 2008 However since 2013 global
steel demand has flattened thereby widening the capacitydemand gap By 2015 the
gap reached over 700 million metric tons
72 run L (2016) Overcapacity in Steel Chinarsquos Role in a Global Problem Washington D lliance for merican Manufacturing httpaamwebs3amazonawscomuploadsresourcesOvercapacityReport2016_R3pdf
73 Price Weld El-Sabaawi L Teslik (2016) apacity Runs Riot Washington D Wiley Rein LLP
74 OED Reports (2016) httpwwwoecdorgindustryind82nd-session-of-the-steel-committeehtm
51
The vast size of the capacitydemand gap means that steel demand alone
cannot increase enough to balance the global overcapacity problem which is
particularly prevalent in China Chinese excess capacity estimated at more than 300
million metric tons dwarfs total US production capacity (see Figure 19)75
The effect of global overcapacity and excess steel production on US steel
prices and import levels is discussed in greater detail in Appendix L While US
steel production capacity has remained flat since 2001 other steel producing nations
have increased their production capacity with China alone able to produce as much
steel as the rest of the world combined
75 OED High Level Meeting Excess apacity and Structural djustment in the Steel Sector pril 2016 httpwwwoecdorgstiindackground20document20No202_FINL_Meetingpdf
52
0
500
1000
1500
2000
2500 M
illio
ns
of
Met
ric
Ton
s
Figure 19 Steelmaking Capacity
World Total China United States
Source OECD
2009 2010 2011 2012 2013 2014 2015 2016 2017
Several countries (India Iran and Indonesia) in addition to China continue to
add production capacity despite slack global demand According to the OECD Steel
Committee Chairrsquos statement from March 2017 ldquoNew data suggest that nearly 40
million metric tons of gross capacity additions are currently underway and could
come on stream during the three-year period of 2017-19 while an additional 536
million metric tons of capacity additions are in the planning stages for possible start-
up during the same time periodrdquo76 This additional global steel capacity coming
online represents over 80 percent of existing US steelmaking production capacity
demonstrating that the import challenge to US industry is continuing to grow
2 Increasing global excess steel capacity will further weaken the internal
economy as US steel producers will face increasing import competition
These additions to worldwide steelmaking capacity will only exacerbate the
situation because they will further lower global operating utilization rates including
in the United States Growth in foreign government-subsidized steel production is
progressively weakening the financial health of the US steel industry as other steel
76 OED 82nd Session of the OED Steel ommittee ndash hairs Statement March 2017 httpwwwoecdorgstiind82-oecd-steel-chair-statementhtm
53
producing countries export more steel to the US to in part to offset the loss of
regional markets to Chinese steel (see Appendix L)
The US share of global production continues to steadily decline In the year
2000 when President Clinton signed into a law a statute granting China permanent
normal trade relations status77 the US share of global steel production stood at 12
percent78 Since that point in time the US share of global steel production continued
an inexorable decline as other countries and especially China began to increase
production The US share of global steel production fell to 8 percent in 200579 5
percent in 200980 and 48 percent in 201581 In contrast China commanded a 497
percent share of global steel production in 201582
If even half of the planned additional global capacity identified by the OECD
Steel Committee is built and the related new production finds its way into the US
it will drive the operating rate of US steel mills to less than 50 percent of capacity
This will cause a substantial and unsustainable negative cash situation that will
ultimately result in multiple corporate bankruptcies due to heavy debt loads and
related declines in steel production capacity and employment levels
77 Public Law 106-286 n act to authorize extension of nondiscriminatory treatment (normal trade relations treatment) to the Peoples Republic of hina and to establish a framework for relations between the United States and the Peoples Republic of hina October 10 2000 httpswwwgpogovfdsyspkgPLW-106publ286
78 US Dept of ommerce ensus ureau Statistical bstract of the United States 2012 Page 574
79 Id
80 Id
81 Steel Statistical Yearbook 2016 World Steel ssociation httpswwwworldsteelorgendamjcr37ad1117-fefc-4df3-b84f-6295478ae460Steel+Statistical+Yearbook+2016pdf
82 Steel Statistical Yearbook 2017 World Steel ssociation httpswwwworldsteelorgendamjcr3e275c73-6f11-4e7f-a5d8-23d9bc5c508fSteel+Statistical+Yearbook+2017pdf
54
VI CONCLUSION
The Secretary has determined that the displacement of domestic steel by
excessive imports and the consequent adverse impact of those quantities of steel
imports on the economic welfare of the domestic steel industry along with the
circumstance of global excess capacity in steel are ldquoweakening our internal
economyrdquo and therefore ldquothreaten to impairrdquo the national security as defined in
Section 232
The continued rising levels of imports of foreign steel threaten to impair the
national security by placing the US steel industry at substantial risk of displacing
the basic oxygen furnace and other steelmaking capacity and the related supply
chain needed to produce steel for critical infrastructure and national defense
In considering ldquothe impact of foreign competition on the economic welfare of
individual domestic [steel] industriesrdquo and other factors Congress expressly outlined
in Section 232 the Secretary has determined that the continued decline and
concentration in steel production capacity is ldquoweakening of our internal economy
and may impair national securityrdquo See 19 USC sect 1862(d)
Global excess steel capacity is a circumstance that contributes to the
ldquoweakening of our internal economyrdquo that ldquothreaten[s] to impairrdquo the national
security as defined in Section 232 Free markets globally are adversely affected by
substantial chronic global excess steel production led by China While US steel
production capacity has remained flat since 2001 other steel producing nations have
increased their production capacity with China alone able to produce as much steel
as the rest of the world combined This overhang of excess capacity means that US
steel producers for the foreseeable future will face increasing competition from
imported steel as other countries export more steel to the United States to bolster
their own economic objectives
Since defense and critical infrastructure requirements alone are not sufficient
to support a robust steel industry US steel producers must be financially viable and
competitive in the commercial market to be available to produce the needed steel
output in a timely and cost efficient manner In fact it is the ability to quickly shift
55
production capacity used for commercial products to defense and critical
infrastructure production that provides the United States a surge capability that is
vital to national security especially in an unexpected or extended conflict or national
emergency It is that capability which is now at serious risk as imports continue to
take business away from domestic producers these producers are in danger of falling
below minimum viable scale and are at risk of having to exit the market and
substantially close down production capacity often permanently
Steel producers in the United States are facing widespread harm from
mounting imports Growing global steel capacity flat or declining world demand
the openness of the US steel market and the price differential between US market
prices and global market prices (often caused by foreign government steel
intervention) ensures that the US will remain an attractive market for foreign steel
absent quotas or tariffs Excessive imports of steel now consistently above 30
percent of domestic demand have displaced domestic steel production the related
skilled workforce and threaten the ability of this critical industry to maintain
economic viability
A US steel industry that is not financially viable to invest in the latest
technologies facilities and long-term research and development nor retain skilled
workers while attracting a next-generation workforce will be unable to meet the
current and projected needs of the US military and critical infrastructure sectors
Moreover the market environment for US steel producers has deteriorated
dramatically since the 2001 Report when the Department concluded that imports of
iron ore and semi-finished steel do not ldquofundamentally threatenrdquo the ability of US
industry to meet national security needs83
The Departmentrsquos investigation indicates that the domestic steel industry has
declined to a point where further closures and consolidation of basic oxygen furnace
facilities represents a ldquoweakening of our internal economyrdquo as defined in Section
232 The more than 50 percent reduction in the number of basic oxygen furnace
83 2001 Report at 28 ndash 37 s noted supra note 16 the 2001 Report added the qualifier fundamentally which is not found in the statutory text The Secretary in this report uses the statutory standard of threatens to impair without such qualification
56
facilities ndash either through closures or idling of facilities due to import competition ndash
increases the chance of further closures that place the United States at serious risk
of being unable to increase production to the levels needed in past national
emergencies The displacement of domestic product by excessive imports is having
the serious effect of causing the domestic industry to operate at unsustainable levels
reducing employment diminishing research and development inhibiting capital
expenditures and causing a loss of vital skills and know-how The present capacity
operating rates for those remaining plants continue to be below those needed for
financial sustainability These conditions have been further exacerbated by the 22
percent surge in imports thus far in 2017 compared with 2016 Imports are now
consistently above 30 percent of US domestic demand
It is evident that the US steel industry is being substantially impacted by the
current levels of imported steel The displacement of domestic steel by imports has
the serious effect of placing the United States at risk of being unable meet national
security requirements The Secretary has determined that the ldquodisplacement of
domestic [steel] products by excessive importsrdquo of steel is having the ldquoserious effectrdquo
of causing the ldquoweakening of our internal economyrdquo See 19 USC sect 1862(d)
Therefore the Secretary recommends that the President take corrective action
pursuant to the authority granted by Section 232 See 19 USC sect 1862(c)
57
VII RECOMMENDATION
Prior significant actions to address steel imports (quotas andor tariffs) were
taken under various statutory authorities by President George W Bush President
William J Clinton (three times) President George H W Bush President Ronald W
Reagan (three times) President James E Carter (twice) and President Richard M
Nixon all at lower levels of import penetration than the present level which is above
30 percent
Due to the threat of steel imports to the national security as defined in Section
232 the Secretary recommends that the President take immediate action by adjusting
the level of imports through quotas or tariffs on steel imported into the United States
as well as direct additional actions to keep the US steel industry financially viable
and able to meet US national security needs The quota or tariff imposed should be
sufficient after accounting for any exclusions to enable the US steel producers to
be able to operate at about an 80 percent or better of the industryrsquos capacity
utilization rate based on available capacity in 2017
In 2016 US steel production was 786 million metric tons and US capacity
was 1133 million metric tons which represents a 694 percent capacity utilization
rate If current import trends for 2017 continue continued imports without any
action are projected to be 360 million metric tons an increase over 2016 of 60
million metric tons Even with US demand projected to increase to 1073 from
998 million metric tons increased imports mean US capacity utilization is forecast
to rise only to 723 percent a non-financially viable and unsustainable level of
operation
By reducing import penetration rates to approximately 21 percent US
industry would be able to operate at 80 percent of their capacity utilization
Achieving this level of capacity utilization based on the projected 2017 import levels
will require reducing imports from 36 million metric tons to about 23 million metric
tons If a reduction in imports can be combined with an increase in domestic steel
demand as can be reasonably expected rising economic growth rates combined with
the increased military spending and infrastructure proposals that the Trump
Administration has planned then US steel mills can be expected to reach a capacity
58
utilization level of 80 percent or greater This increase in US capacity utilization
will enable US steel mills to increase operations significantly in the short-term and
improve the financial viability of the industry over the long-term
Recommendation to Ensure Sustainable Capacity Utilization and
Financial Health
Impose a Quota or Tariff on all steel products covered in this investigation
imported into the United States to remove the threatened impairment to
national security The Secretary recommends adjusting the level of imports through
a quota or tariff on steel imported into the United States
Alternative 1 ndash Global Quota or Tariff
1A Global Quota
Impose quotas on all imported steel products at a specified percent of the 2017
import level applied on a country and steel product basis
According to the Global Trade Analysis Project (GTAP) Model produced by
Purdue University a 63 percent quota would be expected to reduce steel imports by
37 percent (133 million metric tons) from 2017 levels Based on imports from
January to October import levels for 2017 are projected to reach 360 million metric
tons The quotas adjusted as necessary would result in imports equaling about 227
million metric tons which will enable an 80 percent capacity utilization rate at 2017
demand levels (including exports) Application of an annual quota will reduce the
impact of the surge in steel imports that has occurred since the beginning of 2017
1B Global Tariff
Apply a tariff rate on all imported steel products in addition to any
antidumping or countervailing duty collections applicable to any imported steel
product
Similar to what is anticipated under a quota according to the Global Trade
Analysis Project (GTAP) Model produced by Purdue University a 24 percent tariff
on all steel imports would be expected to reduce imports by 37 percent (ie a
59
reduction of 133 million metric tons from 2017 levels of 360 million metric tons) 84
This tariff rate would thus result in imports equaling about 227 million metric tons
which will enable an 80 percent capacity utilization rate at 2017 demand levels
(including exports)85
Alternative 2 ndashTariffs on a Subset of Countries
Apply a tariff rate on all imported steel products from Brazil South Korea
Russia Turkey India Vietnam China Thailand South Africa Egypt Malaysia and
Costa Rica in addition to any antidumping or countervailing duty collections
applicable to any steel products from those countries All other countries would be
limited to 100 percent of their 2017 import level
According to the Global Trade Analysis Project (GTAP) Model produced by
Purdue University a 53 percent tariff on all steel imports from this subset of
countries would be expected to reduce imports by 133 million metric tons from 2017
import levels from the targeted countries This action would enable an increase in
domestic production to achieve an 80 percent capacity utilization rate at 2017
demand levels (including exports) The countries identified are projected to account
for less than 4 percent of US steel exports in 2017
Exemptions
In selecting an alternative the President could determine that specific
countries should be exempted from the proposed 63 percent quota or 24 percent tariff
by granting those specific countries 100 percent of their prior imports in 2017 based
on an overriding economic or security interest of the United States The Secretary
recommends that any such determination should be made at the outset and a
corresponding adjustment be made to the final quota or tariff imposed on the
84 Due to general equilibrium effects the overall import level would need to decrease by more than the corresponding increase in domestic production to offset the negative effects of price or exchange rate changes on export demand
85 The elasticity factor is an estimate not a certainty variation of 01 in the elasticity factor would change the tonnage reduction by about 375000 tons For example imports would fall by an additional 375000 tons under a demand elasticity of -17 instead of -16 and a 25 percent tariff
60
remaining countries This would ensure that overall imports of steel to the United
States remain at or below the level needed to enable the domestic steel industry to
operate as a whole at an 80 percent or greater capacity utilization rate The limitation
to 100 percent of each exempted countryrsquos 2017 imports is necessary to prevent
exempted countries from producing additional steel for export to the United States
or encouraging other countries to seek to trans-ship steel to the United States through
the exempted countries
It is possible to provide exemptions from either the quota or tariff and still
meet the necessary objective of increasing US steel capacity utilization to a
financially viable target of 80 percent However to do so would require a reduction
in the quota or increase in the tariff applied to the remaining countries to offset the
effect of the exempted import tonnage
Exclusions
The Secretary recommends an appeal process by which affected US parties
could seek an exclusion from the tariff or quota imposed The Secretary would grant
exclusions based on a demonstrated (1) lack of sufficient US production capacity
of comparable products or (2) specific national security based considerations This
appeal process would include a public comment period on each exclusion request
and in general would be completed within 90 days of a completed application being
filed with the Secretary
An exclusion may be granted for a period to be determined by the Secretary
and may be terminated if the conditions that gave rise to the exclusion change The
US Department of Commerce will lead the appeal process in coordination with the
Department of Defense and other agencies as appropriate Should exclusions be
granted the Secretary would consider at the time whether the quota or tariff for the
remaining products needs to be adjusted to increase US steel capacity utilization to
a financially viable target of 80 percent
61
and other regulatory expenses Moreover lower prices in steel producing regions
backed by state-subsidized enterprises adds pressure on US competitors to export
their steel products to the US Again in 2016 all categories of steel in all
countries continued to experience pressure to lower prices compared to what could
be charged in 2012
2012 2013 2014 2015 2016 2017
USA Domestic Hot Rolled Coil 70184 69620 72778 50565 57568 68411
North Europe Domestic Hot Rolled Coil 65954 61441 56841 42019 45529 60490
South Europe Domestic Steel Rebar 63659 59834 55166 39411 42768 56853
000
10000
20000
30000
40000
50000
60000
70000
80000
USD
MT
Source Bloomberg Platts Antaike 2017 prices are through December 20 2017
Figure 6 Regional Comparison of Hot Rolled Coil Bench Mark Prices (USDMT)
In 2015 steel prices fell globally As the OECD noted the combined effect
of weakening global steel demand including in the United States growing exports
in many economies and decreases in steelmaking costs led to a very sharp decline
32
in steel prices in 2015 Notwithstanding these effects prices for steel in the US
remained substantially higher than in any other area However relative to prices
between 2010 and 2013 prices are still relatively depressed
Global excess steel production weakens the pricing power of US steel
producers US steel producersrsquo costs are higher than the costs for producers in other
regions due to higher taxes healthcare environmental and other regulatory
expenses Higher US steel prices incentivize importing lower-cost foreign steel
Moreover excess production and lower prices in regions proximate to state
subsidized enterprises displace purchases from market based steel exporters and add
pressure on those market based suppliers to export to the US The effect of global
excess steel production on US steel prices and import levels is discussed in greater
detail in Appendix L
5 Steel Mill Closures
US steel mill closures continue eroding overall US steel mill capacity and
employment Many US steel mills have been driven out of business due to
declining steel prices global overcapacity and unfairly traded steel Since 2000 the
United States has lost over 25 percent of its basic oxygen furnace facilities with the
closure of six facilities RG Steel in Sparrows Point Maryland RG Steel in
Steubenville Ohio RG Steel in Warren Ohio ArcelorMittal in East Chicago
Indiana ArcelorMittal in Weirton West Virginia and US Steel in Fairfield
Alabama
In addition four electric arc furnace steel facilities have closed Evraz in
Claymont Delaware ArcelorMittal in Georgetown South Carolina Gerdau in Sand
Springs Oklahoma and Republic Steel in Lorain Ohio Most recently
ArcelorMittal has announced the closure of its plate rolling mill in Conshohocken
Pennsylvania because of sagging commercial sales attributed to surging imports of
low-cost steel product and flat defense demand45
The closures of these facilities have had a significant impact on the US
industrial workforce and local economies RG Steel suffered three closures
45 owden M rcelor Mittal to Shut P Plate Mill merican Metal market September 18 2017
33
Sparrows Point Maryland Steubenville Ohio and Warren Ohio After filing for
bankruptcy in 2012 more than 2000 employees were displaced in Maryland alone
and another 2000 in the Midwest The company cited weak demand in the steel
industry as well as lack of financing as key contributors to the closure46
Closures of smaller steel mills have had equally devastating impacts on
employment Gerdau Sand Springs in Oklahoma lost 300 employees after closing
in 2009 because of a long-term drop in demand for steel47 Sand Springs was the
last remaining steel plant in Oklahoma and had been in production since the 1920s
In 2013 at least 345 employees were laid off in response to the closure of the
Claymont steel mill in Delaware The Governor of Delaware Jack Markell
attributed the financial difficulties of the facility to ldquosubdued market demand and the
high volume of importsrdquo48
Similar difficulties were cited by the ArcelorMittalrsquos Georgetown South
Carolina facility and US Steelrsquos location in Fairfield Alabama both of which
closed in 2015 Layoffs for these two corporations totaled 226 and more than 1100
employees respectively Both companies attributed the layoffs to financial losses
and ultimately to facility closures due to the rise in competition from inexpensive
imports49
Even temporary idling of steel plants threatens the US steel industry as there
are significant financial costs with re-opening a steel mill Multiple US facilities
remain idled there are four idled basic oxygen furnace facilities two each in
Kentucky and Illinois representing almost one third of the remaining basic oxygen
46 usiness Journal Unforeseen onditions loses Warren Steel Holdings January 12 2016 httpbusinessjournaldailycomutilities-cut-to-warren-steel-holdings- altimore rew Six reasons why the Sparrows Point steel mill collapsed May 25 2012 httpsbaltimorebrewcom20120525six-reasons-why-the-sparrows-point-steel-mill-collapsed
47 News on 6 Sand Springs Steel Plant May lose June 9 2009 httpwwwnewson6comstory10500785sand-springs-steel-plant-may-close
48 usiness Insider Shutdown of Russian Steel Mill in Delaware ould Send a Message bout US Trade October 17 2013 httpwwwbusinessinsidercomevraz-closes-claymont-steel-2013-10
49 Lcom US Steel lays off 200 more workers in Fairfield March 18 2016 httpwwwalcombusinessindexssf201603us_steel_lays_off_200_more_worhtml
34
furnace facilities in United States50 In addition there are idled pipe and tube mills
in Texas Ohio and Alabama Once production is halted at these facilities it is not
always possible to bring back the highly skilled workforce needed to operate them
When steel mill restarts do occur additional costs are often incurred for specialized
worker training and production ramp-up
In addition when a steel mill closes at a given location the workers find other
occupations move to other steel mills or remain indefinitely unemployed After a
significant period of unemployment much of the specialized skill required by steel
mill workers is forgotten Furthermore it is typically not easy to find and recruit
displaced workers who may live hundreds or thousands of miles away
6 Declining Employment Trend Since 1998
US steel industry employment has declined 35 percent (216400 in 1998 to
139800 in January 2016 - December 2016) including 14100 lost jobs between 2015
and 2016 While employment numbers increased slightly in certain years the trend
is dramatically downward (see Figure 7) Layoffs defer formal plant closings but
are an indication of financial distress Layoffs in the last two years have been
particularly acute in steel producers with pipe and tubular facilities In addition to
layoffs there are permanent closures and bankruptcies in the industry 51
The loss of skilled workers is especially detrimental to the long-term health
and competitiveness of the industry The unstable and declining employment
outlook for the industry also dissuades younger workers from wanting to participate
in the future US steel industry The inability to rapidly add skilled workers to the
industry negatively affects current manufacturing capabilities This is especially
problematic in the event of a major production surge or mobilization
Source Bureau of Labor Statistics using the annual average of seasonally adjusted employees NAICS Codes 3311 and 3312 updated 11222017
Figure 7 Combined Steel Industry Employment (Yearly Average)
7 Trade Actions ndash Antidumping and Countervailing Duties
The number of US antidumping and countervailing duty measures in effect
illustrates the scope of the problem confronting the US steel industry In 1998 at
the height of that periods steel crisis there were just over 100 antidumping and
countervailing duty cases against finished steel products52 Today there are 164
antidumping and countervailing duty orders in effect for steel with another 20 steel
investigations currently ongoing and another waiting to take effect through
publication in the Federal Register (see Appendix K for a full listing of Steel
Antidumping and Countervailing Duty Orders in Effect) This represents a 60
percent increase in cases since the last time the Department investigated steel in
2001
8 Loss of Domestic Opportunities to Bidders Using Imported Steel
Despite efforts to level the playing field through ADCVD orders there are
numerous examples of US steel producers being unable to fairly compete with
foreign suppliers including the lack of ability to bid on some critical US
infrastructure projects Due to unfair competition particularly from foreign state-
52 Global Steel Trade Structural Problems and Future Solutions- Department of ommerce- July 2000
36
owned enterprises US steel producers have lost out on US business opportunities
Some examples include Chinese companies providing steel for the eastern span of
the San Francisco-Oakland Bay Bridge as well as the Alexander Hamilton Bridge
over the Harlem River in New York53
The Alliance for American Manufacturingrsquos statement before the
Congressional Steel Caucus (March 2017) identified three other recent infrastructure
projects in New York that have used or will use heavily subsidized or possibly
dumped foreign steel the Verrazano-Narrows Bridge LaGuardia Airport and the
Holland Tunnel Two major US cities ndash Boston and Chicago ndash have contracted
with Chinese companies to build new subway cars primarily constructed with
imported steel for their respective transportation systems54
9 Financial Distress
Rising levels of imports of steel continue to weaken the US steel industryrsquos
financial health Years of running on low-profit margins or at a loss have weakened
an industry that continues to face an ever-increasing wave of steel imports The US
industry as a whole has operated on average with negative net income from 2009-
2016 Net income for US-owned steel companies has averaged only $162 million
annually since 2010 challenging the financial viability of this vital industry (see
Figure 8)
53 New York Times ridge omes to San Francisco With a Made-in-hina Label June 25 2011 httpwwwnytimescom20110626businessglobal26bridgehtml
54 Reuters hinas RR lands $13 billion hina rail car project March 10 2016 httpwwwreuterscomarticleus-crrc-usa-idUSKN0W17I
37
The Stern School of Business at New York University calculates that US steel
industry participants in the last five years experienced negative net income of 178
percent Compounded growth in revenue for the past five years in the steel industry
has been a negative 7 percent55 The loss of revenue has caused US steel
manufacturers both large and small to defer or eliminate production facility capital
investments and funding for research and development Even though there was a
slight uptick in net income for the first quarter in 2017 over the fourth quarter of
2016 margins remain poor compared to historic levels
Not only have earnings before interest taxes depreciation and amortization
(EBITDA) been shallow for steel producers in the United States many of them are
burdened with high levels of debt as much as 119 times of earnings for one major
producer (see Figure 9)56 While some companies are starting to pay down debt
55 Historical (ompounded nnual) Growth Rates by Sector swath Damodaran New York University Stern School
of usiness January 2017 (see httppagessternnyuedu~adamodarNew_Home_Pagedatafile histgrhtml) 56 Nucor operates mini-mills that use electric arc furnaces to produce high demand steel products primarily with recycled steel scrap From a financial perspective this business model allows Nucor to be highly price competitive but the company produces a narrower range of flat steel products than integrated steel mills The
mini-mills can weather bad economic times because they have lower energy costs and can regulate production
38
others have not been able to do so primarily because of slack demand for
domestically produced steel in the face of competition from imported products
Absent increases in steel production volume and pricing one leading law firm
specializing in insolvency White amp Case observes that some steelmakers in the
United States may soon have to renegotiate loan agreements to extend maturities
those that are not able to may have to consider Chapter 11 bankruptcy57
No capital intensive industry can survive with such poor margins over the
longer term The extensive leverage in the industry shown in Figure 9 adds to the
more easily asic oxygen furnace plants have higher fixed operating costs because they directly convert iron ore and other raw materials along with scrap into steel using more energy-intensive processes
57 Losing Strength US Steel Industry nalysis Scott Griesman White ase pril 16 2016 (see httpswwwwhitecasecompublicationsarticlelosing-strength-us-steel-industry-analysis)
39
likelihood of further closures if the present high level of imports continues to force
US steel mills to operate well below profitable capacity utilization rates
10 Capital Expenditures
The ability of US manufacturers of iron and steel products to fund capital
expenditures for new production plants as well as facility modernization and
advanced manufacturing equipment has been limited by falling revenue and reduced
profits As shown in Figure 10 annual capital expenditures for companies making
iron and steel ingot bars rods plate and other semi-finished products wavered from
$57 billion to $51 billion for 2010-2012 before ramping to $71 billion in 2013
Figure 10 Annual Capital Expenditures
Iron Steel and Ferroalloys Steel NAICS Codes 3311 and 3312 Combined
Millions of Current Dollars
Annual Capital Expenditures Survey 2010 2011 2012 2013 2014 2015
A Structures [New amp Used Structures Combined] 1026 1322 1564 1157 724 580
B Equipment [New amp Used Equipment Combined] 4634 4572 3592 5954 3139 2531
C Total Capital Expenditures 5661 5894 5157 7111 3863 3110
D (Unweighted) Payroll of Reporters Total Payroll of Firms Classified in Industry group
86 84 80 61 86 84
Source US Census Bureau Annual Capital Expenditures Survey wwwcensusgovprograms-surveysaceshtml
Confronted with receding orders for products and declines in income in 2013
iron and steel companies operating production facilities in the United States started
curtailing capital investments Total capital spending dropped to $387 billion in
2014 and slid further to $311 billion in 2015 ndash 32 percent below 2010 levels of $566
billion
The decline in capital expenditures reflected similar drops in net sales which
plummeted from $1296 billion in 2014 to $102 billion in 2015 Income after taxes
40
for US iron and steel manufacturers fell from $248 billion in the same two-year
period to a massive loss of $35 billion in 2015
C Displacement of Domestic Steel by Excessive Quantities of Imports has the
Serious Effect of Weakening Our Internal Economy
1 Domestic Steel Production Capacity is Stagnant and Concentrated
According to the OECD US steel production capacity has remained stagnant
at an average of approximately 1143 million metric tons for more than a decade
from 2006-2016 (see Figure 11) For 2016 the rated maximum capacity was 113
million metric tons for existing basic oxygen furnace and electric arc furnace
Source Organization for Economic Cooperation and Development (OECD) 2017 capacity is a forecast
41
42
The present situation with respect to basic oxygen furnace production is
significantly worse than the situation assessed by the Department in the 2001 Report
As shown in Figure 13 below the number of basic oxygen furnace facilities and units
has declined precipitously since 1995 In 2000 there were 105 companies that
produced raw steel at 144 locations59 while today there are only 38 companies
producing steel at 93 locations a 64 percent and 36 percent reduction respectively
Most importantly in 2000 thirteen companies ldquooperated integrated steel mills
with an average of 35 blast furnaces in continuous operation during the yearrdquo60 while
today there are only three companies operating 13 basic oxygen furnaces These are
77 percent and 60 percent reductions respectively As a result today only 26 percent
of domestic steel is produced from raw materials in the United States as compared
to 53 percent in 2000
As noted earlier since 2000 there has been over a 25 percent reduction in the
number of basic oxygen furnaces operating in the United States and 33 percent of
the remaining basic oxygen furnaces are currently idled In the Secretaryrsquos view a
further reduction in basic oxygen furnace capacity which is especially important to
the ability of domestic industry to meet national security needs is inevitable if the
present imports continue or increase
This would be a serious ldquoweakening of our internal
economyrdquo and place the United States in a position where it is unable to be certain
59 2001 Report at 21
60 Id
43
it could meet demands for national defense and critical industries in a national 61emergency
Figure 13 Basic Oxygen and Electric Arc Facilities and Units Located in the United States 1975 - 2016
Year asic Oxygen Furnace Facilities
asic Oxygen Furnace Units
Electric rc Furnace Facilities
Electric rc Furnace Units
1975 38 90 -- --
1980 33 78 -- --
1985 27 66 -- --
1990 24 61 127 246
1995 22 56 116 218
2000 19 50 122 174
2005 17 46 115 169
2010 16 44 108 164
2015 13 31 98 154
2016 13 31 98 154 Source US Department of CommerceBIS American Iron and Steel Institute Association for Iron amp Steel Technology Steel Manufacturers Association August 2017 Estimated
Basic Oxygen Furnace Basic Oxygen Furnaces (BOF) are the dominant steelmaking technology globally accounting for 74 of the worlds total output of crude steel in 2016 OF share of production in the US was 33 in 2016 and has been slowly declining due primarily to the advent of the Greenfield electric arc furnace (EF) flat-rolled mills The primary raw materials for the BOF are liquid hot metal (iron) from the blast furnace and steel scrap [1] These are charged into the BOF vessel Oxygen (gt995 pure) is blown into the OF at supersonic velocities It oxidizes the carbon and silicon contained in the hot metal liberating great quantities of heat which melts the scrap Source Steelorg
Electric Arc Furnace The Electric Arc Furnace (EAF) operates as a batch melting process producing batches of molten steel known heats The EF process uses steel scrap and iron units melting them using electricity to make new steel EF output accounted for 66 of US steel production in 2016 Source Steelorg
[1 The last Furnace chemically reduces and physically converts iron oxides into liquid iron called hot metal The blast furnace is a huge steel stack lined with refractory brick where iron ore coke and limestone are dumped into the top and preheated air is blown into the bottom The raw materials require six to eight hours to descend to the bottom of the furnace where they become the final product of liquid slag and liquid iron Source Steelorg
In contrast to the situation in the United States the leading global producers
of steel (Brazil South Korea Japan Russia Germany and especially China)
primarily rely on basic oxygen furnace capacity rather than electric arc furnace
capacity (see Figure 14) Each of these economic competitors to the United States
possess critical research development and production capabilities that the United
61 See infra sections 4 and 5 for a further discussion of the inability to meet surge requirements in an emergency
44
rsquo
States is in danger of losing if imports continue to force US steel producers to
operate at uneconomic capacity utilization levels
A further reduction in domestic basic oxygen furnace capacity would put the
United States at serious risk of becoming dependent on foreign steel to support its
critical industries and defense needs Allowing this decline to continue represents a
ldquoweakening of our internal economy that may impair national securityrdquo which the
Congress has directed the Secretary to advise the President of under the Section 232
See 19 USC sect 1862(d)
Figure 14 The Top 20 Countries Exporting to the US ndash BOF vs EAF Capacity
Rank Top Import Sources in 2016 in Tonnage
Terms
2015 OF Share
2015 EF Share
2015 Other Share
pprox ountry s verage apacity Utilization in 2016
(OED) World 7420 2520 050 67
1 Canada 5380 4620 62
2 Brazil 7820 2020 57
3 South Korea 6960 3040 80
4 Mexico 2970 7030 75
5 Turkey 3500 6500 65
6 Japan 7710 2290 80
7 Russia 6630 3050 310 76
8 Germany 7040 2960 72 (EU 28)
9 Taiwan 6230 3770 75
10 Vietnam 2500 5990 1520 32
11 China 9390 610 69
12 Netherlands 9860 150 72 (EU 28)
13 Italy 2130 7820 72 (EU 28)
14 United Kingdom 8300 1700 72 (EU 28)
15 France 6560 3440 72 (EU 28)
16 India 4290 5710 75
17 Australia 7760 2240 63
18 Spain 3170 6830 72 (EU 28)
19 Sweden 6610 3390 72 (EU 28)
20 South Africa 5650 4350 585 Source World Steel- Production Share Figures for 2015 US ensus ureau (ccessed Via HIS) ndash Import Growth Rates OED 2017 Q2 Market ssessment ndash pproximate apacity Utilization
This is not a hypothetical situation The Department of Defense already finds
itself without domestic suppliers for some particular types of steel used in defense
45
products including tire rod steel used in military vehicles and trucks62 While the
United States has many allies that produce steel relying on foreign owned facilities
located outside the United States introduces significant risk and potential delay for
the development of new steel technologies and production of needed steel products
particularly in times of emergency The Secretary notes that the authority for the
Department of Defense to place its order ahead of commercial orders on a mandatory
basis does not extend to foreign-owned facilities outside the United States63
In the case of critical infrastructure the United States is down to only one
remaining producer of electrical steel in the United States (AK Steel ndash which is
highly leveraged) Electrical steel is necessary for power distribution transformers
for all types of energy ndash including solar nuclear wind coal and natural gas ndash across
the country If domestic electrical steel production as well as transformer and
generator production is not maintained in the US the US will become entirely
dependent on foreign producers to supply these critical materials and products64
Without an assured domestic supply of these products the United States cannot be
certain that it can effectively respond to large power disruptions affecting civilian
populations critical infrastructure and US defense industrial production
capabilities in a timely manner
2 Production is Well Below Demand
Demand for steel products in the United States (see Figure 15) increased from
1001 million metric tons in 2011 to 1175 million metric tons in 2014 then declined
to 998 million metric tons in 2016 Demand in 2017 is projected to rebound to
1077 million metric tons During the 2011 to 2016 period US production of steel
products dropped from 864 million metric tons in 2011 to 786 million metric tons
in 2016 with a four percent increase expected in 2017
62 Letter from Defense Logistics gency olumbus OH to ISOTE ugust 1 2017
63 See Defense Priorities and llocations System Program (DPS) wwwdcmamilDPS
64 United States ongress ongressional Steel aucus Statement of Roger Newport EO K Steel orporation (on behalf of the merican Iron and Steel Institute) March 29 2017
46
For the six-year period US domestic steel production supplied only 70
percent of the average demand even though available US domestic steel production
capacity during that period could have on average supplied up to 100 percent of
demand (US steel producers would be running at 92 percent capacity utilization for
this period) with approximately 13 million metric tons of additional capacity
remaining
Figure 15 US Steel Market Snapshot (millions of metric tons)
2011 2012 2013 2014 2015 2016 2017 YTD
2017 nnualized
Total Demand for Steel in US (Production + Imports - Exports)
US Annual Production (Liquid) 864 887 869 882 788 786 615 819
Sources United States Department of ommerce ureau of the ensus merican Iron and Steel Institute alculations based on industry and trade data
3 Utilization Rates are Well Below Economically Viable Levels
Overall steel mill production capacity utilization has declined from 87 percent
in 1998 to 814 percent in 2008 to 694 percent in 2016 (see Figure 16) For the
most recent six-year period (2011- 2016) the average utilization rate was 74 percent
Industry analysts note that utilization of 80 percent or more is typically
necessary for sustained profitability among other factors65 For most capital and
energy-intensive US steel producers capacity levels of 80 percent or higher are
required to maintain facilities carry out periodic modernization service company
debt and fund research and development
65 Market Realist Why steel investors are mindful of capacity utilization rates October 2 2014 httpmarketrealistcom201410investors-mindful-capacity-utilization-rate See also httpmarketrealistcom201509upstream-exposure-impact-steel-companies
47
When steel factory utilization falls costs per unit of steel product rises
reducing profit margins and product pricing flexibility Higher capacity utilization
usually results in lower per-unit product costs and higher overall profit66 Over 80
percent is a healthy capacity utilization rate and a rate at which most companies
would be profitable
The US steel industry uses 80 percent as a benchmark for minimum
operational efficiency Moreover the steel industry is capable of reaching and
sustaining 80 percent capacity utilization or higher During the 2002-2008 period
US steel companies operated at an average 874 percent level 67
These industry assessments are consistent with a 1983 report on ldquoCritical
Materials Requirements in the US Steel Industryrdquo in which the Department
66 Houston hronical apacity Utilization and Effects on Product and Profit httpsmallbusinesschroncomcapacity-utilization-effects-product-profit-67046html- steel industry sources
67 httpmarketrealistcom201509upstream-exposure-impact-steel-companieshtml (Its important to note how changes in capacity utilization rates impact a companys earnings For example we see a big jump in earnings when utilization rates improve from 80 percent to 85 percent However incremental benefits are lower when utilization rates increase from 90 percent to 95 percent )
48
explained that ldquo[c]apability utilization or capacity use which in effect describes the
efficiency of an industrys use of capital is a prime determinant of profitability
Domestic steel producers were operating at about 55 percent capability for the first
half of 1982 The comparable rate for the first half of 1981 was 85 percent This
current rate is probably well below a breakeven point for most producers whereas
1981 was profitable for nearly all producersrdquo68
4 Declining Steel Production Facilities Limits Capacity Available for a
National Emergency
The number of steel production facilities located in the US continues to
decline As shown earlier in Figure 13 from 1975 to 2016 the number of basic
oxygen furnace facilities decreased from 38 to 13 Similarly from 1990 to 2016
the number of electric arc furnace facilities decreased from 127 to 98
Due to this decline in facilities domestic steel producers have a shrinking
ability to meet national security production requirements in a national emergency
The US Department of Commerce Census Bureau regularly surveys plant capacity
and has found that steel producers are quickly shedding production capacity that
could be used in a national emergency The Census Bureau defines national
emergency production as the ldquogreatest level of production an establishment can
expect to sustain for one year or more under national emergency conditionsrdquo69 From
2011 to 2017 steel producers increased the utilization of the surge capacity they
would have during a national emergency from 542 percent to 682 percent (see
Figure 17) As steel producers use more of this emergency capacity there is an
increasingly limited ability to ramp up steel production to meet national security
needs during a national emergency
68 Department of ommerce ritical Materials Requirements in the US Steel Industry March 1983 at 16-17
69 US Dept of ommerce ensus ureau Survey of Plant apacity 2011-2017
49
0
10
20
30
40
50
60
70
80
2011 2012 2013 2014 2015 2016 2017
Figure 17 Steel Industry Utilization of Emergency Capacity (2011-2017 Quarter 1)
Source US Department of ommerce ensus ureau Survey of Plant apacity
Percent
The ability to increase steel production during a national emergency
continues to diminish as the number of steel production facilities continues to
decline If the US requires a similar increase in steel production as it did during
previous national emergencies domestic steel production capacity may be
insufficient to satisfy national security needs If a national emergency were to
occur at present utilization levels domestic steel producers would be able to
increase production by 146 percent
For comparison from 1938 through 1946 the US increased the production
of pig iron and ferro-alloys by 217 percent and increased the production of steel
ingots and castings by 210 percent to meet the demands of fighting a global war 70
From 1960 through 1973 during the Vietnam era the US increased steel
production by 152 percent 71 Should the US once again experience a conflict on
the scale of the Vietnam War steel production capacity may be slightly insufficient
70 US Dept of ommerce ensus ureau Statistical bstract of the United States 1948 Page 876
71 US Dept of ommerce ensus ureau Statistical bstract of the United States 1978 Page 830
50
to meet national security needs But if the US were to experience a conflict
requiring the production increase seen during the Second World War the existing
domestic steel production capacity would be unable to meet national security
requirements
Increasing steel production capacity once a large-scale national emergency
has arisen would take a significant amount of time According to the American Iron
and Steel Institute the replacement of a basic oxygen furnace facility takes more
than a year to complete Therefore the lack of spare domestic steel production
capacity and the possible inability to sufficiently increase production during a
national emergency may impair the national security of the United States
D Global Excess Steel Capacity is a Circumstance that Contributes to the
Weakening of the Domestic Economy
1 Free markets globally are adversely affected by substantial chronic
global excess steel production led by China
Numerous studies reports and investigations have documented the global excess
steel capacity with China having the largest installed capability (see Figure
18)727374 OECD analyses show that the worldrsquos nominal crude steelmaking capacity
reached about 24 billion metric tons in 2016 an increase of 127 percent compared
to the 2000 level Most of the capacity expansion was planned for construction and
manufacturing activities and to help build the infrastructure necessary for economic
development ndash most in non-OECD countries Furthermore the OECD reports that
while steel capacity increased at a steady rate world steel demand contracted sharply
in the aftermath of the global economic and financial crisis of 2008 Global demand
for steel recovered slowly in the years following 2008 However since 2013 global
steel demand has flattened thereby widening the capacitydemand gap By 2015 the
gap reached over 700 million metric tons
72 run L (2016) Overcapacity in Steel Chinarsquos Role in a Global Problem Washington D lliance for merican Manufacturing httpaamwebs3amazonawscomuploadsresourcesOvercapacityReport2016_R3pdf
73 Price Weld El-Sabaawi L Teslik (2016) apacity Runs Riot Washington D Wiley Rein LLP
74 OED Reports (2016) httpwwwoecdorgindustryind82nd-session-of-the-steel-committeehtm
51
The vast size of the capacitydemand gap means that steel demand alone
cannot increase enough to balance the global overcapacity problem which is
particularly prevalent in China Chinese excess capacity estimated at more than 300
million metric tons dwarfs total US production capacity (see Figure 19)75
The effect of global overcapacity and excess steel production on US steel
prices and import levels is discussed in greater detail in Appendix L While US
steel production capacity has remained flat since 2001 other steel producing nations
have increased their production capacity with China alone able to produce as much
steel as the rest of the world combined
75 OED High Level Meeting Excess apacity and Structural djustment in the Steel Sector pril 2016 httpwwwoecdorgstiindackground20document20No202_FINL_Meetingpdf
52
0
500
1000
1500
2000
2500 M
illio
ns
of
Met
ric
Ton
s
Figure 19 Steelmaking Capacity
World Total China United States
Source OECD
2009 2010 2011 2012 2013 2014 2015 2016 2017
Several countries (India Iran and Indonesia) in addition to China continue to
add production capacity despite slack global demand According to the OECD Steel
Committee Chairrsquos statement from March 2017 ldquoNew data suggest that nearly 40
million metric tons of gross capacity additions are currently underway and could
come on stream during the three-year period of 2017-19 while an additional 536
million metric tons of capacity additions are in the planning stages for possible start-
up during the same time periodrdquo76 This additional global steel capacity coming
online represents over 80 percent of existing US steelmaking production capacity
demonstrating that the import challenge to US industry is continuing to grow
2 Increasing global excess steel capacity will further weaken the internal
economy as US steel producers will face increasing import competition
These additions to worldwide steelmaking capacity will only exacerbate the
situation because they will further lower global operating utilization rates including
in the United States Growth in foreign government-subsidized steel production is
progressively weakening the financial health of the US steel industry as other steel
76 OED 82nd Session of the OED Steel ommittee ndash hairs Statement March 2017 httpwwwoecdorgstiind82-oecd-steel-chair-statementhtm
53
producing countries export more steel to the US to in part to offset the loss of
regional markets to Chinese steel (see Appendix L)
The US share of global production continues to steadily decline In the year
2000 when President Clinton signed into a law a statute granting China permanent
normal trade relations status77 the US share of global steel production stood at 12
percent78 Since that point in time the US share of global steel production continued
an inexorable decline as other countries and especially China began to increase
production The US share of global steel production fell to 8 percent in 200579 5
percent in 200980 and 48 percent in 201581 In contrast China commanded a 497
percent share of global steel production in 201582
If even half of the planned additional global capacity identified by the OECD
Steel Committee is built and the related new production finds its way into the US
it will drive the operating rate of US steel mills to less than 50 percent of capacity
This will cause a substantial and unsustainable negative cash situation that will
ultimately result in multiple corporate bankruptcies due to heavy debt loads and
related declines in steel production capacity and employment levels
77 Public Law 106-286 n act to authorize extension of nondiscriminatory treatment (normal trade relations treatment) to the Peoples Republic of hina and to establish a framework for relations between the United States and the Peoples Republic of hina October 10 2000 httpswwwgpogovfdsyspkgPLW-106publ286
78 US Dept of ommerce ensus ureau Statistical bstract of the United States 2012 Page 574
79 Id
80 Id
81 Steel Statistical Yearbook 2016 World Steel ssociation httpswwwworldsteelorgendamjcr37ad1117-fefc-4df3-b84f-6295478ae460Steel+Statistical+Yearbook+2016pdf
82 Steel Statistical Yearbook 2017 World Steel ssociation httpswwwworldsteelorgendamjcr3e275c73-6f11-4e7f-a5d8-23d9bc5c508fSteel+Statistical+Yearbook+2017pdf
54
VI CONCLUSION
The Secretary has determined that the displacement of domestic steel by
excessive imports and the consequent adverse impact of those quantities of steel
imports on the economic welfare of the domestic steel industry along with the
circumstance of global excess capacity in steel are ldquoweakening our internal
economyrdquo and therefore ldquothreaten to impairrdquo the national security as defined in
Section 232
The continued rising levels of imports of foreign steel threaten to impair the
national security by placing the US steel industry at substantial risk of displacing
the basic oxygen furnace and other steelmaking capacity and the related supply
chain needed to produce steel for critical infrastructure and national defense
In considering ldquothe impact of foreign competition on the economic welfare of
individual domestic [steel] industriesrdquo and other factors Congress expressly outlined
in Section 232 the Secretary has determined that the continued decline and
concentration in steel production capacity is ldquoweakening of our internal economy
and may impair national securityrdquo See 19 USC sect 1862(d)
Global excess steel capacity is a circumstance that contributes to the
ldquoweakening of our internal economyrdquo that ldquothreaten[s] to impairrdquo the national
security as defined in Section 232 Free markets globally are adversely affected by
substantial chronic global excess steel production led by China While US steel
production capacity has remained flat since 2001 other steel producing nations have
increased their production capacity with China alone able to produce as much steel
as the rest of the world combined This overhang of excess capacity means that US
steel producers for the foreseeable future will face increasing competition from
imported steel as other countries export more steel to the United States to bolster
their own economic objectives
Since defense and critical infrastructure requirements alone are not sufficient
to support a robust steel industry US steel producers must be financially viable and
competitive in the commercial market to be available to produce the needed steel
output in a timely and cost efficient manner In fact it is the ability to quickly shift
55
production capacity used for commercial products to defense and critical
infrastructure production that provides the United States a surge capability that is
vital to national security especially in an unexpected or extended conflict or national
emergency It is that capability which is now at serious risk as imports continue to
take business away from domestic producers these producers are in danger of falling
below minimum viable scale and are at risk of having to exit the market and
substantially close down production capacity often permanently
Steel producers in the United States are facing widespread harm from
mounting imports Growing global steel capacity flat or declining world demand
the openness of the US steel market and the price differential between US market
prices and global market prices (often caused by foreign government steel
intervention) ensures that the US will remain an attractive market for foreign steel
absent quotas or tariffs Excessive imports of steel now consistently above 30
percent of domestic demand have displaced domestic steel production the related
skilled workforce and threaten the ability of this critical industry to maintain
economic viability
A US steel industry that is not financially viable to invest in the latest
technologies facilities and long-term research and development nor retain skilled
workers while attracting a next-generation workforce will be unable to meet the
current and projected needs of the US military and critical infrastructure sectors
Moreover the market environment for US steel producers has deteriorated
dramatically since the 2001 Report when the Department concluded that imports of
iron ore and semi-finished steel do not ldquofundamentally threatenrdquo the ability of US
industry to meet national security needs83
The Departmentrsquos investigation indicates that the domestic steel industry has
declined to a point where further closures and consolidation of basic oxygen furnace
facilities represents a ldquoweakening of our internal economyrdquo as defined in Section
232 The more than 50 percent reduction in the number of basic oxygen furnace
83 2001 Report at 28 ndash 37 s noted supra note 16 the 2001 Report added the qualifier fundamentally which is not found in the statutory text The Secretary in this report uses the statutory standard of threatens to impair without such qualification
56
facilities ndash either through closures or idling of facilities due to import competition ndash
increases the chance of further closures that place the United States at serious risk
of being unable to increase production to the levels needed in past national
emergencies The displacement of domestic product by excessive imports is having
the serious effect of causing the domestic industry to operate at unsustainable levels
reducing employment diminishing research and development inhibiting capital
expenditures and causing a loss of vital skills and know-how The present capacity
operating rates for those remaining plants continue to be below those needed for
financial sustainability These conditions have been further exacerbated by the 22
percent surge in imports thus far in 2017 compared with 2016 Imports are now
consistently above 30 percent of US domestic demand
It is evident that the US steel industry is being substantially impacted by the
current levels of imported steel The displacement of domestic steel by imports has
the serious effect of placing the United States at risk of being unable meet national
security requirements The Secretary has determined that the ldquodisplacement of
domestic [steel] products by excessive importsrdquo of steel is having the ldquoserious effectrdquo
of causing the ldquoweakening of our internal economyrdquo See 19 USC sect 1862(d)
Therefore the Secretary recommends that the President take corrective action
pursuant to the authority granted by Section 232 See 19 USC sect 1862(c)
57
VII RECOMMENDATION
Prior significant actions to address steel imports (quotas andor tariffs) were
taken under various statutory authorities by President George W Bush President
William J Clinton (three times) President George H W Bush President Ronald W
Reagan (three times) President James E Carter (twice) and President Richard M
Nixon all at lower levels of import penetration than the present level which is above
30 percent
Due to the threat of steel imports to the national security as defined in Section
232 the Secretary recommends that the President take immediate action by adjusting
the level of imports through quotas or tariffs on steel imported into the United States
as well as direct additional actions to keep the US steel industry financially viable
and able to meet US national security needs The quota or tariff imposed should be
sufficient after accounting for any exclusions to enable the US steel producers to
be able to operate at about an 80 percent or better of the industryrsquos capacity
utilization rate based on available capacity in 2017
In 2016 US steel production was 786 million metric tons and US capacity
was 1133 million metric tons which represents a 694 percent capacity utilization
rate If current import trends for 2017 continue continued imports without any
action are projected to be 360 million metric tons an increase over 2016 of 60
million metric tons Even with US demand projected to increase to 1073 from
998 million metric tons increased imports mean US capacity utilization is forecast
to rise only to 723 percent a non-financially viable and unsustainable level of
operation
By reducing import penetration rates to approximately 21 percent US
industry would be able to operate at 80 percent of their capacity utilization
Achieving this level of capacity utilization based on the projected 2017 import levels
will require reducing imports from 36 million metric tons to about 23 million metric
tons If a reduction in imports can be combined with an increase in domestic steel
demand as can be reasonably expected rising economic growth rates combined with
the increased military spending and infrastructure proposals that the Trump
Administration has planned then US steel mills can be expected to reach a capacity
58
utilization level of 80 percent or greater This increase in US capacity utilization
will enable US steel mills to increase operations significantly in the short-term and
improve the financial viability of the industry over the long-term
Recommendation to Ensure Sustainable Capacity Utilization and
Financial Health
Impose a Quota or Tariff on all steel products covered in this investigation
imported into the United States to remove the threatened impairment to
national security The Secretary recommends adjusting the level of imports through
a quota or tariff on steel imported into the United States
Alternative 1 ndash Global Quota or Tariff
1A Global Quota
Impose quotas on all imported steel products at a specified percent of the 2017
import level applied on a country and steel product basis
According to the Global Trade Analysis Project (GTAP) Model produced by
Purdue University a 63 percent quota would be expected to reduce steel imports by
37 percent (133 million metric tons) from 2017 levels Based on imports from
January to October import levels for 2017 are projected to reach 360 million metric
tons The quotas adjusted as necessary would result in imports equaling about 227
million metric tons which will enable an 80 percent capacity utilization rate at 2017
demand levels (including exports) Application of an annual quota will reduce the
impact of the surge in steel imports that has occurred since the beginning of 2017
1B Global Tariff
Apply a tariff rate on all imported steel products in addition to any
antidumping or countervailing duty collections applicable to any imported steel
product
Similar to what is anticipated under a quota according to the Global Trade
Analysis Project (GTAP) Model produced by Purdue University a 24 percent tariff
on all steel imports would be expected to reduce imports by 37 percent (ie a
59
reduction of 133 million metric tons from 2017 levels of 360 million metric tons) 84
This tariff rate would thus result in imports equaling about 227 million metric tons
which will enable an 80 percent capacity utilization rate at 2017 demand levels
(including exports)85
Alternative 2 ndashTariffs on a Subset of Countries
Apply a tariff rate on all imported steel products from Brazil South Korea
Russia Turkey India Vietnam China Thailand South Africa Egypt Malaysia and
Costa Rica in addition to any antidumping or countervailing duty collections
applicable to any steel products from those countries All other countries would be
limited to 100 percent of their 2017 import level
According to the Global Trade Analysis Project (GTAP) Model produced by
Purdue University a 53 percent tariff on all steel imports from this subset of
countries would be expected to reduce imports by 133 million metric tons from 2017
import levels from the targeted countries This action would enable an increase in
domestic production to achieve an 80 percent capacity utilization rate at 2017
demand levels (including exports) The countries identified are projected to account
for less than 4 percent of US steel exports in 2017
Exemptions
In selecting an alternative the President could determine that specific
countries should be exempted from the proposed 63 percent quota or 24 percent tariff
by granting those specific countries 100 percent of their prior imports in 2017 based
on an overriding economic or security interest of the United States The Secretary
recommends that any such determination should be made at the outset and a
corresponding adjustment be made to the final quota or tariff imposed on the
84 Due to general equilibrium effects the overall import level would need to decrease by more than the corresponding increase in domestic production to offset the negative effects of price or exchange rate changes on export demand
85 The elasticity factor is an estimate not a certainty variation of 01 in the elasticity factor would change the tonnage reduction by about 375000 tons For example imports would fall by an additional 375000 tons under a demand elasticity of -17 instead of -16 and a 25 percent tariff
60
remaining countries This would ensure that overall imports of steel to the United
States remain at or below the level needed to enable the domestic steel industry to
operate as a whole at an 80 percent or greater capacity utilization rate The limitation
to 100 percent of each exempted countryrsquos 2017 imports is necessary to prevent
exempted countries from producing additional steel for export to the United States
or encouraging other countries to seek to trans-ship steel to the United States through
the exempted countries
It is possible to provide exemptions from either the quota or tariff and still
meet the necessary objective of increasing US steel capacity utilization to a
financially viable target of 80 percent However to do so would require a reduction
in the quota or increase in the tariff applied to the remaining countries to offset the
effect of the exempted import tonnage
Exclusions
The Secretary recommends an appeal process by which affected US parties
could seek an exclusion from the tariff or quota imposed The Secretary would grant
exclusions based on a demonstrated (1) lack of sufficient US production capacity
of comparable products or (2) specific national security based considerations This
appeal process would include a public comment period on each exclusion request
and in general would be completed within 90 days of a completed application being
filed with the Secretary
An exclusion may be granted for a period to be determined by the Secretary
and may be terminated if the conditions that gave rise to the exclusion change The
US Department of Commerce will lead the appeal process in coordination with the
Department of Defense and other agencies as appropriate Should exclusions be
granted the Secretary would consider at the time whether the quota or tariff for the
remaining products needs to be adjusted to increase US steel capacity utilization to
a financially viable target of 80 percent
61
furnace facilities in United States50 In addition there are idled pipe and tube mills
in Texas Ohio and Alabama Once production is halted at these facilities it is not
always possible to bring back the highly skilled workforce needed to operate them
When steel mill restarts do occur additional costs are often incurred for specialized
worker training and production ramp-up
In addition when a steel mill closes at a given location the workers find other
occupations move to other steel mills or remain indefinitely unemployed After a
significant period of unemployment much of the specialized skill required by steel
mill workers is forgotten Furthermore it is typically not easy to find and recruit
displaced workers who may live hundreds or thousands of miles away
6 Declining Employment Trend Since 1998
US steel industry employment has declined 35 percent (216400 in 1998 to
139800 in January 2016 - December 2016) including 14100 lost jobs between 2015
and 2016 While employment numbers increased slightly in certain years the trend
is dramatically downward (see Figure 7) Layoffs defer formal plant closings but
are an indication of financial distress Layoffs in the last two years have been
particularly acute in steel producers with pipe and tubular facilities In addition to
layoffs there are permanent closures and bankruptcies in the industry 51
The loss of skilled workers is especially detrimental to the long-term health
and competitiveness of the industry The unstable and declining employment
outlook for the industry also dissuades younger workers from wanting to participate
in the future US steel industry The inability to rapidly add skilled workers to the
industry negatively affects current manufacturing capabilities This is especially
problematic in the event of a major production surge or mobilization
Source Bureau of Labor Statistics using the annual average of seasonally adjusted employees NAICS Codes 3311 and 3312 updated 11222017
Figure 7 Combined Steel Industry Employment (Yearly Average)
7 Trade Actions ndash Antidumping and Countervailing Duties
The number of US antidumping and countervailing duty measures in effect
illustrates the scope of the problem confronting the US steel industry In 1998 at
the height of that periods steel crisis there were just over 100 antidumping and
countervailing duty cases against finished steel products52 Today there are 164
antidumping and countervailing duty orders in effect for steel with another 20 steel
investigations currently ongoing and another waiting to take effect through
publication in the Federal Register (see Appendix K for a full listing of Steel
Antidumping and Countervailing Duty Orders in Effect) This represents a 60
percent increase in cases since the last time the Department investigated steel in
2001
8 Loss of Domestic Opportunities to Bidders Using Imported Steel
Despite efforts to level the playing field through ADCVD orders there are
numerous examples of US steel producers being unable to fairly compete with
foreign suppliers including the lack of ability to bid on some critical US
infrastructure projects Due to unfair competition particularly from foreign state-
52 Global Steel Trade Structural Problems and Future Solutions- Department of ommerce- July 2000
36
owned enterprises US steel producers have lost out on US business opportunities
Some examples include Chinese companies providing steel for the eastern span of
the San Francisco-Oakland Bay Bridge as well as the Alexander Hamilton Bridge
over the Harlem River in New York53
The Alliance for American Manufacturingrsquos statement before the
Congressional Steel Caucus (March 2017) identified three other recent infrastructure
projects in New York that have used or will use heavily subsidized or possibly
dumped foreign steel the Verrazano-Narrows Bridge LaGuardia Airport and the
Holland Tunnel Two major US cities ndash Boston and Chicago ndash have contracted
with Chinese companies to build new subway cars primarily constructed with
imported steel for their respective transportation systems54
9 Financial Distress
Rising levels of imports of steel continue to weaken the US steel industryrsquos
financial health Years of running on low-profit margins or at a loss have weakened
an industry that continues to face an ever-increasing wave of steel imports The US
industry as a whole has operated on average with negative net income from 2009-
2016 Net income for US-owned steel companies has averaged only $162 million
annually since 2010 challenging the financial viability of this vital industry (see
Figure 8)
53 New York Times ridge omes to San Francisco With a Made-in-hina Label June 25 2011 httpwwwnytimescom20110626businessglobal26bridgehtml
54 Reuters hinas RR lands $13 billion hina rail car project March 10 2016 httpwwwreuterscomarticleus-crrc-usa-idUSKN0W17I
37
The Stern School of Business at New York University calculates that US steel
industry participants in the last five years experienced negative net income of 178
percent Compounded growth in revenue for the past five years in the steel industry
has been a negative 7 percent55 The loss of revenue has caused US steel
manufacturers both large and small to defer or eliminate production facility capital
investments and funding for research and development Even though there was a
slight uptick in net income for the first quarter in 2017 over the fourth quarter of
2016 margins remain poor compared to historic levels
Not only have earnings before interest taxes depreciation and amortization
(EBITDA) been shallow for steel producers in the United States many of them are
burdened with high levels of debt as much as 119 times of earnings for one major
producer (see Figure 9)56 While some companies are starting to pay down debt
55 Historical (ompounded nnual) Growth Rates by Sector swath Damodaran New York University Stern School
of usiness January 2017 (see httppagessternnyuedu~adamodarNew_Home_Pagedatafile histgrhtml) 56 Nucor operates mini-mills that use electric arc furnaces to produce high demand steel products primarily with recycled steel scrap From a financial perspective this business model allows Nucor to be highly price competitive but the company produces a narrower range of flat steel products than integrated steel mills The
mini-mills can weather bad economic times because they have lower energy costs and can regulate production
38
others have not been able to do so primarily because of slack demand for
domestically produced steel in the face of competition from imported products
Absent increases in steel production volume and pricing one leading law firm
specializing in insolvency White amp Case observes that some steelmakers in the
United States may soon have to renegotiate loan agreements to extend maturities
those that are not able to may have to consider Chapter 11 bankruptcy57
No capital intensive industry can survive with such poor margins over the
longer term The extensive leverage in the industry shown in Figure 9 adds to the
more easily asic oxygen furnace plants have higher fixed operating costs because they directly convert iron ore and other raw materials along with scrap into steel using more energy-intensive processes
57 Losing Strength US Steel Industry nalysis Scott Griesman White ase pril 16 2016 (see httpswwwwhitecasecompublicationsarticlelosing-strength-us-steel-industry-analysis)
39
likelihood of further closures if the present high level of imports continues to force
US steel mills to operate well below profitable capacity utilization rates
10 Capital Expenditures
The ability of US manufacturers of iron and steel products to fund capital
expenditures for new production plants as well as facility modernization and
advanced manufacturing equipment has been limited by falling revenue and reduced
profits As shown in Figure 10 annual capital expenditures for companies making
iron and steel ingot bars rods plate and other semi-finished products wavered from
$57 billion to $51 billion for 2010-2012 before ramping to $71 billion in 2013
Figure 10 Annual Capital Expenditures
Iron Steel and Ferroalloys Steel NAICS Codes 3311 and 3312 Combined
Millions of Current Dollars
Annual Capital Expenditures Survey 2010 2011 2012 2013 2014 2015
A Structures [New amp Used Structures Combined] 1026 1322 1564 1157 724 580
B Equipment [New amp Used Equipment Combined] 4634 4572 3592 5954 3139 2531
C Total Capital Expenditures 5661 5894 5157 7111 3863 3110
D (Unweighted) Payroll of Reporters Total Payroll of Firms Classified in Industry group
86 84 80 61 86 84
Source US Census Bureau Annual Capital Expenditures Survey wwwcensusgovprograms-surveysaceshtml
Confronted with receding orders for products and declines in income in 2013
iron and steel companies operating production facilities in the United States started
curtailing capital investments Total capital spending dropped to $387 billion in
2014 and slid further to $311 billion in 2015 ndash 32 percent below 2010 levels of $566
billion
The decline in capital expenditures reflected similar drops in net sales which
plummeted from $1296 billion in 2014 to $102 billion in 2015 Income after taxes
40
for US iron and steel manufacturers fell from $248 billion in the same two-year
period to a massive loss of $35 billion in 2015
C Displacement of Domestic Steel by Excessive Quantities of Imports has the
Serious Effect of Weakening Our Internal Economy
1 Domestic Steel Production Capacity is Stagnant and Concentrated
According to the OECD US steel production capacity has remained stagnant
at an average of approximately 1143 million metric tons for more than a decade
from 2006-2016 (see Figure 11) For 2016 the rated maximum capacity was 113
million metric tons for existing basic oxygen furnace and electric arc furnace
Source Organization for Economic Cooperation and Development (OECD) 2017 capacity is a forecast
41
42
The present situation with respect to basic oxygen furnace production is
significantly worse than the situation assessed by the Department in the 2001 Report
As shown in Figure 13 below the number of basic oxygen furnace facilities and units
has declined precipitously since 1995 In 2000 there were 105 companies that
produced raw steel at 144 locations59 while today there are only 38 companies
producing steel at 93 locations a 64 percent and 36 percent reduction respectively
Most importantly in 2000 thirteen companies ldquooperated integrated steel mills
with an average of 35 blast furnaces in continuous operation during the yearrdquo60 while
today there are only three companies operating 13 basic oxygen furnaces These are
77 percent and 60 percent reductions respectively As a result today only 26 percent
of domestic steel is produced from raw materials in the United States as compared
to 53 percent in 2000
As noted earlier since 2000 there has been over a 25 percent reduction in the
number of basic oxygen furnaces operating in the United States and 33 percent of
the remaining basic oxygen furnaces are currently idled In the Secretaryrsquos view a
further reduction in basic oxygen furnace capacity which is especially important to
the ability of domestic industry to meet national security needs is inevitable if the
present imports continue or increase
This would be a serious ldquoweakening of our internal
economyrdquo and place the United States in a position where it is unable to be certain
59 2001 Report at 21
60 Id
43
it could meet demands for national defense and critical industries in a national 61emergency
Figure 13 Basic Oxygen and Electric Arc Facilities and Units Located in the United States 1975 - 2016
Year asic Oxygen Furnace Facilities
asic Oxygen Furnace Units
Electric rc Furnace Facilities
Electric rc Furnace Units
1975 38 90 -- --
1980 33 78 -- --
1985 27 66 -- --
1990 24 61 127 246
1995 22 56 116 218
2000 19 50 122 174
2005 17 46 115 169
2010 16 44 108 164
2015 13 31 98 154
2016 13 31 98 154 Source US Department of CommerceBIS American Iron and Steel Institute Association for Iron amp Steel Technology Steel Manufacturers Association August 2017 Estimated
Basic Oxygen Furnace Basic Oxygen Furnaces (BOF) are the dominant steelmaking technology globally accounting for 74 of the worlds total output of crude steel in 2016 OF share of production in the US was 33 in 2016 and has been slowly declining due primarily to the advent of the Greenfield electric arc furnace (EF) flat-rolled mills The primary raw materials for the BOF are liquid hot metal (iron) from the blast furnace and steel scrap [1] These are charged into the BOF vessel Oxygen (gt995 pure) is blown into the OF at supersonic velocities It oxidizes the carbon and silicon contained in the hot metal liberating great quantities of heat which melts the scrap Source Steelorg
Electric Arc Furnace The Electric Arc Furnace (EAF) operates as a batch melting process producing batches of molten steel known heats The EF process uses steel scrap and iron units melting them using electricity to make new steel EF output accounted for 66 of US steel production in 2016 Source Steelorg
[1 The last Furnace chemically reduces and physically converts iron oxides into liquid iron called hot metal The blast furnace is a huge steel stack lined with refractory brick where iron ore coke and limestone are dumped into the top and preheated air is blown into the bottom The raw materials require six to eight hours to descend to the bottom of the furnace where they become the final product of liquid slag and liquid iron Source Steelorg
In contrast to the situation in the United States the leading global producers
of steel (Brazil South Korea Japan Russia Germany and especially China)
primarily rely on basic oxygen furnace capacity rather than electric arc furnace
capacity (see Figure 14) Each of these economic competitors to the United States
possess critical research development and production capabilities that the United
61 See infra sections 4 and 5 for a further discussion of the inability to meet surge requirements in an emergency
44
rsquo
States is in danger of losing if imports continue to force US steel producers to
operate at uneconomic capacity utilization levels
A further reduction in domestic basic oxygen furnace capacity would put the
United States at serious risk of becoming dependent on foreign steel to support its
critical industries and defense needs Allowing this decline to continue represents a
ldquoweakening of our internal economy that may impair national securityrdquo which the
Congress has directed the Secretary to advise the President of under the Section 232
See 19 USC sect 1862(d)
Figure 14 The Top 20 Countries Exporting to the US ndash BOF vs EAF Capacity
Rank Top Import Sources in 2016 in Tonnage
Terms
2015 OF Share
2015 EF Share
2015 Other Share
pprox ountry s verage apacity Utilization in 2016
(OED) World 7420 2520 050 67
1 Canada 5380 4620 62
2 Brazil 7820 2020 57
3 South Korea 6960 3040 80
4 Mexico 2970 7030 75
5 Turkey 3500 6500 65
6 Japan 7710 2290 80
7 Russia 6630 3050 310 76
8 Germany 7040 2960 72 (EU 28)
9 Taiwan 6230 3770 75
10 Vietnam 2500 5990 1520 32
11 China 9390 610 69
12 Netherlands 9860 150 72 (EU 28)
13 Italy 2130 7820 72 (EU 28)
14 United Kingdom 8300 1700 72 (EU 28)
15 France 6560 3440 72 (EU 28)
16 India 4290 5710 75
17 Australia 7760 2240 63
18 Spain 3170 6830 72 (EU 28)
19 Sweden 6610 3390 72 (EU 28)
20 South Africa 5650 4350 585 Source World Steel- Production Share Figures for 2015 US ensus ureau (ccessed Via HIS) ndash Import Growth Rates OED 2017 Q2 Market ssessment ndash pproximate apacity Utilization
This is not a hypothetical situation The Department of Defense already finds
itself without domestic suppliers for some particular types of steel used in defense
45
products including tire rod steel used in military vehicles and trucks62 While the
United States has many allies that produce steel relying on foreign owned facilities
located outside the United States introduces significant risk and potential delay for
the development of new steel technologies and production of needed steel products
particularly in times of emergency The Secretary notes that the authority for the
Department of Defense to place its order ahead of commercial orders on a mandatory
basis does not extend to foreign-owned facilities outside the United States63
In the case of critical infrastructure the United States is down to only one
remaining producer of electrical steel in the United States (AK Steel ndash which is
highly leveraged) Electrical steel is necessary for power distribution transformers
for all types of energy ndash including solar nuclear wind coal and natural gas ndash across
the country If domestic electrical steel production as well as transformer and
generator production is not maintained in the US the US will become entirely
dependent on foreign producers to supply these critical materials and products64
Without an assured domestic supply of these products the United States cannot be
certain that it can effectively respond to large power disruptions affecting civilian
populations critical infrastructure and US defense industrial production
capabilities in a timely manner
2 Production is Well Below Demand
Demand for steel products in the United States (see Figure 15) increased from
1001 million metric tons in 2011 to 1175 million metric tons in 2014 then declined
to 998 million metric tons in 2016 Demand in 2017 is projected to rebound to
1077 million metric tons During the 2011 to 2016 period US production of steel
products dropped from 864 million metric tons in 2011 to 786 million metric tons
in 2016 with a four percent increase expected in 2017
62 Letter from Defense Logistics gency olumbus OH to ISOTE ugust 1 2017
63 See Defense Priorities and llocations System Program (DPS) wwwdcmamilDPS
64 United States ongress ongressional Steel aucus Statement of Roger Newport EO K Steel orporation (on behalf of the merican Iron and Steel Institute) March 29 2017
46
For the six-year period US domestic steel production supplied only 70
percent of the average demand even though available US domestic steel production
capacity during that period could have on average supplied up to 100 percent of
demand (US steel producers would be running at 92 percent capacity utilization for
this period) with approximately 13 million metric tons of additional capacity
remaining
Figure 15 US Steel Market Snapshot (millions of metric tons)
2011 2012 2013 2014 2015 2016 2017 YTD
2017 nnualized
Total Demand for Steel in US (Production + Imports - Exports)
US Annual Production (Liquid) 864 887 869 882 788 786 615 819
Sources United States Department of ommerce ureau of the ensus merican Iron and Steel Institute alculations based on industry and trade data
3 Utilization Rates are Well Below Economically Viable Levels
Overall steel mill production capacity utilization has declined from 87 percent
in 1998 to 814 percent in 2008 to 694 percent in 2016 (see Figure 16) For the
most recent six-year period (2011- 2016) the average utilization rate was 74 percent
Industry analysts note that utilization of 80 percent or more is typically
necessary for sustained profitability among other factors65 For most capital and
energy-intensive US steel producers capacity levels of 80 percent or higher are
required to maintain facilities carry out periodic modernization service company
debt and fund research and development
65 Market Realist Why steel investors are mindful of capacity utilization rates October 2 2014 httpmarketrealistcom201410investors-mindful-capacity-utilization-rate See also httpmarketrealistcom201509upstream-exposure-impact-steel-companies
47
When steel factory utilization falls costs per unit of steel product rises
reducing profit margins and product pricing flexibility Higher capacity utilization
usually results in lower per-unit product costs and higher overall profit66 Over 80
percent is a healthy capacity utilization rate and a rate at which most companies
would be profitable
The US steel industry uses 80 percent as a benchmark for minimum
operational efficiency Moreover the steel industry is capable of reaching and
sustaining 80 percent capacity utilization or higher During the 2002-2008 period
US steel companies operated at an average 874 percent level 67
These industry assessments are consistent with a 1983 report on ldquoCritical
Materials Requirements in the US Steel Industryrdquo in which the Department
66 Houston hronical apacity Utilization and Effects on Product and Profit httpsmallbusinesschroncomcapacity-utilization-effects-product-profit-67046html- steel industry sources
67 httpmarketrealistcom201509upstream-exposure-impact-steel-companieshtml (Its important to note how changes in capacity utilization rates impact a companys earnings For example we see a big jump in earnings when utilization rates improve from 80 percent to 85 percent However incremental benefits are lower when utilization rates increase from 90 percent to 95 percent )
48
explained that ldquo[c]apability utilization or capacity use which in effect describes the
efficiency of an industrys use of capital is a prime determinant of profitability
Domestic steel producers were operating at about 55 percent capability for the first
half of 1982 The comparable rate for the first half of 1981 was 85 percent This
current rate is probably well below a breakeven point for most producers whereas
1981 was profitable for nearly all producersrdquo68
4 Declining Steel Production Facilities Limits Capacity Available for a
National Emergency
The number of steel production facilities located in the US continues to
decline As shown earlier in Figure 13 from 1975 to 2016 the number of basic
oxygen furnace facilities decreased from 38 to 13 Similarly from 1990 to 2016
the number of electric arc furnace facilities decreased from 127 to 98
Due to this decline in facilities domestic steel producers have a shrinking
ability to meet national security production requirements in a national emergency
The US Department of Commerce Census Bureau regularly surveys plant capacity
and has found that steel producers are quickly shedding production capacity that
could be used in a national emergency The Census Bureau defines national
emergency production as the ldquogreatest level of production an establishment can
expect to sustain for one year or more under national emergency conditionsrdquo69 From
2011 to 2017 steel producers increased the utilization of the surge capacity they
would have during a national emergency from 542 percent to 682 percent (see
Figure 17) As steel producers use more of this emergency capacity there is an
increasingly limited ability to ramp up steel production to meet national security
needs during a national emergency
68 Department of ommerce ritical Materials Requirements in the US Steel Industry March 1983 at 16-17
69 US Dept of ommerce ensus ureau Survey of Plant apacity 2011-2017
49
0
10
20
30
40
50
60
70
80
2011 2012 2013 2014 2015 2016 2017
Figure 17 Steel Industry Utilization of Emergency Capacity (2011-2017 Quarter 1)
Source US Department of ommerce ensus ureau Survey of Plant apacity
Percent
The ability to increase steel production during a national emergency
continues to diminish as the number of steel production facilities continues to
decline If the US requires a similar increase in steel production as it did during
previous national emergencies domestic steel production capacity may be
insufficient to satisfy national security needs If a national emergency were to
occur at present utilization levels domestic steel producers would be able to
increase production by 146 percent
For comparison from 1938 through 1946 the US increased the production
of pig iron and ferro-alloys by 217 percent and increased the production of steel
ingots and castings by 210 percent to meet the demands of fighting a global war 70
From 1960 through 1973 during the Vietnam era the US increased steel
production by 152 percent 71 Should the US once again experience a conflict on
the scale of the Vietnam War steel production capacity may be slightly insufficient
70 US Dept of ommerce ensus ureau Statistical bstract of the United States 1948 Page 876
71 US Dept of ommerce ensus ureau Statistical bstract of the United States 1978 Page 830
50
to meet national security needs But if the US were to experience a conflict
requiring the production increase seen during the Second World War the existing
domestic steel production capacity would be unable to meet national security
requirements
Increasing steel production capacity once a large-scale national emergency
has arisen would take a significant amount of time According to the American Iron
and Steel Institute the replacement of a basic oxygen furnace facility takes more
than a year to complete Therefore the lack of spare domestic steel production
capacity and the possible inability to sufficiently increase production during a
national emergency may impair the national security of the United States
D Global Excess Steel Capacity is a Circumstance that Contributes to the
Weakening of the Domestic Economy
1 Free markets globally are adversely affected by substantial chronic
global excess steel production led by China
Numerous studies reports and investigations have documented the global excess
steel capacity with China having the largest installed capability (see Figure
18)727374 OECD analyses show that the worldrsquos nominal crude steelmaking capacity
reached about 24 billion metric tons in 2016 an increase of 127 percent compared
to the 2000 level Most of the capacity expansion was planned for construction and
manufacturing activities and to help build the infrastructure necessary for economic
development ndash most in non-OECD countries Furthermore the OECD reports that
while steel capacity increased at a steady rate world steel demand contracted sharply
in the aftermath of the global economic and financial crisis of 2008 Global demand
for steel recovered slowly in the years following 2008 However since 2013 global
steel demand has flattened thereby widening the capacitydemand gap By 2015 the
gap reached over 700 million metric tons
72 run L (2016) Overcapacity in Steel Chinarsquos Role in a Global Problem Washington D lliance for merican Manufacturing httpaamwebs3amazonawscomuploadsresourcesOvercapacityReport2016_R3pdf
73 Price Weld El-Sabaawi L Teslik (2016) apacity Runs Riot Washington D Wiley Rein LLP
74 OED Reports (2016) httpwwwoecdorgindustryind82nd-session-of-the-steel-committeehtm
51
The vast size of the capacitydemand gap means that steel demand alone
cannot increase enough to balance the global overcapacity problem which is
particularly prevalent in China Chinese excess capacity estimated at more than 300
million metric tons dwarfs total US production capacity (see Figure 19)75
The effect of global overcapacity and excess steel production on US steel
prices and import levels is discussed in greater detail in Appendix L While US
steel production capacity has remained flat since 2001 other steel producing nations
have increased their production capacity with China alone able to produce as much
steel as the rest of the world combined
75 OED High Level Meeting Excess apacity and Structural djustment in the Steel Sector pril 2016 httpwwwoecdorgstiindackground20document20No202_FINL_Meetingpdf
52
0
500
1000
1500
2000
2500 M
illio
ns
of
Met
ric
Ton
s
Figure 19 Steelmaking Capacity
World Total China United States
Source OECD
2009 2010 2011 2012 2013 2014 2015 2016 2017
Several countries (India Iran and Indonesia) in addition to China continue to
add production capacity despite slack global demand According to the OECD Steel
Committee Chairrsquos statement from March 2017 ldquoNew data suggest that nearly 40
million metric tons of gross capacity additions are currently underway and could
come on stream during the three-year period of 2017-19 while an additional 536
million metric tons of capacity additions are in the planning stages for possible start-
up during the same time periodrdquo76 This additional global steel capacity coming
online represents over 80 percent of existing US steelmaking production capacity
demonstrating that the import challenge to US industry is continuing to grow
2 Increasing global excess steel capacity will further weaken the internal
economy as US steel producers will face increasing import competition
These additions to worldwide steelmaking capacity will only exacerbate the
situation because they will further lower global operating utilization rates including
in the United States Growth in foreign government-subsidized steel production is
progressively weakening the financial health of the US steel industry as other steel
76 OED 82nd Session of the OED Steel ommittee ndash hairs Statement March 2017 httpwwwoecdorgstiind82-oecd-steel-chair-statementhtm
53
producing countries export more steel to the US to in part to offset the loss of
regional markets to Chinese steel (see Appendix L)
The US share of global production continues to steadily decline In the year
2000 when President Clinton signed into a law a statute granting China permanent
normal trade relations status77 the US share of global steel production stood at 12
percent78 Since that point in time the US share of global steel production continued
an inexorable decline as other countries and especially China began to increase
production The US share of global steel production fell to 8 percent in 200579 5
percent in 200980 and 48 percent in 201581 In contrast China commanded a 497
percent share of global steel production in 201582
If even half of the planned additional global capacity identified by the OECD
Steel Committee is built and the related new production finds its way into the US
it will drive the operating rate of US steel mills to less than 50 percent of capacity
This will cause a substantial and unsustainable negative cash situation that will
ultimately result in multiple corporate bankruptcies due to heavy debt loads and
related declines in steel production capacity and employment levels
77 Public Law 106-286 n act to authorize extension of nondiscriminatory treatment (normal trade relations treatment) to the Peoples Republic of hina and to establish a framework for relations between the United States and the Peoples Republic of hina October 10 2000 httpswwwgpogovfdsyspkgPLW-106publ286
78 US Dept of ommerce ensus ureau Statistical bstract of the United States 2012 Page 574
79 Id
80 Id
81 Steel Statistical Yearbook 2016 World Steel ssociation httpswwwworldsteelorgendamjcr37ad1117-fefc-4df3-b84f-6295478ae460Steel+Statistical+Yearbook+2016pdf
82 Steel Statistical Yearbook 2017 World Steel ssociation httpswwwworldsteelorgendamjcr3e275c73-6f11-4e7f-a5d8-23d9bc5c508fSteel+Statistical+Yearbook+2017pdf
54
VI CONCLUSION
The Secretary has determined that the displacement of domestic steel by
excessive imports and the consequent adverse impact of those quantities of steel
imports on the economic welfare of the domestic steel industry along with the
circumstance of global excess capacity in steel are ldquoweakening our internal
economyrdquo and therefore ldquothreaten to impairrdquo the national security as defined in
Section 232
The continued rising levels of imports of foreign steel threaten to impair the
national security by placing the US steel industry at substantial risk of displacing
the basic oxygen furnace and other steelmaking capacity and the related supply
chain needed to produce steel for critical infrastructure and national defense
In considering ldquothe impact of foreign competition on the economic welfare of
individual domestic [steel] industriesrdquo and other factors Congress expressly outlined
in Section 232 the Secretary has determined that the continued decline and
concentration in steel production capacity is ldquoweakening of our internal economy
and may impair national securityrdquo See 19 USC sect 1862(d)
Global excess steel capacity is a circumstance that contributes to the
ldquoweakening of our internal economyrdquo that ldquothreaten[s] to impairrdquo the national
security as defined in Section 232 Free markets globally are adversely affected by
substantial chronic global excess steel production led by China While US steel
production capacity has remained flat since 2001 other steel producing nations have
increased their production capacity with China alone able to produce as much steel
as the rest of the world combined This overhang of excess capacity means that US
steel producers for the foreseeable future will face increasing competition from
imported steel as other countries export more steel to the United States to bolster
their own economic objectives
Since defense and critical infrastructure requirements alone are not sufficient
to support a robust steel industry US steel producers must be financially viable and
competitive in the commercial market to be available to produce the needed steel
output in a timely and cost efficient manner In fact it is the ability to quickly shift
55
production capacity used for commercial products to defense and critical
infrastructure production that provides the United States a surge capability that is
vital to national security especially in an unexpected or extended conflict or national
emergency It is that capability which is now at serious risk as imports continue to
take business away from domestic producers these producers are in danger of falling
below minimum viable scale and are at risk of having to exit the market and
substantially close down production capacity often permanently
Steel producers in the United States are facing widespread harm from
mounting imports Growing global steel capacity flat or declining world demand
the openness of the US steel market and the price differential between US market
prices and global market prices (often caused by foreign government steel
intervention) ensures that the US will remain an attractive market for foreign steel
absent quotas or tariffs Excessive imports of steel now consistently above 30
percent of domestic demand have displaced domestic steel production the related
skilled workforce and threaten the ability of this critical industry to maintain
economic viability
A US steel industry that is not financially viable to invest in the latest
technologies facilities and long-term research and development nor retain skilled
workers while attracting a next-generation workforce will be unable to meet the
current and projected needs of the US military and critical infrastructure sectors
Moreover the market environment for US steel producers has deteriorated
dramatically since the 2001 Report when the Department concluded that imports of
iron ore and semi-finished steel do not ldquofundamentally threatenrdquo the ability of US
industry to meet national security needs83
The Departmentrsquos investigation indicates that the domestic steel industry has
declined to a point where further closures and consolidation of basic oxygen furnace
facilities represents a ldquoweakening of our internal economyrdquo as defined in Section
232 The more than 50 percent reduction in the number of basic oxygen furnace
83 2001 Report at 28 ndash 37 s noted supra note 16 the 2001 Report added the qualifier fundamentally which is not found in the statutory text The Secretary in this report uses the statutory standard of threatens to impair without such qualification
56
facilities ndash either through closures or idling of facilities due to import competition ndash
increases the chance of further closures that place the United States at serious risk
of being unable to increase production to the levels needed in past national
emergencies The displacement of domestic product by excessive imports is having
the serious effect of causing the domestic industry to operate at unsustainable levels
reducing employment diminishing research and development inhibiting capital
expenditures and causing a loss of vital skills and know-how The present capacity
operating rates for those remaining plants continue to be below those needed for
financial sustainability These conditions have been further exacerbated by the 22
percent surge in imports thus far in 2017 compared with 2016 Imports are now
consistently above 30 percent of US domestic demand
It is evident that the US steel industry is being substantially impacted by the
current levels of imported steel The displacement of domestic steel by imports has
the serious effect of placing the United States at risk of being unable meet national
security requirements The Secretary has determined that the ldquodisplacement of
domestic [steel] products by excessive importsrdquo of steel is having the ldquoserious effectrdquo
of causing the ldquoweakening of our internal economyrdquo See 19 USC sect 1862(d)
Therefore the Secretary recommends that the President take corrective action
pursuant to the authority granted by Section 232 See 19 USC sect 1862(c)
57
VII RECOMMENDATION
Prior significant actions to address steel imports (quotas andor tariffs) were
taken under various statutory authorities by President George W Bush President
William J Clinton (three times) President George H W Bush President Ronald W
Reagan (three times) President James E Carter (twice) and President Richard M
Nixon all at lower levels of import penetration than the present level which is above
30 percent
Due to the threat of steel imports to the national security as defined in Section
232 the Secretary recommends that the President take immediate action by adjusting
the level of imports through quotas or tariffs on steel imported into the United States
as well as direct additional actions to keep the US steel industry financially viable
and able to meet US national security needs The quota or tariff imposed should be
sufficient after accounting for any exclusions to enable the US steel producers to
be able to operate at about an 80 percent or better of the industryrsquos capacity
utilization rate based on available capacity in 2017
In 2016 US steel production was 786 million metric tons and US capacity
was 1133 million metric tons which represents a 694 percent capacity utilization
rate If current import trends for 2017 continue continued imports without any
action are projected to be 360 million metric tons an increase over 2016 of 60
million metric tons Even with US demand projected to increase to 1073 from
998 million metric tons increased imports mean US capacity utilization is forecast
to rise only to 723 percent a non-financially viable and unsustainable level of
operation
By reducing import penetration rates to approximately 21 percent US
industry would be able to operate at 80 percent of their capacity utilization
Achieving this level of capacity utilization based on the projected 2017 import levels
will require reducing imports from 36 million metric tons to about 23 million metric
tons If a reduction in imports can be combined with an increase in domestic steel
demand as can be reasonably expected rising economic growth rates combined with
the increased military spending and infrastructure proposals that the Trump
Administration has planned then US steel mills can be expected to reach a capacity
58
utilization level of 80 percent or greater This increase in US capacity utilization
will enable US steel mills to increase operations significantly in the short-term and
improve the financial viability of the industry over the long-term
Recommendation to Ensure Sustainable Capacity Utilization and
Financial Health
Impose a Quota or Tariff on all steel products covered in this investigation
imported into the United States to remove the threatened impairment to
national security The Secretary recommends adjusting the level of imports through
a quota or tariff on steel imported into the United States
Alternative 1 ndash Global Quota or Tariff
1A Global Quota
Impose quotas on all imported steel products at a specified percent of the 2017
import level applied on a country and steel product basis
According to the Global Trade Analysis Project (GTAP) Model produced by
Purdue University a 63 percent quota would be expected to reduce steel imports by
37 percent (133 million metric tons) from 2017 levels Based on imports from
January to October import levels for 2017 are projected to reach 360 million metric
tons The quotas adjusted as necessary would result in imports equaling about 227
million metric tons which will enable an 80 percent capacity utilization rate at 2017
demand levels (including exports) Application of an annual quota will reduce the
impact of the surge in steel imports that has occurred since the beginning of 2017
1B Global Tariff
Apply a tariff rate on all imported steel products in addition to any
antidumping or countervailing duty collections applicable to any imported steel
product
Similar to what is anticipated under a quota according to the Global Trade
Analysis Project (GTAP) Model produced by Purdue University a 24 percent tariff
on all steel imports would be expected to reduce imports by 37 percent (ie a
59
reduction of 133 million metric tons from 2017 levels of 360 million metric tons) 84
This tariff rate would thus result in imports equaling about 227 million metric tons
which will enable an 80 percent capacity utilization rate at 2017 demand levels
(including exports)85
Alternative 2 ndashTariffs on a Subset of Countries
Apply a tariff rate on all imported steel products from Brazil South Korea
Russia Turkey India Vietnam China Thailand South Africa Egypt Malaysia and
Costa Rica in addition to any antidumping or countervailing duty collections
applicable to any steel products from those countries All other countries would be
limited to 100 percent of their 2017 import level
According to the Global Trade Analysis Project (GTAP) Model produced by
Purdue University a 53 percent tariff on all steel imports from this subset of
countries would be expected to reduce imports by 133 million metric tons from 2017
import levels from the targeted countries This action would enable an increase in
domestic production to achieve an 80 percent capacity utilization rate at 2017
demand levels (including exports) The countries identified are projected to account
for less than 4 percent of US steel exports in 2017
Exemptions
In selecting an alternative the President could determine that specific
countries should be exempted from the proposed 63 percent quota or 24 percent tariff
by granting those specific countries 100 percent of their prior imports in 2017 based
on an overriding economic or security interest of the United States The Secretary
recommends that any such determination should be made at the outset and a
corresponding adjustment be made to the final quota or tariff imposed on the
84 Due to general equilibrium effects the overall import level would need to decrease by more than the corresponding increase in domestic production to offset the negative effects of price or exchange rate changes on export demand
85 The elasticity factor is an estimate not a certainty variation of 01 in the elasticity factor would change the tonnage reduction by about 375000 tons For example imports would fall by an additional 375000 tons under a demand elasticity of -17 instead of -16 and a 25 percent tariff
60
remaining countries This would ensure that overall imports of steel to the United
States remain at or below the level needed to enable the domestic steel industry to
operate as a whole at an 80 percent or greater capacity utilization rate The limitation
to 100 percent of each exempted countryrsquos 2017 imports is necessary to prevent
exempted countries from producing additional steel for export to the United States
or encouraging other countries to seek to trans-ship steel to the United States through
the exempted countries
It is possible to provide exemptions from either the quota or tariff and still
meet the necessary objective of increasing US steel capacity utilization to a
financially viable target of 80 percent However to do so would require a reduction
in the quota or increase in the tariff applied to the remaining countries to offset the
effect of the exempted import tonnage
Exclusions
The Secretary recommends an appeal process by which affected US parties
could seek an exclusion from the tariff or quota imposed The Secretary would grant
exclusions based on a demonstrated (1) lack of sufficient US production capacity
of comparable products or (2) specific national security based considerations This
appeal process would include a public comment period on each exclusion request
and in general would be completed within 90 days of a completed application being
filed with the Secretary
An exclusion may be granted for a period to be determined by the Secretary
and may be terminated if the conditions that gave rise to the exclusion change The
US Department of Commerce will lead the appeal process in coordination with the
Department of Defense and other agencies as appropriate Should exclusions be
granted the Secretary would consider at the time whether the quota or tariff for the
remaining products needs to be adjusted to increase US steel capacity utilization to
a financially viable target of 80 percent
61
0
10
20
30
40
50
60
70
80
2011 2012 2013 2014 2015 2016 2017
Figure 17 Steel Industry Utilization of Emergency Capacity (2011-2017 Quarter 1)
Source US Department of ommerce ensus ureau Survey of Plant apacity
Percent
The ability to increase steel production during a national emergency
continues to diminish as the number of steel production facilities continues to
decline If the US requires a similar increase in steel production as it did during
previous national emergencies domestic steel production capacity may be
insufficient to satisfy national security needs If a national emergency were to
occur at present utilization levels domestic steel producers would be able to
increase production by 146 percent
For comparison from 1938 through 1946 the US increased the production
of pig iron and ferro-alloys by 217 percent and increased the production of steel
ingots and castings by 210 percent to meet the demands of fighting a global war 70
From 1960 through 1973 during the Vietnam era the US increased steel
production by 152 percent 71 Should the US once again experience a conflict on
the scale of the Vietnam War steel production capacity may be slightly insufficient
70 US Dept of ommerce ensus ureau Statistical bstract of the United States 1948 Page 876
71 US Dept of ommerce ensus ureau Statistical bstract of the United States 1978 Page 830
50
to meet national security needs But if the US were to experience a conflict
requiring the production increase seen during the Second World War the existing
domestic steel production capacity would be unable to meet national security
requirements
Increasing steel production capacity once a large-scale national emergency
has arisen would take a significant amount of time According to the American Iron
and Steel Institute the replacement of a basic oxygen furnace facility takes more
than a year to complete Therefore the lack of spare domestic steel production
capacity and the possible inability to sufficiently increase production during a
national emergency may impair the national security of the United States
D Global Excess Steel Capacity is a Circumstance that Contributes to the
Weakening of the Domestic Economy
1 Free markets globally are adversely affected by substantial chronic
global excess steel production led by China
Numerous studies reports and investigations have documented the global excess
steel capacity with China having the largest installed capability (see Figure
18)727374 OECD analyses show that the worldrsquos nominal crude steelmaking capacity
reached about 24 billion metric tons in 2016 an increase of 127 percent compared
to the 2000 level Most of the capacity expansion was planned for construction and
manufacturing activities and to help build the infrastructure necessary for economic
development ndash most in non-OECD countries Furthermore the OECD reports that
while steel capacity increased at a steady rate world steel demand contracted sharply
in the aftermath of the global economic and financial crisis of 2008 Global demand
for steel recovered slowly in the years following 2008 However since 2013 global
steel demand has flattened thereby widening the capacitydemand gap By 2015 the
gap reached over 700 million metric tons
72 run L (2016) Overcapacity in Steel Chinarsquos Role in a Global Problem Washington D lliance for merican Manufacturing httpaamwebs3amazonawscomuploadsresourcesOvercapacityReport2016_R3pdf
73 Price Weld El-Sabaawi L Teslik (2016) apacity Runs Riot Washington D Wiley Rein LLP
74 OED Reports (2016) httpwwwoecdorgindustryind82nd-session-of-the-steel-committeehtm
51
The vast size of the capacitydemand gap means that steel demand alone
cannot increase enough to balance the global overcapacity problem which is
particularly prevalent in China Chinese excess capacity estimated at more than 300
million metric tons dwarfs total US production capacity (see Figure 19)75
The effect of global overcapacity and excess steel production on US steel
prices and import levels is discussed in greater detail in Appendix L While US
steel production capacity has remained flat since 2001 other steel producing nations
have increased their production capacity with China alone able to produce as much
steel as the rest of the world combined
75 OED High Level Meeting Excess apacity and Structural djustment in the Steel Sector pril 2016 httpwwwoecdorgstiindackground20document20No202_FINL_Meetingpdf
52
0
500
1000
1500
2000
2500 M
illio
ns
of
Met
ric
Ton
s
Figure 19 Steelmaking Capacity
World Total China United States
Source OECD
2009 2010 2011 2012 2013 2014 2015 2016 2017
Several countries (India Iran and Indonesia) in addition to China continue to
add production capacity despite slack global demand According to the OECD Steel
Committee Chairrsquos statement from March 2017 ldquoNew data suggest that nearly 40
million metric tons of gross capacity additions are currently underway and could
come on stream during the three-year period of 2017-19 while an additional 536
million metric tons of capacity additions are in the planning stages for possible start-
up during the same time periodrdquo76 This additional global steel capacity coming
online represents over 80 percent of existing US steelmaking production capacity
demonstrating that the import challenge to US industry is continuing to grow
2 Increasing global excess steel capacity will further weaken the internal
economy as US steel producers will face increasing import competition
These additions to worldwide steelmaking capacity will only exacerbate the
situation because they will further lower global operating utilization rates including
in the United States Growth in foreign government-subsidized steel production is
progressively weakening the financial health of the US steel industry as other steel
76 OED 82nd Session of the OED Steel ommittee ndash hairs Statement March 2017 httpwwwoecdorgstiind82-oecd-steel-chair-statementhtm
53
producing countries export more steel to the US to in part to offset the loss of
regional markets to Chinese steel (see Appendix L)
The US share of global production continues to steadily decline In the year
2000 when President Clinton signed into a law a statute granting China permanent
normal trade relations status77 the US share of global steel production stood at 12
percent78 Since that point in time the US share of global steel production continued
an inexorable decline as other countries and especially China began to increase
production The US share of global steel production fell to 8 percent in 200579 5
percent in 200980 and 48 percent in 201581 In contrast China commanded a 497
percent share of global steel production in 201582
If even half of the planned additional global capacity identified by the OECD
Steel Committee is built and the related new production finds its way into the US
it will drive the operating rate of US steel mills to less than 50 percent of capacity
This will cause a substantial and unsustainable negative cash situation that will
ultimately result in multiple corporate bankruptcies due to heavy debt loads and
related declines in steel production capacity and employment levels
77 Public Law 106-286 n act to authorize extension of nondiscriminatory treatment (normal trade relations treatment) to the Peoples Republic of hina and to establish a framework for relations between the United States and the Peoples Republic of hina October 10 2000 httpswwwgpogovfdsyspkgPLW-106publ286
78 US Dept of ommerce ensus ureau Statistical bstract of the United States 2012 Page 574
79 Id
80 Id
81 Steel Statistical Yearbook 2016 World Steel ssociation httpswwwworldsteelorgendamjcr37ad1117-fefc-4df3-b84f-6295478ae460Steel+Statistical+Yearbook+2016pdf
82 Steel Statistical Yearbook 2017 World Steel ssociation httpswwwworldsteelorgendamjcr3e275c73-6f11-4e7f-a5d8-23d9bc5c508fSteel+Statistical+Yearbook+2017pdf
54
VI CONCLUSION
The Secretary has determined that the displacement of domestic steel by
excessive imports and the consequent adverse impact of those quantities of steel
imports on the economic welfare of the domestic steel industry along with the
circumstance of global excess capacity in steel are ldquoweakening our internal
economyrdquo and therefore ldquothreaten to impairrdquo the national security as defined in
Section 232
The continued rising levels of imports of foreign steel threaten to impair the
national security by placing the US steel industry at substantial risk of displacing
the basic oxygen furnace and other steelmaking capacity and the related supply
chain needed to produce steel for critical infrastructure and national defense
In considering ldquothe impact of foreign competition on the economic welfare of
individual domestic [steel] industriesrdquo and other factors Congress expressly outlined
in Section 232 the Secretary has determined that the continued decline and
concentration in steel production capacity is ldquoweakening of our internal economy
and may impair national securityrdquo See 19 USC sect 1862(d)
Global excess steel capacity is a circumstance that contributes to the
ldquoweakening of our internal economyrdquo that ldquothreaten[s] to impairrdquo the national
security as defined in Section 232 Free markets globally are adversely affected by
substantial chronic global excess steel production led by China While US steel
production capacity has remained flat since 2001 other steel producing nations have
increased their production capacity with China alone able to produce as much steel
as the rest of the world combined This overhang of excess capacity means that US
steel producers for the foreseeable future will face increasing competition from
imported steel as other countries export more steel to the United States to bolster
their own economic objectives
Since defense and critical infrastructure requirements alone are not sufficient
to support a robust steel industry US steel producers must be financially viable and
competitive in the commercial market to be available to produce the needed steel
output in a timely and cost efficient manner In fact it is the ability to quickly shift
55
production capacity used for commercial products to defense and critical
infrastructure production that provides the United States a surge capability that is
vital to national security especially in an unexpected or extended conflict or national
emergency It is that capability which is now at serious risk as imports continue to
take business away from domestic producers these producers are in danger of falling
below minimum viable scale and are at risk of having to exit the market and
substantially close down production capacity often permanently
Steel producers in the United States are facing widespread harm from
mounting imports Growing global steel capacity flat or declining world demand
the openness of the US steel market and the price differential between US market
prices and global market prices (often caused by foreign government steel
intervention) ensures that the US will remain an attractive market for foreign steel
absent quotas or tariffs Excessive imports of steel now consistently above 30
percent of domestic demand have displaced domestic steel production the related
skilled workforce and threaten the ability of this critical industry to maintain
economic viability
A US steel industry that is not financially viable to invest in the latest
technologies facilities and long-term research and development nor retain skilled
workers while attracting a next-generation workforce will be unable to meet the
current and projected needs of the US military and critical infrastructure sectors
Moreover the market environment for US steel producers has deteriorated
dramatically since the 2001 Report when the Department concluded that imports of
iron ore and semi-finished steel do not ldquofundamentally threatenrdquo the ability of US
industry to meet national security needs83
The Departmentrsquos investigation indicates that the domestic steel industry has
declined to a point where further closures and consolidation of basic oxygen furnace
facilities represents a ldquoweakening of our internal economyrdquo as defined in Section
232 The more than 50 percent reduction in the number of basic oxygen furnace
83 2001 Report at 28 ndash 37 s noted supra note 16 the 2001 Report added the qualifier fundamentally which is not found in the statutory text The Secretary in this report uses the statutory standard of threatens to impair without such qualification
56
facilities ndash either through closures or idling of facilities due to import competition ndash
increases the chance of further closures that place the United States at serious risk
of being unable to increase production to the levels needed in past national
emergencies The displacement of domestic product by excessive imports is having
the serious effect of causing the domestic industry to operate at unsustainable levels
reducing employment diminishing research and development inhibiting capital
expenditures and causing a loss of vital skills and know-how The present capacity
operating rates for those remaining plants continue to be below those needed for
financial sustainability These conditions have been further exacerbated by the 22
percent surge in imports thus far in 2017 compared with 2016 Imports are now
consistently above 30 percent of US domestic demand
It is evident that the US steel industry is being substantially impacted by the
current levels of imported steel The displacement of domestic steel by imports has
the serious effect of placing the United States at risk of being unable meet national
security requirements The Secretary has determined that the ldquodisplacement of
domestic [steel] products by excessive importsrdquo of steel is having the ldquoserious effectrdquo
of causing the ldquoweakening of our internal economyrdquo See 19 USC sect 1862(d)
Therefore the Secretary recommends that the President take corrective action
pursuant to the authority granted by Section 232 See 19 USC sect 1862(c)
57
VII RECOMMENDATION
Prior significant actions to address steel imports (quotas andor tariffs) were
taken under various statutory authorities by President George W Bush President
William J Clinton (three times) President George H W Bush President Ronald W
Reagan (three times) President James E Carter (twice) and President Richard M
Nixon all at lower levels of import penetration than the present level which is above
30 percent
Due to the threat of steel imports to the national security as defined in Section
232 the Secretary recommends that the President take immediate action by adjusting
the level of imports through quotas or tariffs on steel imported into the United States
as well as direct additional actions to keep the US steel industry financially viable
and able to meet US national security needs The quota or tariff imposed should be
sufficient after accounting for any exclusions to enable the US steel producers to
be able to operate at about an 80 percent or better of the industryrsquos capacity
utilization rate based on available capacity in 2017
In 2016 US steel production was 786 million metric tons and US capacity
was 1133 million metric tons which represents a 694 percent capacity utilization
rate If current import trends for 2017 continue continued imports without any
action are projected to be 360 million metric tons an increase over 2016 of 60
million metric tons Even with US demand projected to increase to 1073 from
998 million metric tons increased imports mean US capacity utilization is forecast
to rise only to 723 percent a non-financially viable and unsustainable level of
operation
By reducing import penetration rates to approximately 21 percent US
industry would be able to operate at 80 percent of their capacity utilization
Achieving this level of capacity utilization based on the projected 2017 import levels
will require reducing imports from 36 million metric tons to about 23 million metric
tons If a reduction in imports can be combined with an increase in domestic steel
demand as can be reasonably expected rising economic growth rates combined with
the increased military spending and infrastructure proposals that the Trump
Administration has planned then US steel mills can be expected to reach a capacity
58
utilization level of 80 percent or greater This increase in US capacity utilization
will enable US steel mills to increase operations significantly in the short-term and
improve the financial viability of the industry over the long-term
Recommendation to Ensure Sustainable Capacity Utilization and
Financial Health
Impose a Quota or Tariff on all steel products covered in this investigation
imported into the United States to remove the threatened impairment to
national security The Secretary recommends adjusting the level of imports through
a quota or tariff on steel imported into the United States
Alternative 1 ndash Global Quota or Tariff
1A Global Quota
Impose quotas on all imported steel products at a specified percent of the 2017
import level applied on a country and steel product basis
According to the Global Trade Analysis Project (GTAP) Model produced by
Purdue University a 63 percent quota would be expected to reduce steel imports by
37 percent (133 million metric tons) from 2017 levels Based on imports from
January to October import levels for 2017 are projected to reach 360 million metric
tons The quotas adjusted as necessary would result in imports equaling about 227
million metric tons which will enable an 80 percent capacity utilization rate at 2017
demand levels (including exports) Application of an annual quota will reduce the
impact of the surge in steel imports that has occurred since the beginning of 2017
1B Global Tariff
Apply a tariff rate on all imported steel products in addition to any
antidumping or countervailing duty collections applicable to any imported steel
product
Similar to what is anticipated under a quota according to the Global Trade
Analysis Project (GTAP) Model produced by Purdue University a 24 percent tariff
on all steel imports would be expected to reduce imports by 37 percent (ie a
59
reduction of 133 million metric tons from 2017 levels of 360 million metric tons) 84
This tariff rate would thus result in imports equaling about 227 million metric tons
which will enable an 80 percent capacity utilization rate at 2017 demand levels
(including exports)85
Alternative 2 ndashTariffs on a Subset of Countries
Apply a tariff rate on all imported steel products from Brazil South Korea
Russia Turkey India Vietnam China Thailand South Africa Egypt Malaysia and
Costa Rica in addition to any antidumping or countervailing duty collections
applicable to any steel products from those countries All other countries would be
limited to 100 percent of their 2017 import level
According to the Global Trade Analysis Project (GTAP) Model produced by
Purdue University a 53 percent tariff on all steel imports from this subset of
countries would be expected to reduce imports by 133 million metric tons from 2017
import levels from the targeted countries This action would enable an increase in
domestic production to achieve an 80 percent capacity utilization rate at 2017
demand levels (including exports) The countries identified are projected to account
for less than 4 percent of US steel exports in 2017
Exemptions
In selecting an alternative the President could determine that specific
countries should be exempted from the proposed 63 percent quota or 24 percent tariff
by granting those specific countries 100 percent of their prior imports in 2017 based
on an overriding economic or security interest of the United States The Secretary
recommends that any such determination should be made at the outset and a
corresponding adjustment be made to the final quota or tariff imposed on the
84 Due to general equilibrium effects the overall import level would need to decrease by more than the corresponding increase in domestic production to offset the negative effects of price or exchange rate changes on export demand
85 The elasticity factor is an estimate not a certainty variation of 01 in the elasticity factor would change the tonnage reduction by about 375000 tons For example imports would fall by an additional 375000 tons under a demand elasticity of -17 instead of -16 and a 25 percent tariff
60
remaining countries This would ensure that overall imports of steel to the United
States remain at or below the level needed to enable the domestic steel industry to
operate as a whole at an 80 percent or greater capacity utilization rate The limitation
to 100 percent of each exempted countryrsquos 2017 imports is necessary to prevent
exempted countries from producing additional steel for export to the United States
or encouraging other countries to seek to trans-ship steel to the United States through
the exempted countries
It is possible to provide exemptions from either the quota or tariff and still
meet the necessary objective of increasing US steel capacity utilization to a
financially viable target of 80 percent However to do so would require a reduction
in the quota or increase in the tariff applied to the remaining countries to offset the
effect of the exempted import tonnage
Exclusions
The Secretary recommends an appeal process by which affected US parties
could seek an exclusion from the tariff or quota imposed The Secretary would grant
exclusions based on a demonstrated (1) lack of sufficient US production capacity
of comparable products or (2) specific national security based considerations This
appeal process would include a public comment period on each exclusion request
and in general would be completed within 90 days of a completed application being
filed with the Secretary
An exclusion may be granted for a period to be determined by the Secretary
and may be terminated if the conditions that gave rise to the exclusion change The
US Department of Commerce will lead the appeal process in coordination with the
Department of Defense and other agencies as appropriate Should exclusions be
granted the Secretary would consider at the time whether the quota or tariff for the
remaining products needs to be adjusted to increase US steel capacity utilization to
a financially viable target of 80 percent
61
remaining countries This would ensure that overall imports of steel to the United
States remain at or below the level needed to enable the domestic steel industry to
operate as a whole at an 80 percent or greater capacity utilization rate The limitation
to 100 percent of each exempted countryrsquos 2017 imports is necessary to prevent
exempted countries from producing additional steel for export to the United States
or encouraging other countries to seek to trans-ship steel to the United States through
the exempted countries
It is possible to provide exemptions from either the quota or tariff and still
meet the necessary objective of increasing US steel capacity utilization to a
financially viable target of 80 percent However to do so would require a reduction
in the quota or increase in the tariff applied to the remaining countries to offset the
effect of the exempted import tonnage
Exclusions
The Secretary recommends an appeal process by which affected US parties
could seek an exclusion from the tariff or quota imposed The Secretary would grant
exclusions based on a demonstrated (1) lack of sufficient US production capacity
of comparable products or (2) specific national security based considerations This
appeal process would include a public comment period on each exclusion request
and in general would be completed within 90 days of a completed application being
filed with the Secretary
An exclusion may be granted for a period to be determined by the Secretary
and may be terminated if the conditions that gave rise to the exclusion change The
US Department of Commerce will lead the appeal process in coordination with the
Department of Defense and other agencies as appropriate Should exclusions be
granted the Secretary would consider at the time whether the quota or tariff for the
remaining products needs to be adjusted to increase US steel capacity utilization to