28
The European dimension to the situation of immigrants in the labor market Martin Kahanec DPP, CEU Budapest June 27, 2011
| Date post: | 01-Jan-2016 |
| Category: |
Documents |
| Upload: | allegra-obrien |
| View: | 30 times |
| Download: | 1 times |

The European dimension to the situation of immigrants in the labor market
Martin KahanecDPP, CEU Budapest
June 27, 2011

• The demographic context and the need for immigrants
• Migrants in Europe
• Immigration and integration policy perspectives
Three themes

The demographic background• Demographic change presents nearly all EU states
with formidable challenges:– Ageing populations– Scarcity of skilled labor– Dynamic loss in the economy (innovation deficits)– Financial risks in social security systems
• Financial and economic crisis adds to the difficulties:– Rising risk aversion– Economic decline– Negative attitudes toward immigration and new Fortress Europe?
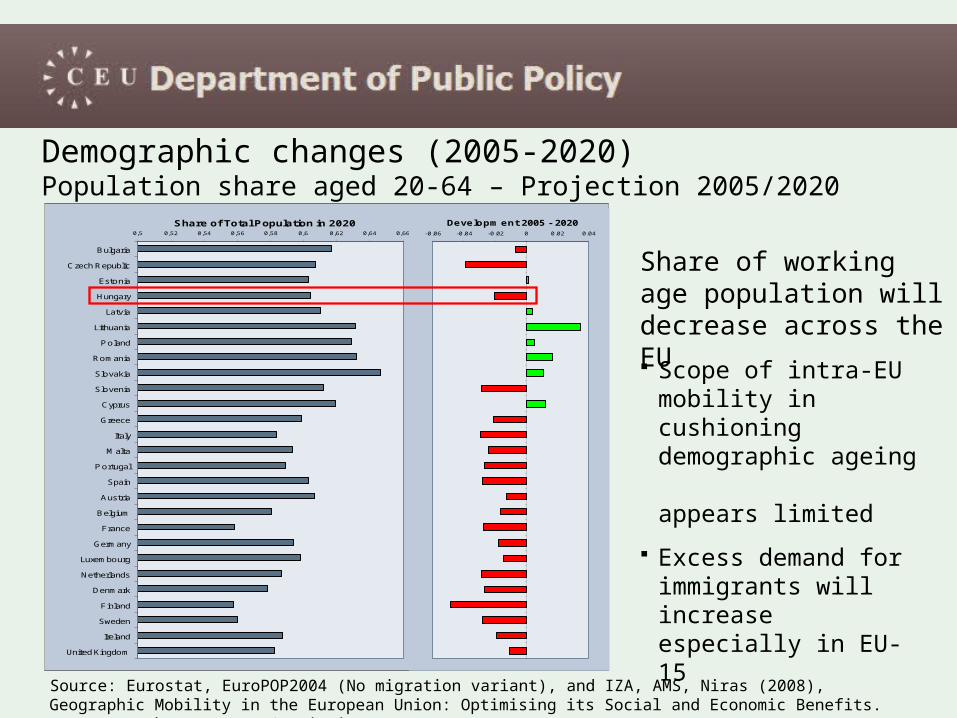
Demographic changes (2005-2020) Population share aged 20-64 – Projection 2005/2020
Source: Eurostat, EuroPOP2004 (No migration variant), and IZA, AMS, Niras (2008), Geographic Mobility in the European Union: Optimising its Social and Economic Benefits. Report to the European Commission
Scope of intra-EU mobility in cushioning demographic ageing appears limited
Excess demand for immigrants will increase especially in EU-15
0,5 0,52 0,54 0,56 0,58 0,6 0,62 0,64 0,66
Bulgaria
Czech Republic
Estonia
Hungary
Latvia
Lithuania
Poland
Romania
Slovakia
Slovenia
Cyprus
Greece
Italy
Malta
Portugal
Spain
Austria
Belgium
France
Germany
Luxembourg
Netherlands
Denmark
Finland
Sweden
Ireland
United Kingdom
Share of Total Population in 2020-0.06 -0.04 -0.02 0 0.02 0.04
Developm ent 2005 - 2020
Share of working age population will decrease across the EU
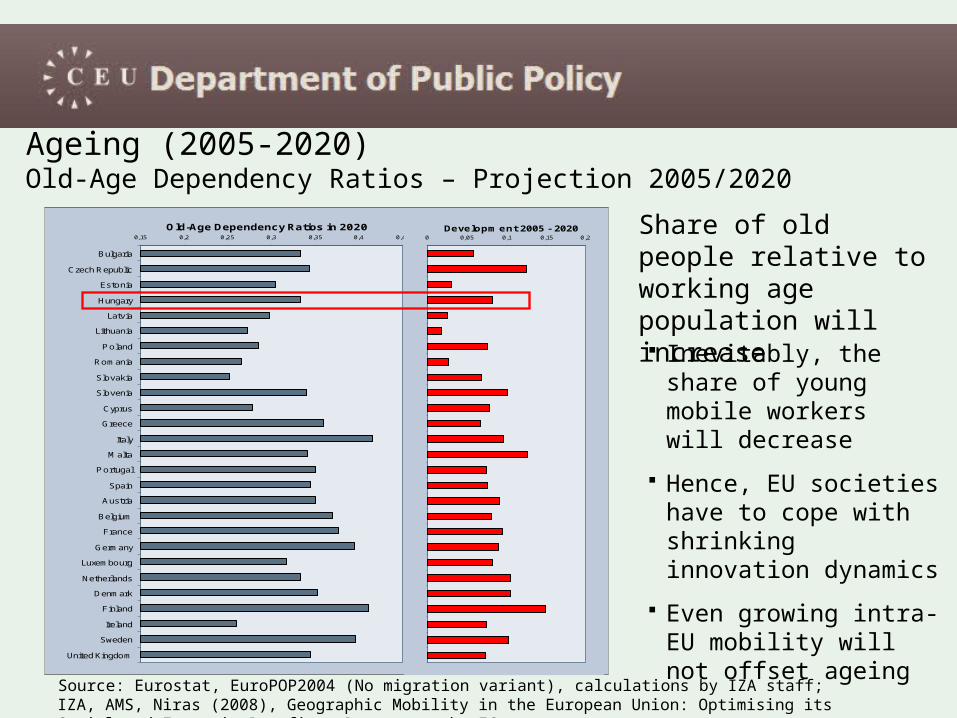
Ageing (2005-2020) Old-Age Dependency Ratios – Projection 2005/2020
Source: Eurostat, EuroPOP2004 (No migration variant), calculations by IZA staff; IZA, AMS, Niras (2008), Geographic Mobility in the European Union: Optimising its Social and Economic Benefits. Report to the EC
Inevitably, the share of young mobile workers will decrease
Hence, EU societies have to cope with shrinking innovation dynamics
Even growing intra-EU mobility will not offset ageing
Share of old people relative to working age population will increase
0,15 0,2 0,25 0,3 0,35 0,4 0,45
Bulgaria
Czech Republic
Estonia
Hungary
Latvia
Lithuania
Poland
Romania
Slovakia
Slovenia
Cyprus
Greece
Italy
Malta
Portugal
Spain
Austria
Belgium
France
Germany
Luxembourg
Netherlands
Denmark
Finland
Ireland
Sweden
United Kingdom
Old-Age Dependency Ratios in 20200 0,05 0,1 0,15 0,2
Developm ent 2005 - 2020
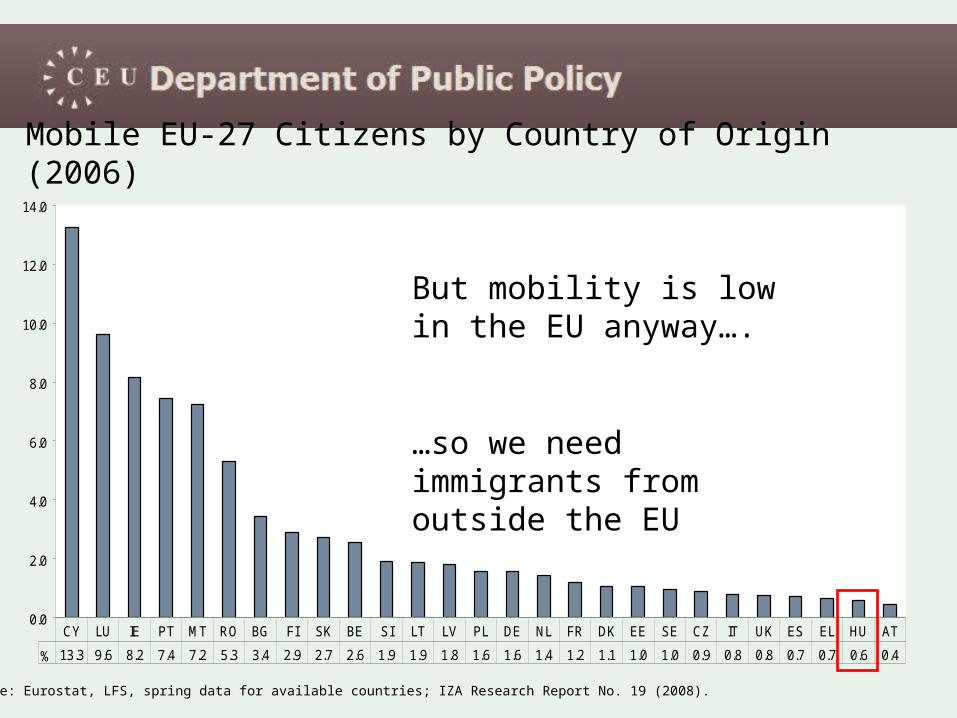
Mobile EU-27 Citizens by Country of Origin (2006)
0.0
2.0
4.0
6.0
8.0
10.0
12.0
14.0
% 13.3 9.6 8.2 7.4 7.2 5.3 3.4 2.9 2.7 2.6 1.9 1.9 1.8 1.6 1.6 1.4 1.2 1.1 1.0 1.0 0.9 0.8 0.8 0.7 0.7 0.6 0.4
CY LU IE PT MT RO BG FI SK BE SI LT LV PL DE NL FR DK EE SE CZ IT UK ES EL HU AT
Source: Eurostat, LFS, spring data for available countries; IZA Research Report No. 19 (2008).
But mobility is low in the EU anyway….
…so we need immigrants from outside the EU

IZA Expert Survey on High-Skilled Labor Immigration• A survey of 234 labor market experts from Europe
• 89.0% - the EU needs at least as many immigrants as it has now, and 57.7% - the EU needs more or many more immigrants
• Less conviction that the EU needs low-skilled immigration (60.7 and 27.3%)
• However, 96.7% - the EU needs at least as many high-skilled migrants, and 80.3 % - the EU needs more or many more high-skilled migrants
• Sensitivity to the crisis? 84.5% report no effect of the crisis on their evaluation of the long-term demand for immigrants

…so there is need for immigrants.
… do we have any?
Migrants in Europe
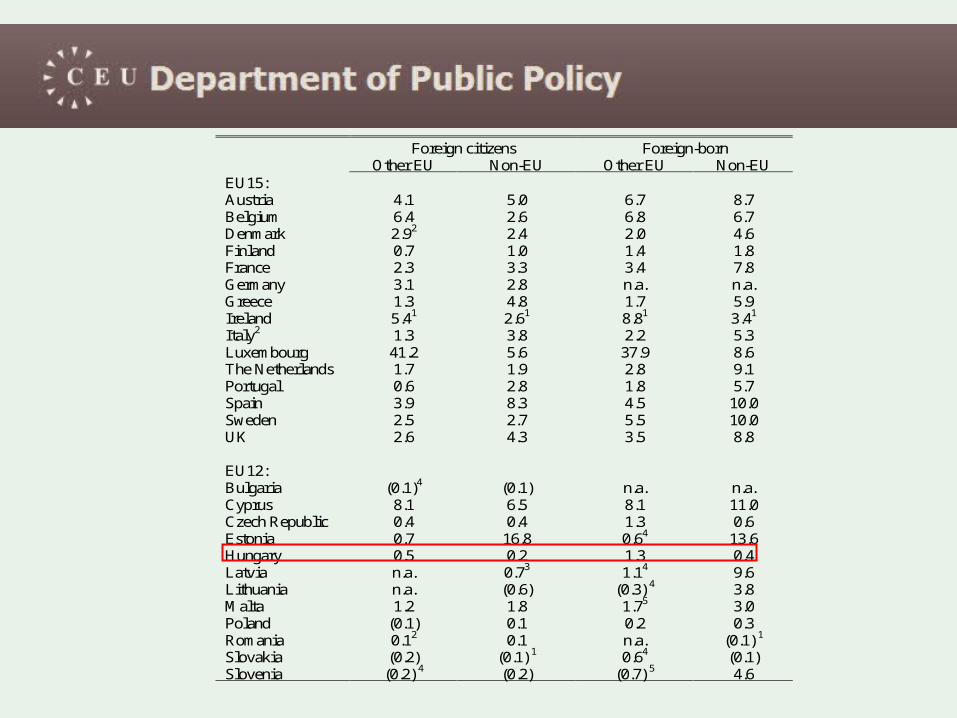
Foreign citizens Foreign-born Other EU Non-EU Other EU Non-EU EU15: Austria 4.1 5.0 6.7 8.7 Belgium 6.4 2.6 6.8 6.7 Denmark 2.92 2.4 2.0 4.6 Finland 0.7 1.0 1.4 1.8 France 2.3 3.3 3.4 7.8 Germany 3.1 2.8 n.a. n.a. Greece 1.3 4.8 1.7 5.9 Ireland 5.41 2.61 8.81 3.41 Italy2 1.3 3.8 2.2 5.3 Luxembourg 41.2 5.6 37.9 8.6 The Netherlands 1.7 1.9 2.8 9.1 Portugal 0.6 2.8 1.8 5.7 Spain 3.9 8.3 4.5 10.0 Sweden 2.5 2.7 5.5 10.0 UK 2.6 4.3 3.5 8.8 EU12: Bulgaria (0.1)4 (0.1) n.a. n.a. Cyprus 8.1 6.5 8.1 11.0 Czech Republic 0.4 0.4 1.3 0.6 Estonia 0.7 16.8 0.64 13.6 Hungary 0.5 0.2 1.3 0.4 Latvia n.a. 0.73 1.14 9.6 Lithuania n.a. (0.6) (0.3) 4 3.8 Malta 1.2 1.8 1.75 3.0 Poland (0.1) 0.1 0.2 0.3 Romania 0.12 0.1 n.a. (0.1) 1 Slovakia (0.2) (0.1) 1 0.64 (0.1) Slovenia (0.2) 4 (0.2) (0.7) 5 4.6
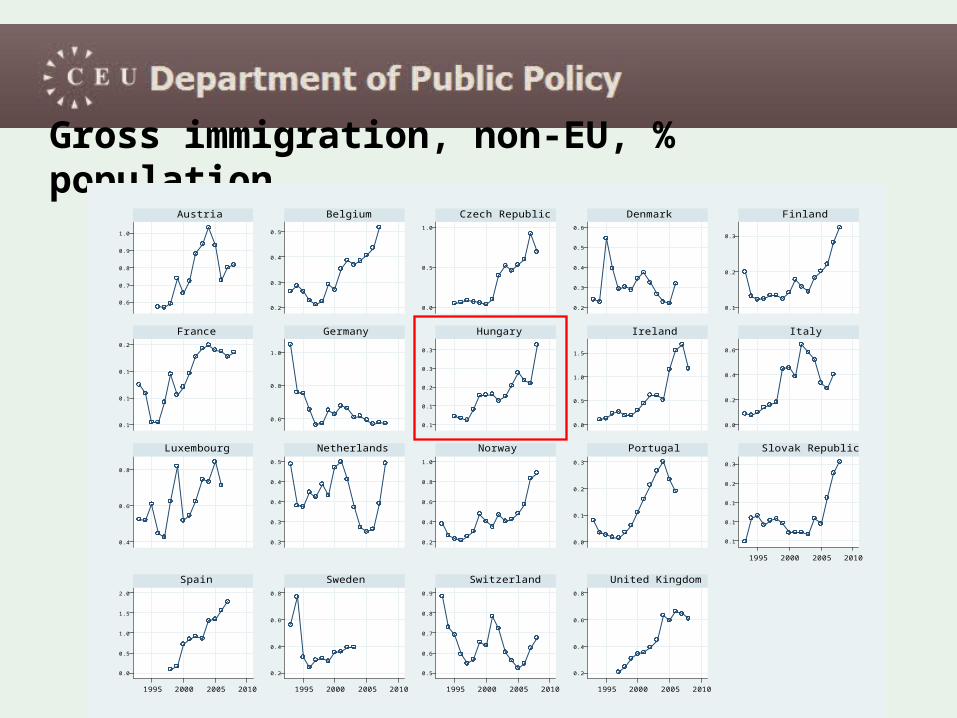
Gross immigration, non-EU, % population
0.6
0.7
0.8
0.9
1.0
0.2
0.3
0.4
0.5
0.0
0.5
1.0
0.2
0.3
0.4
0.5
0.6
0.1
0.2
0.3
0.1
0.1
0.1
0.2
0.6
0.8
1.0
0.1
0.1
0.2
0.3
0.3
0.0
0.5
1.0
1.5
0.0
0.2
0.4
0.6
0.4
0.6
0.8
0.3
0.3
0.4
0.4
0.5
0.2
0.4
0.6
0.8
1.0
0.0
0.1
0.2
0.3
0.1
0.1
0.1
0.2
0.3
0.0
0.5
1.0
1.5
2.0
0.2
0.4
0.6
0.8
0.5
0.6
0.7
0.8
0.9
0.2
0.4
0.6
0.8
1995 2000 2005 2010
1995 2000 2005 2010 1995 2000 2005 2010 1995 2000 2005 2010 1995 2000 2005 2010
Austria Belgium Czech Republic Denmark Finland
France Germany Hungary Ireland Italy
Luxembourg Netherlands Norway Portugal Slovak Republic
Spain Sweden Switzerland United Kingdom

AT BE CY CZ DK EE FI FR DE EL HU IE IT Natives High 13.18 25.95 20.72 9.49 26.75 22.16 26.32 19.53 20.18 13.28 11.11 20.85 8.43 Medium 27.82 39.68 43.02 20.6 28.63 27.79 33.53 42.81 25.14 54.95 38.87 45.73 60.44 Low 59 34.37 36.27 69.9 44.62 50.05 40.16 37.65 54.68 31.77 50.02 33.41 31.13 Immigrants High 14.18 22.94 32.54 12.39 33.86 33.04 21.8 18.06 17.36 13.72 22.09 39.79 11.72 Medium 39.46 49.46 35.67 34.14 27.89 16.74 33.74 57.47 41.73 47.74 29.38 26.58 49.8 Low 46.36 27.59 31.78 53.47 38.25 50.22 44.46 24.47 40.91 38.54 48.53 33.64 38.48 Non-EU immig.
High 9.82 22.28 27.13 22.6 30.41 32.71 18.18 19.64 . 11.71 20.69 . . Medium 48.87 49.76 39.45 26.37 33.76 16.59 41.99 55 . 52.39 29.58 . . Low 41.31 27.96 33.42 51.03 35.82 50.7 39.83 25.37 . 35.9 49.73 . .
LV LT LU NL PL PT SK SI ES SE UK EU15 EU25 Natives High 16.35 17.86 15.44 26.13 11.93 7.72 10.62 15.69 20.58 24.73 26.30 19.06 17.33 Medium 30.45 30.53 32.92 33.18 30.11 80.83 26.92 27.3 62.33 21.78 13.97 42.86 41.03 Low 53.20 51.61 51.64 40.69 57.96 11.45 62.46 57.00 17.09 53.49 59.73 38.09 41.64 Immigrants High 24.13 24.94 27.51 23.28 11.86 18.83 19.31 13.68 21.33 28.50 27.70 22.44 21.94 Medium 19.50 19.82 39.93 31.69 51.62 54.72 24.14 32.23 46.76 23.86 18.45 38.45 38.32 Low 56.36 55.23 32.56 45.03 36.52 26.45 56.55 54.09 31.92 47.64 53.85 39.11 39.74 Non-EU immig.
High 24.40 25.00 31.31 21.65 12.30 17.34 17.65 13.21 18.73 26.66 28.22 21.53 20.65 Medium 17.06 18.87 28.84 35.62 52.58 56.55 31.37 33.37 49.02 27.89 19.72 39.80 39.76 Low 58.53 56.13 39.85 42.73 35.12 26.11 50.98 53.42 32.25 45.46 52.06 38.68 39.58

…so in CEE we have few immigrants (bad), but their numbers are growing (good) and they are relatively skilled (also good).
…in the rest of Europe the situation varies: e.g. Ireland, Denmark and the UK have substantial populations of skilled immigrants, whereas Austria, Germany or the Netherlands attract less skilled immigrants.
… what policies are needed?

Immigration and integration policy perspectives

The context of immigration policy
• Bad demographics
• Arguments that Europe needs immigrants, especially skilled ones, to alleviate the demographic problems
• Empirical evidence on the effects of immigration on host labor markets– generally non-negative, – perhaps local adversities, – but many positive effects documented
• Not many immigrants in CEE, larger numbers in EU15 (but their integration a challenge)
• Immigration and integration policies problematic (see MIPEX)

21.9
72.8 74.8
4.6
31.8
13.2 16.6
2.6 2.0 2.0 0.00
1020304050607080
open
bor
ders
job-
depe
nden
tim
mig
ratio
n
posi
tive
sele
ctio
n on
educ
atio
n/sk
illsne
gativ
ese
lect
ion
oned
ucat
ion/
skills
sele
ctio
n ba
sed
on la
ngua
gesk
illsse
lect
ion
base
don
mig
rant
s'ne
ed (
refu
gees
sele
ctio
n ba
sed
on th
eex
iste
nce
of
sele
ctio
n ba
sed
on a
nces
try
othe
r se
lect
ion
clos
ed b
orde
rs
no p
olic
y is
nece
ssar
y
pe
rce
nt
ESHSLI results: Preferable policy approach

… but this can only work if immigrants are integrated
… are they?
… how?

The risk of poverty
• Mostly significantly higher than that of the nativesESS, mimeo
0
1
2
3
4
5
LU BE SE CZ NL FI AT NO FR DK IE GR CY IT UK ES DE* IS PL PT
Non-EU EU
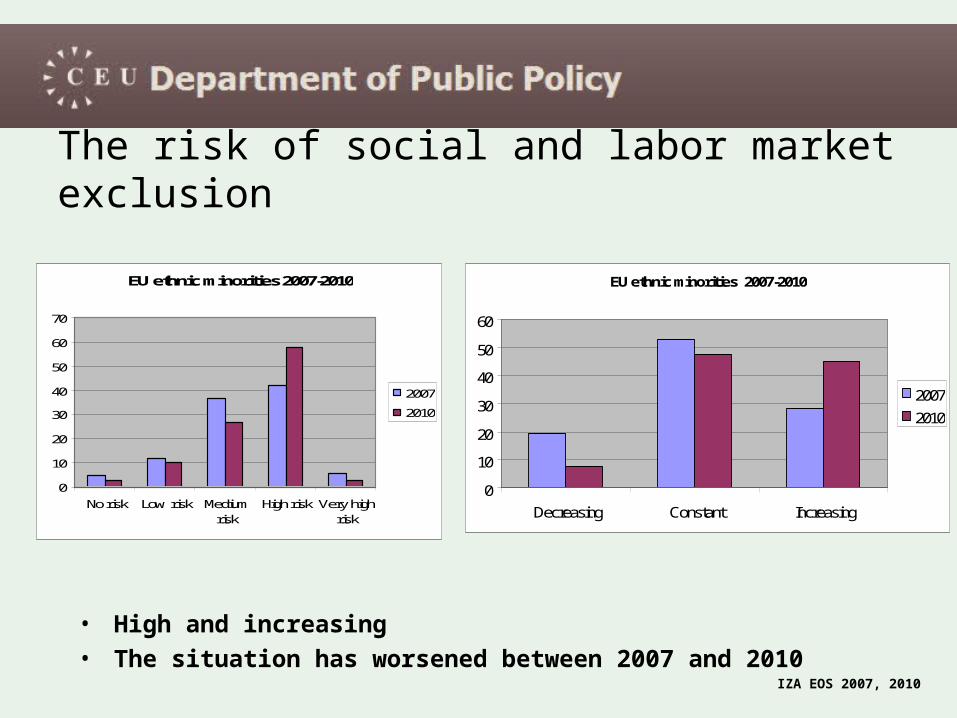
The risk of social and labor market exclusion
• High and increasing
• The situation has worsened between 2007 and 2010IZA EOS 2007, 2010
EU ethnic minorities 2007-2010
0
10
20
30
40
50
60
70
No risk Low risk Mediumrisk
High risk Very highrisk
2007
2010
EU ethnic minorities 2007-2010
0
10
20
30
40
50
60
Decreasing Constant Increasing
2007
2010
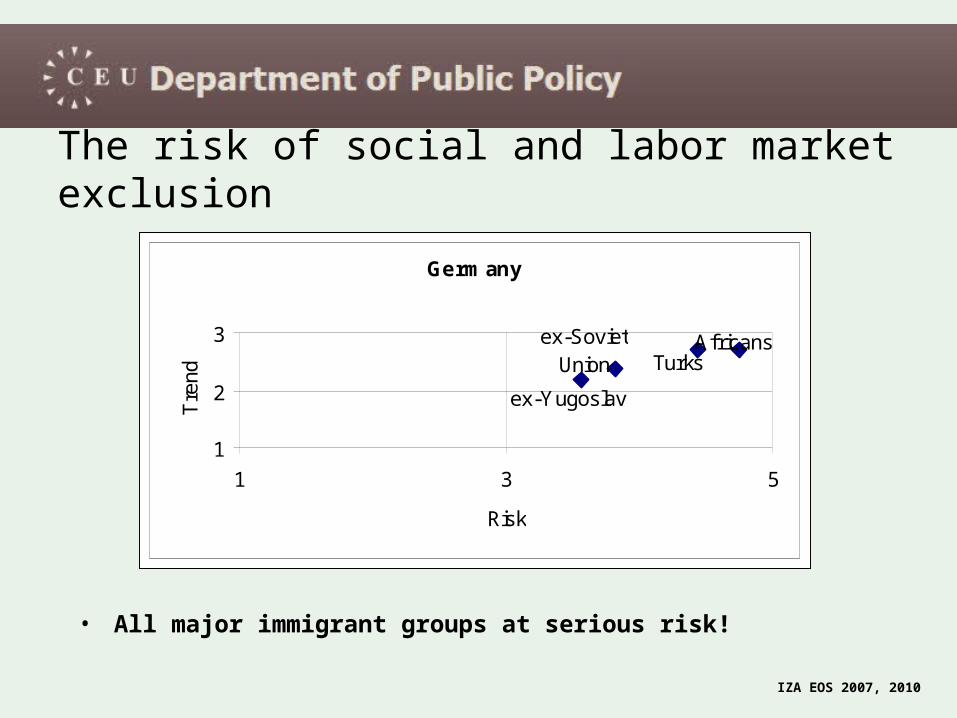
The risk of social and labor market exclusion
• All major immigrant groups at serious risk!
IZA EOS 2007, 2010
Germany
Turksex-Soviet
Union
ex-Yugoslav
Africans
1
2
3
1 3 5
Risk
Tre
nd
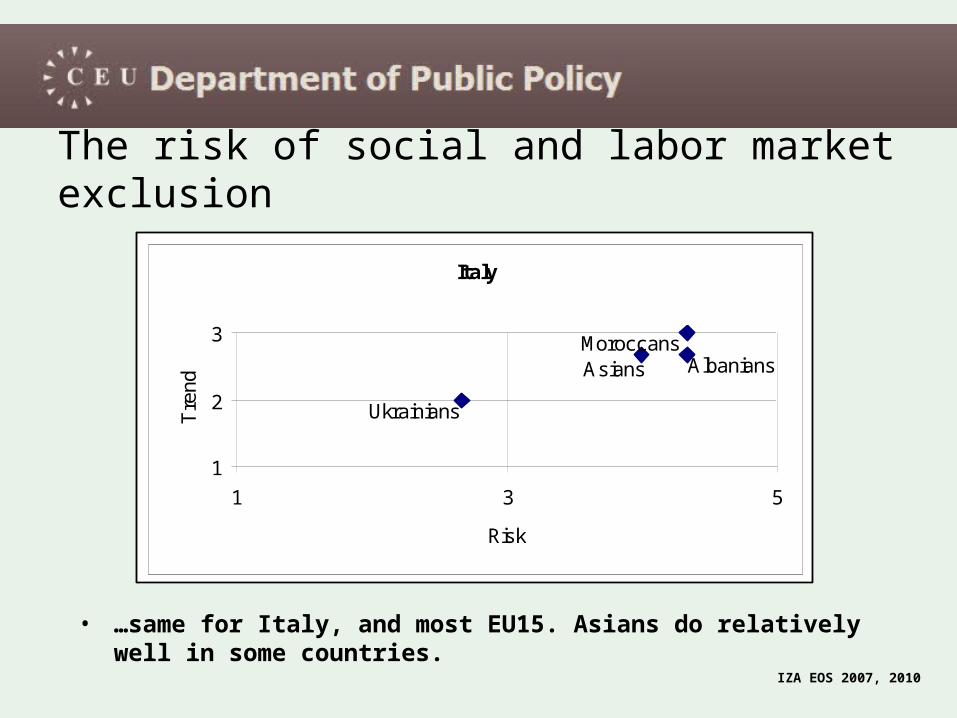
The risk of social and labor market exclusion
• …same for Italy, and most EU15. Asians do relatively well in some countries.
IZA EOS 2007, 2010
Italy
AlbaniansMoroccansAsians
Ukrainians
1
2
3
1 3 5
Risk
Tre
nd
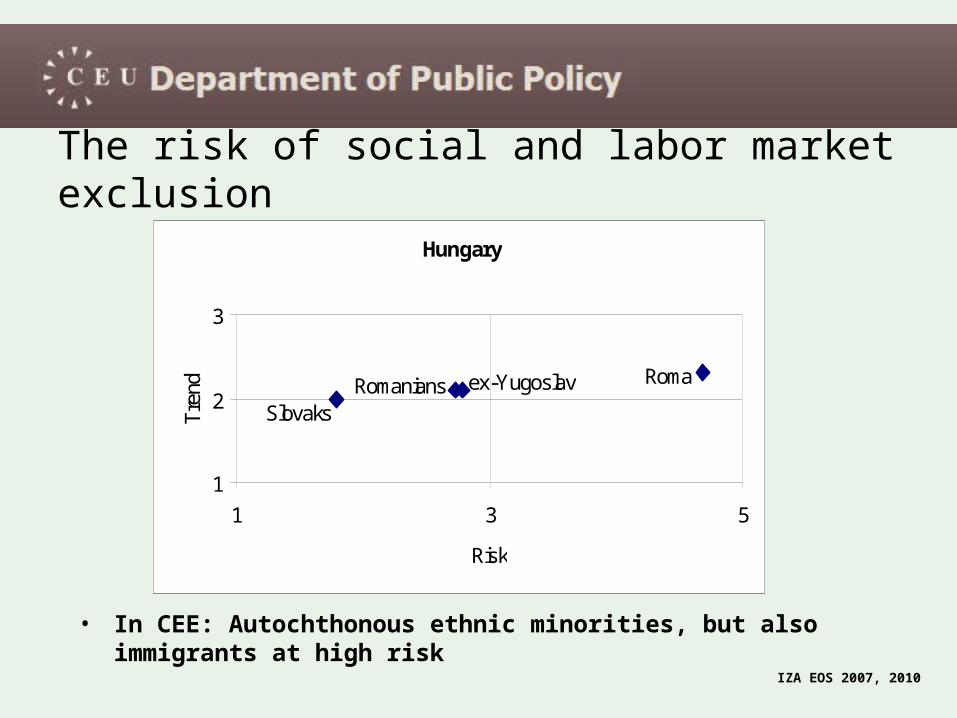
The risk of social and labor market exclusion
• In CEE: Autochthonous ethnic minorities, but also immigrants at high risk
IZA EOS 2007, 2010
Hungary
Roma
Slovaks
ex-YugoslavRomanians
1
2
3
1 3 5
Risk
Tre
nd
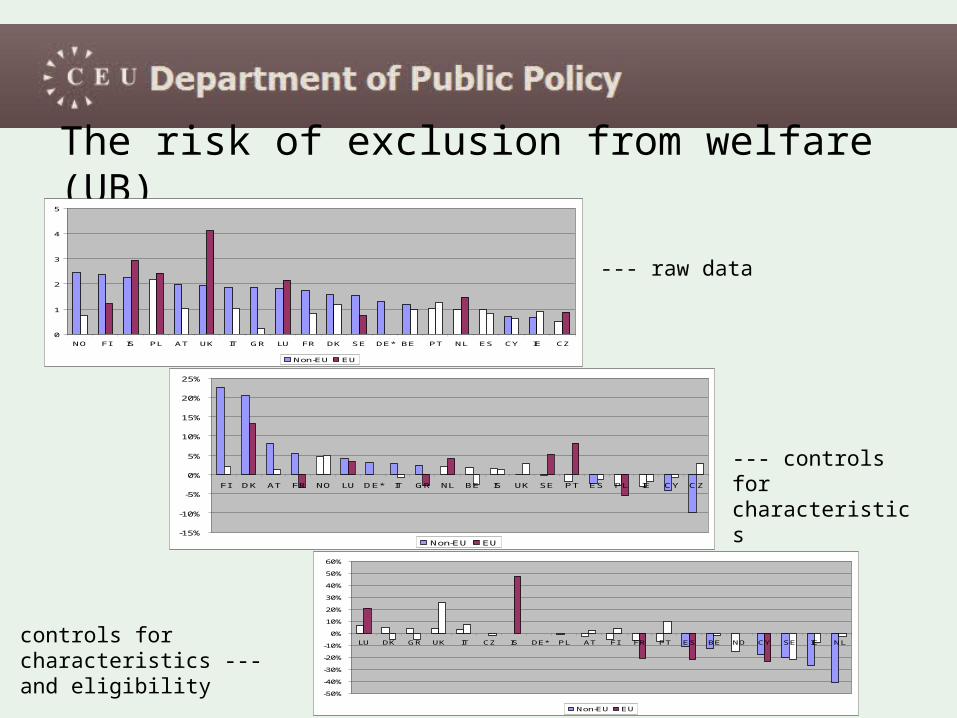
The risk of exclusion from welfare (UB)
0
1
2
3
4
5
NO FI IS PL AT UK IT GR LU FR DK SE DE* BE PT NL ES CY IE CZ
Non-EU EU
-15%
-10%
-5%
0%
5%
10%
15%
20%
25%
FI DK AT FR NO LU DE* IT GR NL BE IS UK SE PT ES PL IE CY CZ
Non-EU EU
-50%
-40%
-30%
-20%
-10%
0%
10%
20%
30%
40%
50%
60%
LU DK GR UK IT CZ IS DE* PL AT FI FR PT ES BE NO CY SE IE NL
Non-EU EU
--- controls for characteristics
--- raw data
controls for characteristics ---and eligibility
0
10
20
30
40
50
60
Perc
ent
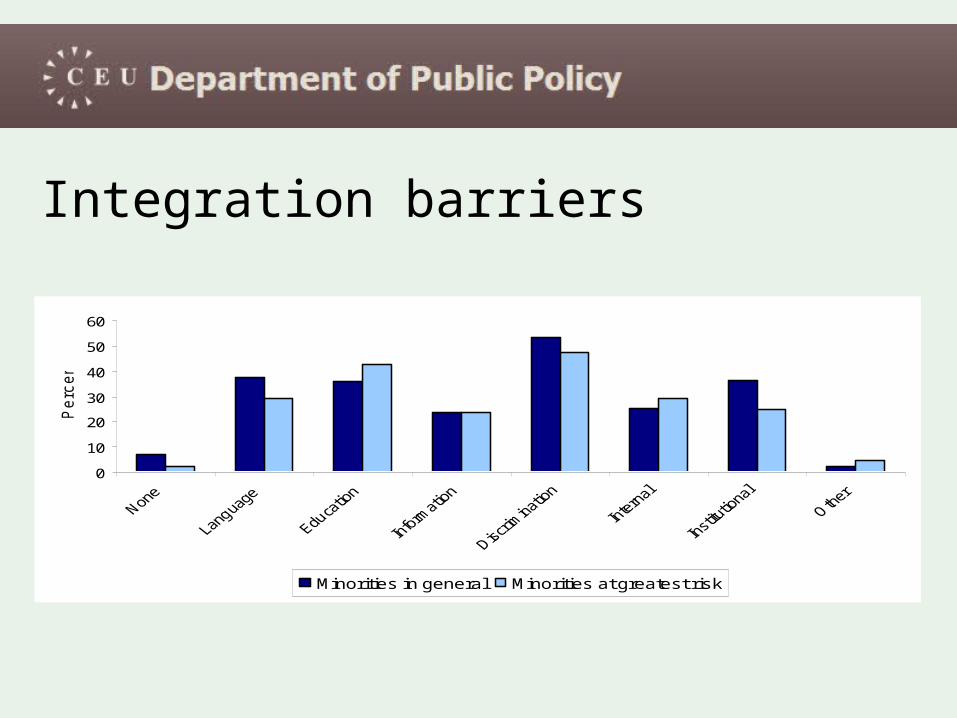
Minorities in general Minorities at greatest risk
Integration barriers

What do minorities want: Areas integration policies most desired
01020304050607080
Paid
empl
Self-e
mpl
Educa
tion
Soc. i
nsur
ance
Health
care
Housin
g
Mob
ility
Cultu
ral li
fe
Polit p
artic
ipat
ion
Repre
sent
atio
n
Attitu
des
Oth
er
Per
cent
Minorities in general Minorities at greatest risk
• Almost all minorities want to change their situation (86% of all respondents, 98% of minority respondents)
• Mainly in paid employment, education, attitudes and housing.

0
10
20
30
40
50
60
70
Equal treatment Specific provisions Positive discrim. Other
Perc
ent
All respondents Minority respondents
Preferred policy principles
• Equal treatment!
• But some room for positive action

Conclusions
• High need for (skilled) migrants in European labor markets
• But immigration policies often lacking and backfiring
• Very limited integration policy
• The debate often ill-informed and a paradigm shift needed – access vs. abuse, win best brains vs. allow on “sacred soil”
• Missing an opportunity!

Martin Kahanec Tel/Fax: +36 1 235 3097Email: [email protected]
Department of Public PolicyCentral European UniversityNador utca 9Budapest 1051Hungarywww.publicpolicy.ceu.hu


