+ All Categories
Home > Documents > The impact of education on the demographic dividend

The impact of education on the demographic dividend

Date post: 11-Jan-2022
Category:
Upload: others
View: 2 times
Download: 0 times
Share this document with a friend
35
The impact of education on the demographic dividend Elisenda Rentería 1 Guadalupe Souto 2 Iván Mejía-Guevara 3 Concepció Patxot 4 1 Centre d’Estdudis Demogràfics. Universitat Autònoma de Barcelona. Adress: Carrer de Ca n’Altayó, Edifici E2 Universitat Autònoma de Barcelona 08193 Bellaterra / Barcelona Spain Phone: +34 93 5813060 2 Applied Economics Department. Universitat Autònoma de Barcelona 3 Harvard Center for Population and Development Studies. 4 Economic Theory Department. Universitat de Barcelona.
Transcript

The impact of education on the demographic dividend

Elisenda Rentería1

Guadalupe Souto2

Iván Mejía-Guevara3

Concepció Patxot4

1 Centre d’Estdudis Demogràfics. Universitat Autònoma de Barcelona.

Adress: Carrer de Ca n’Altayó, Edifici E2

Universitat Autònoma de Barcelona

08193 Bellaterra / Barcelona

Spain

Phone: +34 93 5813060 2 Applied Economics Department. Universitat Autònoma de Barcelona 3 Harvard Center for Population and Development Studies. 4 Economic Theory Department. Universitat de Barcelona.

1

The impact of education on the demographic dividend

Abstract

The impact of population structure on economic growth has been studied in recent

decades using different methods to estimate the so-called demographic dividend.

Besides, education has been pointed out as a key factor in economic growth. We

propose a decomposition of the demographic dividend, into age and education effects.

We illustrate the potentialities of the method, deriving an application to Mexico and

Spain over the period 1970-2100. To that end, we estimate the National Transfer

Accounts age profiles by schooling level and apply them to recently available

population projections stratified by education level. Our results confirm the role of

population age structure in the demographic dividend, but also reveal that education

attainment can be even more crucial. Moreover, we find that how both age and

education effects finally impact on economic growth depends to a great extent on the

specific consumption and labor income age profiles in each country.

2

1. Introduction

The effect of the population age structure on economic growth has been extensively

studied over the last two decades, mainly motivated by the demographic transition

from high to low mortality and fertility rates that most countries are experiencing as

they develop. Previous research was focused on the link between population size and

growth, but the influential work of Bloom and Williamson (1998) explicitly

introduced age structure into the analysis, finding that this was an important

mechanism by which demographic variables affect economic growth. The concept of

demographic gift, later re-named as demographic dividend, first appeared in Bloom

and Williamson’s work to refer to the positive effect that the demographic transition

can have on economic growth. During this process, there is a temporary stage where

the working-age population grows faster than the rest; that is, the support ratio –the

share of working-age population in total population– grows. Consequently, per capita

income can increase as there are fewer economic dependents in the population.

Nevertheless, this effect will vanish some years later, when baby boomers reach

retirement age, leading to an increase in old dependency ratios, i.e. population aging.

The demographic transition has coincided in time with a significant educational

expansion that occurred in virtually every country in the world during the 20th

century, especially after the 1960s. Certainly, important differences remain between

areas, but all of them show general improvements in education (UNESCO, 2011).

This means that the empirically observed effects of population age structure on

economic growth are probably influenced by improvements in the education level of

the population. Since the late 1960s, a vast branch of economic research has being

studying the return to education, on the level of both micro-effects of education on

individual earnings and macro-effects on economic growth (Johnes and Johnes,

2004). Micro-labor literature, based on the Mincerian human capital earnings function

(Mincer, 1974), produced estimations of the rates of return to schooling. From a

macro-economic perspective, several cross-country studies have investigated the

effects of educational attainment on the GDP growth rate. However, as

Psacharopoulos and Patrinos (2004) point out, the weakest point of the

macroeconomic growth models is the requirement of substantial data, due to the

difficulties in constructing comparable inter-temporal and inter-country human capital

3

data, including comparability problems of National Accounts figures. As a result, the

empirical evidence about the positive effect of education on earnings observed at the

micro level cannot always be corroborated at the macro level. Nevertheless, micro

level results are clear and solid enough to justify the profitability of investment in

education. As Stevens and Weale (2004) state, if people with more education earn

more the same should occur for a group of individuals, and particularly for a country.

Summarizing, two strands of literature analyzing the determinants of economic

growth have evolved separately during recent decades. On the one hand, there is the

research about the demographic dividend, trying to elucidate the effects of the

population age structure on economic growth, but without paying specific attention to

changes in educational level, only on the investment in human capital of children (Lee

and Mason, 2010, Mason et al., 2016). On the other hand, a longstanding branch of

economic research has been devoted to disentangling the relationship between

economic growth and the educational attainment of the population, but without

special regard to the population age composition. A recent paper by Crespo-Cuaresma

et al. (2014) acts as a kind of meeting point between the two previous research lines,

as they try to disentangle the roles of age structure and education in economic growth

by using panel data. As they point out, research on the demographic dividend was

initially linked to education, but its role was not analyzed in depth (Bloom and

Williamson, 1998), or it was found to be not significant (Kelley and Schmidt, 2005).

Crespo-Cuaresma et al. (2014) estimate a macroeconomic growth model using a

newly available dataset on human capital, containing information about educational

attainment distribution by age and sex for more than 100 countries for the period

1980-2005.i They conclude that, when correcting for educational expansion, the effect

of population age structure on GDP per capita is reduced significantly, that is to say

that the so-called demographic dividend is mainly an education effect. Education and

age composition of the population are treated as two separate factors in the

regressions, as if the education level of the population was not related to the age

structure of the same population.

In our study, we link education attainment to the evolution of the population age

structure using a different method. We propose an extension of the methodology

developed by Mason (2005) and Mason and Lee (2006), in order to decompose the

4

growth in the support ratio – the demographic dividend – into two different

components: age and education. These authors combined demographic information

with the age profiles of consumption and labor income, estimated following the

National Transfer Accounts (NTA) method. We follow the same strategy, taking it

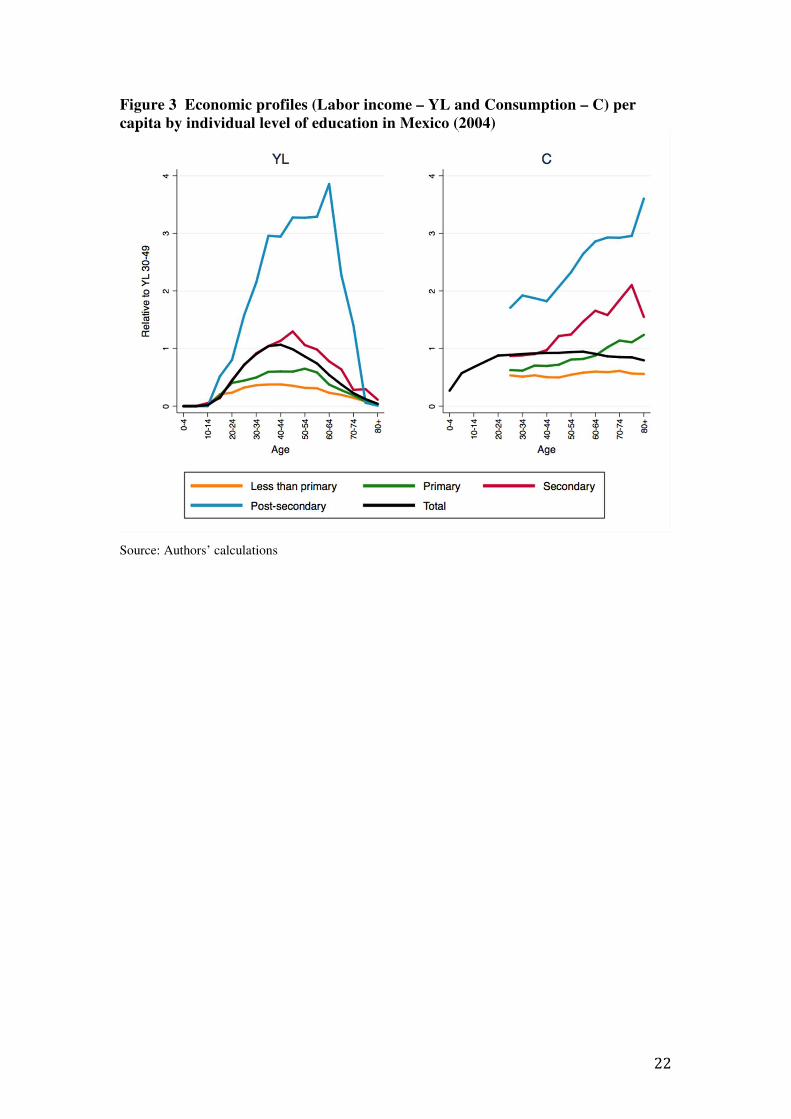
one step further. We first estimate the NTA age profiles by education level and then

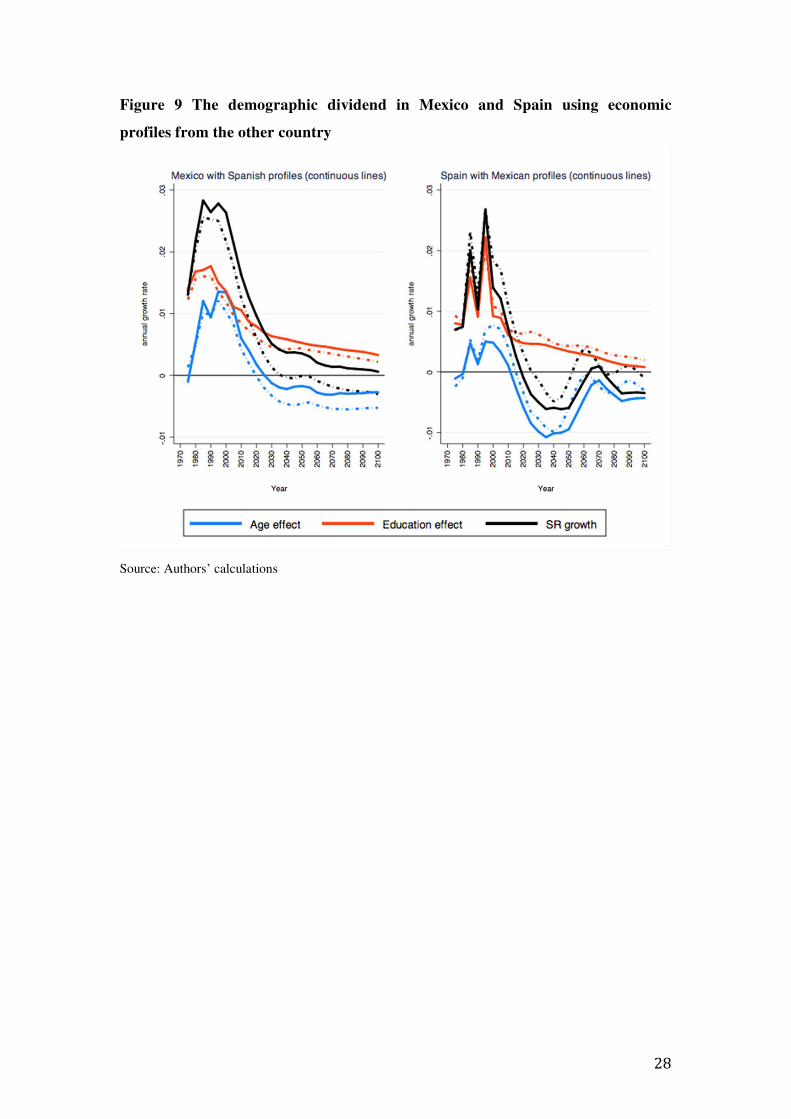
we adapt the method to incorporate education variability. Second, in order to illustrate

the potentialities of this methodological extension, we perform a simulation exercise

for Mexico and Spain, for which we were able to construct the NTA profiles by level

of education ii . Likewise, they represent two different contexts in terms of

demographic transition and educational achievements of their populations, allowing

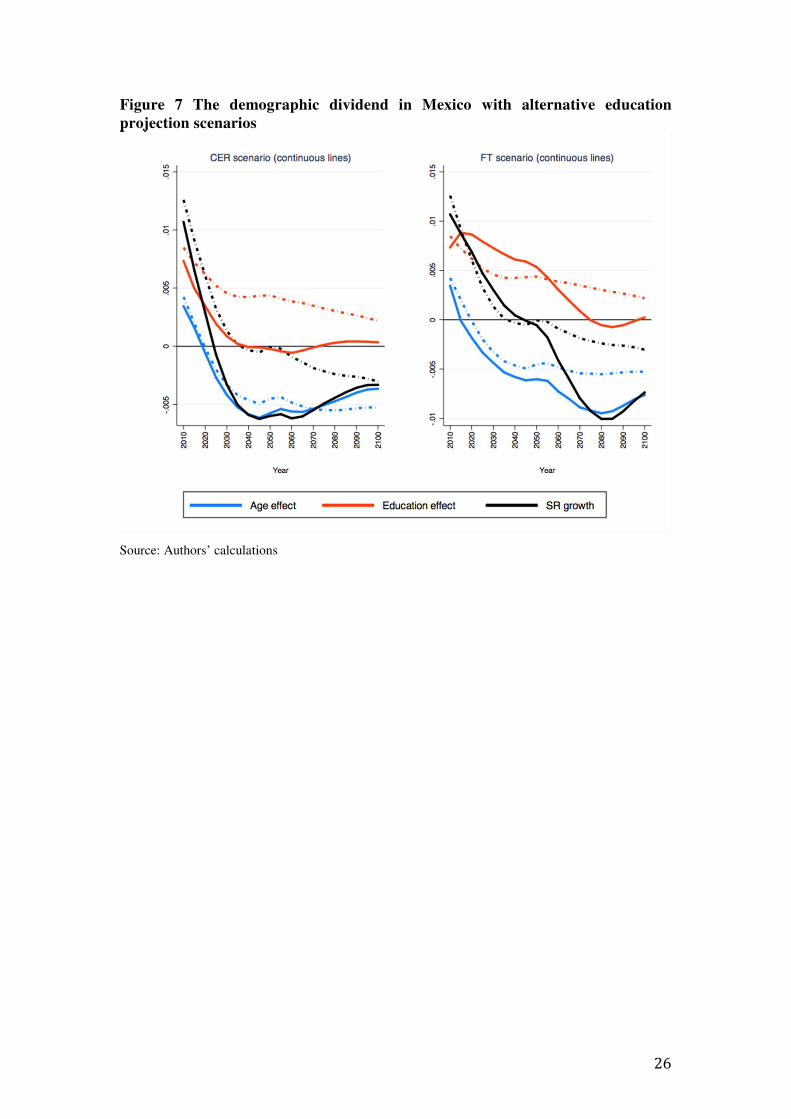
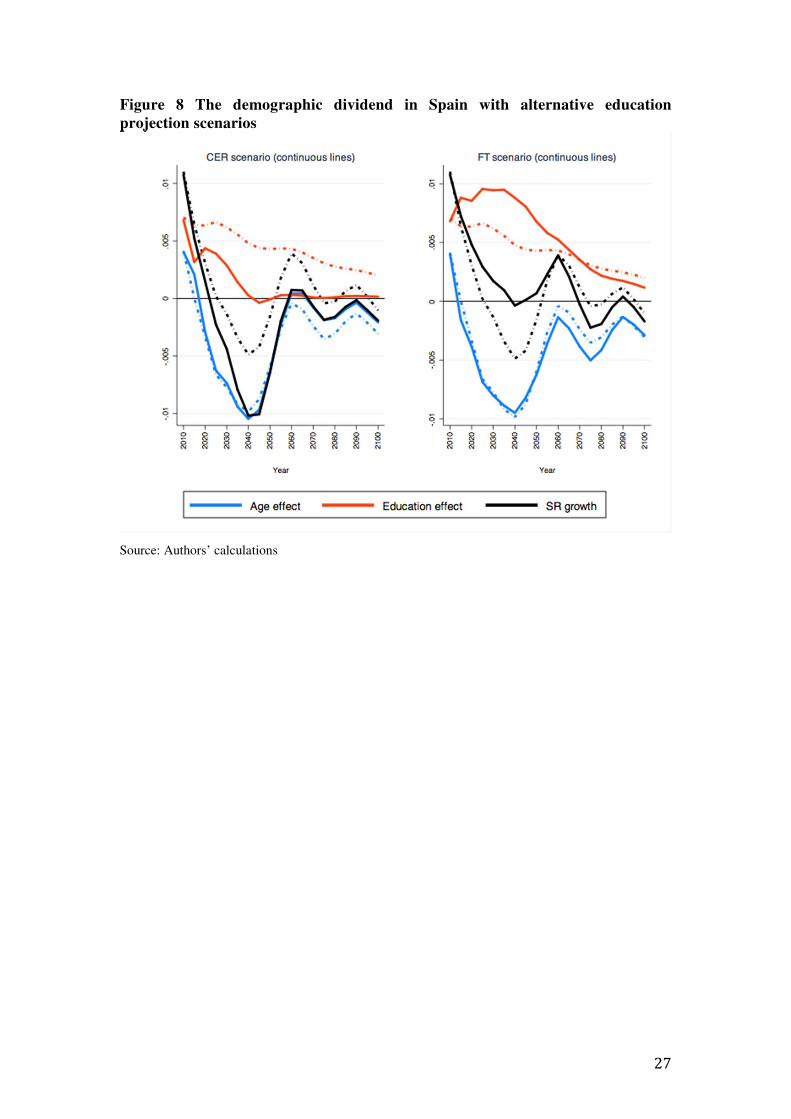
for an interesting comparison. Our simulation will recover the history of population

back to 1970 and projecting it into the future. We are thus able to evaluate the impact

of population age structure on the support ratio, but taking into account that changes

in education also influence the production and consumption level.

The rest of the paper is structured as follows. In the next section, after a brief review

about the estimation of the demographic dividend, we propose the decomposition into

two different factors, age and education effects. The third section is devoted to

describing and constructing the data needed for the estimation – including population

projections by level of education and the age profiles of consumption and labor

income by education level for Mexico and Spain. The fourth section shows the main

results of different simulation exercises, estimating the proposed decomposition of the

demographic dividend. Finally, conclusions are in the last section.

2. Decomposing the demographic dividend by age and education level

Following Mason (2005), the concept of the demographic dividend can be formally

derived starting from the following decomposition of per capita income at year t:

�(�)�(�) = �(�)

�(�)�(�)�(�) (1)

With Y being income, N total population and W working-age population (hereinafter

workers). The first term on the right-hand side, the ratio of workers to total

5

population, represents the support ratio (SR). The second term on the right-hand side

is income per worker (productivity, l). Hence, income per capita depends on these two

factors: the support ratio (�) and productivity (l). Expressing Eq (1) as growth rates

(g), it can be derived that support ratio changes and productivity growth rates

determine per capita income growth:

� �(�)�(�)� = �(�) + �(�)(2)

The demographic dividend is captured by the evolution of the support ratio. Bloom

and Williamson (1998) were among the first authors to estimate it. Using regression

analysis, they concluded that the demographic transition contributed to the so-called

economic miracle observed in East Asia over the period 1965-1990. Kelley and

Schmidt (2001) and Bloom and Canning (2003) also carried out other empirical

studies using cross-country aggregate data. Mason (2005) and Mason and Lee (2006)

derive an alternative estimation process for the evolution of the support ratio,

combining demographic and economic information. By using the per capita age

profiles of labor income and consumption, they obtain the number of effective

consumers (C) and producers (L) instead of N and W in Eq (1). With ��and ���being

the per capita age profiles of consumption and labor income, respectively, C and L

can be obtained as follows:

�(�) = ���(�) · ���

(3)

�(�) = ���(�) · ����

(4)

In this way, the pure demographic support ratio in Eq. (2) is redefined as an economic

support ratio that we will be referring to as support ratio (SR), as it considers not only

demographic effects of population age structure, but also economic variables, such as

labor and consumption patterns. Estimations of the demographic dividend based on

the SR are available for many countries (Mason, 2005; Mason and Lee, 2006;

Oosthuizen, 2015; Patxot et al., 2011; Prskawetz and Sambt, 2014). Results show

that, for most developed countries, the demographic dividend started in around the

6

1970s and lasted for about three decades, but some differences can be observed

depending on the specific demographic and economic characteristics of each country.

In order to consider the effect of education explicitly in the estimation of the

demographic dividend, we further break down Eqs (3) and (4) by educational group,

represented by j:

�(�) = ���(�) =�

� ����(�)��

· ���(5)

�(�) = ���(�) =�

� ����(�)��

· ����(6)

Once the economic profiles have been differentiated by both age and education, it is

possible to measure the contribution of each of these two factors to the demographic

dividend, estimated as the growth of SR. First, we follow the method of Das Gupta

(1993) in order to decompose the annual growth of effective producers (L) into a rate-

effect (R), an age-effect (A) and an education-effect (E), asiii:

�(� + �) − �(�) = �!(� + �) − �!(�)"#$$$$%$$$$&'()*+*,,*-)

+ .̅(� + �) − .̅(�)"#$$$$%$$$$&(0*+*,,*-)

+ 1!(� + �) − 1!(�)"#$$$$%$$$$&*23-()�45+*,,*-)

(7)

�!(�) in Eq [7] refers to the age and education standardized rate-effect in year t (and

t+x) and is measured as:

�!(�) = ∑7897 ():;):789

7 ())< �����,� (�) (8)

Where Nij/N represents the share of people of age i and education level j relative to the

total population, and lyij is the labor income profile by age and educational level.

Likewise, .̅(�) corresponds to a rate and education standardization of the age-effect:

.̅(�) = ∑ >?89():;):>?89())< ∙ *89():;):*89())

< ∙ A���,� (�) (9)

7

With A�� and B�� being the age and education effects, respectively. They can be

isolated from the age and education level structure of the population in year t as:

C89())C()) = C89())

C.9()) ∙ C8.())C()) �

EF

#$$$%$$$&(89())

∙ GC89())C8.()) ∙ C.9())

C()) HEF

#$$$%$$$&*89())

(10)

The last term in Eq [7], E(t), is estimated as the rate and age standardization of the

education effect:

1!(�) = ∑ >?89():;):>?89())< ∙ (89():;):(89())

< ∙ B���,� (�) (11)

Secondly, consumption is decomposed in the same way as labor income, into rate,

education and age effects.

Finally, the decomposition of labor income and consumption obtained in the three

effects mentioned is introduced into the estimation of the SR growth rate as:

�(�) = �(�) − �(�) = I():;)+I())I()) −J():;)+J())

J()) = KLM:NLM:OLMI()) −KLP:NLP:OLP

J()) (12)

To carry on the decomposition explained here, we need age profiles of consumption

and labor income by education level and to apply them to the population over several

years. Population data, therefore, also need to be disaggregated by age and education

level. We perform the decomposition for Mexico and Spain from 1970 to 2100, taking

one base year for the economic profiles. This implies that the rate effect described

above (Eq. 8) will not be captured.

3. 1 Data requirements: population data by level of education

We used population projections by level of education, available from the Wittgenstein

Centre for Demography and Global Human Capital (WICD). iv The WICD has

produced, for the first time, projections of educational level by age and sex for 195

countries for the period 1970-2100, using exhaustive information and analyses of

recent trends on fertility, mortality, migration, and educational level for the different

8

areas of the world (Lutz et al., 2014). They also consider other scenarios in their

projections. We will use two of them for the sensitivity analysis. On the one hand, the

CER (constant enrolment rate) scenario considers that enrollment rates remain

constant over time from 2015 onwards, in both countries; therefore, no significant

improvements in education level are expected beyond the coming decades. On the

other hand, the FT (Fast Track) scenario assumes that enrollment rates improve faster

than in the central projection.

In order to observe the evolutions of the age structure in both countries, Figure 1

shows the dependency ratios (using data only by age and year) obtained from WICD

data for 1970-2100. First, child dependency has experienced a clear decline in both

countries but with different patterns. For Mexico, the demographic transition started

later than in Spain, but it has been much more pronounced as the initial level of

fertility was higher. At the beginning of the century child dependency was still over

50%, but it will continue to decrease until 2050, when it will stabilize at around 25%.

In the case of Spain, child dependency reached its minimum (slightly above 20%) in

the early 2000s and is expected to remain at around that level until 2040. After that

year, it will increase to 25% and will remain at around that level for the rest of the

century.

[Figure 1]

Second, demographic patterns are also different regarding old dependency. In

Mexico, it will increase especially after 2030 and will continue to grow over the rest

of the century. In the case of Spain, it starts to grow earlier and will peak at 69% by

2050, a level that Mexico will never reach during the period. The whole process is

strongly driven by the evolution of the fertility rate, which was 2.15 in Mexico in

2015 (CONAPO, 2015), while it was only 1.3 in Spain in 2013 (INE, 2015).

Projections for Mexico predict that the fertility rate will remain higher than in Spain,

and consequently the increase in its old dependency ratio will be slower (UN, 2015).

Finally, it is worth noting that during the first part of the period analyzed – until 2010

in Spain and 2030 in Mexico - the total dependency ratio was mainly driven by the

evolution of child dependency. Conversely, old dependency will become the main

driver of total dependency in the future. Note also that the minimum level of the total

9

dependency expected in Mexico (48% in 2030) is slightly higher than in Spain (44%

in 2005-2009).

Figure 2 displays population projections by level of education (percentage of adult

population in each education level) for the baseline scenario (the medium case), as

well as the alternative scenarios for the period 1970-2090.

[Figure 2]

We observed that Mexico and Spain have experienced great improvements in their

level of education in recent decades, reducing the share of adults with less than

primary education and increasing the amount of people with higher education levels.

Nevertheless, important differences exist between them. According to the OECD

(2013), in 2011 Mexico was clearly behind the OECD average in terms of people

aged 25-34 who had completed at least upper secondary education (55% compared to

82% in OECD) and who had attainted tertiary education (23% compared to 39% in

OECD). Those figures were significantly better in the case of Spain (65% of people

aged 25-34 with upper secondary education and 39% with tertiary education).

According to Lutz et al. (2014) projections, the differences will remain in the future.

For example, in Spain adults with less than primary school practically banish in 2035

(they will be below 3% of total population), but this will only occur 20 years later in

Mexico. Regarding post-secondary education, by 2100 53% of Spaniards but only

41% of Mexicans will have post-secondary education.

When observing both alternative scenarios, significant differences between

educational attainment in Mexico and Spain remain. However, we can observe that

the CER scenario stops improving education attainment of the population after 2050

in both countries. In the FT scenario, post-secondary education proportions increase

faster, and not only proportions of people with less than primary but also with primary

education are reduced to very low levels. Nevertheless, by 2090, Spain continues to

have a higher proportion of population with post-secondary education than Mexico.

10

3.2 Data requirements: Constructing age profiles of consumption and labor

income by level of education

We briefly describe the procedure to construct economic profiles by age and

educational level for Mexico and Spain. We are basically interested in two profiles:

labor income and consumption. The labor income profile will be used to obtain the

number of effective producers (Eq 3), and the consumption profile to estimate the

number of effective consumers (Eq 4). The difference between labor income and

consumption age profiles defines the so-called lifecycle deficit (LCD) in the National

Transfer Accounts (NTA) methodology. The LCD shows how production and

consumption vary over the lifecycle. Typically, individuals consume more than they

produce during two periods – at the beginning and at the end of their lives -, and the

opposite occurs for working-age individuals. The length of these three periods,

together with the amount of the corresponding deficit –consumption higher than labor

income– or surplus –consumption lower than labor income– varies among countries

(Mason and Lee, 2011).

We followed the NTA methodology (UN, 2013) to construct economic profiles that

are estimated through surveys and official data, and then adjusted to aggregate data

from National Accounts. The labor income profile is comprised of the sum of

earnings and self-employment income profiles among total population by age and

education level, and the consumption profile includes a profile of both public and

private consumption. We go beyond the standard NTA methodology by

differentiating age profiles by education level. We consider four levels of education –

1) Less than primary; 2) Primary completed; 3) Secondary completed; 4) Higher

education – similar to Mejía-Guevara (2015), but using individual education instead

of the education level of the household head.v

Data for Mexico are from the year 2004. Micro data on labor and private consumption

are extracted from the Income and Expenditure Survey (ENIGH), while public

consumption data come from administrative records (SHCP, 2004). In the case of

Spain, data are for 2006 and come from different sources. Private consumption data

come from the Household Budget Survey (EPF), labor income data are extracted from

the EU-SILC and public consumption data come from different public administration

11

statistics (INE, IGAE). Specific details on the construction process of profiles for

each country are described elsewhere (Mejía-Guevara, 2011, 2014a for Mexico;

Patxot et al., 2011a, 2011b for Spain).

Figures 3 and 4 show the per capita age profiles of labor income and consumption by

level of education from Mexico and Spain, respectively. To make them comparable,

they have been divided by the average labor income for ages 30 to 49 in the same

country. Although with differences, both average economic profiles (black lines in the

Figures) present the typical shape by age: while consumption remains quite stable

over the lifecycle for adults, labor income is clearly concentrated in the middle years

of working age (Lee & Ogawa, 2011; Tung, 2011). Nevertheless, the differentiation

of those profiles by educational attainment brings significant new features. First, in

both countries labor income profiles present higher differences than consumption

profiles; that is, labor income is more unequal according to level of education than

consumption. In Spain, the labor income profile peaks at around ages 50-54 for higher

education levels (post-secondary and secondary education), while it peaks at younger

ages for lower levels of education. The per capita labor income at age 50-54 for

people with post-secondary education level represents more than double the average

labor income for ages 30-49. Regarding population with primary education, their

labor income profile is practically flat for ages 30-55 - around 80% of the average

income at 30-49. Finally, individuals with less than primary education earn the

maximum at 30-34 – around 50% of average income for ages 30-49. The pattern is

quite similar in Mexico, although a much higher difference is observed for individuals

with the higher level of education: their per capita labor income for ages 30-65 is over

3 times the average labor income at 30-49. On average, labor income of individuals

from age 30 to 59 with post-secondary education in Mexico is 8.6 times that of the

individuals with less than primary studies, while that ratio is 5.1 in Spain.

Second, regarding consumption profiles, the differences by level of education are

again clearly higher in Mexico. Consumption of highly educated individuals more

than doubles average consumption, while consumption of the less educated is half that

of average consumption. For Spain, consumption profiles by level of education are

much more similar, and consumption of highly educated individuals is 60% higher

than consumption of less educated individuals among ages 30 to 59. It is worth noting

12

that the average consumption profile observed in Spain among the middle age groups

(30 to 49) is 66% of the average labor income for ages 30-49, significantly lower than

in Mexico, where it is around 90%.

[Figure 3]

[Figure 4]

The per capita lifecycle deficit (LCD) profiles for both countries are shown in Figure

5. In general, Mexico presents higher deficits than Spain because, as seen in previous

Figures, its consumption profiles are clearly higher than in Spain at every level of

education, while labor income profiles are not. Interestingly, it can be observed that in

Mexico only individuals with at least secondary education can generate a surplus

(labor income over consumption) during their lifecycle. This surplus is much more

significant in the case of individuals with higher education, while very modest for

individuals with secondary studies. On the contrary, people with less than secondary

education present a continuous deficit (they consume more than they produce) over

their whole lifecycle. In Spain, the picture is slightly better: individuals with primary

or higher education experience a surplus during part of their working-age years, being

clearly longer and bigger than in Mexico.

[Figure 5]

5. The role of education in the demographic dividend

5.1. Baseline results

Figure 6 shows the results of the demographic dividend (defined as the rate of growth

of the support ratio) for the period 1970 to 2100 in Mexico and Spain, distinguishing

the education and age effects. As explained above, the education effect captures the

impact on the demographic dividend of changes in the population composition by

education level, while the age effect estimates the impact of changes in the age

population structure. If we just look at the evolution of the total SR growth (black

line) we observe that, for Mexico, it reached the highest growth rate in 1985 and from

13

then it initiates a progressive decrease until it becomes negative in 2040, remaining in

negative values for the rest of the century. In the case of Spain, the evolution is

somewhat different. The support ratio peaks a decade later – in 1995-99 – but

decreases faster, becoming negative by 2030-34. Negative values are clearly higher in

Spain than in Mexico, but they last until 2055, when the growth of the support ratio

becomes positive again for a short period of 20 years.

Regarding the age effect, both in Mexico and Spain, the estimated positive effect will

last until 2020 and will remain negative for the whole century. In Spain, the negative

age effect will peak in 2040 (coinciding with the full retirement of the baby boom

generation) and will improve from then on. In the case of Mexico, the negative effect

of age increases continuously along the period, but it is never as important as in

Spain, due to the different time path of their demographic transitions.

[Figure 6]

While the age effect closely follows the evolution of the total dependency ratio, the

education effect is positive as the education level of the population continues to

increase, this occurs throughout the period for both Mexico and Spain. Hence, the

growth of the support ratio will remain positive if the positive education effect is

higher than the negative age effect.

It is worth noting that, although the Spanish population is expected to reach higher

education levels than Mexican population, it also exhibits a much more negative age

effect, which holds back the positive effect of education. Therefore, it is true that

education expansion can partly overcome the negative impact of an increasing

dependency ratio on the demographic dividend, but the population age structure

continues to be crucial in the evolution of the SR.

[Table 1]

As mentioned above, the demographic dividend measures the effects of changes in

age structure (age effect) and educational attainment (educational effect) on economic

14

growth. In order to explore this relationship, Table 1 shows past trends of the

demographic dividend decomposed for the two factors (age and education), together

with the annual GDP growth observed, both in per capita and per effective consumer

terms.vi Mexico has registered an average annual growth of the support ratio of 1.90%

over the period 1970-2015, due to a positive age structure and especially to a very

favorable education effect. However, although annual GDP per capita growth was

3.27%, GDP per effective consumer only grew by 1.92%, due to the unfavorable

relations between labor income and consumption. Of upmost importance, during the

most favorable period in terms of SR growth (1980-95) the GDP has grown well

below. This result indicates that Mexico was not taking full advantage of its favorable

demographic and educational background.

In Spain, the demographic dividend was also positive (1.47%) throughout the period

1970-2015, although the age effect is zero in the last years. This accounted for 70% of

GDP per effective consumer growth. However, during some periods (1980-85; 1990-

95 and 2005-15), the Spanish economy clearly grew below the demographic dividend,

meaning that the opportunities offered by the population structure in terms of age and

education level were also neglected. Hence, it seems that in the past Spain, and

especially Mexico, were not able to fully benefit from having a significant

demographic dividend. This is particularly worrying provided that the demographic

dividend will be much lower, and even negative, in the future.

In order to evaluate the robustness of our results, we perform two sensitivity

exercises. First, we evaluate the impact of the education projections by using two

alternative scenarios to our central hypothesis, as described in the third section.

Second, we try to evaluate the impact of the economic profiles of consumption and

labor income employed, by exchanging the profiles estimated for both countries.

5.2. Sensitivity analysis (I): Changing education projection scenarios

As a sensitivity test, we re-estimate our results of the demographic dividend

decomposed with two alternative scenarios of population distribution by level of

education, also available in WICD (2015), as described in the third section. As

mentioned, the CER scenario considers very little improvements in the educational

15

attainment of both countries, while the FT scenario assumes a faster education

expansion than in the central projection. Both alternative scenarios use the same

assumptions as the baseline scenario, except for the education enrollment rates.

However, as demographic components depend on the education level of the

population, different population age structures result in each of these alternative

scenarios.

Results obtained with the two alternative education scenarios, together with our

baseline estimation, are shown in Figures 7 (Mexico) and 8 (Spain). As expected, in

the CER scenario the education effect is clearly lower for both countries, becoming

zero around 2040 in both cases, and remaining close to a null value from then and

onwards. The decline of the education effect means that the demographic dividend

becomes dependent mostly on the age effect, and turns negative earlier and much

deeper than in the baseline scenario. Results using FT projections are the opposite. In

this case, the education effect is much more positive during the first half of the

projection. After 2060 in Mexico and 2070 in Spain, the education effect is lower than

in the baseline scenario, probably because the population will have almost exhausted

the capacity to improve its education level. Once a majority of the population is

already enrolled in school until tertiary education, improvements are necessarily

smaller. Therefore, the consequences are very positive in the medium term, but

puzzling further into the future. In the case of Mexico, under the faster education

expansion the demographic dividend remains positive until later, but then the age

effect decreases sharply, driving the SR to very negative values in 2060. In Spain, the

negative SR from 2020-2050 almost disappears, overcoming the baby-boom

generation aging.

Overall, the results of both scenarios make it clear that improvements in education

attainment of the population are crucial in the evolution of the demographic dividend,

both by their direct impact and also by their effect on the demographic components

influencing the age effect.

[Figure 7]

[Figure 8]

16

5.3. Sensitivity analysis (II): The effect of the economic profile

As explained in the fourth section, estimated economic profiles of labor income and

consumption (and hence of LCD) are significantly different by level of education

within each country, but there are also disparities between countries. Spain presents

more favorable profiles in terms of LCD, as its relative consumption profiles are

clearly lower than in Mexico for all education levels, while its relative labor income

profiles are slightly higher. In order to evaluate the impact of the economic profiles on

the demographic dividend, a simulation exercise is created by exchanging the

estimated profiles for both countries. Therefore, we estimate the evolution of the

demographic dividend in Mexico if it had the economic profiles of Spain, and vice

versa, the demographic dividend in Spain with the labor income and consumption

profiles of Mexico (Figure 9).

The results show that both age and education effects are affected by economic

profiles. In Mexico, more favorable economic profiles would imply a considerably

higher demographic dividend, which would not become negative in the period

considered. This means that, ceteris paribus, a better per capita lifecycle deficit

profile in Mexico would be sufficient to overcome the negative effects of aging in its

economy. As for Spain, the opposite is observed: worse lifecycle deficit profiles –

with higher deficits and lower surpluses– than those observed in Mexico would lead

to a scenario where the demographic dividend would become negative earlier and

would remain below zero for longer. Hence, the same conclusion is confirmed in both

cases: worse (better) lifecycle deficit profiles would improve (worsen) the

demographic dividend evolution, as a combination of effects in both age and

education components.

[Figure 9]

17

6. Conclusions

The potential positive effects of a favorable population age structure on economic

growth have been investigated in recent decades through the estimation of the

demographic dividend. This research was mainly motivated by the demographic

transition that most countries are facing as they develop. The first estimations of the

demographic dividend looked into the relations between the working-age population

and the economically dependent individuals, namely the support ratio. In a first stage

of the demographic transition the working-age population grows faster than the rest of

the population, having a positive effect on economic growth. The opposite occurs in a

second stage, when the aging process arrives and the support ratio growth becomes

negative. However, it turned out that the first stages of demographic transition

coincided in time with a significant education expansion in most countries, which also

interacts with this process. This means that economic growth is not only influenced

by age structure changes, but also by the improvements in the education attainment of

the population. In this paper we propose to disentangle both effects through the

decomposition of the demographic dividend.

The estimation of the decomposition requires population data by age and education

for the past and projections for the future, as well as estimations of per capita profiles

of labor income and consumption, also by age and level of education. The former was

obtained from a recently available dataset (WICD, 2015; Lutz et al., 2014; Speringer

et al. 2015). Regarding the economic profiles, the NTA project provides them for a

wide range of countries, but no data are yet available by education level. Hence, we

focus our estimation on two specific countries, Mexico and Spain, estimating their

economic profiles by age and level of education.

Our results reveal interesting insights. First, the positive age effect in Mexico starts

before 1970, peaks in around 2000 and finishes in around 2020, when it will become

negative. In the case of Spain, the age effect starts later (in 1980) but ends by 2020, as

well. Second, the education effect is clearly higher than the age effect in the past in

both countries, and remains positive throughout the period observed. When adding the

education component to the demographic dividend, the future negative effect of aging

on the support ratio is partly offset. This implies that education is an important

18

mechanism to reduce the adverse effects of aging, as education expansion delays the

starting point of the negative growth of the SR). Nevertheless, it is important to take

into account that a higher education also implies a faster aging in the future, turning

the age effect more negative, as the sensitivity scenarios showed. Third, we showed

that economic profiles by age and level of education could also have important effects

on the demographic dividend: ceteris paribus, the better (worse) the lifecycle deficits

the better (worse) the support ratio growth. Quite interestingly the sensitivity

scenarios show that, if Mexico had consumption and labor income age profiles similar

to those for Spain, it could completely avoid negative growth of the support ratio. The

reason is that the education improvement would be sufficient to offset a milder aging

process.

These findings also offer guidance on how to approach the demographic transition

from a policy point of view. The demographic dividend could be expanded through

policy mechanisms that focus not only on reducing population aging but also on

expanding education attainment and improving the lifecycle deficit surplus. This

gives governments more options to overcome the potential negative impact of aging.

In the case of developing countries, in the first stage of the demographic transition

education policy seems to be the best way to take advantage of, or even extend, the

period during of the demographic dividend.

In any case, further research is needed in order to investigate the interaction between

economic and demographic evolution, from both the theoretical and the empirical

perspective. On the one hand, there is a clear need to obtain time series estimates of

the age profiles in order to refine the analysis undertaken. On the other hand, from a

more general perspective, the interactions between demographic and economic

variables are diverse and still quite unknown, being as crucial as the links between

fertility, mortality, education and economic wellbeing.

19

Tables

Table 1 The GDP growth and the demographic dividend decomposed by age and

education (1970-2015) (Percentage average annual growth rates)

Period GDP per

capita

GDP per

consumer SR

Education

effect Age effect

MEXICO 1970-75 6.54 4.45 1.35 1.23 0.13

1975-80 5.15 3.52 2.03 1.56 0.49

1980-85 1.94 0.39 2.56 1.60 1.02

1985-90 2.15 0.43 2.53 1.61 0.97

1990-95 1.66 -0.01 2.50 1.35 1.21

1995-2000 5.05 3.73 2.18 1.19 1.03

2000-05 1.42 1.50 1.77 0.97 0.83

2005-10 2.86 2.37 1.26 0.85 0.42

2010-15 2.77 1.05 0.91 0.72 0.20

1970-2015 3.27 1.92 1.90 1.23 0.70

SPAIN 1970-75 4.46 4.65 0.70 0.93 -0.24

1975-80 1.52 1.60 0.72 0.82 -0.10

1980-85 1.07 1.21 2.32 1.82 0.53

1985-90 3.90 4.04 1.27 1.10 0.18

1990-95 1.51 1.37 2.67 2.02 0.70

1995-2000 3.41 3.44 1.83 1.09 0.77

2000-05 2.81 2.71 1.69 1.01 0.70

2005-10 1.06 0.86 1.10 0.70 0.41

2010-15 -0.54 -0.81 0.64 0.64 0.00

1970-2015 2.12 2.10 1.47 1.15 0.34

Source: Authors’ calculations. GDP data from OECD statistics.

20

Figures

Figure 1 Population dependency ratios in Mexico and Spain 1970 – 2100

Source: Authors’ calculations based in WICD (2015)

21

Figure 2 Distribution of the population by education level in Mexico (MX) and

Spain (ES) 1970 – 2100, for different projection scenarios

Source: Authors' calculations from Lutz et al. (2014)

22

Figure 3 Economic profiles (Labor income – YL and Consumption – C) per

capita by individual level of education in Mexico (2004)

Source: Authors’ calculations

23

Figure 4 Economic profiles (Labor income – YL and Consumption – C) per

capita by individual level of education in Spain (2006)

Source: Authors’ calculations

24

Figure 5 The lifecycle deficit (LCD) profiles by level of education

Source: Authors’ calculations

25

Figure 6 Decomposition of the demographic dividend by age and education in

Mexico and Spain, 1970-2100

Source: Authors’ calculations

26

Figure 7 The demographic dividend in Mexico with alternative education

projection scenarios

Source: Authors’ calculations

27

Figure 8 The demographic dividend in Spain with alternative education

projection scenarios

Source: Authors’ calculations

28

Figure 9 The demographic dividend in Mexico and Spain using economic

profiles from the other country

Source: Authors’ calculations

29

References

Alba, F., S. Giorguli, and M. Pascua (2014). “Cambios demográficos y desarrollo:

acomodos azarosos”. In C. Rabell Romero (Edit.), Los mexicanos: Un balance del

cambio demográfico. Fondo de Cultura Económica, México.

Bloom, D. E. and D. Canning (2003). "How Demographic Change Can Bolster

Economic Performance in Developing Countries", World Economics 4(4): 1-13.

Bloom, D.E. and J.G. Williamson (1998). “Demographic Transitions and Economic

Miracles in Emerging Asia”, The World Bank Economic Review, 12(3), 340-375.

Crespo-Cuaresma, J., W. Lutz and W. C. Sanderson (2014). “Is the Demographic

Dividend an Education Dividend?” Demography, 51, 299-315.

CONAPO (2015). Indicadores Sociodemográficos. Consejo Nacional de Población,

México. Retrieved from http://www.conapo.gob.mx/en/CONAPO/Indicadores (Date

last access: September 22, 2015).

Cutler, D., J. Poterba, L. Sheiner and L. Summers (1990). “An Ageing Society:

Opportunity or Challenge”, Brookings Papers on Economic Activity, 1, 1-74.

Das Gupta, P. (1993). Standardization and Decomposition of Rates: A User’s

Manual. US Bureau of Census, Current Population Reports, Series P23-186, US

Government Printing Office, Washington, DC, October, 145p.

Ehrlich, P. R. (1968). The population bomb. New York: Ballantine.

EUROSTAT (2007). EU Statistics on Income and Living Conditions (EU-SILC)

2007.

Hammer, B. (2015). “National Transfers Accounts by Education: Austria 2010”.

AGENTA working paper 2/2015.

30

INE (2006), Encuesta de Presupuestos familiares (EPF) 2006. Instituto Nacional de

Estadística. Available at: http://www.ine.es.

INEGI (2015). Estadísticas Históricas de México. Instituto National de Estadística y

Geografía. Aguascalientes, México. Retrieved from:

http://dgcnesyp.inegi.org.mx/ehm/Ehm.htm (Date last access: September 23, 2015)

Johnes, G. and J. Johnes (2004). International Handbook of the Economics of

Education, Edward Elgar, UK.

Kelley, A. C. and R. M. Schmidt (2005). “Saving Dependency and Development”,

Journal of Population Economics, 9 (4), 365-386.

Krueger, A.B. and M. Lindahl (2001), ‘Education for growth: Why and for whom?’,

Journal of Economic Literature, 34 (4), 1101–36.

Lee, R. and A. Mason (2010). “Fertility, Human Capital, and Economic Growth over

the Demographic Transition”. European Journal of Population, 26 (2), 159-182

Lee, R. and A. Mason (2011). Population Ageing and the Generational Economy. A

Global Perspective. Edward Elgar, USA.

Lee, R., A. Mason and T. Miller (2000). “Life Cycle Saving and the Demographic

Transition: The Case of Taiwan”. Population and Development Review, 26, 194-219.

Lee, R., A. Mason and T. Miller (2003). “Saving, Wealth and the Transition from

Transfers to Individual Responsibility: The cases of Taiwan and the United States”.

The Scandinavian Journal of Economics, 105, 339-357.

Lee, S-H., N. Ogawa (2011). “Labor Income Over the Lifecycle”, in in: Lee, R.,

Mason, A. (Eds) Population Aging and the Generational Economy: A Global

Perspective. Edward Elgar, USA.

31

Lutz W., W.P. Butz and S. K.C. (2014). World Population and Human Capital in the

Twenty-First Century. Oxford University Press. Wittgenstein Centre Data Explorer

Version 1.2. Available at:

www.wittgensteincentre.org/dataexplorer

Lutz, W., J. Crespo-Cuaresma and W.C. Sanderson (2008). “The demography of

educational attainment and economic growth”, Science, 319, 1047–1048.

Mason, A. (2005). Demographic Transition and Demographic Dividends in

Developed and Developing Countries, United Nations Expert Group meeting on

Social and Economic Implications of Changing Population Age Structure, Mexico,

UN/POP/PD/2005/2.

Mason, A. and R. Lee (2006). "Reform and Support Systems for the Elderly in

Developing Countries: Capturing the Second Demographic Dividend". GENUS

LXII(2), 11-35.

Mason, A., R. Lee and J.X. Jiang (2016). “Demographic dividends, human capital,

and saving”, The Journal of the Economics of Ageing, published online on 3 March

2016.

Mejía-Guevara, I. (2011). “The economic lifecycle and intergenerational

redistribution in Mexico”, in: Lee, R., Mason, A. (Eds) Population Aging and the

Generational Economy: A Global Perspective. Edward Elgar, USA.

Mejía-Guevara, I. (2014). “Ciclo de Vida Económico: 1992-2010”, in Cecilia Rabell

Romero (edit.) La Población de México. Fondo de Cultura Económica. Mexico.

Mejía-Guevara, I., and V. Partida Bush (2014). “Transición y dividendos

demográficos en México”, in J.L. Ávila, H.H. Hernández Bringas, and J. Narro

Robles, Cambio Demográfico y Desarrollo de México, Universidad Nacional

Autónoma de México, México D.F.

32

Mejía-Guevara, I. (2015). “Economic inequality and intergenerational transfers:

Evidence from Mexico”, The Journal of the Economics of Ageing 5, 23–32.

Mier y Terán, M., and C. Rabell (2014). “La educación básica de 1895 a 2010”. In C.

Rabell Romero (Edit.), Los mexicanos: Un balance del cambio demográfico. Fondo

de Cultura Económica, México.

Mincer, J. (1974). Schooling, Earnings, and Experience. NY: Columbia U. Press.

Núñez C. E. (2005). “Educación”, in Carreras A. and X. Tafunell (coord.).

Estadísticas Históricas de España: siglos XIX-XX. Fundación BBVA, Bilbao.

OECD (2013). Education policy outlook: Mexico. Retrieved from:

http://www.oecd.org/edu/EDUCATION%20POLICY%20OUTLOOK%20MEXICO_

EN.pdf (Date last access: September 24, 2015)

OECD (2014). Education policy outlook: Spain. Retrieved from:

http://www.oecd.org/edu/EDUCATION%20POLICY%20OUTLOOK%20SPAIN_E

N.pdf (date last access: January, 2016).

Oosthuizen, M. (2015). “Bonus or mirage? South Africa’s demographic dividend”,

Journal of the Economics of Ageing 5, 14-22.

Patxot, C., E. Rentería, M. Sánchez-Romero and G. Souto (2011). “Results for GA

and NTA: The Sustainability of the Welfare State in Spain”. Moneda y Crédito, 231,

7-51.

Patxot, C., E. Rentería, M. Sánchez-Romero, and G. Souto (2011). “How

intergenerational transfers finance the lifecycle deficit in Spain”, in Lee, R., Mason,

A. (Eds) Population Aging and the Generational Economy: A Global Perspective.

Edward Elgar, USA.

Prskawetz, A. and J. Sambt (2014). “Economic support ratios and the demographic

dividend in Europe”, Demographic Research, 30 (34), 963-1010.

33

Psacharopoulos, G. and H. A. Patrinos (2004). ‘Human Capital and Rates of Return’,

In Johnes, G. and J. Johnes (Eds), International Handbook on the Economics of

Education, Edward Elgar, U.K.

SHCP (2004). Cuenta de la Hacienda Pública Federal 2004, Secretaría de Hacienda

y Crédito Público, Mexico City. Available online at: www.shcp.gob.mx, date last

access 02 February 2016.

Stevens, P. and M. Weale (2004). ‘Education and Economic Growth’. In Johnes, G.

and J. Johnes (Eds), International Handbook on the Economics of Education, Edward

Elgar, U.K.

Speringer, M., A. Goujon, S. K.C., J. Eder, M. Potancokova and R. Bauer (2015).

Validation of the Wittgenstein Centre Back-projections for Populations by Age, Sex,

and Six Levels of Education from 2010 to 1970. IIASA Interim Report.

Székely Pardo, M. (2010). “Avances y transformaciones en la educación media

superior”, in Nora Lustig (Edit.), Los Grandes Problemas de México: IX. Crecimiento

económico y equidad. El Colegio de México.

Tuirán, R., and C. Muñoz (2010). “La política de educación superior: trayectoria

reciente y escenarios futuros”, in Nora Lustig (Edit.), Los Grandes Problemas de

México: IX. Crecimiento económico y equidad. El Colegio de México.

Tung, A-C. (2011). “Consumption Over the Lifecycle: An International Comparison”,

in in: Lee, R., Mason, A. (Eds) Population Aging and the Generational Economy: A

Global Perspective. Edward Elgar, USA.

UNESCO (2011). Global Education Digest 2011, Comparing education statistics

around the world. UNESCO, Institute for Statistics.

34

United Nations (UN) (2013). National Transfer Accounts Manual. Measuring and

Analysing the Generational Economy. Population Division, Department of Economic

and Social Affairs. United Nations Publication, New York.

United Nations, Department of Economic and Social Affairs, Population Division

(2015). World Population Prospects: The 2015 Revision, Key Findings and Advance

Tables. Working Paper No. ESA/P/WP.241.

Wittgenstein Centre for Demography and Global Human Capital (2015). Wittgenstein

Centre Data Explorer Version 1.2. Available at:

http://www.wittgensteincentre.org/dataexplorer

i The data set was constructed by the International Institute for Applied Systems Analysis at the Vienna Institute of Demography (IIASA-VID). ii The age NTA profiles for Mexico are built upon Mejía-Guevara (2015), though estimated at individual instead of at household level of education. Recently, NTA profiles by level of education have been obtained also for Austria (Hammer, 2015). iii See Das Gupta (1993) chapter 5 pp. 55-96. iv We used the newest version of the WICD data, including both past data and future projections of population distribution by educational level from 1970 to 2100 (Lutz et al., 2014). v This difference is made to allow the application of the economic profiles to population projections by age and education. We assign the average level of household consumption to those individuals under age 25, given that a great proportion of them have not finished their studies. Therefore, any educational effect coming from the consumption side of the population under 25 is suppressed. vi The GDP per effective consumer weights population by the estimated consumption profile in the corresponding country. We use the consumption profile estimated in Section 4, updated to the corresponding year.


Recommended