46
Tokyo Club Research Meeting The Impact of EU Enlargement on Firms’ Strategies and the Location of Production in Europe Frédérique Sachwald, IFRI November 2004

Tokyo Club Research Meeting
The Impact of EU Enlargement on Firms’ Strategies and the Location of Production in Europe
Frédérique Sachwald, IFRI
November 2004
2
Abstract
This paper studies the impact of EU enlargement, focusing on the evolution of corporate strategies and their influence on the location of production within the EU-25.
The first part studies the evolution of trade and FDI between EU-15 and accession countries over the last decade. Beyond increasing flows, it shows that European firms have been implementing vertical specialization within the regional area. It compares the involvement of Germany and France in particular with accession countries. It finally sets intra EU-25 trade in perspective by emphasizing the dynamism of trade with China.
The second part focuses on three sectors: the automobile industry, information and communication industries (focusing on PCs and mobile phones), textiles and clothing. These studies show that the determinants and consequences of firms’ location decisions vary across sectors. All three studies do show a shift of production facilities eastward, but each is also specific.
The conclusion deals with the current debates in France and Europe about the relocation of production in accession countries and the relevance of the policies being considered to address the threats of “wage and fiscal dumping”.
Acknowledgements
Vincent Vasques has been an excellent research assistant throughout the research for this paper. Géraldine Chiron has also contributed to the analysis of the ICT sector. The author also wants to thank Martin Werding for his useful comments on the first draft of this paper.

3
Contents
Introduction ......................................................................................................................... 4
1.Trade and the location of production.............................................................................. 5 1.1 Evolution of Trade with Accession Countries ............................................................... 5
Increasing trade between EU-15 and AC-8.................................................................... 5 Product composition of trade with accession countries .................................................. 7
1.2 FDI in Accession Countries.........................................................................................10 1.3 Evolution of the Specialization of Accession Countries ...............................................13
2. Sectoral Patterns............................................................................................................18 2.1 The Automobile Industry.............................................................................................18
European integration ....................................................................................................18 The automobile intra-European trade ...........................................................................20 Post-enlargement dynamics .........................................................................................21
2.2 Information and Communication Technologies ...........................................................22 ICT in Europe ...............................................................................................................23 The location of production of computer hardware in Europe .........................................26 The production networks and trade in mobile phones...................................................30
2.3 Textiles and Clothing ..................................................................................................35 EU Trade in textiles and clothing ..................................................................................35 Vertical intra-European trade in textiles and clothing ....................................................36 Post-enlargement dynamics .........................................................................................38
Conclusion: Race to the bottom vs. Race to the top .......................................................40
References..........................................................................................................................42
Appendix 1. Definition of ICT.............................................................................................45
Appendix 2: Specialization Index......................................................................................46

4
Introduction
A fundamental objective of the latest wave of enlargement was to help the accession countries to complete the transition to democracy and market economy. These countries are numerous, but also poor compared with the EU-15. This results in a paradox: the EU wants to contribute to their development, but the Western members often fear that they may represent too much of a burden for their own economies and the European budget. This paradox first surfaced during the negotiation phase, in particular about the common agricultural policy and the issue of net transfers to the future members. Since enlargement on the 1st of May 2004, the public debate has shifted to the issue of wage and tax dumping, which would be used by accession countries to attract production facilities and jobs away from the EU-15. Current debates on migration are much less important than on trade, FDI and the potential relocation of economic activities in the new members. This is partially due to the fact that migration has not been fully liberated yet.1
The adjustment process, in particular through increased trade and foreign direct investment, has already taken place to a large extent, first, because since the 1990s, trade agreements with accession countries had already reduced the cost of trade with the EU-15, and second, because, as for previous waves of enlargement, commitment to accession had been a major step and had stimulated companies to integrate the future members in their regional and global strategies. Despite increased trade with accession countries, flows remain modest. This is partly due to the small size of the accession countries, which represent a mere 5% of the Union’s GDP. In 1986, Spain and Portugal represented 8.4% of the European Community’s GDP. It is possible to belittle the consequences of enlargement, as adjustment has already partly taken place and as the new members are small economies. This paper nevertheless suggests that enlargement can have an important impact on EU-15 countries as it takes place at the same time as the emergence of other new competitors on global markets. These evolutions combine to lead companies to re-organize their global production and supply networks in order to benefit both from cost-efficient locations and easy access to growing markets.
The paper argues that some division of labor has developed between EU-15 and accession countries since the 1990s. It nevertheless emphasizes the fact that enlargement should be analyzed as part of the context of globalization, in which competitive pressures from (extra-EU) emerging countries will continue to grow on both old an new EU members. As a result, the EU-15 should keep moving up the value chain and specialize more in high-tech sectors in order to develop more complementarity with accession countries and extra-EU emerging countries. Such a move should ease the problem of relocation and allow EU-15 countries to export more to emerging countries and benefit from their fast growing economies. The analysis is based first on the examination of EU trade and FDI patterns and second on sectoral studies of the automobile industry, the information and communication technologies (ICT) and the textile and clothing industry. The conclusion comes back to the debate on relocation and its economic policy implications.
1 The European Council agreed on transitional periods (a maximum length of seven years after accession). Although not all EU Members will apply for transitional periods, the two most heavily affected countries, Austria and Germany, have already announced that they plan to. Empirical studies of potential migration to the EU-15 (Boeri and Brücker 2001, Sinn and alii 2003, Alvarez-Plata et al. 2003), estimate the annual increase of immigration from CEECs between 290,000 and 335,000 persons, with Germany receiving the largest number of immigrants (180,000 to 220,000).

5
1. Trade and the location of production
Since the 1960s, increasing intra-European trade has been largely intra-industry trade. It has thus promoted intra-industry specialization within Europe. Regional integration has enabled companies to reap larger economies of scale and has helped Europe to remain competitive in a number of mass production sectors, such as the automobile industry. Increasing trade with accession countries should lead to more inter-industry and vertical trade. Trade with accession countries should thus generate vertical specialization, as is more generally the case in world trade between countries of different levels of development (Sachwald 2004).
In order to check the characteristics of trade with the new members, this part first examines the general evolution of trade and FDI with accession countries. It then analyzes more precisely the specialization of accession countries in relation with firms’ strategies.
1.1 Evolution of Trade with Accession Countries
Trade between EU-15 and accession countries has been increasing steadily since the 1990s, but the overall flows remain modest. Besides, trade with other regions have also been very dynamic.
Increasing trade between EU-15 and AC-8
Trade between the accession countries and the EU has increased rapidly from the early 1990s on. CEECs have massively shifted their trade flows towards the EU (figure 1). This remarkable evolution may be simply interpreted as catching up with previously constrained trade flows between two geographically, culturally and historically close regions.
Figure 1. Share in EU-25 exports, in % of total, 1991-2001
Source : Calculation from CHELEM (CEPII)
Increasing trade between the EU and accession countries has compensated the decrease in intra-EU15 trade during the 1990s (figure 2). Moreover, exports from EU-15 to accession countries have been stagnating in recent years. This may be due to the insufficient adaptation to the local demand by EU-15 exports (Aussiloux and Pajot 2003). The decreasing share of intra-EU-25 trade is nevertheless strongly influenced by the dynamism of trade with extra-European countries, and in particular with China.
0
1
2
3
4
5
6
7
1991 1992 1993 1994 1995 1996 1997 1998 1999 2000 2001
Intra AC-8 exports AC-8 exports to EU-15 EU-15 exports to AC-8

6
Figure 2. Share of intra-EU exports, in % of total exports by EU-15 and EU-25
Source: calculation from CHELEM (CEPII)
Figure 3a shows that the share of China in EU-15 trade is smaller than the share of accession countries, but has become more dynamic since the late 1990s. Imports from China have been particularly dynamic since the mid-1990s. Figure 3a also shows that Germany is the main EU trade partner with the accession countries. Their share in German exports and imports has reached 8% in 2002. This is much higher than their share in French trade, with 3% of exports and 2% of imports. The share of accession countries in EU-15 exports is 4.7% and 4.1% in imports.
Figure 3a. EU-15 Trade with AC-8 and China, 1993-2003 (Share, in % of world total)
AC-8 China Source: Calculation from COMEXT
Figure 3b further shows that EU trade balance is positive with accession countries, while it is increasingly negative with China. The figure nevertheless shows that the excess of exports over imports with AC-8 has been decreasing since the peak in 1997-98. The drop in the trade surplus of Germany partially explains this evolution. In 2003, Germany has had a trade deficit with AC-8. It is interesting to notice that since 2003, Germany has on the contrary substantially reduced its trade deficit with China. The difference in the dynamics of German trade between AC-8 on the one hand and China on the other hand is due to rapidly increasing exports to China. Over the last few years, exports to AC-8 have been somewhat less dynamic than imports.
50.0
55.0
60.0
65.0
70.0
1991 1992 1993 1994 1995 1996 1997 1998 1999 2000 2001
Intra EU-25 Intra EU-15
0.0
1.0
2.0
3.0
4.0
5.0
6.0
7.0
8.0
9.0
1988 1990 1992 1994 1996 1998 2000 2002
EU - X EU - MFrance - X France - MGermany - X Germany - M
0.0
0.5
1.0
1.5
2.0
2.5
3.0
3.5
1988 1990 1992 1994 1996 1998 2000 2002
EU - X EU - MFrance - X France - MGermany - X Germany - M

7
Figure 3b. Trade Balance with AC-8 and China, 1993-2003 (€ Billion)
Source: calculation from COMEXT
Product composition of trade with accession countries
Despite their small share in total EU-15 trade, accession countries represent a substantial share of imports in specific sectors, with strongly increasing shares between 1993 and 2003. Table 1 shows that this is the case in two types of sectors: traditional sectors for which AC-10 have favorable factor endowments (labor- and resource-intensive sectors) and sectors for which multinational companies have been integrating the accession countries in their European division of labor. Most of these imports represent limited value, but some nevertheless represent substantial trade flows. They are indicated in bold characters in table 1.
Table 1 also shows that Germany and France do not import intensely the same products from accession countries. This should be related to the generally stronger trade relationships between Germany and AC-10, but also to firms’ strategies. Imports of TV sets by France for example should be related to the organization of production on a European scale.
-5.0
0.0
5.0
10.0
15.0
20.0
25.0
1988 1991 1994 1997 2000 2003
France / AC-10Germany / AC-10EU-15 / AC-10
-9.0-8.0-7.0-6.0-5.0-4.0-3.0
-2.0-1.00.0
1.0
1988 1991 1994 1997 2000 2003-60.0
-50.0
-40.0
-30.0
-20.0
-10.0
0.0
France / ChinaGermany / ChinaEU-15 / China (right scale)

8
Table 1. Strongest market positions by AC-10 in EU-15 imports, 1993 and 2003 (In % of total EU-15 imports, and amount in 2003)
Source: Calculation from COMEXT
The product composition of trade with AC-8 has substantially changed over the last decade. Table 2a indicates the change in the structure of imports from AC-8. It shows that only two products belong to the main imports list in 1993 and 2003: motor vehicle and furniture (indicated in bold characters). Furniture belongs to AC-8 traditional exports and also represents a strong market position in EU-15 imports (table 1). The increasing share of motor vehicles and parts in AC-8 exports reflects on the contrary the evolution of CEEC’s trade specialization. Indeed, the initial dominance of labor-intensive final goods in their exports has diminished as the share of technology and skilled-labor intensive products moved up (Kaminsky and Ng 2001). Moreover, the 10 main imports represent a substantially larger share of total imports from AC-8 in 2003. As a result, imports by EU-15 from AC-8 are now more concentrated on skilled-labor and scale-intensive products.
EU-15 1993 2003 € 000245 Fuel wood (excluding wood waste) and wood charcoal 20.4 36.2 87 938246 Wood in chips or particles and wood waste 2.3 34.8 163 959711 Vapour generating boilers, auxiliary plant; parts 6.8 31.5 159 794322 Briquettes, lignites and peat 24.3 30.4 134 845811 Prefabricated buildings 20.8 28.4 315 806325 Coke & semi-cokes of coal, lign., peat; retort carbon 20.6 28.1 496 755773 Equipment for distributing electricity, n.e.s. 6.5 23.4 3 247 242635 Wood manufacture, n.e.s. 12.6 23.3 1 503 253247 Wood in the rough or roughly squared 5.5 20.5 599 853821 Furniture & parts; bedding & similar stuffed furni. 8.6 20.3 5 857 758Total imports from AC-10 2.0 4.6
Germany 1993 2003 € 000322 Briquettes, lignites and peat 83.3 79.3 40 964711 Vapor generating boilers, auxiliary plant; parts 21.6 65.6 45 685811 Prefabricated buildings 32.1 54.8 203 039325 Coke & semi-cokes of coal, lign., peat; retort carbon 47.6 53.6 326 442269 Worn clothing and other worn textile articles; rags 10.5 50.5 19 791245 Fuel wood (excluding wood waste) and wood charcoal 35.1 48.4 20 751635 Wood manufacture, n.e.s. 22.5 46.2 759 990773 Equipment for distributing electricity, n.e.s. 16.3 45.3 1 924 846791 Railway vehicles & associated equipment 13.2 44.0 405 631691 Structures & parts, n.e.s., of iron, steel, aluminium 16.5 44.0 632 712Total imports from AC-10 4.4 10.6
France 1993 2003 € 000711 Vapor generating boilers, auxiliary plant; parts 2.7 37.7 18 743245 Fuel wood (excluding wood waste) and wood charcoal 2.9 25.8 4 761761 Television receivers, whether or not combined 0.0 17.5 249 854345 Coal gas, water gas & similar gases (excluding hydrocar.) 0.0 15.8 3044 Maize (not including sweet corn), unmilled 3.9 14.6 17 544322 Briquettes, lignites and peat 3.1 13.2 9 688881 Photographic apparatus & equipment, n.e.s. 0.2 13.0 55 215629 Articles of rubber, n.e.s. 0.8 11.7 87 429289 Ores & concentrates of precious metals; waste, scrap 0.6 11.7 8 288635 Wood manufacture, n.e.s. 3.2 11.6 80 447Total imports from AC-10 1.0 2.3
9
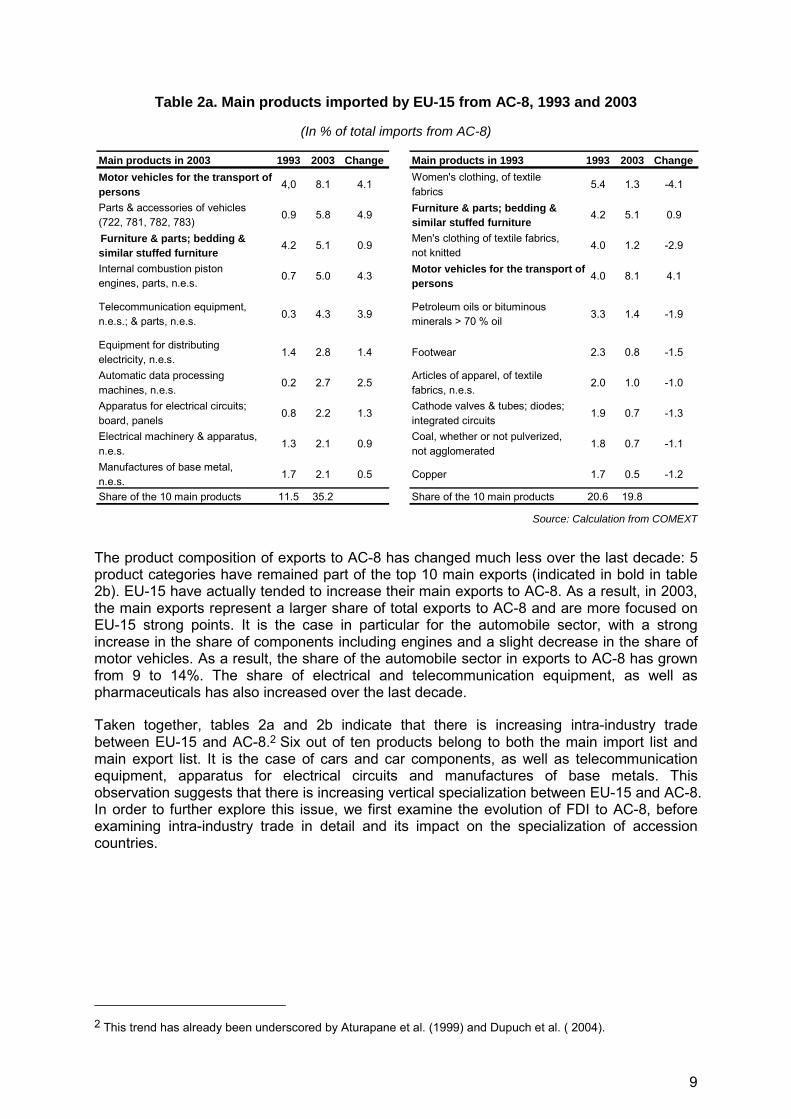
Table 2a. Main products imported by EU-15 from AC-8, 1993 and 2003
(In % of total imports from AC-8)
Source: Calculation from COMEXT
The product composition of exports to AC-8 has changed much less over the last decade: 5 product categories have remained part of the top 10 main exports (indicated in bold in table 2b). EU-15 have actually tended to increase their main exports to AC-8. As a result, in 2003, the main exports represent a larger share of total exports to AC-8 and are more focused on EU-15 strong points. It is the case in particular for the automobile sector, with a strong increase in the share of components including engines and a slight decrease in the share of motor vehicles. As a result, the share of the automobile sector in exports to AC-8 has grown from 9 to 14%. The share of electrical and telecommunication equipment, as well as pharmaceuticals has also increased over the last decade.
Taken together, tables 2a and 2b indicate that there is increasing intra-industry trade between EU-15 and AC-8.2 Six out of ten products belong to both the main import list and main export list. It is the case of cars and car components, as well as telecommunication equipment, apparatus for electrical circuits and manufactures of base metals. This observation suggests that there is increasing vertical specialization between EU-15 and AC-8. In order to further explore this issue, we first examine the evolution of FDI to AC-8, before examining intra-industry trade in detail and its impact on the specialization of accession countries.
2 This trend has already been underscored by Aturapane et al. (1999) and Dupuch et al. ( 2004).
Main products in 2003 1993 2003 Change Main products in 1993 1993 2003 ChangeMotor vehicles for the transport ofpersons
4,0 8.1 4.1Women's clothing, of textilefabrics
5.4 1.3 -4.1
Parts & accessories of vehicles(722, 781, 782, 783)
0.9 5.8 4.9 Furniture & parts; bedding &similar stuffed furniture
4.2 5.1 0.9
Furniture & parts; bedding &similar stuffed furniture
4.2 5.1 0.9Men's clothing of textile fabrics,not knitted
4.0 1.2 -2.9
Internal combustion pistonengines, parts, n.e.s.
0.7 5.0 4.3 Motor vehicles for the transport ofpersons
4.0 8.1 4.1
Telecommunication equipment,n.e.s.; & parts, n.e.s.
0.3 4.3 3.9Petroleum oils or bituminousminerals > 70 % oil
3.3 1.4 -1.9
Equipment for distributingelectricity, n.e.s.
1.4 2.8 1.4 Footwear 2.3 0.8 -1.5
Automatic data processingmachines, n.e.s.
0.2 2.7 2.5Articles of apparel, of textilefabrics, n.e.s.
2.0 1.0 -1.0
Apparatus for electrical circuits;board, panels
0.8 2.2 1.3Cathode valves & tubes; diodes;integrated circuits
1.9 0.7 -1.3
Electrical machinery & apparatus,n.e.s.
1.3 2.1 0.9Coal, whether or not pulverized,not agglomerated
1.8 0.7 -1.1
Manufactures of base metal,n.e.s.
1.7 2.1 0.5 Copper 1.7 0.5 -1.2
Share of the 10 main products 11.5 35.2 Share of the 10 main products 20.6 19.8

10
Table 2b. Main products exported by EU-15 to AC-8, in 1993 and 2003
(In % of total exports to AC-8)
Source: Calculation from COMEXT
1.2 FDI in Accession Countries
FDI to CEECs has been strongly increasing during the second half of the 1990s. Figure 3 shows that the rate of increase has been slowing down over the last couple of years. FDI to AC-8 has actually seriously decreased in 2003, before increasing again in 2004. 3 This evolution corresponds both to the general decrease in world FDI and to the specific situation of CEECs. In CEECs, a substantial share of FDI flows has resulted from large acquisitions, which have been part and parcel of the privatization process, including in particular in services. As the privatization process subsides, there is naturally less scope for these foreign acquisitions. For industry, FDI which has been attracted by free access to the EU market and developing local markets has also taken place before 2004.
3 According to (Hunya and Stankovsky 2004), it could reach the 1998-99 level in 2004.
Main products in 2003 1993 2003 Change Main products in 1993 1993 2003 changeParts & accessories of vehicles(722, 781, 782, 783)
2.6 7.2 4.6 Motor vehicles for the transport ofpersons
5.7 4.8 -0.9
Motor vehicles for the transport ofpersons
5.7 4.8 -0.9 Parts & accessories of vehicles(722, 781, 782, 783)
2.6 7.2 4.6
Apparatus for electrical circuits;board, panels
1.5 2.9 1.4Other machinery for particularindustries, n.e.s.
2.5 1.8 -0.7
Telecommunication equipment,n.e.s.; & parts, n.e.s.
1.9 2.7 0.8Fabrics, woven, of man-madefabrics
2.5 0.8 -1.7
Cathode valves & tubes; diodes;integrated circuits
2.1 2.5 0.4 Cathode valves & tubes; diodes;integrated circuits
2.1 2.5 0.4
Medicaments (incl. veterinary) 1.8 2.5 0.7 Telecommunication equipment,n.e.s.; & parts, n.e.s.
1.9 2.7 0.8
Manufactures of base metal,n.e.s.
1.1 2.4 1.2 Medicaments (incl. veterinary) 1.8 2.5 0.7
Paper and paperboard 1,0 2,0 1,0Heating & cooling equipment &parts thereof, n.e.s.
1.5 1.2 0.7
Internal combustion pistonengines, parts, n.e.s.
0.7 2,0 1.3Petroleum oils or bituminousminerals > 70 % oil
1.5 1.3 -0.3
Articles of plastics of base metal,n.e.s.
1.3 1.9 0.5Apparatus for electrical circuits;board, panels
1.5 2.9 1.4
Share of the 10 main products 18.7 26.9 Share of the 10 main products 23.6 27.7

11
Figure 3. Evolution of the stock of FDI in accession countries (Stock in € billion left scale and rate of growth right scale)
Source: calculation from WIIW
Slovenia is in a specific position. It is richer country, which had implemented restrictive regulations against FDI. As a result, Slovenia had received relatively little FDI during the 1990s (Picciotto 2003). In 2000, Slovenia has been starting a program to lift obstacles to FDI and has been receiving increasing flows of foreign investment. Figure 4 nevertheless shows that FDI intensity remains lower in Slovenia than in other accession countries. Hungary’s attractiveness has been increasing too, including for greenfield operations when the privatization process has been completed. As a result, Hungary’s FDI intensity is second only to Estonia’s.
Figure 4. FDI intensity in accession countries (FDI stock as a % of GDP)
Source: Based on data from Hunya and Stankovsky (2004)
0
20
40
60
80
100
120
140
160
1994 1995 1996 1997 1998 1999 2000 2001 2002 2003 0%
10%
20%
30%
40%
50%
60%
70%
AC-5 AC-8 grow th rate AC-5 grow th rate AC-8
0
10
20
30
40
50
60
70
CzechRepublic
Hungary Poland Slovakia Slovenia Estonia Latvia Lithuania AC-5 AC-8
1994 1998 2003

12
Germany is by far the main investor in accession countries, with 21% of FDI stocks in AC-8. The Netherlands come second, but their share is artificially inflated by the foreign holding companies investing from the Netherlands. Due to the presence of numerous holding companies in the Netherlands, the share of Dutch FDI is overestimated. The two next main EU investors are Austria and France with each about 8% of total stocks of FDI in AC-8. Then comes the United States with 7% of FDI stocks. Figure 5 shows the share of accession countries in FDI by developed countries has substantially increased during the 1990s. It further shows that Germany is the country for which accession countries represent the highest share of world outward FDI. A comparison with figure 2a suggests a correlation between the share of accession country in total FDI and in total trade.
Figure 5. Share of FDI Stock in AC-5*, by country of origin (In % of world FDI Stock)
*Hungary, Poland, Czech Republic, Slovakia and Slovenia.
Source : calculation from OCDE
Figure 6 shows that the main investors differ from one accession country to another. Germany is the first investor in Hungary and Slovakia, while Austria is the first investor in Slovenia and Sweden is the first investor in Estonia. These patterns are closely related with the location strategies of firms from countries of origin, which will be explored more precisely in the second section with sectoral case studies.
0.0
0.5
1.0
1.5
2.0
2.5
3.0
3.5
4.0
4.5
France Germany Italy Sw eden United States
1992 2001

13
Figure 6. Main investors in AC-8 in 2002 (FDI stock in % of total in host countries)
Source: Based on data from Hunya and Stankovsky (2004)
In a survey conducted in 2000 by ERBD, 50% of the 400 firms surveyed considered market access as their first motivation for their investment in CEECs (Picciotto 2003). About 50% of FDI is in manufacturing sectors, including 30% of horizontal type and 20% in labor-intensive industries of vertical type (EU 2001). Vertical FDI responding to the relative factor endowments should stimulate FDI further in clothing, leather, metal working and household equipment. Horizontal FDI will interact with growth and the expectation that chances for long-run catch-up growth are good will act as a major stimulus for FDI, which in turn should contribute to growth. Business has generally considered that actual membership of the EU a credible enforcer and stabilizer of the regime change in CEECs, and thus actual entry should further stimulate both types of FDI (ERT 1999, 2001). Membership could also stimulate extra EU FDI, in particular from Japanese and Korean firms. In the 1990s, Japanese multinationals have established production units in CEECs in order to supply intermediary goods to their western affiliates.4 More recently, Japanese and Korean firms have also invested in CEECs in the electronic and automobile industries.
1.3 Evolution of the Specialization of Accession Countries
Traditionally, the European peripheral countries tend to attract labor-intensive and low-tech activities whereas high-tech, high-skill labor or scale-intensive activities tend to agglomerate in core regions (Midelfart-Knarvik et al. 2002). As we have seen above, this traditional pattern is only partly true in the case of accession countries as their specialization has tended to evolve towards more high-skilled and scale-intensive products during the 1990s. The structure of trade between EU-15 and accession countries has been strongly influenced by the specialization of EU-15 through FDI.
4 Sachwald (2004) has documented the case of consumer and professional electronics, based on survey data on French intra-firm trade.
0
10
20
30
40
50AC-8
Czech Rep.
Hungary
Poland
SlovakiaSlovenia
Estonia
Latvia
Lithuania
Germany France Sweden Austria USA

14
In 1999, 74% of Hungarian exports, 71% of imports and 41% of the trade deficit originated from foreign firms. The same items were respectively 52, 56 and 62% for Poland (Picciotto 2003). The general trend of increasing vertical intra-industry and intra-firm trade with CEECs has been documented in particular in the case of France (Sachwald 2004) and Germany (Marin 2004). Table 2 above has also showed that a number of products appear simultaneously as the main exports and main imports in trade between EU-15 and accession countries. The same pattern can be observed in trade between accession countries and France or Germany. The coincidence between main imports and exports is also stronger in 2003 than it was in 1993.
Intra-industry trade thus also has an increasing impact on the trade balance between EU-15 and accession countries. Table 3 shows the products which exhibit the largest positive or negative impact on the trade balance with AC-10. The main positive impact is due to pharmaceuticals, which reflects the specialization of EU-15 in this industry. The next two sectors generating trade surplus with accession countries are car components and electronic components. These surpluses result from intra-industry vertical trade with accession countries. Intra-industry vertical trade in the automobile industry now results in a substantial trade deficit in cars; the second largest deficit after furniture. Table 3 shows that most of this deficit comes from imports of vehicles by Germany. Trade in completed vehicles still generates a surplus for France. Vertical specialization in consumer electronics also results in a deficit for television sets. In this case, both Germany and France exhibit a deficit. France also has a deficit in professional electronics, which is due to vertical trade (Sachwald 2004).
Telecommunication equipment also exhibits an important trade deficit with accession countries. Table 3 shows that this deficit does not come mainly from Germany or France; it probably comes from Scandinavian countries specialized in telecommunications. This hypothesis will be examined below with the case study devoted to mobile phone. Finally, the evolution between 1993 and 2003 (not shown in table 3) indicates that imports in computers from accession countries have been growing rapidly and have been influencing negatively the trade balance, even though as of 2003, the EU does not experience a major deficit for computers. The case of computers will also been examined in more details in the next section.

15
Table 3. Largest contributions to the trade balance with AC-10 in 2003 (€ billion)
EU-15Positive impact on trade balance 2003 Negative impact on trade balance 2003
542 Medicaments (incl. veterinary) 2.9 821 Furniture & parts; bedding & similar stuffed furni. -4.5
776 Cathode valves & tubes; diodes; integrated circuits
2.4 781 Motor vehicles for the transport of persons
-3.4
784 Parts & accessories of vehicles (722, 781, 782, 783)
2.2 713 Internal combustion piston engines, parts, n.e.s.
-3.2
728 Other machinery for particular industries
1.4 761 Television receivers, whether or not combined
-1.7
782 Motor vehic. for transport of goods, special purpo. 1.4 764 Telecommunication equipment & parts -1.6
533 Pigments, paints, varnishes and related materials 1.4 773 Equipment for distributing electricity,
n.e.s. -1.5
582 Plates, sheets, films, foil & strip, of plastics
1.3 635 Wood manufacture, n.e.s. -1.3
641 Paper and paperboard 1.3 248 Wood simply worked and wooden railway sleepers
-1.2
759 Parts, accessories for machines of groups 751, 752 1.1 842 Women's clothing, of textile fabrics -1.1
772 Apparatus for electrical circuits; board, panels 1.1 841 Men's clothing of textile fabrics, not
knitted -1.1
Germany Positive impact on trade balance 2003 Negative impact on trade balance 2003784 Parts & accessories of vehicles (722, 781, 782, 783) 1.7 821 Furniture & parts; bedding & similar
stuffed furni. -2.7
776 Cathode valves & tubes; diodes; integrated circuits
0.9 781 Motor vehicles for the transport of persons
-2.6
542 Medicaments (incl. Veterinary) 0.7 713 Internal combustion piston engines, parts
-1.9
582 Plates, sheets, films, foil & strip, of plastics
0.7 773 Equipment for distributing electricity -1.0
533 Pigments, paints, varnishes and related materials 0.6 752 Automatic data processing machines -0.8
728 Other machinery for particular industries 0.6 635 Wood manufacture, n.e.s. -0.7
641 Paper and paperboard 0.5 761 Television receivers, whether or not combined
-0.6
772 Apparatus for electrical circuits; board, panels
0.5 842 Women's clothing, of textile fabrics -0.5
657 Special yarn, special textile fabrics & related 0.5 841 Men's clothing of textile fabrics, not
knitted -0.5
598 Miscellaneous chemical products, n.e.s. 0.4 716 Rotating electric plant & parts thereof, -0.4

16
Source: calculation from COMEXT
Trade deficit with accession countries also results from imports of traditional products, such as wood manufacture or clothing. It is interesting to notice however, that the deficit in women’s clothing has been decreasing between 1993 and 2003. For Germany, it is also the case of men’s clothing.
The evolution of revealed comparative advantages (RCA) confirms these observations. The upper part of table 4 shows that furniture is the strongest RCA of accession countries in their trade with EU-15. But it also shows that accession countries have been specializing in the automobile industry over the last decade, transforming a comparative disadvantage into a comparative advantage. The same pattern may be observed in telecommunication and data processing equipment. Specialization in traditional labor-intensive manufactures has on the contrary decreased.
FrancePositive impact on trade balance 2003 Negative impact on trade balance 2003781 Motor vehicles for the transport of persons 0.8 821 Furniture & parts; bedding & similar
stuffed furni. -0.3
542 Medicaments (incl. Veterinary) 0.6 761 Television receivers, whether or not combined
-0.2
776 Cathode valves & tubes; diodes; integrated circuits
0.3 682 Copper -0.1
591 Insectides & similar products, for retail sale
0.2 763 Sound recorders or reproducers; television record.
-0.1
553 Perfumery, cosmetics or toilet prepar. (ex. soaps) 0.2 842 Women's clothing, of textile fabrics -0.1
784 Parts & accessories of vehicles (722, 781, 782, 783) 0.2 562 Fertilizers (other than those of group
272) -0.1
782 Motor vehic. for transport of goods, special purpo.
0.2 775 Household type equipment, electrical or not
-0.1
741 Heating & cooling equipment & parts thereof, n.e.s.
0.1 334 Petroleum oils or bituminous minerals > 70 % oil
-0.1
598 Miscellaneous chemical products, n.e.s. 0.1 778 Electrical machinery & apparatus,
n.e.s. -0.1
772 Apparatus for electrical circuits; board, panels 0.1 635 Wood manufacture, n.e.s. -0.1

17
Table 4. Evolution of the specialization* patterns of AC-10 in their trade with EU and the World
Trade of Ac-10 with EU-15 1993 2003 Change821 Furniture & parts; bedding & similar stuffed furni. 3.1 4.0 0.9781 Motor vehicles for the transport of persons -1.7 3.3 5.0713 Internal combustion piston engines, parts, n.e.s. 0.0 3.0 3.0764 Telecommunication equipment, n.e.s.; & parts, n.e.s. -1.6 1.6 3.1761 Television receivers, whether or not combined 0.0 1.5 1.4773 Equipment for distributing electricity, n.e.s. 0.4 1.4 1.1635 Wood manufacture, n.e.s. 1.5 1.1 -0.4752 Automatic data processing machines, n.e.s. -1.2 1.0 2.2248 Wood simply worked, and railway sleepers of wood 1.3 1.0 -0.3842 Women's clothing, of textile fabrics 5.0 1.0 -4.0
Trade of AC-10 with World 1992 2002 Change821 Furniture and parts thereof 1.9 3.3 1.4781 Passengr motor vehicl, exc bus -0.6 2.5 3.1713 Intern combust piston engines -0.1 1.7 1.8761 Television receivers -0.1 1.2 1.3784 Motor vehicl parts, acces nes 0.0 1.1 1.1773 Electricity distributing equip 0.2 1.0 0.8635 Wood manufactures nes 1.2 1.0 -0.3764 Telecom equip, parts, acces -1.2 0.9 2.1793 Ships, boats, etc 1.3 0.8 -0.5843 Women's outwear non-knit 2.8 0.8 -2.0 *See appendix 2 for the definition of the specialization indicator.
Source: calculation from COMEXT data for trade with EU-15 and UNCTAD date for trade with world.
The lower part of table 4 further shows that the overall specialization of accession countries is strongly influenced by their trade with the EU – which is logical given its weight in their world trade. One exception is computers, where specialization seems to be focused on trade within the EU-25. Another one is shipbuilding, for which trade on the contrary takes place with extra-EU partners.
These different evolutions in trade patterns suggest that accession countries have indeed shifted their specialization towards rather up-market and medium-to-high technology industries. Moreover, these evolutions are clearer in their trade with the EU, which suggests that the process of enlargement and the related increasing trade and FDI flows have contributed to the upgrading of accession countries’ specialization. This seems to exclude the scenario in which lower trade barriers would lock accession countries in specialization in traditional sectors.5 Upgrading in skilled-labor-intensive sectors is probably sustained by the level of training in accession countries since a relatively large share of the population between 25 and 34 has an upper secondary education (Artus 2004a; Picciotto 2003)
Overall, actual enlargement will not generate an upsurge in FDI in the new member states. Rather, multinationals are adjusting their structure to the new requirements of the enlarged European economic space. They specialize, close down, or expand production at various sites in the new member states and also transfer production to them. Labor cost advantage in comparison with EU15 will remain for quite some time after enlargement and attract further
5 Dupuch et al. (2004) discuss this scenario as one hypothesis suggested by some economic geography models, but conclude that for most accession countries it is less probable than the upgrading scenario, which involves more intra-industry trade.

18
FDI from western Europe, in particular in the skilled-labor-intensive sectors we have identified in this section. At the same time, the new members will lose low-tech labor-intensive manufacturing to countries further east or to Asian competitors, which also constitutes the continuation of the specialization trends that emerged in the late 1990s.
Beyond overall patterns, it is clear that industrial specialization varies among EU 15 and among CEECs. The next section explores these differences by studying specific sectors.
2. Sectoral Patterns
This second part explores in more detail three industrial sectors: the automobile industry, ICT, and the textile and clothing industry. In each case it analyzes the interactions between firms’ strategies and trade patterns. It also discusses the respective role of market seeking and cost efficiency motivations in firms’ location decisions.
2.1 The Automobile Industry
Automobile is a major European industry and any impact that enlargement has on it will be of considerable importance. Moreover, the automobile industry has been at the forefront of the European integration since the 1960s, and again with the most recent enlargement as the accession states have already been integrated into the pan-European activities of the carmakers and component suppliers.
The West European car market is the world’s largest, with about 15.5 million units a year. The accession countries will add a little less than a million to that total. Since the 1990s, the automobile industry has maintained its importance in the EU economy, with relatively dynamic sales and fairly successful international expansion. Over the last decade, the location of new investment by European carmakers has nevertheless clearly shifted towards accession countries. The latter have also been chosen to site new factories by a number of Asian carmakers, which are increasing their investments and market share in Europe.
European integration
The European automobile industry has been progressively integrated since the 1960s and each enlargement has extended the geographical scope of this integration. Investment in greenfield sites and purchase of local operations in CEE countries started in the early 1990s and much of the entry effects have been anticipated. As CEE countries signed various agreements with the EU during the 1990s 6 , the integration process has been further facilitated. Table 5 shows that since the 1990s, most new car plants have been located in Eastern Europe, including Eastern Germany in the case of Volkswagen, GM and Porsche. Besides, West European carmakers have also acquired local brands, such as Skoda and Dacia. Both Volkswagen and Renault have substantially invested in their new affiliates in order to modernize the production facilities and train the workforce. Skoda now has an annual production capacity of about 500,000 cars. In 2003, Dacia produced about 70,000 cars and Renault has increased the production capacity of the Pitesti factory to produce 200,000 units of the Logan, aimed at emerging markets. As a result of these large investments, local production now reaches 1.3 million cars a year. If the announced capacity expansion (table 5) effectively comes on stream, automobile production in the AC-5 (Poland, Czech Republic, Slovakia, Slovenia and Hungary) will double by 2007 to 2.6 million cars (Heymann 2004).
6 Starting in 1995, a zero tariff regime has been applied to imports into the EU.

19
Table 5. New car plants in Europe 1990-2006
Sources: CCFA (2004), Rhys (2004)
Since the early 1990s, the accession countries have thus been progressively integrated into the “European motor industry” (Rhys 2004). German carmakers have been the first to locate new production capacities in Eastern Europe. This is due both to geographical proximity and to the major crisis experienced by the German car industry in the early 1990s. The German carmakers have been obliged to clamp down on costs to restore their international competitiveness and relocation of production to eastern Europe should be interpreted as part of this effort. Apart from geographical proximity, the attractiveness of eastern European countries has resulted from the very good level of automobile-specific training and an increasingly stable political situation.
The types of cars and components being produced reflect the dual motivation for investing in CEECs: low costs and increasing local demand. Cost factors have been strongly emphasized, but the potential for demand growth in catching-up countries has also been an important factor of attraction for new investments. The cost and demand factors combine to explain that a number of production units in accession countries tend to be specialized in small cars and low cost cars. Demand for cars in these countries focuses on the small and lower middle-class segments, which accounts for 70 to 80% of the total new registrations (Heymann 2004). Fiat has been using Poland to source its mini car and Renault will source the Logan from Romania. Major new investments by PSA and Toyota are also geared to making small cars. These cars correspond to the purchasing power of local customers. They also tend to be relatively labor intensive as the labor content does not increase proportionately with the size and sophistication of cars. It seems thus logical to produce smaller models in low-wage countries. The ability of a carmaker to locate production of a given model in CEECs then also depends on its existing European organization of production. VW and GM for example had already been concentrating the production of their small models in Spain.
VW 1990 Zwickau, East Germany Cars : 250,000VW 1990 Chemnitz, East Germany Engines : 400,000VW 1993 Poznan, Poland Cars, vans : 150,000 VW Seat 1993 Matorell, Spain Cars : 50,000 (in 2001)VW 1993 Bratislava, Slovakia Cars : 250,000VW 1999 Polkowice, Poland Engines : 540,000VW 2002 Dresden, East Germany Cars : 50,000GM 1992 Eisenach, East Germany Cars : 550,000GM 1992 Szentgotthàrd, Hungary Mainly engines : 1,220,000 GM 1998 Gliwice, Poland Cars : 100,000 (in 2001)Ford 1990 Hungary ComponentsFord 1992 Plonsk, Poland Cars : 10,000 (in 2000) BMW 2005 Leipzig, East Germany Cars : 150,000Fiat 1990 Tychy, Poland Cars : 200,000Hyundai-Kia 2006 Zilina, Slovakia Cars : 200,000Mercedes 1992 Rastatt, West Germany CarsMicro Compact Car Smart 1997 Hambach, France Cars : 200,000
Porshe 2002 Leipzig, East Germany Cars : 30,000PSA Toyota 2005 Kolin, Czech Republic Cars : 300,000PSA 2006 Trnava, Slovakia Cars : 300,000Suzuki 1992 Esztergom, Hungary Cars : 100,000Toyota 2001 Onnaing, France Cars : 210,000Toyota 2004 Poland Cars : 250,000
LocationStarting date Company of production Nature and annual capacity

20
Rhys (2004) suggests that the labor cost argument may be overdone as the labor content is relatively low in the car industry: 10% of assembly costs and 5 to 7% in the manufacture of engines. Labor cost may nevertheless remain a relevant factor as competition is tightening and the wage differential remains substantial between Eastern and Western Europe. Besides, in some cases, a large wage differential actually leads carmakers to reduce automation of assembly lines in low-wage countries. Some of the new plants in CEECs have similar capital-to-labor ratios as other EU factories, but Renault has limited automation at Dacia in Romania, where wages are 14 times lower than in France.7 As a result of lower automation, the Pitesti factory has 13,000 employees in two shifts to produce 100,000 cars a year. This can be compared with Flins in France, where 5,000 employees produce 300,000 cars a year (Fainsilber 2004). Flexibility is a complementary factor having an impact on labor costs. French carmakers have implemented the 35 hour week, but have negotiated more flexibility with the unions, which can constitute an advantage in comparison with German carmakers. In addition to very high wages in the West German car industry, this may partially explain the different attitude German and French carmakers have been showing recently about relocation of production in the accession countries.
The automobile intra-European trade
The location of car factories in CEECs has progressively attracted component manufacturers to supply local assembly lines. A large number of component suppliers now have locations in CEECs. West European suppliers have a larger presence, but American and Japanese competitors have also a number of locations in CEECs. Besides, since a number of Eastern Europe car factories are relatively small, carmakers have been concentrating the manufacture of some major components such as engines in a limited number of locations, in order to maximize economies of scale. The new geography of the car industry in Europe thus generated increasing trade flows between the EU and accession countries, in both cars and components (Figure 6a).
Figure 6a. Automobile trade of the EU with AC-10, 1993-2003, euro bn
Source: COMEXT
Figure 6a shows that car imports from AC-10 have been much more dynamic than exports. The increasing trade deficit of the EU with accession countries results from the fact that a large share of production from new facilities in AC-10 is being exported. Export of car components to AC-10 has increased more quickly than imports, resulting on the contrary in a trade surplus. As a result of these evolutions, since 2001, the EU has a trade deficit with AC-10 in the automobile industry.
7 150 euros a month.
0.0
2.0
4.0
6.0
8.0
10.0
1993 1995 1997 1999 2001 2003
Cars ExportsCars Imports
0.0
2.0
4.0
6.0
8.0
10.0
1993 1995 1997 1999 2001 2003
Components ExportsComponents Imports

21
The EU trade deficit actually largely comes from trade between Germany and AC-10. The two main EU car producers, Germany and France, are in quite different situations. Germany, which is a global exporter of cars,8 has a swelling trade deficit with CEECs, while France has a surplus. Figure 6b shows that the location of German carmakers in eastern Europe has resulted in increasing trade deficit in cars since the late 1990s. This trend has been compensated by a trade surplus in components, but component imports are now increasing too. As a result, in 2003 Germany has had a deficit for its overall car trade with AC-10.
Figure 6b. Automobile trade between Germany and AC-10, 1993-2003, euro bn
Source: COMEXT
The new eastern factories of French carmakers have not yet come on stream, which is why France still has a trade surplus in cars with AC-10 (figure 6c). This situation could change over the next few years as the new facilities from Renault, PSA and Toyota will produce new models for exports to France9.
Figure 6c. Automobile trade between the France and AC-10, 1993-2003, euro bn
Source: COMEXT
Post-enlargement dynamics
The car market of accession countries should reach 1.4 million units in 2014. Despite vigorous growth, eastern Europe will not be able to rise beyond its niche position with the
8 Overall, in 2003, the German automotive sector generated a foreign trade surplus of EUR 72 bn, accounting for about 55% of the country’s total export surplus in manufacturing (Heymann 2004). 9 Table 5 includes the Romanian production capability of Renault.
0.0
1.0
2.0
3.0
4.0
5.0
6.0
1993 1995 1997 1999 2001 2003
Cars ExportsCars Imports
0.01.02.03.04.05.06.07.0
1993 1995 1997 1999 2001 2003
Components ExportsComponents Imports
0.00.20.40.60.81.01.21.4
1993 1995 1997 1999 2001 2003
Cars Exports Cars Imports
0.00.10.20.30.40.50.60.70.8
1993 1995 1997 1999 2001 2003Components Exports
Components Imports

22
EU-25. Production capacity is expected to grow even more dynamically and reach 3.5 million units by 2014.10 Few new sites will be built because of previous investment since the 1990s and the fact that accession countries are not the only areas attractive to investors, but the factories coming on stream will progressively reach their optimum operational capacity utilization. Moreover, some units should enjoy productivity increases. The gap between local consumption and production means that a substantial part of production will be exported. Accession countries should thus become more tightly integrated into the trans-European car industry networks. At the same time, their specialization in automobiles should increase yet further, both for cars and components (table 3 above). Progressively, related design and R&D activities should reinforce local capabilities, which may create strong centers of competence. The west of Slovakia could become such a center of competence.
The continuing expansion of car production in accession countries means that the relocation of production from western to eastern Europe will progress. Capacity reduction in the EU-15 should however set in only progressively. As a result, capacities will increase faster in eastern Europe than they will be downscaled in the west. As a consequence, both eastern and western production facilities will feel strong pressure to increase productivity. The experience of previous enlargements suggests that marginal facilities for which economies of scale are insufficient will have to close (Rhys 2004). Recent evolution has shown that Portugal and even Spain have lost production volume to eastern Europe. Heightened competition and tighter integration will also require productivity increases in accession countries. The Czech Republic and Slovakia can draw on a tradition of automobile production to further progress. The challenge may be more difficult for Poland, where large improvements in applied technology and in supplier networks will be necessary in order to keep up in terms of cost and quality.
Overall, enlargement should expand and strengthen the EU car industry. The expansion of their production network to integrate lower cost countries should enable carmakers to strengthen their competitiveness. European carmakers and component suppliers will nevertheless have to simultaneously face the challenge of deepening globalization. New production capacities in eastern Europe and a number of large emerging countries will exacerbate the problem of global excess capacity, which is estimated at 25 to 30%. In Europe, EU producers will have to face increasing pressure from Japanese carmakers, which also invest in accession countries. As a result, profitable operations will only result from continuous productivity improvements and good design capability. Cost pressures will also be passed on to component suppliers, where wage costs account for a higher share than at carmakers. In the medium to long range, both car and component production capabilities will shift eastward, but the process will be gradual and will contribute to the competitiveness of the EU-25 car industry.
2.2 Information and Communication Technologies
Since the 1980s, ICT has rapidly globalized as an increasing number of countries have been involved in ever more complex international value chains. Outsourcing of production by American producers, in particular, has led to the relocation of activities to a number of emerging economies. In the 1990s, production has spread to yet other locations through relocation by American, Japanese, and European firms. Some activities have also been shifted from emerging countries to lower cost locations. As a result the production of ICT, which belongs to high-tech industries, is now widely spread among emerging countries in Asia (China, Singapore), Latin America (Mexico, Brazil) and Eastern Europe (Hungary, Czech Republic, Estonia, Poland). Most recently, the emergence of China as a major producer has attracted much attention, but it should be seen in this wider historical context. It
10 This forecast is for AC-5 (Heymann 2004), and thus does not take Romania into account.

23
has tended to both increase further the competitive pressure and refine the regional and international division of labor in ICT.
In 2002, China, Japan, and the United States are the main exporters of ICT. China has become the first exporter over the last decade, with a share of world exports increasing from 2 to 15% (table 7). The share of Japan in world exports of ICT has, on the contrary, decreased substantially, from 23 to 11%. The share of some European countries has also increased remarkably. Among EU countries, it is the case of Ireland, and especially Finland. It is also the case of a number of CEECs, especially Hungary.
Table 7. Countries’ exports and imports of ICT, 1992 and 2002
1992 2002 1992 2002 1992 2002 1992 2002 China 5.0 68.2 1.9 15.4 4.6 31.2 1.6 5.9 Japan 61.4 50.3 23.2 11.3 9.5 34.0 3.3 6.5 United States 38.2 49.8 14.4 11.2 63.4 146.0 22.3 27.7 Korea, Republic of 9.6 36.5 3.6 8.2 3.3 10.3 1.2 2.0 United Kingdom 16.6 35.8 6.3 8.0 21.0 37.9 7.4 7.2 Singapore 20.3 33.5 7.7 7.5 11.0 20.3 3.9 3.9 Germany 17.7 33.0 6.7 7.4 29.0 42.9 10.2 8.2 Mexico 5.0 30.4 1.9 6.8 4.8 16.8 1.7 3.2 Ireland 4.9 18.9 1.8 4.2 2.7 10.2 1.0 1.9 France 11.2 17.6 4.2 4.0 15.7 22.6 5.5 4.3 Finland 1.5 8.6 0.6 1.9 1.4 3.2 0.5 0.6 Canada 5.3 8.2 2.0 1.8 9.9 17.5 3.5 3.3 Hungary 0.3 7.8 0.1 1.8 0.8 4.5 0.3 0.8 Sweden 3.9 7.3 1.5 1.7 4.1 6.2 1.4 1.2 Philippines 0.6 7.1 0.2 1.6 0.8 4.5 0.3 0.9 Italy 5.9 6.0 2.2 1.4 10.4 14.9 3.7 2.8 Denmark 1.4 4.4 0.5 1.0 2.5 5.5 0.9 1.1 Czech Republic 0.0 3.5 0.0 0.8 0.0 3.4 0.0 0.6 Israel 1.1 3.4 0.4 0.8 1.0 2.6 0.3 0.5 Austria 2.2 2.9 0.8 0.7 3.3 4.7 1.2 0.9 Poland 0.1 1.6 0.0 0.4 0.9 3.5 0.3 0.7 Turkey 0.2 1.6 0.1 0.4 0.9 2.1 0.3 0.4 Switzerland 1.3 1.3 0.5 0.3 4.2 5.9 1.5 1.1 Australia 0.6 1.3 0.2 0.3 4.5 8.0 1.6 1.5 Costa Rica 0.0 0.9 0.0 0.2 0.1 0.5 0.0 0.1 Norway 0.7 0.9 0.2 0.2 1.8 3.0 0.6 0.6 China, Hong Kong SAR 4.3 0.8 1.6 0.2 14.2 43.4 5.0 8.2 Estonia 0.0 0.6 0.0 0.1 0.0 0.4 0.0 0.1 Romania 0.0 0.5 0.0 0.1 0.3 1.0 0.1 0.2 Slovakia 0.0 0.4 0.0 0.1 0.0 0.8 0.0 0.2
Exports Importsbn of dollars % of world bn of dollars % of world
Source: UNCTAD
ICT in Europe
ICT is one important sector in European industry, but with wide differences in the degree of specialization between countries. Ireland, Finland and to a lesser extent Hungary have been increasing their specialization in ICT (table 8).

24
Table 8. Share of ICT value added in total business sector
1995 2000Ireland 14.8 16.5*Finland 8.4 15.6United States 9.4 11.1Hungary - 10.6*Kingdom 9.4 10.4Netherlands 9 10.3Belgium 8.4 10.1Japan 7.5 9.5Czech Rep. 4.5 8.8Norway 7.1 8.6Denmark 7.9 8.5France 8.0 8.4Portugal 7.4 8.3Austria - 8.2Spain 6.2 7.9Italy 6.2 7.0Germany 5.6 6.2Slovakia 4.6 5.4 * value for 1999.
Source : OECD
Table 9 shows that different European countries are specialized in different ICT products. Telecommunication equipment is the main sector for most European countries, and is particularly important in Finland and Austria. The share of computing is highest for Ireland, Hungary, and the Netherlands. Instruments remains a strong sector, especially in Germany and the Netherlands.
Table 9. Share of different industries in ICT (in % of total ICT production)
Office, accounting and computing machinery
Insulated wire cable
Radio, television and communication equipment
and apparatus
Instruments and appliances for measuring,
checking, testing, navigating
UE-15 15 5 60 20UE-25 16 6 59 20
Germany 17 5 47 30Austria 2 6 83 8Denmark 17 5 55 23Finland 2 2 94 2France 16 5 54 18Hungary 40 7 44 9Ireland 45 2 50 3Netherlands 34 14* 15 32Poland 7 21 51 21Czech Rep. 6 16 56 22Kingdom 17 5 55 23 * Does not include sound and image recording.
Source: European Commission
These profiles are reflected in trade performances (table 10). Overall, telecommunication equipment is a strong sector for European countries. Finland, Hungary, and Estonia have remarkably increased their market share and specialization in this sector. But larger, more

25
traditional producers such as the UK, Germany, and France have also strengthened their position. The market share of EU-15 has grown from 31 to 41% of world exports and that of accession countries has grown from less than 1% to nearly 4%.
European performance is much weaker in all the other ICT sectors. TV and radio have become dominated by emerging countries over the last decade, including in particular Mexico and China. Japan is the only developed country that keeps a substantial market share, especially in TV. Japan also keeps a very high market share in sound recording, but, here again, China has become a major competitor. In these three media equipment sectors, CEECs, and especially Hungary, have substantially increased their market share and specialization over the 1990s. In data processing equipment, China has remarkably increased its market position, partly to the detriment of Japan. The position of Europe has weakened, except for three countries which have become specialized in the production of personal computers, Ireland, Hungary and the Czech Republic.
Table 10. World market shares and country export share of ICT sectors
1992 2002 1992 2002 1992 2002 1992 2002
Philippines 0.2 3.6 1.8 12.8 Costa Rica 0.0 1.0 0.0 18.1Singapore 12.4 12.3 15.4 12.4 Ireland 4.6 8.4 9.6 8.9Ireland 2.2 6.7 6.1 9.6 Singapore 4.8 10.5 4.5 7.9China 0.4 15.9 0.4 6.2 Korea, Republic of 1.4 8.5 1.1 4.9Mexico 0.6 7.3 1.0 5.8 China 1.0 14.9 0.7 4.3Hungary 0.0 1.5 0.1 5.4 Philippines 0.0 1.6 0.2 4.2Korea, Republic of 2.7 6.5 2.8 5.1 Japan 18.4 14.9 3.2 3.3Czech Republic 1.4 4.8 United Kingdom 6.7 7.2 2.1 2.3United Kingdom 8.5 7.4 3.5 3.2 United States 18.7 14.1 2.6 2.1Japan 20.2 8.8 4.7 2.7 Hong Kong 3.3 0.4 6.5 2.0United States 19.2 13.2 3.5 2.6 Hungary 0.0 0.6 0.1 1.7EU(25) 32.4 30.4 1.6 2.0 Mexico 0.9 2.9 1.1 1.7European Union 32.3 27.3 1.6 1.9 European Union 33.2 26.6 1.2 1.4Hong Kong 0.6 0.2 1.4 1.5 Czech Republic 0.6 1.4Germany 6.6 7.2 1.2 1.5 Israel 0.2 0.4 0.7 1.4France 4.7 3.5 1.6 1.4 EU(25) 33.3 27.9 1.2 1.4Austria 0.4 0.7 0.7 1.2 Denmark 0.5 0.6 0.7 1.1Sri Lanka 0.0 0.0 0.0 0.9 Germany 5.5 5.6 0.8 0.9Denmark 0.4 0.4 0.7 0.8 Austria 0.6 0.6 0.8 0.8Sweden 0.8 0.4 1.1 0.6 France 4.2 2.4 1.1 0.7
752 Automatic data processing equip
759 Office, adp machy parts,
acces
Share in world exports
Share in country exports
(in %) (in %)
Share in world exports
Share in country exports
(in %) (in %)

26
1992 2002 1992 2002 1992 2002 1992 2002
Mexico 7.9 27.4 2.9 4.2 Mexico 6.9 18.8 2.0 1.1Turkey 1.1 5.9 1.3 4.1 Israel 1.0 3.1 1.1 1.0Poland 0.0 4.4 0.0 2.7 China 11.2 31.8 1.7 0.9Hungary 0.1 2.2 0.2 1.6 Hungary 0.0 3.1 0.0 0.9Korea, Republic of 9.1 8.5 2.0 1.3 Singapore 13.1 6.0 2.7 0.5Czech Republic 1.8 1.2 Philippines 0.4 1.3 0.5 0.3Japan 14.3 15.3 0.7 0.9 Andorra 0.0 0.0 0.0 0.3Slovakia 0.5 0.8 Korea, Republic of 8.9 3.6 1.5 0.2China 4.3 9.8 0.8 0.7 Japan 21.8 8.5 0.9 0.2Belarus 0.1 0.2 0.3 0.7 Denmark 0.4 0.9 0.1 0.2Romania 0.0 0.3 0.0 0.5 France 1.9 4.7 0.1 0.1Denmark 0.6 1.1 0.2 0.5 Germany 3.6 7.8 0.1 0.1Slovenia 0.1 0.2 0.2 0.5 United States 2.9 7.4 0.1 0.1Singapore 7.8 2.4 2.1 0.5 South Africa 0.3 0.1France 4.9 5.6 0.4 0.4 EU(25) 13.7 18.8 0.1 0.1EU(25) 31.0 25.6 0.3 0.3 European Union 13.6 15.3 0.1 0.1United Kingdom 5.9 3.8 0.5 0.3 Czech Republic 0.3 0.1Sweden 0.3 1.0 0.1 0.3 Sweden 0.1 0.5 0.0 0.1European Union 30.6 16.5 0.3 0.2 Latvia 0.0 0.0 0.1 0.0Germany 6.0 3.4 0.2 0.1 United Kingdom 1.1 0.8 0.1 0.0
762 Radio-broadcast receivers
Share in world exports
Share in country exports
(in %) (in %)761 Television
receivers
Share in world exports
Share in country exports
(in %) (in %)
1992 2002 1992 2002 1992 2002 1992 2002
Japan 46.1 41.2 2.3 2.2 Finland 1.1 5.1 3.2 18.4China 1.9 28.7 0.4 2.0 Estonia 0.0 0.3 0.2 12.4Hungary 0.1 2.8 0.1 1.8 Hungary 0.3 2.4 2.0 11.3Andorra 0.0 0.0 0.0 1.3 Korea, Republic of 3.4 9.8 3.0 9.8Korea, Republic of 8.7 8.3 1.9 1.2 Israel 0.8 1.5 4.2 8.1Singapore 8.0 5.1 2.2 0.9 Sweden 3.8 3.7 4.6 7.3Slovakia 0.2 0.3 China 2.0 12.6 1.6 6.2Mexico 0.8 1.7 0.3 0.2 United Kingdom 4.9 10.9 1.7 6.0Denmark 0.3 0.5 0.1 0.2 Mexico 2.1 5.8 3.1 5.8United Kingdom 3.2 2.1 0.3 0.2 Denmark 0.9 1.8 1.5 5.2Sweden 0.1 0.5 0.0 0.1 Singapore 4.2 3.4 4.5 4.4EU(25) 19.6 11.1 0.2 0.1 EU(25) 31.6 44.2 1.3 3.7United States 2.8 3.1 0.1 0.1 European Union 30.9 40.6 1.3 3.6Ireland 0.0 0.4 0.0 0.1 Romania 0.0 0.3 0.1 3.0Germany 6.4 2.7 0.3 0.1 France 4.2 5.2 1.2 2.8European Union 19.5 8.0 0.2 0.1 United States 14.2 10.7 2.3 2.7France 2.7 1.2 0.2 0.1 Ireland 0.6 1.5 1.4 2.6Austria 2.9 0.2 1.1 0.1 Japan 25.9 6.7 5.2 2.6Czech Republic 0.1 0.1 Germany 8.0 9.6 1.3 2.5Israel 0.0 0.1 0.0 0.1 Austria 0.7 1.1 0.8 1.9
(in %) (in %)
Share in world exports
Share in country exports 764 Telecom
equip, parts, acces
Share in world exports
Share in country exports763 Sound
recorders, phonographs (in %) (in %)
* See appendix 1 for the precise definition of ICT based on UNCTAD data. Source: UNCTAD
The location of production of computer hardware in Europe
Ireland has become specialized in the production of computers as a consequence of relocation of production, mainly by American multinationals.11 Ireland has attracted American and European multinationals because it accumulated a host of favorable factors: good infrastructure and integration into the EU, high qualification and productivity of the workforce, moderate wages and attractive company taxation. In 1999, Ireland manufactured 33% of the PCs sold in Europe (Barry and Curran 2004). Since Ireland has become a location for
11 Almost 90% of computer hardware employment in Ireland is in foreign-owned firms, predominantly American (Barry and Curran 2004).

27
computer production though, the industry has kept moving along its life cycle and firms have looked for lower-skill locations. In this context, enlargement has meant new opportunities for firms to relocate assembly to CEECs (Dedrick and Kraemer 2002a). This section examines to what extent Ireland will suffer from enlargement through relocation of computer production to new members, especially Hungary, which is the most specialized in the sector.
Figure 7. Imports and exports of Ireland in data processing equipment ($ Billion)
Source: OECD
Figure 7 shows that Ireland has steadily increased its exports of computers to the EU over the 1990s and until the early 2000s recession. Ireland has also increased its exports of components to the EU. Extra-EU exports of components have also been very dynamic. They have compensated the slight decrease in exports of computers at the beginning of the 2000. Extra-EU trade flows depend heavily on exchanges with the United-States: they have decreased as a destination of computers, but have increased their share in Irish exports of components since the late 1990s (table 11). Finally, extra-EU imports of components have increased steadily since the early 1990s. The bulk of components used to come from the United States, the UK, and Japan, but their share has been decreasing to the benefit of China, Taiwan, and France.
EU-15
0
1
2
3
4
5
6
7
8
9
1992 1993 1994 1995 1996 1997 1998 1999 2000 2001 2002
Imports of automatic data processing machinesExports of automatic data processing machinesImports of parts and accessoriesExports of parts and accessories
World minus EU-15
0
1
1
2
2
3
3
4
4
5
1992 1993 1994 1995 1996 1997 1998 1999 2000 2001 2002
Imports of automatic data processing machinesExports of automatic data processing machinesImports of parts and accessoriesExports of parts and accessories

28
Table 11. Main trade partners of Ireland in computers (In % of total import or export)
Source: ITCS, OCDE
Overall, trade and production data suggest that Ireland has been moving up the value chain in computers. Ireland was first an assembly site and imported components from the United States and the UK. But as a number of Asian emerging countries have entered the market and cost competitiveness increased, especially after the crisis in the early 2000s, Ireland has shifted from computer assembly to producing components. Much of the production of peripherals has shifted to Asia, and a substantial share of computer assembly moved to CEECs (Barry and Curran, 2004). As a consequence, the Irish authorities have been supporting an upgrading move by investing in tertiary education and keeping up the effort to attract foreign investment. Intel investment in a new microprocessor production unit in 2004 has received financial support from the Irish Development Authority. 12 So has Hewlett Packard’s R&D center located at Leixlip (DREE 2004).
Dell’s strategy illustrates the trajectory followed by firms in the computing sector. Increased global competition as well as emerging local demand has triggered the search for new locations in eastern Europe. Dell has located factories in Hungary, Poland and the Czech Republic. It has also a commercial unit in Slovakia in charge of after-sale service for Eastern Europe and Africa (Jerinte 2004). At the same time, Dell reduced its employment in Ireland by 600 in 2001. Dell now has about 4,500 employees in Ireland. Limerick site (3,000 employees) is in charge of production, R&D, and sales through a call center. Bray and Cherrywood (1,500 employees) are specialized in finance, administrative, commercial, and technical services. Dell imports components such as CD-ROM peripherals and integrated circuits from Asia and has them assembled by contract manufacturers (Dedrick and Kraemer 2002b). In Hungary for example, Flextronics has four assembly sites with 9,000 employees, representing 15% of its world production capacity (Binder, 2001). Dell keeps control of the final assembly stage and testing.
Hungary has been a major beneficiary of relocation of assembly operations from Ireland. As CEECs started their transition to the market economy, Hungary became particularly attractive because of its lower wages,13 but also because of its past experience in the production of electronics within the COMECON. Early on foreign companies such a as Dell and IBM bought several Hungarian production units (Minefi 2002). Figure 8 shows that Hungarian exports of computers to EU countries have been very dynamic since late 1990s. The picture is quite different for extra-EU trade. Figure 8 and table 12 indicate that Hungary has stopped exporting computers to the United States. Increasing imports come from China. As a result, extra-EU trade balance in computers is negative. The trade balance in
12 «Intel investit 2 milliards de $ en Irlande et ajoute une unité de fabrication 300 mm»,http’//www.eetimes.fr 19 May 2004. 13 In 2000, the average hourly wage in industry was 4 times lower than in Ireland (CE 2003).
Imports Imports Imports Exports Exports Exports1992 1997 2002 1992 1997 2001
United States 31.7 26.2 18.3 United Kingdom 18.4 24.9 32.4United Kingdom 22.5 14.1 16.8 Germany 14.5 16.0 15.1France 3.8 6.8 11.9 France 15.6 10.3 9.6China 0.1 0.9 9.9 Netherlands 6.8 12.8 8.6Chinese Tapei 3.3 7.2 8.8 United States 14.1 4.6 2.2Hong Kong China 2.0 0.8 5.6 Sweden 4.2 2.9 4.0Korea 0.2 3.6 4.0 Spain 3.5 1.6 2.8Japan 14.7 8.5 3.6 Italy 5.8 2.3 2.9Netherlands 6.6 1.9 3.3 Belgium 2.4Germany 5.7 1.8 2.7 Japan 1.5 0.4 3.2
752 Automatic data processing machines, n.e.s.75997 Parts, accessories of the machines of group 752

29
components is also negative, but decreasingly so.
Figure 8. Imports and exports of Hungary in data processing equipment
($ Billion) Source: ITCS, OECD
During the 1990s, China became by far the main source of computer components for Hungary, while the share of Germany, the United States and Mexico dropped (table 12). Hungary focuses on assembly of computers for which it has been a cost competitive location (DREE 2001). Hungary, as other accession countries, has nevertheless experienced some relocation to China. IBM for example, has relocated its Hungarian manufacturing unit of hard disk drives (in Székesfehérvár) and has laid off 3,700 employees.14 In 2002, Flextronics has relocated its manufacturing of Microsoft Xbox set top from Hungary and Mexico to China (DREE 2002). This relocation has led to the suppression of 1,100 jobs in Hungarian facilities.15
Table 12. Main trade partners of Hungary in computers (In % of total import or export)
Source: ITCS, OCDE
Fears of EU countries losing jobs to new members in ICT sectors may thus be misplaced. As illustrated by the case of Ireland, increased competition has led European countries to move up the value chain towards sophisticated components and R&D. Since 1995, assembly has been partly relocated in accession countries, but high-end production activities and related services have remained geographically more stable. As a result, during the 1990s, net job
14 DREE (2002), Ricard (2004). 15 « Flextronics supprime 1100 emplois en Hongrie », L’Usine Nouvelle, 16 mai 2002.
EU-15
0
0.5
1
1.5
2
2.5
1993 1994 1995 1996 1997 1998 1999 2000 2001 2002 2003
Imports of automatic data processing machinesExports of automatic data processing machinesImports of parts and accessoriesExports of parts and accessories
World minus EU-15
0
0.2
0.4
0.6
0.8
1
1.2
1993 1994 1995 1996 1997 1998 1999 2000 2001 2002 2003Imports of automatic data processing machinesExports of automatic data processing machinesImports of parts and accessoriesExports of parts and accessories
Imports Imports Imports Exports Exports Exports1993 1998 2003 1993 1998 2003
China 0.5 9.4 25.7 Germany 12.9 14.0 33.1Italy 1.3 6.8 18.7 Netherlands 0.8 22.3 17.9Germany 18.7 32.0 6.6 Austria 3.5 0.4 17.1Japan 2.0 4.5 5.5 United Kingdom 6.0 8.8 6.3Malaysia 0.0 3.4 5.1 France 3.4 1.2 4.6Indonesia 0.0 0.0 4.9 Spain 0.0 0.1 3.7Mexico 10.3 4.5 United States 2.3 24.8 3.6United States 20.4 11.0 4.5 Italy 0.7 0.6 3.3Chinese Tapei 10.9 0.7 4.0 Belgium 1.1Ukraine 0.0 0.0 2.7 Denmark 0.2 0.0 1.1
752 Automatic data processing machines, n.e.s.75997 Parts, accessories of the machines of group 752

30
gains in the fabrication of microprocessors and other sophisticated components has more than compensated for the loss of jobs in computer equipment (Barry et Curran, 2004). If the emerging division of labor between EU countries and accession countries is to be strengthened, the former should nevertheless keep their efforts up. The repositioning of Ireland for example has been possible because of the local availability of adequately trained engineers. Ireland has the highest proportion of graduates in mathematics, science and technology in Europe - 23.2 % as opposed to 3.7 % in Hungary (Dunne, 2001). This keeps productivity much higher than in accession countries (CE, 2003). Ireland is now increasing its investments in R&D in order to boost productivity yet further and face a possible reduction in the availability of engineers (DREE 2004). Finally, the country also enjoys good infrastructure, which is central to speed up communication and distribute products to Europe.
Besides, wages tend to increase more rapidly in accession countries than in EU-15, which tends to erode the cost-competitiveness of production in new members. This convergence movement will nevertheless increase standards of living and stimulate local demand. Overall, western and eastern European producers may find complementary positions along the computer value chain. Trade data have nevertheless shown that the EU-25 is definitely not a closed regional market for computers. Both the United States through multinational companies and Asian manufacturers are major actors in the global supply chain. As a result, producers from EU-15 and from accession countries are not directly in competition, but the latter may be in competition with Chinese manufacturers for some products. Both western and eastern European producers are included in global value chains and have to keep their competitiveness up as part of these chains. This may be particularly difficult as the main brands in this sector are either American or Asian. European firms should make the most of the persistent need to regionalize at least part of the value chain in order to tailor products to local market demand.
The production networks and trade in mobile phones
Over the 1990s, European companies have been leaders in the dynamic mobile phone market. The first part of table 13 shows that there are three European companies among the first five producers of mobile phone terminals.16 Tough competition and new entrants result in quite volatile market shares among the leaders: since the late 1990s, the share of Ericsson has been divided by three, while that of Samsung has more than doubled and that of Siemens has quadrupled. Mobile phones is a high-tech sector where innovation and new product generation offer windows of opportunity for new entrants. European companies have taken advantage of the second generation of mobile phones, but Samsung may be in a good position for the third generation and its company structure may be an advantage in an era when different technologies are converging. The Korean producer specializes in internet-enabled, color-screen camera phones. In 2004 Samsung has nearly caught up with Motorola with a market share of 13.5%. Besides, LG has now entered the leaders’ league, with a market share of 7% for the 4th quarter of 2004.17
16 Ericsson has teamed with Sony in 2001. 17 The data for 2004 are taken from Strategy Analytics, quoted in Les Echos, Oct. 27 2004.

31
Table 13. Leading mobile equipment manufacturers
a. Top five manufacturers in mobile phones (global market share in %)
b. Top five manufacturers in mobile networks (global market share in %) Source: IDATE (2003) and Gartner (2004) for 2003.
Table 13 shows that the European leadership is also strong in mobile network equipment, where the main competitors are from North America. This is because competitiveness depends relatively more on accumulated technological capabilities in telecommunication than in the handset segment.
In the handset segment, competition depends both on innovativeness and on costs. As a result, European leaders have progressively integrated CEECs into their production networks. Moreover, as in the rest of the electronic industry, they have increasingly out-sourced manufacturing operations to contract manufacturers, which themselves have been developing rapidly in CEECs from the second half of the 1990s on (Radosevic 2002). In 2001, about a quarter of mobile phones was produced by contract manufacturers and this share could reach nearly 40% by 2007.18 In a number of cases, contract manufacturers have acquired production facilities from leading brands. Alcatel, Ericsson, Nokia, and Siemens, for example, have sold production units to contract manufacturers.
Ericsson has been largely outsourcing the manufacturing of its mobile phones in CEECs, so that its local subsidiaries are mainly involved in services. More generally, leading brands tend to outsource manufacturing in order to focus on R&D and the introduction of new generations of products as well as high end manufacturing. Nokia still manufactures the majority of its mobile phones, including in Finland where it has not closed factories and in major markets such as the United States (table 14). Nokia nevertheless focuses on the latest assembly stages and on the integration of software in the phone (Collen 2004). The objective is to manufacture close to market. In Europe, it has three major production sites, Finland, Germany, and Hungary, while the British site is dedicated to the high-end Vertu subsidiary.
18 Strategy Analytics, 2002, «Wireless Device Strategies», downloadable from http://www.strategyanalytics.com
Firm Country of origin 1998 2001 2003
Nokia Finland 26 35 35Motorola USA 20 15 15Samsung Korea 5 7 11Siemens Germany 2 7 8Sony Ericsson Sweden 16 7 5
Firm Country of origin 1998 2001 2003
Sony Ericsson Sweden 34 31 24Nokia Finland 8 11 14Siemens Germany 4 8 12Lucent USA 14 10 11Nortel Canada 10 12 11

32
Table 14. Production and R&D locations of Nokia
Source: www.nokia.com
Outsourcing has stimulated the location of mobile production in accession countries and in particular Hungary and Estonia. Elcoteq, the Finnish contract manufacturer illustrates the evolution of the location of production in mobile phones. Its case is interesting first because it is from European origin and second because it focuses on telecommunication. Table 15 shows that in Europe Elcoteq concentrates high volume production in its Estonian and Hungarian sites. Moreover, the production of the Finnish plant in Espoo is being relocated to Estonia. Production in Western European countries focuses on new product introduction (NPI) and low to medium volume. Table 15 also indicates that the recently opened sites in China specialize on high volume production. Elcoteq is also opening a new site in India.
Table 15. Production sites of Elcoteq
Source: http://www.elcoteq.com
The evolution of the location of production changes the trade patterns of the main EU producers of mobile phones. Figure 9 clearly shows that Estonia has quickly become the main exporter to Finland. The share of Hungary has also substantially increased in Finnish imports and less so in German imports. The shares of China in Finnish imports and of Korea in Swedish ones have also increased recently. The volatility of import shares in all three countries suggests that competition in tough, both for the finished phones (from Korea or Germany) and on the outsourcing markets.
Country Number of employee
% of total employment
Activity
Finland 22,300 49.7 Production, R&DUSA 6,600 14.7 Production, R&DChina 4,600 10.2 Production, R&DGermany 3,500 7.8 Production, R&DHungary 2,600 5.8 Production, R&DUK 1,900 4.2 R&DBrazil 1,400 3.1 ProductionMexico 1,300 2.9 ProductionSouth Korea 700 1.6 Production
Plant Country Founded/acquired Arrea (m²) Staff Services
EuropeEspoo Plant Finland 2004 4 000 156 Low to medium volume productionLohja Plant Finland 1991 8 700 269 NPI center, low to medium volume productionTallinn Estonia 1992 42 000 3 092 NPI center,high volume productionSt.Petersbourg Russia 1997 2 500 238 Medium to high volume productionPécs Hungary 1998 46 000 4 751 High volume production, after-sales servicesÜberlingen Germany 2000 5 200 176 NPI center, low to medium volume productionOffenburg Germany 2003 15 000 338 NPI center, low to medium volume productionEurope Total 122 900 9 020
Asia-PacificDongguan China 1999 13 000 1 618 High volume productionBeijing Plants China 2000/2003 28 000 2 004 High volume production, NPI centerShengzen China 2003 8 800 1 314 High volume productionAsia-Pacific Total 49 800 4 936
AmericasMonterrey Mexico 1999 18 300 1 563 High volume production, NPI center

33
Figure 9. Origin of imports of mobile phones by Finland, Germany and Sweden
(In % of world trade)
The share of Austria in imports increases, mainly in Finland and Sweden. This may be explained both by the location of contract manufacturers (Flextronics) in Austria and by exports of printed circuit boards by AT&S, a major European producer. The Austrian firm produces state-or-the-art circuit boards, in particular for telecommunication equipment. Its clients are both telecommunication leaders and contract manufacturers. Austria has managed to attract some foreign production capacity in telecommunications because of its expertise in the field, but also because of its favorable geographic situation at the center of the EU-25 coupled with good infrastructure. Finally, Austria has also developed an attractive fiscal policy.
The evolution of the geography of production can also be observed through the trade balance of the major European producers of mobile phones (Figure 10). Finland has an increasing deficit with Estonia from which Nokia imports partly assembled phones. Sweden has reduced its deficit with Estonia, but increased its deficit with Austria and Korea. Finally, Germany is rapidly increasing its deficit with China.
Product 85252091: mobiles phones in the Combined classification
Source : calculations from COMEXT
Finland Imports
0.05.0
10.015.020.025.030.035.040.045.0
Estonia Austria Hungary China Germany Sweden
1996 1999 2003 Germany Imports
0.05.0
10.015.020.025.030.035.040.045.0
China UnitedKingdom
Denmark Hungary Austria Sweden
1996 1999 2003
Sweden Imports
0.05.0
10.015.020.025.030.035.040.045.0
Finland Austria South Korea Germany UnitedKingdom
Estonia
1996 1999 2003

34
Figure 10. Trade balance in mobile phones for Finland, Germany and Sweden ($ Million)
Source : calculations from COMEXT
Finland
-500-400-300-200-100
0100200300
1996 1997 1998 1999 2000 2001 2002 2003Austria Estonia Hungary China
Germany
-1 000-800-600-400-200
0200400
1996 1997 1998 1999 2000 2001 2002 2003
Denmark Austria Hungary China
Sweden
-350-300-250-200-150-100-50
050
100
1996 1997 1998 1999 2000 2001 2002 2003
Finland Estonia South Korea Austria
Trade balance with Eastern European countries does not only result from outsourcing by leading brands. Major producers also export phones to accession members, where the market for mobile phones is quite dynamic (DREE 2003). Poland thus represents an increasing share of German exports of mobile phones and Hungary an increasing share of Swedish exports. The location of Nokia in Hungary (table 14 above) generates both exports and local sales. In 2001, Nokia controlled 70% of the Estonian market for mobile handsets (DREE 2002).
The location of production in Europe by leading mobile phone producers results from both cost and market access determinants. Relocation to accession countries largely operates through outsourcing to contract manufacturers, while leading firms tend to locate new production sites close to dynamic markets. The possibility to relocate in accession countries nevertheless represents a potential threat for workers in the EU-15 and has been recently used by Siemens to renegotiate working conditions.19 This may actually be due to the global development of outsourcing networks, which increasingly include China and increase the competitive pressure along the entire value chain. In 2004, Alcatel has divested from mobile handset production through a joint-venture with TCL, the second Chinese manufacturer. TCL will now sell Alcatel branded handsets in order to gain market share in international markets. The joint venture, TCL Communication, aims at becoming the world’s fifth largest producer in the next few years.
Overall, enlargement has positive consequences for the EU mobile phone market. It increases the size of the European market with rapidly growing new countries where the rate
19 In 2004, Siemens has threatened to relocate production units in Hungary lest workers would accept longer working hours in order to reduce unit labor costs. Negotiations have resulted in a 40 hour week (instead of 35) without compensation.

35
of equipment is still relatively low. Besides, it will allow leading firms and contract manufacturers to deepen the vertical division of labor, which has been implemented since the 1990s within Europe. The examples of Nokia, Elcoteq and AT&S illustrate the possibility to develop complementary production activities in the EU-15 and the accession countries. EU-15 have now specialized in R&D, prototypes, design, marketing and the final stages of production including testing and incorporation of software. Increasing wages in accession countries will nevertheless require constant efforts to maintain competitiveness and relocations to lower costs emerging countries will take place for some products or part of the value chain.
2.3 Textiles and Clothing
The textile and clothing industry directly employed over 2 million in the EU in 2001, representing 7.4% of industrial employment (table 2a). The industry represented a lower share of production (2.4%) as a result of relatively low labor productivity. Besides, the weight of the textile industry varies widely across Europe. Textiles still accounts for more than 25% of employment in Portugal, while its share in value added is around 6% in Portugal and Italy. The comparison between Italy and Portugal indicates that labor productivity also varies widely between EU countries. Textiles as a labor-intensive industry is more important in accession countries, and particularly in Baltic countries. Table 16 also suggests that productivity varies substantially among accession countries.
Table 16. The textile and clothing industry in Europe, 2001
Turnover Employment Exports
% of GDP % of industrial employment % of total exports
France 2.1 5.3 4.1Germany 1.2 2.6 3.6Spain 2.6 9.4 4.4Italy 6.0 12.8 10.6Portugal 6.6 27.1 18.2EU-15 2.4 7.4 3.8
Czech Rep. 4.3 8.9 5.9Estonia 8.5 19.8 11.3Hungary 2.7 12.8 5.7Lithuania 5.8 24.5 15.9Latvia 4.6 16.5 5.9Poland 2.5 11.8 7.6Slovenia 7.0 12.6 7.7Slovakia 2.2 11.8 7.2
EU-25 2.4 8.2 7.1
Source : Eurostat
EU Trade in textiles and clothing
At the beginning of the 1990s, textiles and clothing was the biggest manufacturing sector of the candidate countries in EU imports. Table 17 above shows that in 1993 three clothing products were among the 10 largest imports from AC-8, representing 11% of the total imports by EU-15 from AC-8. Between 1993 and 2002, imports from accession countries have increased by 100%, but their market share in total imports EU-15 by only 25% (table 17). This is due to the fact that imports from other emerging zones have been more dynamic. Imports from Bulgaria and Romania have increased by 34% and imports from China increased by 73%. As a result, the share of China in EU-15 imports of textiles has grown from 6 to 10%. The share of Mediterranean countries has on the contrary decreased from 14 to 10% and is now lower than the share of China. Over the last couple of years, imports from

36
China have been particularly dynamic, including in comparison with imports from accession countries.
Table 17. EU-15 imports of textiles and clothing
bn $ Share of EU-15 imports from world bn $ Share of EU-15
imports from world bn $ Share of EU-15 imports from world
AC-10 3.9 4.9 7.0 6.0 7.9 6.1
Bulgaria 1.4 1.8 2.3 2.0 2.1 1.7Romania 1.5 1.9 2.0 1.7 1.8 1.4
Med.countries 11.0 13.9 14.8 12.5 12.9 10.0
China 4.9 6.2 7.8 6.6 13.4 10.4India 2.5 3.2 3.6 3.1 4.3 3.4Bangladesh 0.7 0.9 1.7 1.5 3.2 2.5Pakistan 1.2 1.5 1.7 1.4 2.2 1.7Hong Kong 2.9 3.6 2.7 2.3 2.1 1.6Indonesia 1.5 1.9 2.0 1.7 1.8 1.4Thailand 1.0 1.2 1.1 0.9 1.2 0.9
USA 1.5 1.9 2.1 1.8 1.2 0.9
INTRA EU-15 39.3 60.9 58.2EXTRA EU-15 40.3 57.4 71.1World 79.5 118.2 129.3
1993 1998 2003
The Mediterranean countries group includes the Association Agreements members: Algeria, Egypt, Israel, Jordan, Lebanon, Morocco, Syria, Tunisia, and Turkey.
Source: Eurostat
This evolution since the second half of the 1990s has to be related to increasing wages in accession countries. In the assembly stages of clothing, subcontracting with CEECs had intensified at the beginning of the transition process, especially under outward-processing trade.20 These operations, in clothing, but also footwear and electrical materials played a key role in the growth of manufacturing exports of these countries to the EU. Increasing labor costs have nevertheless made such advantages transitory for the most advanced accession countries.
Vertical intra-European trade in textile and clothing
The textile industry has one of the longest and most fragmented value chains. The main operations in textiles–spinning, weaving– are capital- and scale-intensive, while clothing is labor-intensive. As a consequence, textiles tends to be concentrated in advanced countries and clothing in developing countries. The need to closely follow the evolution of demand and to be very reactive nevertheless generates various sub-contracting strategies. European firms thus tend to sub-contract in Asia in order to minimize costs, but choose closer countries, around the Mediterranean or in Eastern Europe, whenever proximity and reactivity are important (Hanzl-Weiβ, 2004).
Over the transition period, specific trade agreements between the EU and CEECs have built incentives to generate a regional division of labor in the textile industry. EU countries
20 Trade regulation between the EU and accession countries were in favor of outward processing until 1997: special regulations exempted the value of processing components from import duties when they returned to the originating country in a further processed form. In 1997, tariffs on non-outward processing imports were also removed, which led to a shrinkage of outward processing (Hanzl-Weiß 2004).

37
exported textiles to CEECs, which in turn re-exported clothing to the EU. As a result, the EU has experienced an increasing gap between its comparative advantage in textiles and its comparative disadvantage in clothing (Fouquin et al. 2002).
During the 1990s, German and Italian industries have more particularly developed relocation and expansion in Central Europe as part of their restructuring strategies (Pelkmans 2002). This move was probably easier for German and Italian producers, which had a longstanding tradition of contracting with some Eastern countries (Hanzl-Weiß 2004). The trend was nevertheless quite general in European high wage countries. Trade with CEECs by firms located in France for example clearly exhibits a vertical intra-firm specialization pattern (table 18). Intra-firm exports to CEECs are mostly aimed at further processing in textiles (91%), and to a lesser extent in clothing (75%). On the contrary, most imports from CEECs are for direct sale without further transformation. In textiles and clothing, intra-firm trade nevertheless represent a small share of trade, as firms tend to out-source manufacturing directly to foreign firms.21
Table 18. Intra firm trade with AC-10 by firms located in France
Intra firm intensity
Share of resale (in % of total IF)
Share of transformation (in % of total IF)
Intra firm intensity
Share of resale (in % of total IF)
Share of transformation (in % of total IF)
Preparation and spinning of textile fibres 171 4.3 100.0 0.0 1.9 0.0 100.0Textile weaving 172 0.0 7.2 45.3 54.7Finishing of textile 173Manufacture of made-up textile articles, except apparel 174 44.6 99.4 0.6 43.5 7.6 92.4
Manufacture of other textiles 175 14.8 100.0 0.0 48.6 4.9 95.1Manufacture of knitted and crocheted fabrics 176 0.0 45.0 0.0 100.0
Manufacture of knitted and crocheted articles 177 0.0 4.7 100.0 0.0
Manufacture of leather clothes 181 0.0Manufacture of other wearing apparel and accessories 182 36.7 98.3 1.7 23.5 25.8 74.2
Dressing and dyeing of fur; manufacture of articles of fur 183
Tanning and dressing of leather 191Manufacture of luggage, handbags and the like, saddlery and harness 192 7.9 98.0 2.0 45.8 97.1 2.9
Manufacture of footwear 193 5.5 100.0 0.0 2.5 100.0 0.0
Manufacture of textile 17 20.5 99.5 0.5 29.2 8.4 91.6Manufacture of wearing apparel; dressing and dyeing for fur 18 36.6 98.3 1.7 23.4 25.8 74.2
Tanning, dressing of leather, luggage, handbags and footwear 19 5.7 99.7 0.3 5.2 98.2 1.8
Total Textile and Clothing 17+18 34.4 98.4 1.6 28.1 11.2 88.8
Imports from AC-10 Exports to AC-10
Source: Calculation based on SESSI data.
Trade with accession countries has been dynamic during the 1990s. As a result, accession countries have increased their market share in EU imports of most textile and clothing products (table 19).
21 On the share of intra-firm trade in total trade in different industries, see Sachwald (2004).

38
Table 19. Market Share of AC-10 in EU-15 and France imports (in %)
1993 2003 variation 1993 2003 variationTextile651 Textile yarn 0.6 6.6 5.9 2.0 8.2 6.2652 Cotton fabrics, woven 1.0 0.6 -0.4 2.9 6.4 3.5653 Fabrics, woven, of man-made fabrics 1.0 2.1 1.0 1.5 4.3 2.9654 Other textile fabrics, woven 0.9 6.9 5.9 2.2 9.9 7.7655 Knitted or crocheted fabrics, n.e.s. 1.1 0.6 -0.6 2.1 2.9 0.8656 Tulles, trimmings, lace, ribbons & other small wares 0.2 1.0 0.9 1.3 3.2 1.9657 Special yarn, special textile fabrics & related 0.3 5.7 5.4 1.4 5.0 3.6658 Made-up articles, of textile materials, n.e.s. 1.6 3.5 1.8 6.2 9.6 3.4659 Floor coverings, etc. 0.1 0.6 0.4 0.4 3.2 2.8
Clothing841 Men's clothing of textile fabrics, not knitted 3.1 2.7 -0.4 8.3 8.3 0.0842 Women's clothing, of textile fabrics 4.5 3.8 -0.7 11.3 7.4 -3.8843 Men's or boy's clothing, of textile, knitted, croche. 0.9 1.8 0.9 2.7 3.6 0.9844 Women's clothing, of textile, knitted or crocheted 3.1 3.1 0.0 4.8 5.9 1.1845 Articles of apparel, of textile fabrics, n.e.s. 1.9 1.8 0.0 3.2 4.0 0.7846 Clothing accessories, of textile fabrics 0.5 1.1 0.5 4.8 5.3 0.5848 Articles of apparel, clothing access., excluding textile 0.9 1.2 0.3 2.8 3.6 0.8
France EU-15
Source: calculation from COMEXT.
Post-enlargement dynamics
The EU textile industry has been under increasing competitive pressure and enlargement is often perceived as yet another threat. Fears of enlargement may nevertheless be exaggerated as most of the potential for increasing trade with the accession countries has already been developed during the 1990s. One scenario would be that enlargement would create a “new EU periphery” specialized in textiles and clothing comprising Portugal and Spain on the one hand and Romania, Bulgaria, and Lithuania on the other (Hanzl-Weiß 2004). Such a scenario would however require specific efforts and investment to upgrade the quality of the products and the reactivity of firms in order to avoid the relocation of manufacturing to lower cost countries.
Lower wages have been a major attraction for textile manufacturing in CEECs during the 1990s, but as wages have increased more rapidly than productivity, the cost competitiveness of most accession countries has been decreasing. As a result, location of outward processing activities has already been moving away from Slovenia, where wages are relatively high (table 20), and towards Poland and Romania. More generally, accession countries have experienced a decline in their revealed comparative advantage in textile products over the latter part of the 1990s (table 4 above). Competitiveness has eroded and production has been partially shifted to the next wave of accession countries, Romania and Bulgaria, to Mediterranean countries, and also to Asia. Wage increases have thus already triggered relocations from Eastern Europe to Asia (MINEFI 2003). As a result of increasing labor costs in accession countries, China appears a major competitor. This trend will be reinforced by the liberalization of trade in textiles and clothing in 2005.

39
Table 20. Average monthly gross wages in textiles and clothing (in % of EU-15, 2001)
Country Share of EU-15 average
Bulgaria 6.0Czech.Rep 22.1Estonia 18.8Hungary 18.4Latvia 18.1Lithuania 16.1Poland 24.9Romania 7.8Slovak Rep. 15.4Slovenia 46.0
Greece 72.3Irland 113.1Portugal 41.6Spain 77.0
Source: Hanzl-Weiß (2004)
New member countries can only remain attractive for clothing if they manage to increase productivity and quality. They would thus be able to be more competitive than Asian countries on specific types of products, for which geographical proximity is an asset. Zara, the successful Spanish clothing chain, is often considered as exemplary from this perspective (see Box). Such a strategy however means significant restructuring and modernization efforts from accession countries. It also requires good transportation and communication infrastructure. But enlargement should precisely contribute to upgrading infrastructure in accession countries and their connection with the EU-15.
Box. Zara’s strategy and value chain
Zara’s strategy of differentiation is based on closely following the evolution of the demand for clothing in its different markets. It produces short series depending on the observation of demand. It has developed an efficient network of sub-contractors and a sophisticated logistics chain, so that it can be very reactive and shorten its production cycle. Zara reduces distribution costs by directly supplying its shops from its centralized production system. This again reduces stocks. Zara can thus design and deliver a new collection in two weeks.
Contrary to other clothing chains, Zara has not relocated production abroad. It has a network of 19 factories in Spain, where wages are two to three times higher than in Northern Africa or CEECs. Zara manufactures about half of its sales, focusing on the articles for which delays are short. The other half is sub-contracted, mostly in Europe. Production in Spain and in Europe allows Zara to better control its value chain and to be more flexible. Production in Asia for example implies transportation by boat and long delays, which are not compatible with Zara’s strategy.
Overall, enlargement appears as a minor threat to the EU textile and clothing industry. It may on the contrary offer an opportunity in the increasingly competitive global textile industry. The objective for the European industry should be to refine its integration process so as to continue its upgrading effort. In the 1990s, EU countries had turned to higher value-added

40
products by restructuring, adopting new technologies (ICT, man-made fibers, technical textiles), and outsourcing labor-intensive processes to CEECs or Mediterranean countries. In the new context, this strategy is to be pushed further, which implies that accession countries would differentiate more and adopt upgrading strategies themselves. As a result more manufacturing will probably be relocating away from EU countries, but the latter should nevertheless keep some strategic functions and niche products. Furthermore, a successful reorganization of the clothing industry on a European scale is important in order to maintain upstream production of textiles in Europe.
Conclusion: Race to the bottom vs. Race to the top
Increased exchanges between western and eastern Europe through trade and investment have opened opportunities for accession countries to upgrade their production capabilities and become more specialized in mid- to high-tech products. Access to Western markets and FDI have contributed to the transition process and recent growth performance in eastern countries. For the EU-15, increasing integration with accession countries has meant both exports to small but dynamic markets and imports as part of a process of regional vertical specialization. Both trends can contribute to strengthen the EU-15 economies, provided the latter do adapt to further specialize in high-tech products and services. Enlargement thus represents both an opportunity to speed up structural change in European economies and an additional pressure to do so. The paper has emphasized the fact that enlargement occurs in a context where competitive pressures from emerging countries are gathering pace and call for structural evolution of the European economies. From this global economic perspective, EU enlargement is not a major event. This latest wave of enlargement may actually correspond to the end of the focus of the EU on integration itself, where increasing economies of scale in sectors of mass production played a major role in improving economic performance. Enlargement thus appears as a factor of acceleration of change in a global context of change, which explains the increasingly complex political economy of European economic integration.
Some European countries, including in particular Germany and France, have experienced a slow evolution of their industrial structure over the last twenty years (Miotti and Sachwald 2004). As a consequence, the emergence of new competitors is seen as a threat to jobs in a number of low- to medium-tech sectors, which are still relatively important in these countries. The problem may actually be more acute for France as it is less specialized in investment goods, so that it cannot benefit as much as Germany from dynamic imports from China and accession countries (Artus 2004c). This may explain why French politicians, including some in the government, have been the most vocal to criticize wage and corporate tax “dumping” by accession countries. This is a sort of intra-European version of the race to the bottom, which had been considered as a major threat of globalization during the 1990s.
A number of studies, including official reports, have tried to assess the extent of relocation due to enlargement.22 They tend to consider that the threat of a race to the bottom, either through the pressure on wages or the pressure on taxes, is exaggerated. The public opinion is nevertheless not convinced as it is struck by the combination of persistently high unemployment, concrete examples of industrial sites being closed, and new sites being opened in accession countries. Both in Germany and France, this gloomy atmosphere has been further deteriorated by pressure from some companies, which have been arguing that they will relocate unless they can increase working hours in order to reduce unit labor costs.
The French government has been announcing fiscal incentives to reinforce the attractiveness
22 See in particular Riess and Uppenberg (2004), Konings (2004). For France, Grignon (2004); for Germany, Marin (2004), Deutsche Bundesbank (2004), Brück et al. (2004).

41
of France and thus “prevent relocation” or even reverse previous relocations in foreign countries. The government has also suggested that corporate taxes should be harmonized to prevent FDI from fleeing to accession countries. The French debate on the European constitution is also influenced by this issue of relocation, as some politicians argue that the EU should include more social provisions and allow for a more level playing field within EU-25. These preoccupations to prevent job destruction may unfortunately distract France from promoting job creation in high-tech sectors and services. It also distracts from the fact that there are also relocations of R&D laboratories to the United States, where access to high quality public research is attracting a number of European companies (Sachwald 2003).
Overall, the perception that there are races to the bottom may trigger structural beggar-thy-neighbor policies. This would be particularly counter productive, as a race to the bottom in some spheres (e.g., tax competition) would not be compatible with a race to the top in areas such as public expenditure on infrastructure or research. Accession countries should resist the temptation to reduce taxes, especially to attract FDI and thus run unsustainable public deficits.23 For EU economies, the objective should be to work at stimulating structural change, so that the perception of a race to the bottom is dissipated.
If European countries engage more clearly on an innovation-based growth path, they will generate more jobs in new activities and will feel less threatened by relocation to lower wages countries. Such an ambition is quite challenging for public policies as it does not only require more public spending in education and research, but also institutional changes, ranging from national innovation systems to labor markets and competition in markets for goods.24 In this perspective, enlargement should certainly not be seen as another opportunity to simply increase the EU economic area. Enlargement and its challenges should rather trigger reform of a number national features and an evolution of the role of the EU economic policies. In the case of research and innovation policy, this could mean both national reforms and a larger role for the EU in R&D funding.
23 See Artus (2004d), Bellak (2004) and Bénassy-Quéré and Prady (2004). 24 In the case of France the required evolutions and reforms have been discussed in a number of recent contributions, among which Camdessus (2004), Miotti and Sachwald (2004).

42
References Alavrez-Plata, P., H. Brücker, B. Siliverstovs, 2003, Potential migration from Central and Eastern Europe into the EU-15 - an update, Report for the European Commission, DG Employment and Social Affairs.
Artus, P., 2004a, ‘L’élargissement protifte-t-il aux 15 pays actuels de l’EU ?’, Flash 2004-76, CDC-IXIS.
Artus, P., 2004b, ‘Après l’élargissement réfléchir à quelques résultats de la littérature économique concernant les unions économiques et monétaires’, Flash 2004-163, CDC-IXIS.
Artus, P., 2004c, ‘Quelle stratégie de spécialisation en Europe ?’, Futuribles n°299, 23-30.
Artus, P., 2004d, ‘Les conséquences potentiellement désastreuses de la concurrence fiscale dans l’Union Européenne?’, Flash 2004-244, CDC-IXIS.
Aussilloux, V. and M. Pajot, 2003, ‘Enjeux commerciaux de l’élargissmenet de l’Union européenne’, Economie et Statistique, n°363-365.
Barry, F. and D. Curran, 2004, ‘Enlargement and the European Geography of the Information Technology Sector’, The World Economy, vol. 2, 901-9022.
Bellak, C., 2004, ‘The Impact of Enlargement on the Race for FDI’, L. Oxelheim and P. Ghauri (eds.), European Union and the Race for Foreign Direct Investment in Europe, Elsevier.
Bénassy-Quéré, A. and D. Prady, 2004, ‘A l’Est, moins d’impôts’, La lettre du CEPII, downloadable from www.cepii.fr
Boeri, T., H. Brücker (eds.), 2001, The Impact of Eastern Enlargement on Employment and Labour Markets in the EU Member States, Report for the European Commission, DG Employment and Social Affairs.
Boillot, J.J., Lepape, Y., 2002, Conference ‘Innovation and Growth: New Challenges for the Regions’, DREE. 18-20, 2002.
Brück, T., H. Brücker, H. Engerer, C. von Hirschhausen, M. Schrooten, D. Schumacher, U. Thiessen and H. Trabold, 2004, ‘The Eastern enlargement of the EU: Clear challenges, unjustified fears’, Economic Bulletin 6, DIW Berlin.
Camdessus M. (ed.), 2004, ‘Le sursaut- Vers une nouvelle croissance pour la France’, Rapport officiel, La Documentation française, October.
CCFA, 2004, Répertoire mondial des activités de production et d’assemblage de véhicules automobiles, Paris, Comité des Constructeurs Français d’Automobiles.
European Commission (2003), 'Statistics on the information society in Europe 1996-2002', downloable in http://europa.eu.int.
CEPII, 2004, ‘L’insertion de l’industrie européenne dans la Division Internationale du Travail: situation et perspectives’, downloadable from trade-info.cec.eu.int
Dedrick J., Kraemer, L., 2002a, ‘Globalization of the Personal Computer Industry: Trends and Implications’, CRITO (Center for Research on Information Technology), University of California, downloadable from http://www.crito.uci.edu.
Dedrick J., Kraemer, L., 2002b, ‘Dell Computer: Organization of a Global Production Network’, (Center for Research on Information Technology), University of California, downloadable from http://www.crito.uci.edu.
Deutsche Bundesbank, 2004, ‘Effects of eastward enlargement of the EU on the German economy’, Monthly Report, May.
DREE, 2001, ‘Le marché du matériel informatique dans les Peco’, Revue Elargissement n°14.

43
DREE 2002, ‘Chronique des mouvements industriels’, Revue Elargissement n°26.
DREE 2003, ‘L’informatique en Hongrie’, Fiche de synthèse des missions économiques, downloadable from http://www.missioneco.org/.
DREE 2004, ‘Electronique et NTIC’, Nouvelles d’Irlande n°123 downloadable from http://www.dree.org/ntic/
Dunne, M., 2001, ‘L’éducation en Europe’, Statistiques en bref, Eurostat.
Dupuch, S., H. Jennequin and E.M. Mouhoud, 2004, ‘EU enlargement: What does it change for the European economic geography?’, Revue de l'OFCE, March.
Fainsilber, D., 2004, “Renault réinvente la ‘voiture du peuple’”, Les Echos, 28 September.
Fouquin, M. et al., 2002, Mondialisation et régionalisation: le cas des industries du textile et de l’habillement, Document de travail 2002-08, Paris: CEPII.
Grignon, F., 2004, ‘Délocalisations: pour un néo-colbertisme européen’, Rapport d’information, Paris: Sénat.
Hanzl-Weiß, D., 2004, ‘Enlargement and the Textile, Clothing and Footwear Industry’, The World Economy, vol. 2, 923-945.
Hatem, F., 2004, ‘Investissement international et politiques d’attractivité’, Economica.
Heymann, E., 2004, ‘The automobile market in Eastern Europe’, Deutsche Bank Research, July 7.
Hunya, G. and J. Stankovsky, 2004, ‘Foreign direct investment in Central and Eastern Europe’, WIIW, Vienna, July.
IDATE (2003), ‘The European way to think the Digital World’, DigiWorld.
Jerinte L., 2004, ‘Plusieurs entreprises High Tech envisagent prochainement de s’implanter en Slovaquie’, Regard sur l’Est, August 24.
Kaminski, B. and F. Ng, 2001, Trade and Production Fragmentation: Central European Economies in EU Networks of Production and Marketing, Policy Research Working Paper 2616, The World Bank, Washington DC., June
Konings, J., 2004, “The employment effects of foreign direct investment”, EIB Papers, Vol. 9, n°1, European Investment Bank.
Lepape Y., 2002, ‘Demande en rattrapage mais encore assez marginale’, Revue Elargissement n°30.
Marin, D., 2004, ‘A Nation of Poets and Thinkeers’ – Less so with Eastern Enlargmeent? Austria and Germany, Discussion paper 2004-06, University of Munich, April, downloadable from http://epub.ub.uni-muenchen.de.
Meyer, K. and C. Jensen, 2003, ‘Foreign Investor Strategies in View of EU enlargement’, Stüting, Dorow, Classen and Blazjenski (eds.), Change Management in Transition Economies, Palgrave
Midelfart-Knarvik, K., H. Overman, S. Redding and A. Venables, 2002, “Integration and industrial specialisation in the EU”, Revue Economique, May.
Minefi, 2002, ‘Elargissement de l’Union européenne: quelles opprtunités pour les entreprises industrielles’, downloadable from http://www.industrie.gouv.fr/enjeux/pdf/elarg.pdf.
OCDE, 2002, ‘Politiques de l’information et des communications’.
Pelkmans, J., 2002, ‘Economic implications of enlargement’, BEEP briefing n°1, College of Europe, downloadable from http://www.coleurop.be.
Radosevic S., 2002, ‘The electronics industry in central and eastern Europe: an emerging production location in the alignment of networks perspective’, Working paper UCL.
Rhys, G., 2004, ‘The Motor Industry in an Enlarged EU’, The World Economy, vol. 2, 877-900.

44
Ricard, M., 2004, ‘La concurrence se durcit entre la Hongrie et ses voisins pour attirer les investisseurs étrangers ‘, Le Monde, April 30.
Riess, A. and K. Upperberg, 2004, ‘The internationalisation of production: moving plants, products, and people’, EIB Papers, Vol. 9, n°1, European Investment Bank.
Sachwald, F., 2003, ‘Les migrations de la recherche’, Sociétal, 4è. trim.
Sachwald, F., 2004, ‘The Integration of China and East European Countries in Global Networks’, Tokyo Club, Washington D.C, 9 February.
Sinn, H.-W., G. Flaig, M. Werding, S. Munz, N. Düll, H. Hofmann, 2003, EU enlargment and labour mobility, CESifo Research report n°2.

45
Appendix 1. Definition of ICT
For tables 8 and 9, the ICT manufacturing sector includes (ISIC Rev.3 Classification) :
30 Manufacture of office machinery and computers30.01 Manufacture of office machinery30.02 Manufacture of computers and other information processing31.3 Manufacture of insulated wire and cable32 Manufacture of radio, television and communication equipment and apparatus32.1 Manufacture of electronic valves and tubes and other electronic components32.2 Manufacture of television and radio transmitters and apparatus for line telephony and line telegraphy32.3 Manufacture of television and radio receivers, sound or video recording or reproducing apparatus and associated goods33.2 Manufacture of instruments and appliances for measuring, checking, testing, navigating and other purposes33.3 Manufacture of industrial process control equipment
For tables 7, 10, 11 and 12 ; and figures 7 and 8 ; the ICT manufacturing sector includes (ITSC Rev.3 classification for OECD data and 3.1 for UNCTAD data):
752 Automatic data-processing machines and units thereof; magnetic or optical readers, machines for transcribing data752.1 Analogue or hybrid (analogue-digital) data-processing machines752.2 Digital automatic data-processing machines752.3 Digital processing units752.6 Input or output units for automatic data-processing machines752.7 Storage units, whether or not presented with the rest of a system752.9 Data-processing equipment, n.e.s.759 Parts and accessories suitable for use with machines falling within groups 751 and 752759.97 ....for the machines of group 752
761 Television receivers (including video monitors and video projectors)761.1 Television receivers, colour (including video monitors and video projectors)761.2 Television receivers, black and white or other monochrome
762 Radio-broadcast receivers, whether or not incorporating sound-recording or reproducing apparatus or a clock762.1 Radio-broadcast receivers not capable of operating without an external source of power762.2 Radio-broadcast receivers capable of operating without an external source of power 762.8 Other radio-broadcast receivers (including apparatus capable of receiving radio-telephony or radio-telegraphy)
763 Sound recorders or reproducers; television image and sound recorders or reproducers; prepared unrecorded media763.3 Turntables (record-decks) and record-players, not incorporating a sound-recording device763.8 Sound-recording and other sound-reproducing apparatus; video-recording or reproducing apparatus,
764 Telecommunications equipment, n.e.s., and parts, n.e.s., and accessories of apparatus falling within division 76764.1 Electrical apparatus for line telephony or line telegraphy (including such apparatus for carrier-current line systems)764.2 Microphones and stands therefor; loudspeakers764.3 Transmission apparatus for radio-telephony, radio-telegraphy, radio-broadcasting or television764.8 Telecommunications equipment, n.e.s.764.9 Parts and accessories suitable for use solely or principally with the apparatus of division 76
Figures 9 and 10 focus on mobile phone, taken to be product 85252091 from COMEXT.

46
Appendix 2: Specialization Index
The indicator for revealed comparative advantage that is used in the paper is the following for each product i:
( ) 2( ) 2 ( ) 2 100i i iii
EXP IMPEXP IMP EXP IMPEXP IMP EXP IMP EXP IMP
RCA− ×− × + × − × + + +
= ×∑ ∑∑ ∑ ∑ ∑ ∑ ∑
Negative values indicate a comparative disadvantage.


