Page 1
THE INFLUENCE OF COLLEGE STUDENTS’ INTENSITY OF INVOLVEMENT IN
STUDENT ORGANIZATIONS ON LEADERSHIP VALUES
By
Sheila M. Coressel
A DISSERTATION
Submitted to
Michigan State University
in partial fulfillment of the requirements
for the degree of
Higher, Adult, and Lifelong Education – Doctor of Philosophy
2014
Page 2
ABSTRACT
THE INFLUENCE OF COLLEGE STUDENTS’ INTENSITY OF INVOLVEMENT IN
STUDENT ORGANIZATIONS ON LEADERSHIP VALUES
By
Sheila M. Coressel
Previous research on college students’ involvement in student organizations and the
outcomes of that involvement supports the premise that involvement in student organizations
while in college is beneficial for students in areas such as persistence to graduation, job
placement, interpersonal skills, and leadership development (Astin, 1993; Pascarella &
Terenzini, 2005). Furthermore, Astin’s (1984) Student Involvement theory states a college
student’s development as a result of involvement in a specific activity is directly proportional to
the quality and quantity of effort dedicated to that activity. Most studies on involvement in
student organizations focus on the involvement’s influence on a range of outcomes, e.g.,
psychosocial development, academic persistence, and leadership development (Astin, 1993;
Dugan & Komives, 2007; Foubert & Grainger, 2006), and the results reinforce Astin’s (1984)
Student Involvement theory. However, Astin (1984) also wondered if there is a limit to the
benefits of this involvement. This study looks at this question as it relates to involvement in
multiple organizations.
The purpose of this study was to identify the relationship between the intensity of
involvement in student organizations and college students’ leadership values. In other words, are
there signs of diminishing returns as college students’ intensity of involvement increases in
regards to their leadership development? A student’s intensity of involvement is the relationship
between the student’s quantity and quality of involvement in student organizations (Winston &
Massaro, 1987). Data were collected through an instrument that combined the Extracurricular
Page 3
Involvement Inventory (EII; Winston & Massaro, 1987) and the Socially Responsible Leadership
Scale, Revision 2 (NCLP, n.d.). The survey was administered electronically at the Great Lakes
Affiliate of Colleges and Universities Residence Halls (GLACURH) annual regional conference
in November 2013, held at Michigan State University. Attendees were college students involved
in on-campus housing student organizations at institutions located in Indiana, Illinois, Michigan,
Wisconsin, or Ontario, Canada. A total of 204 students provided usable survey data for use in
analyses.
Results from the data analysis using multiple regressions showed that there is a positive
relationship between involvement in student organizations and students’ leadership values. In
addition, the results provided evidence of a tipping point in a college student’s intensity of
Involvement (EII) at which point an increase in leadership development is less likely to occur.
When participants were divided between those involved in one organization (n=41) and those
involved in multiple organizations (n=163), a tipping point in the EII was determined for
participants involved in multiple organizations, but not for those involved in only one
organization. Implications for student affairs practitioners and researchers and recommendations
for future research is also discussed.
Page 4
Copyright by
SHEILA M. CORESSEL
2014
Page 5
v
I dedicate this dissertation to anyone who has not considered a doctorate in fear of the
dissertation. It can be done. I am proof!
Page 6
vi
ACKNOWLEDGEMENTS
This dissertation would not be possible if it was not for Vanessa (Elola) Hauser, Julie
Snyder, and Kathleen Gardner. Each of them, in her own way, encouraged me to pursue my
doctorate in higher education. Thank you for your persistence and support throughout the past
four years.
Second, I want to express my appreciation to each of my cohort-mates: Aleece, Bill,
Blue, Bree, Brent, Cheri, Claire, Dali, Davina, Erin, Inese, John B., John L., Michelle, Nate,
Paul, Rob, and Tonisha. Thank you for the enlightening and challenging conversations during
the first two years and for the continued support during the last two years. I am so glad we are in
the same cohort! Thank you to Bill and Dali for being dissertation writing buddies and special
thanks to Erin Carter for being the best writing buddy ever! I’m going to miss our morning
writing/chatting sessions in the grad student room.
There are many friends who have supported me during this journey, especially when a
much needed break was required. My sincere thanks to Ronda Page, Nicole Kashian, Becky
Hayes, Jess Mansbach, Krista Black, Kristy Cooper, Jaime Slaughter-Acey, Jessica Conroy,
Sarah Wells, Jessica Rehling, Dawn Branham, Renata Opoczynski, and Erin Carter. I’m always
up for a coffee break, Glee or SYTYCD gossip, sushi, Max & Erma’s cookies, or a walk.
Although my family has no idea what I’ve been doing at MSU for the past four years, I
truly appreciate their support and attempts to understand my career and dissertation topic. I am
also glad I lived only two hours from the family homestead; this way when I needed help, my
parents were only a few hours away. Much love to the Coressel family, especially Denny and
Martha (aka, Mom and Dad).
Page 7
vii
I want to express appreciation for the members of my dissertation committee: Dr.
Marilyn Amey, Dr. Amita Chudgar, Dr. James Fairweather, and Dr. Kristen Renn. Amita and
Jim were my quantitative gurus, ensuring I stayed on track during my data analysis, while Kris
was my consummate cheerleader! Finally, Marilyn was my lighthouse. She was my constant
and provided the guidance I needed to continue my doctorate dissertation. I cannot thank
Marilyn enough for her dedication to me, as well as to all of the other HALE doctoral students.
We are all sincerely grateful for your support and guidance!!
Last, but definitely not least, I must express my eternal gratitude to the one who has been
by my side throughout this journey: Miss Isabelle. Thank you for reminding me when I wasn’t
paying enough attention to you or when you were STARVING. I love you with all of my heart,
little girl!
Page 8
viii
TABLE OF CONTENTS
LIST OF TABLES ........................................................................................................................ xi
LIST OF FIGURES ..................................................................................................................... xx
KEY TO ABBREVIATIONS ..................................................................................................... xxi
Chapter 1: Introduction ................................................................................................................. 1
Definition of Terms.................................................................................................................. 7
Conceptual Framework ............................................................................................................ 8
Conclusion ............................................................................................................................. 13
Chapter 2: Literature Review ...................................................................................................... 15
Evolution of Leadership Theories .......................................................................................... 16
Reciprocal Approach Theories ........................................................................................ 18
Summary .......................................................................................................................... 20
Social Change Model of Leadership Development ............................................................... 20
Social Change Model Values ........................................................................................... 21
Consciousness of self (Individual) ............................................................................. 21
Congruence (Individual) ............................................................................................ 22
Commitment (Individual) .......................................................................................... 22
Collaboration (Group) ................................................................................................ 23
Common purpose (Group) ......................................................................................... 24
Controversy with civility (Group) ............................................................................. 25
Citizenship (Society) .................................................................................................. 26
Interaction between Components ..................................................................................... 26
Individual and group .................................................................................................. 27
Group and society ...................................................................................................... 27
Society with individual .............................................................................................. 28
Research Using the Social Change Model ....................................................................... 29
Summary .......................................................................................................................... 32
College Student Involvement and Student Organizations ..................................................... 33
Student Involvement Theory............................................................................................ 33
Student Governments ....................................................................................................... 34
Research on the Benefits of Student Organization Involvement ..................................... 35
Research on Involvement in Multiple Student Organizations ......................................... 37
Summary .......................................................................................................................... 40
Residence Hall Associations .................................................................................................. 41
National Association of College and University Residence Halls ................................... 43
Research on RHA Involvement and Leadership Development ....................................... 44
Summary .......................................................................................................................... 46
Conclusion ............................................................................................................................. 47
Page 9
ix
Chapter 3: Methodology ............................................................................................................. 48
Research Design..................................................................................................................... 48
Sampling Framework ............................................................................................................. 50
Instrumentation ...................................................................................................................... 51
Extracurricular Involvement Inventory............................................................................ 52
Socially Responsible Leadership Scale Revised Version 2 ............................................. 55
Data Collection ...................................................................................................................... 57
Data Analysis ......................................................................................................................... 58
Limitation ............................................................................................................................... 60
Conclusion ............................................................................................................................. 61
Chapter 4: Findings ..................................................................................................................... 63
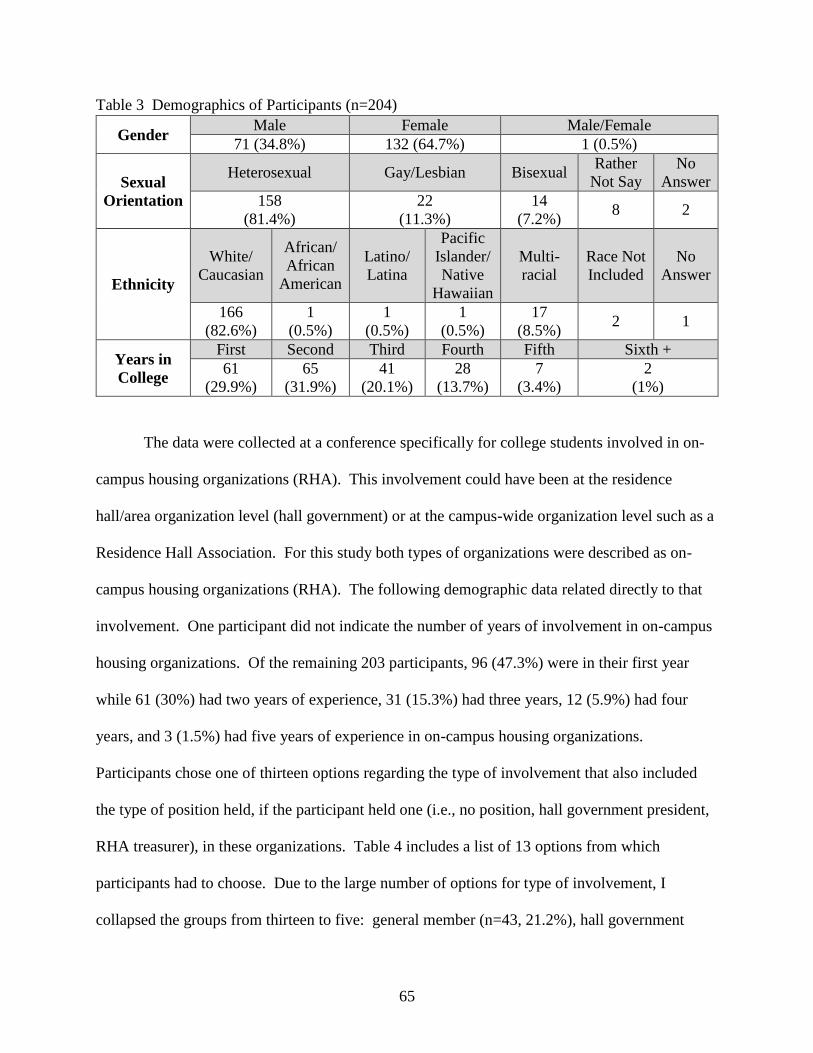
Participants ............................................................................................................................. 63
Independent Variables ........................................................................................................... 71
Dependent Variable ............................................................................................................... 76
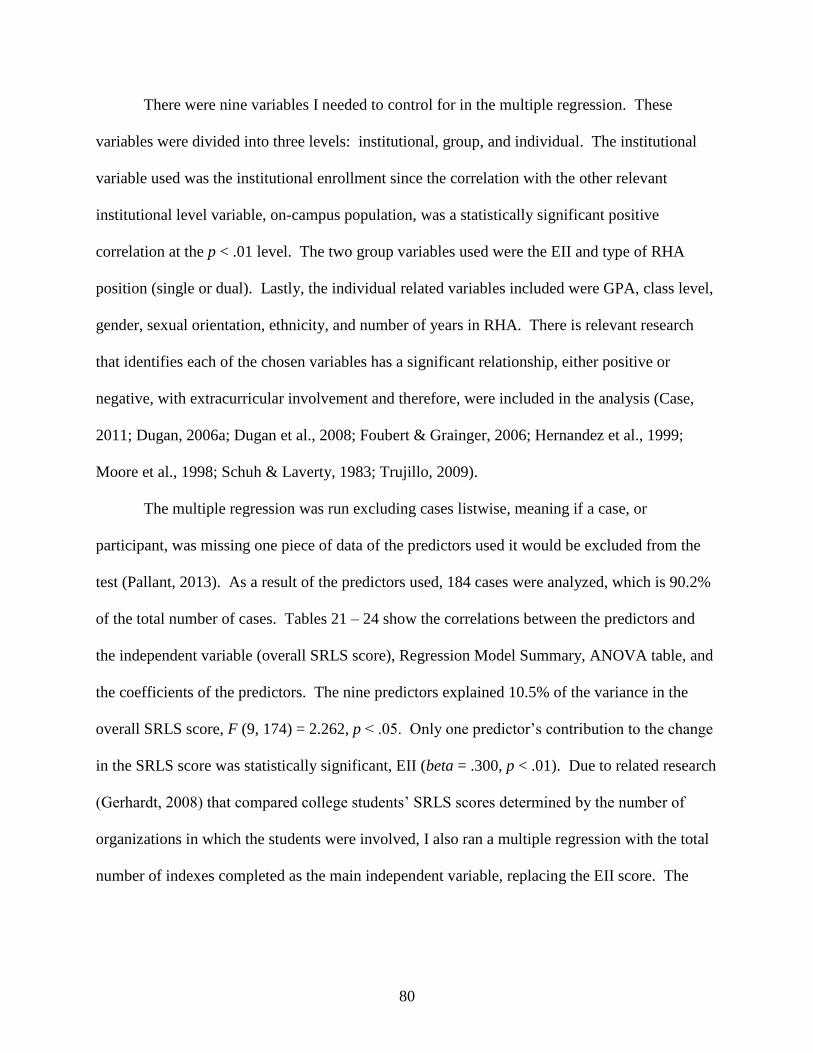
Research Question #1: Relationship between Intensity of
Involvement and Leadership Development ........................................................................... 79
Summary .......................................................................................................................... 84
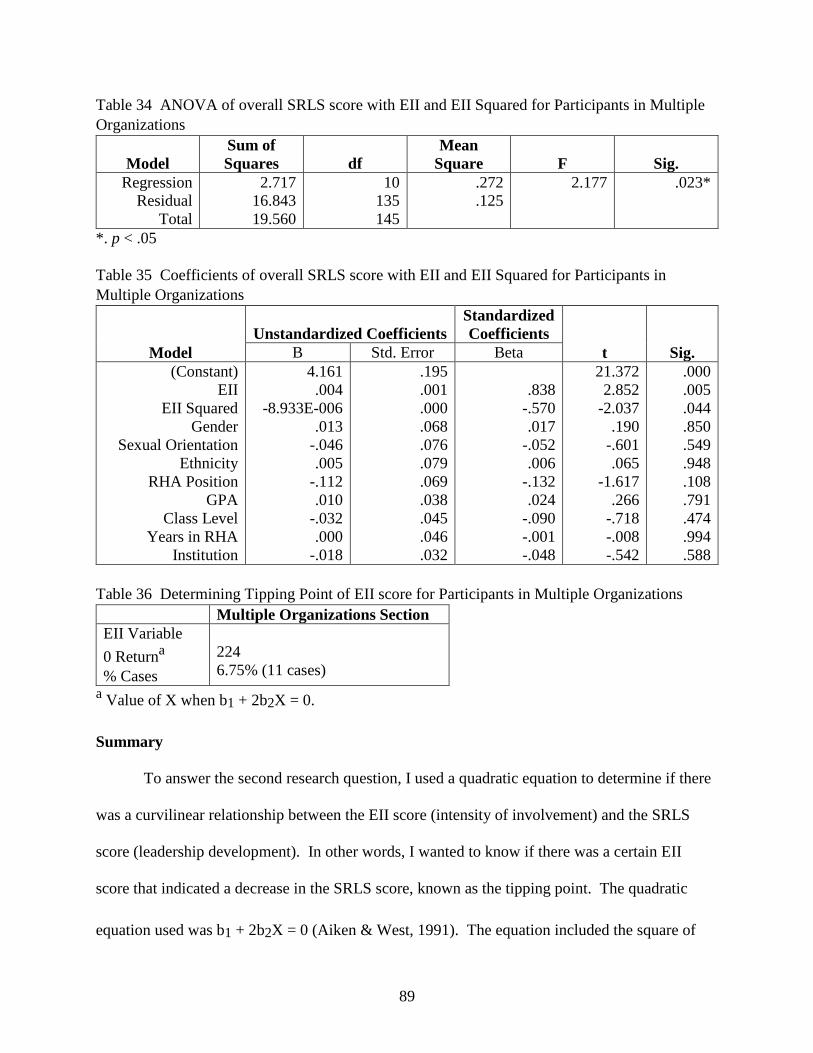
Research Question #2: Diminishing Returns in Leadership Development Variables ................ 85
Summary .......................................................................................................................... 89
Conclusion ................................................................................................................................... 90
Chapter 5: Discussion and Conclusion ....................................................................................... 92
Interpretation of Findings ...................................................................................................... 94
Research Question #1 ...................................................................................................... 95
Overall Leadership Development (Overall SRLS score) ........................................... 95
Individual Values and Components ........................................................................... 98
Research Question #2 .................................................................................................... 102
Summary ........................................................................................................................ 108
Implications and Recommendations .................................................................................... 109
Implications for Student Affairs Professionals .............................................................. 110
Implications for Researchers.......................................................................................... 118
Recommendations for Future Research ......................................................................... 120
Conclusion ........................................................................................................................... 123
APPENDICES ........................................................................................................................... 124
Appendix A: Approval to use Extracurricular Involvement Inventory .............................. 125
Appendix B: Approval to use Socially Responsible Leadership Scale, Revision 2 ........... 126
Appendix C: Involvement Index (Extracurricular Involvement Inventory) ....................... 127
Appendix D: The SRLS Scale ............................................................................................. 129
Appendix E: SRLS Constructs and the Individual Items ................................................... 132
Appendix F: Demographic Questions from Survey Instrument ......................................... 133
Appendix G: Consent Form ................................................................................................ 135
Appendix H: Multiple Regression Results for SCM Values and
Components with EII ..................................................................................... 136
Page 10
x
Appendix I: Multiple Regression Results for SCM with EII for Participants Involved
in One Organization ...................................................................................... 147
Appendix J: Multiple Regression Results for SCM with EII for Participants Involved
in Multiple Organizations .............................................................................. 159
BIBLIOGRAPHY ...................................................................................................................... 171
Page 11
xi
LIST OF TABLES
Table 1 Values Definition for the Social Change Model for
Leadership Development ............................................................................... 12
Table 2 Reliability of the original SRLS and SRLS-R2 ............................................. 56
Table 3 Demographics of Participants (n=204) .......................................................... 65
Table 4 Position Held in Hall Government or RHA, possible responses ................... 66
Table 5 Class Level of Participants............................................................................. 67
Table 6 Age of Participants ......................................................................................... 67
Table 7 Grade Point Average (GPA) of Participants .................................................. 67
Table 8 Location of Institution.................................................................................... 67
Table 9 Enrollment of Institution ................................................................................ 68
Table 10 Number of Beds in Campus Housing ............................................................ 68
Table 11 Number of Organizations Involved In vs. Number of Involvement
Indexes Completed......................................................................................... 68
Table 12 Common Postsecondary Majors Divided by Biglan’s Classification ............ 69
Table 13 Majors using Biglan’s Hard/Soft and Pure/Applied ...................................... 70
Table 14 Survey Demographics vs. MSU Demographics ............................................ 71
Table 15 Codes for Gender, Sexual Orientation, Ethnicity, and RHA Positions ......... 74
Table 16 Pearson r Correlations of Independent Variables .......................................... 75
Table 17 Pearson r Correlations of Independent Variables with the
overall SRLS Score ........................................................................................ 77
Table 18 Pearson r Correlations between the EII and the SCM
Values and Components ................................................................................ 78
Table 19 T-tests for Independent Variable with Two Groups ...................................... 78
Table 20 ANOVA Results for Ordinal Independent Variables .................................... 79
Page 12
xii
Table 21 Overall SRLS Score Correlations with Regression Predictors ...................... 81
Table 22 Regression Model Summary with the EII Score............................................ 81
Table 23 ANOVA with the EII Score ........................................................................... 81
Table 24 Coefficients with the EII Score ...................................................................... 81
Table 25 Regression Model Summary with the Total Number of INIXs ..................... 82
Table 26 ANOVA with the Total Number of INIXs .................................................... 82
Table 27 Multiple Regressions for SCM Values and Components with EII ................ 83
Table 28 Multiple Regression for SCM Values and Components with EII
for Participants in Multiple Organizations ..................................................... 84
Table 29 ANOVA of overall SRLS score with EII and EII Squared Variables ........... 87
Table 30 Coefficients of overall SRLS score with EII and EII Squared ...................... 87
Table 31 Determining Tipping of EII score for Sample ............................................... 87
Table 32 ANOVA of overall SRLS score with EII and EII Squared for
Participants in One Organization ................................................................... 88
Table 33 Coefficients of overall SRLS score with EII and EII Squared for
Participants in One Organization ................................................................... 88
Table 34 ANOVA of overall SRLS score with EII and EII Squared for
Participants in Multiple Organizations .......................................................... 89
Table 35 Coefficients of overall SRLS score with EII and EII Squared for
Participants in Multiple Organizations .......................................................... 89
Table 36 Determining Tipping Point of EII score for Participants in
Multiple Organizations .................................................................................. 89
Table 37 Values Definition for the Social Change Model for
Leadership Development ............................................................................. 100
Table 38 Questions and Statements from the Involvement Index .............................. 103
Table 39 Example of a College Student’s Overall Intensity of Involvement ............. 106
Page 13
xiii
Table 40 SRLS Items Sorted in Order ........................................................................ 129
Table 41 Correlations between the sum of the scores for each construct and the
individual items ............................................................................................ 132
Table 42 Correlations with Regression Predictors (Consciousness of Self) ............... 136
Table 43 Regression Model Summary with the EII Score (Consciousness of Self)... 136
Table 44 ANOVA with the EII Score (Consciousness of Self) .................................. 136
Table 45 Coefficients with the EII Score (Consciousness of Self) ............................. 137
Table 46 Correlations with Regression Predictors (Congruence) ............................... 137
Table 47 Regression Model Summary with the EII Score (Congruence)................... 137
Table 48 ANOVA with the EII Score (Congruence) .................................................. 137
Table 49 Coefficients with the EII Score (Congruence) ............................................. 138
Table 50 Correlations with Regression Predictors (Commitment) ............................. 138
Table 51 Regression Model Summary with the EII Score (Commitment) ................. 138
Table 52 ANOVA with the EII Score (Commitment) ................................................ 138
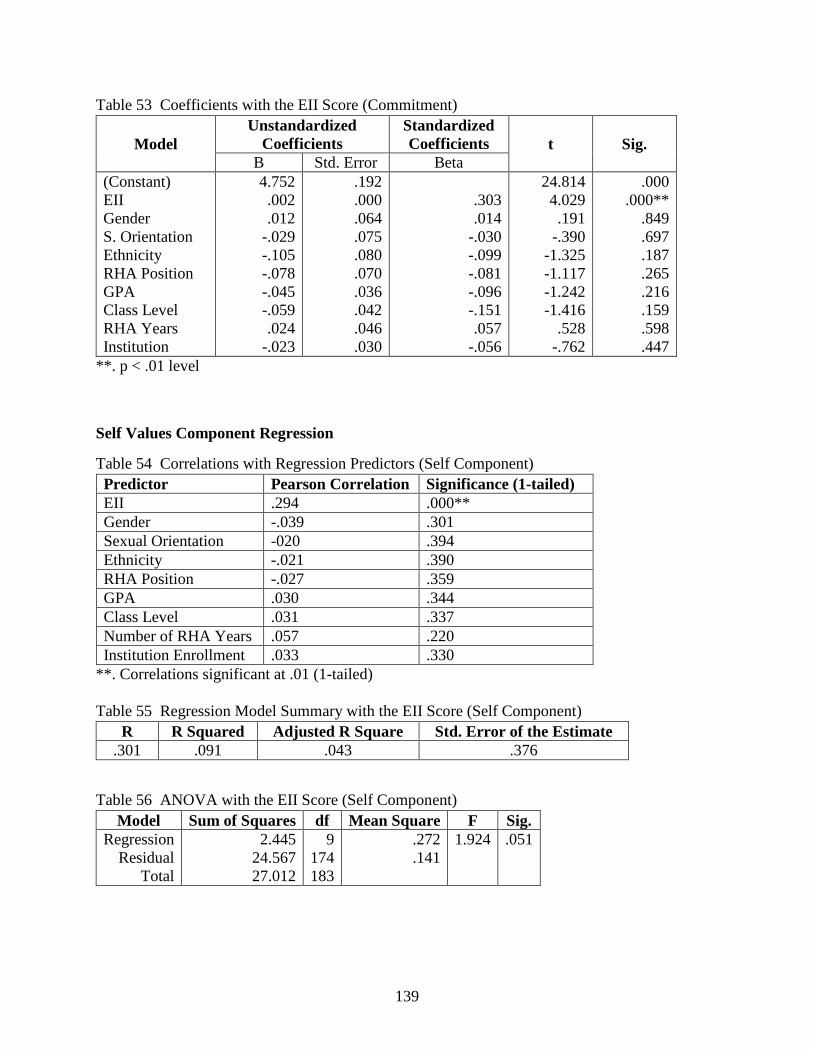
Table 53 Coefficients with the EII Score (Commitment) ........................................... 139
Table 54 Correlations with Regression Predictors (Self Component) ........................ 139
Table 55 Regression Model Summary with the EII Score (Self Component) ............ 139
Table 56 ANOVA with the EII Score (Self Component) ........................................... 139
Table 57 Coefficients with the EII Score (Self Component) ...................................... 140
Table 58 Correlations with Regression Predictors (Collaboration) ............................ 140
Table 59 Regression Model Summary with the EII Score (Collaboration) ................ 140
Table 60 ANOVA with the EII Score (Collaboration) ............................................... 140
Table 61 Coefficients with the EII Score (Collaboration) .......................................... 141
Table 62 Correlations with Regression Predictors (Common Purpose) ..................... 141
Page 14
xiv
Table 63 Regression Model Summary with the EII Score (Common Purpose) ......... 141
Table 64 ANOVA with the EII Score (Common Purpose) ........................................ 141
Table 65 Coefficients with the EII Score (Common Purpose) ................................... 142
Table 66 Correlations with Regression Predictors (Controversy with Civility) ......... 142
Table 67 Regression Model Summary with the EII Score
(Controversy with Civility) .......................................................................... 142
Table 68 ANOVA with the EII Score (Controversy with Civility) ............................ 142
Table 69 Coefficients with the EII Score (Controversy with Civility) ....................... 143
Table 70 Correlations with Regression Predictors (Group Component) .................... 143
Table 71 Regression Model Summary with the EII Score (Group Component) ........ 143
Table 72 ANOVA with the EII Score (Group Component) ....................................... 143
Table 73 Coefficients with the EII Score (Group Component) .................................. 144
Table 74 Correlations with Regression Predictors
(Citizenship/Society Component) ................................................................ 144
Table 75 Regression Model Summary with the EII Score
(Citizenship/Society Component) ................................................................ 144
Table 76 ANOVA with the EII Score (Citizenship/Society Component) .................. 144
Table 77 Coefficients with the EII Score (Citizenship/Society Component) ............. 145
Table 78 Correlations with Regression Predictors (Change) ...................................... 145
Table 79 Regression Model Summary with the EII Score (Change) .......................... 145
Table 80 ANOVA with the EII Score (Change) ......................................................... 145
Table 81 Coefficients with the EII Score (Change) .................................................... 146
Table 82 Correlations with Regression Predictors
(One Org.; Overall SRLS score) .................................................................. 147
Page 15
xv
Table 83 Regression Model Summary with the EII Score
(One Org.; Overall SRLS score) .................................................................. 147
Table 84 ANOVA with the EII Score (One Org.; Overall SRLS score) .................... 147
Table 85 Coefficients with the EII Score (One Org.; Overall SRLS score) ............... 148
Table 86 Correlations with Regression Predictors
One Org.; Consciousness of Self) ................................................................ 148
Table 87 Regression Model Summary with the EII Score
(One Org.; Consciousness of Self)............................................................... 148
Table 88 ANOVA with the EII Score (One Org.; Consciousness of Self) ................. 148
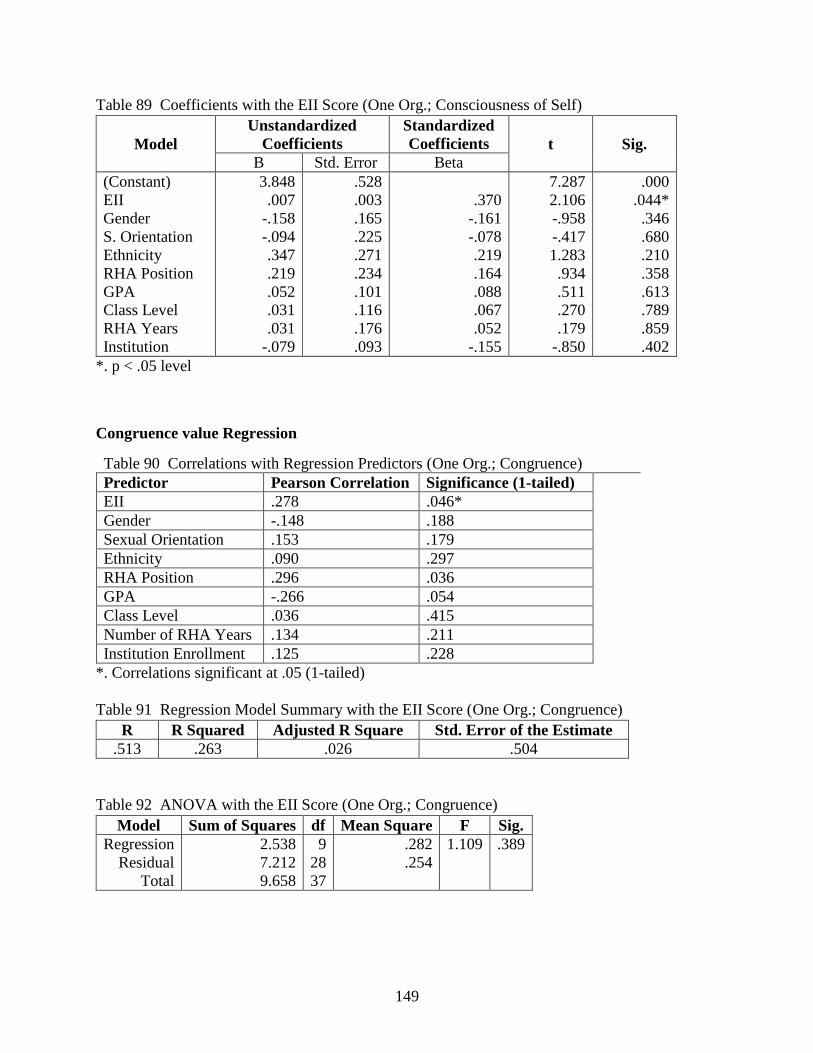
Table 89 Coefficients with the EII Score (One Org.; Consciousness of Self) ............ 149
Table 90 Correlations with Regression Predictors (One Org.; Congruence) .............. 149
Table 91 Regression Model Summary with the EII Score (One Org.; Congruence).. 149
Table 92 ANOVA with the EII Score (One Org.; Congruence) ................................. 149
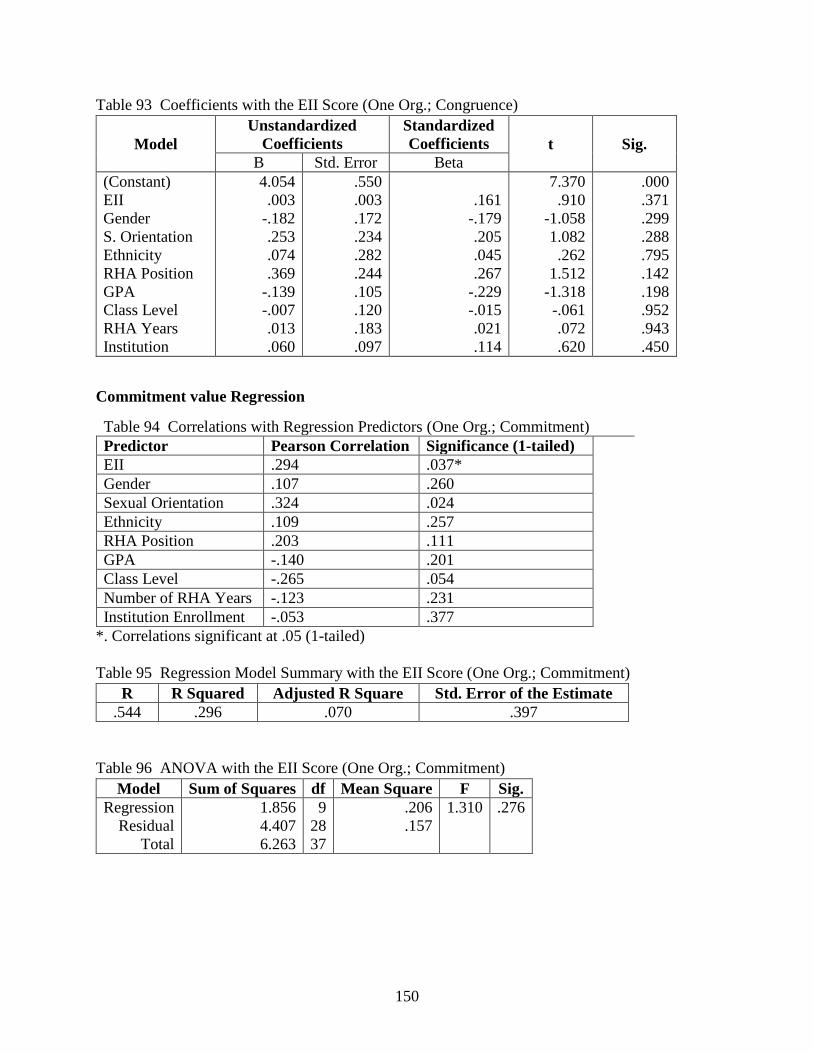
Table 93 Coefficients with the EII Score (One Org.; Congruence) ............................ 150
Table 94 Correlations with Regression Predictors (One Org.; Commitment) ............ 150
Table 95 Regression Model Summary with the EII Score
(One Org.; Commitment) ............................................................................. 150
Table 96 ANOVA with the EII Score (One Org.; Commitment) ............................... 150
Table 97 Coefficients with the EII Score (One Org.; Commitment) .......................... 151
Table 98 Correlations with Regression Predictors (One Org.; Self Component) ....... 151
Table 99 Regression Model Summary with the EII Score
(One Org.; Self Component) ........................................................................ 151
Table 100 ANOVA with the EII Score (One Org.; Self Component) .......................... 151
Table 101 Coefficients with the EII Score (One Org.; Self Component) ..................... 152
Table 102 Correlations with Regression Predictors (One Org.; Collaboration) ........... 152
Page 16
xvi
Table 103 Regression Model Summary with the EII Score
(One Org.; Collaboration) ............................................................................ 152
Table 104 ANOVA with the EII Score (One Org.; Collaboration) .............................. 152
Table 105 Coefficients with the EII Score (One Org.; Collaboration) ......................... 153
Table 106 Correlations with Regression Predictors (One Org.; Common Purpose) .... 153
Table 107 Regression Model Summary with the EII Score
(One Org.; Common Purpose) ..................................................................... 153
Table 108 ANOVA with the EII Score (One Org.; Common Purpose) ....................... 153
Table 109 Coefficients with the EII Score (One Org.; Common Purpose) .................. 154
Table 110 Correlations with Regression Predictors
(One Org.; Controversy with Civility) ......................................................... 154
Table 111 Regression Model Summary with the EII Score
(One Org.; Controversy with Civility) ......................................................... 154
Table 112 ANOVA with the EII Score (One Org.; Controversy with Civility) ........... 154
Table 113 Coefficients with the EII Score (One Org.; Controversy with Civility) ...... 155
Table 114 Correlations with Regression Predictors (One Org.; Group Component) ... 155
Table 115 Regression Model Summary with the EII Score
(One Org.; Group Component) .................................................................... 155
Table 116 ANOVA with the EII Score (One Org.; Group Component) ...................... 155
Table 117 Coefficients with the EII Score (One Org.; Group Component) ................. 156
Table 118 Correlations with Regression Predictors
(One Org.; Citizenship/Society Component) ............................................... 156
Table 119 Regression Model Summary with the EII Score
(One Org.; Citizenship/Society Component) ............................................... 156
Table 120 ANOVA with the EII Score (One Org.; Citizenship/Society Component) . 156
Table 121 Coefficients with the EII Score
(One Org.; Citizenship/Society Component) ............................................... 157
Page 17
xvii
Table 122 Correlations with Regression Predictors (One Org.; Change) ..................... 145
Table 123 Regression Model Summary with the EII Score (One Org.; Change) ......... 157
Table 124 ANOVA with the EII Score (One Org.; Change) ........................................ 157
Table 125 Coefficients with the EII Score (One Org.; Change) ................................... 158
Table 126 Correlations with Regression Predictors
(Multi-Orgs.; Overall SRLS score) .............................................................. 159
Table 127 Regression Model Summary with the EII Score
(Multi-Orgs.; Overall SRLS score) .............................................................. 159
Table 128 ANOVA with the EII Score (Multi-Orgs.; Overall SRLS score) ................ 159
Table 129 Coefficients with the EII Score (Multi-Orgs.; Overall SRLS score) ........... 160
Table 130 Correlations with Regression Predictors
(Multi-Orgs.; Consciousness of Self) .......................................................... 160
Table 131 Regression Model Summary with the EII Score
(Multi-Orgs.; Consciousness of Self) .......................................................... 160
Table 132 ANOVA with the EII Score (Multi-Orgs.; Consciousness of Self) ............. 160
Table 133 Coefficients with the EII Score (Multi-Orgs.; Consciousness of Self) ........ 161
Table 134 Correlations with Regression Predictors (Multi-Orgs.; Congruence).......... 161
Table 135 Regression Model Summary with the EII Score
(Multi-Orgs.; Congruence) .......................................................................... 161
Table 136 ANOVA with the EII Score (Multi-Orgs.; Congruence) ............................. 161
Table 137 Coefficients with the EII Score (Multi-Orgs.; Congruence) ........................ 162
Table 138 Correlations with Regression Predictors (Multi-Orgs.; Commitment) ........ 162
Table 139 Regression Model Summary with the EII Score
(Multi-Orgs.; Commitment) ......................................................................... 162
Table 140 ANOVA with the EII Score (Multi-Orgs.; Commitment) ........................... 162
Table 141 Coefficients with the EII Score (Multi-Orgs.; Commitment) ...................... 163
Page 18
xviii
Table 142 Correlations with Regression Predictors (Multi-Orgs.; Self Component) ... 163
Table 143 Regression Model Summary with the EII Score
(Multi-Orgs.; Self Component) .................................................................... 163
Table 144 ANOVA with the EII Score (Multi-Orgs.; Self Component) ...................... 163
Table 145 Coefficients with the EII Score (Multi-Orgs.; Self Component) ................. 164
Table 146 Correlations with Regression Predictors (Multi-Orgs.; Collaboration) ....... 164
Table 147 Regression Model Summary with the EII Score
(Multi-Orgs.; Collaboration) ........................................................................ 164
Table 148 ANOVA with the EII Score (Multi-Orgs.; Collaboration) .......................... 164
Table 149 Coefficients with the EII Score (Multi-Orgs.; Collaboration) ..................... 165
Table 150 Correlations with Regression Predictors
(Multi-Orgs.; Common Purpose) ................................................................. 165
Table 151 Regression Model Summary with the EII Score
(Multi-Orgs.; Common Purpose) ................................................................. 165
Table 152 ANOVA with the EII Score (Multi-Orgs.; Common Purpose) ................... 165
Table 153 Coefficients with the EII Score (Multi-Orgs.; Common Purpose) .............. 166
Table 154 Correlations with Regression Predictors
(Multi-Orgs.; Controversy with Civility) ..................................................... 166
Table 155 Regression Model Summary with the EII Score
(Multi-Orgs.; Controversy with Civility) ..................................................... 166
Table 156 ANOVA with the EII Score (Multi-Orgs.; Controversy with Civility) ....... 166
Table 157 Coefficients with the EII Score (Multi-Orgs.; Controversy with Civility) .. 167
Table 158 Correlations with Regression Predictors
(Multi-Orgs.; Group Component) ................................................................ 167
Table 159 Regression Model Summary with the EII Score
(Multi-Orgs.; Group Component) ................................................................ 167
Table 160 ANOVA with the EII Score (Multi-Orgs.; Group Component) .................. 167
Page 19
xix
Table 161 Coefficients with the EII Score (Multi-Orgs.; Group Component) ............. 168
Table 162 Correlations with Regression Predictors
(Multi-Orgs.; Citizenship/Society Component) ........................................... 168
Table 163 Regression Model Summary with the EII Score
(Multi-Orgs.; Citizenship/Society Component) ........................................... 168
Table 164 ANOVA with the EII Score
(Multi-Orgs.; Citizenship/Society Component) ........................................... 168
Table 165 Coefficients with the EII Score
(Multi-Orgs.; Citizenship/Society Component) ........................................... 169
Table 166 Correlations with Regression Predictors (Multi-Orgs.; Change) ................. 169
Table 167 Regression Model Summary with the EII Score (Multi-Orgs.; Change)..... 169
Table 168 ANOVA with the EII Score (Multi-Orgs.; Change) .................................... 169
Table 169 Coefficients with the EII Score (Multi-Orgs.; Change) ............................... 170
Page 20
xx
LIST OF FIGURES
Figure 1 Three Components of the Leadership Development Model .......................... 13
Figure 2 Approval to use Extracurricular Involvement Inventory ............................. 125
Figure 3 Approval to use Socially Responsible Leadership Scale, Revision 2 .......... 126
Page 21
xxi
KEY TO ABBREVIATIONS
EII ........................................ Extracurricular Involvement Inventory (Winston & Massaro, 1987)
EII SQ .................................................................. Extracurricular Involvement Inventory Squared
GLACURH ............................... Great Lakes Affiliate of College and University Residence Halls
HERI ...................................................................................... Higher Education Research Institute
LID ............................................................................................. Leadership Identity Development
(Komives, Longerbeam, Owen, Mainella, & Osteen, 2006)
MSL .................................................................................. Multi-Institutional Study of Leadership
NACURH .................................. National Association of College and University Residence Halls
NCC ................................................................................... National Communications Coordinator
NCLP ................................................................ National Clearinghouse for Leadership Programs
RHA ............................ Residence Hall Association (On-Campus Housing Student Organization)
SCM ........................................ Social Change Model for Leadership Development (HERI, 1996)
SRLS (SRLS-R2) .......................................... Socially Responsible Leadership Scale (Revision 2)
(National Clearinghouse for Leadership Programs [NCLP], n.d.; Tyree, 1998)
Page 22
1
Chapter 1: Introduction
One of the main purposes of higher education institutions since the establishment of
Harvard is the development of future societal leaders (Thelin, 2004). Additionally, one of the
ways these future leaders develop their leadership skills is through participation in
extracurricular activities such as registered student organizations (Dugan, 2006b; Dugan &
Komives, 2007; Dugan & Komives, 2010). Kuh (1995) argued that students often see the true
learning at college occurring through these student organizations and not through the curriculum.
Although specific academic majors develop future leaders in their respective fields, I argue that
responsibility for developing future societal leaders has fallen on extracurricular activities,
especially student organizations, and not simply through the formal curriculum (McIntire, 1989).
College administrators reinforce research that states that the more involved students are
in their college experience, the more likely they are to persist to graduation (Astin, 1984) by
encouraging students to become involved in student organizations. Additionally, involvement in
student organizations provides opportunity for students to develop the skills needed to succeed in
full-time positions after graduation (Astin, 1993). However, there is little research that looks at
the outcomes of being involved in multiple organizations, especially related to leadership
development. The purpose of this study was to identify the relationship between the intensity of
involvement in student organizations and college students’ leadership values. In other words, are
there signs of diminishing returns as college students’ intensity of involvement increases in
regards to their leadership development?
The research on involvement in extracurricular activities, such as student organizations,
has focused on that involvement’s influence on the overall college experience (Abrahamowicz,
1988), academic performance (Baker, 2008), or the psychosocial development of college
Page 23
2
students (Cooper, Healy, & Simpson, 1994; Foubert & Grainger, 2006; Hernandez, Hogan,
Hathaway, & Lovell, 1999; Williams & Winston, 1985). Although there are several studies that
looked at involvement in student organizations in general, much of the research focuses on
specific types of student organizations such as social Greek associations (Hunt & Rentz, 1994;
Winston & Saunders, 1987), campus-wide student governments (Miles, 2011, Miller & Kraus,
2004), college athletics (Astin, 1993; Grandzol, Perlis, & Draina, 2010), and community service
opportunities (Astin & Sax, 1998; Hernandez et al., 1999). The results from this research
support the argument that becoming involved in student organizations influences students’
academic performance, psychosocial development, and leadership development, both positively
and negatively. Only since the 1990s has there been research on the relationship between
involvement in student organizations and developing student leaders (Dugan & Komives, 2007).
It was during the 1990s when the Social Change Model for Leadership Development (SCM,
Higher Education Research Institute, 1996) and the Student Leadership Practices Inventory
(SLPI, Kouzes & Posner, 1998), which is based on The Leadership Challenge (Kouzes & Posner,
2003), were established. Both of these were developed with the college student in mind.
Although there have been attempts to do so, there is no agreed upon definition of
leadership, nor an accepted definition of college student leadership (Komives, Lucas, &
McMahon, 2006). Every individual has their own definition of what leadership means and what
skills and qualities a good leader possesses. These definitions connect to the varying leadership
theories that range from leadership is innate and not teachable to beliefs that leadership can be
learned and revolves around common vision and goals, i.e., reciprocal leadership (Komives,
Lucas, et al., 2006). Reciprocal leadership is defined as an approach in which the focus is on
mutual goals and development, not just the leader’s goals and vision and includes theories like
Page 24
3
servant-leadership, transformational leadership, and followership leadership (Komives, Lucas, et
al., 2006). With that said, there are leadership theories that are more pertinent than others to
college student leadership, especially in today’s society. The majority, if not all, of the
leadership theories used with college students involved in student organizations fall under the
concept of reciprocal leadership. One main reason is that through student organization
involvement college students interact with each other on a regular basis which encourages
concepts of reciprocal leadership. Furthermore, research shows that peer interaction, especially
in student organizations, is one of the key factors of college student development, including
leadership development (Astin, 1993).
Two key relational leadership theories are the Student Leadership Challenge (Kouzes &
Posner, 2009) and the Social Change Model of Leadership Development (HERI, 1996). These
theories have well-established instruments that measure a student’s level of development on each
component of the theory (Dugan & Komives, 2007; Kouzes & Posner, 1998; Posner, 2004;
Tyree, 1998). Each instrument, the SLPI (Kouzes & Posner, 1998; Posner, 2004) and the
Socially Responsible Leadership Scale (SRLS, Tyree, 1998) has been used in several studies and
reported to be reliable and valid instruments (Dugan, 2006a, 2006b; Dugan & Komives, 2007;
Dugan, Komives, & Segar, 2008; Posner, 2004, 2009; Posner & Brodsky, 1993, 1994).
Recent studies that examined the relationship between involvement in student
organizations and leadership development used one of the previously listed leadership
development theories (Student Leadership Challenge or SCM). These studies concluded that
students involved in student organizations scored higher on certain values (e.g., Consciousness
of Self, Collaboration) (Dugan, 2006b) or practices (e.g., model the way, challenge the process)
(Posner & Brodsky, 1993, 1994) connected to leadership development than students not involved
Page 25
4
in student organizations. Additionally, two studies using the Student Development Task and
Lifestyle Inventory (Winston, Miller, & Prince, 1987), which is based on Chickering’s (1969)
original theory on psychosocial development, looked at the psychosocial development of
students involved in student organizations and their level of involvement (e.g., attended meetings
only, actively involved, or held an executive board position) (Cooper et al., 1994; Foubert &
Grainger, 2006). Both of these studies found that students either actively involved or holding a
position in a student organization scored higher on the psychosocial development indicators than
students who only attended meetings (Cooper et al., 1994; Foubert & Grainger, 2006). Although
these studies used psychosocial development as the dependent variable, results are similar to the
studies with leadership development as the dependent variable in that those students involved in
student organizations scored higher on the corresponding instrument variables (e.g.,
Consciousness of Self, model the way) than those not involved or who only attended meetings.
Much of the research previously mentioned focuses on college students’ involvement in
student organizations. However, it is important to understand that college students can be
involved in other aspects of the college experience, such as working on campus, interacting with
faculty, living on campus, or participating in athletic events (Astin, 1984). Astin (1984) argued
that students who are involved in their college experience through these types of activities are
more likely to persist through to graduation and develop personal skills in direct proportion to
the quantity and quality of effort put forth. Quantity is defined as the number of hours put
towards an activity, while quality is the accumulation of effort put towards completing a specific
activity (Astin, 1984). The combination of quantity and quality can also be described as
“intensity of involvement” (Winston & Massaro, 1987), which can vary by the type of
involvement, including different student organizations.
Page 26
5
There is little research that studies the relationship between the intensity of involvement
in student organizations and college student development, in any form, including psychosocial,
cognitive, or leadership. The one study that examined the intensity of involvement in student
organizations looked at the six intrapersonal values based on the Survey of Interpersonal Values
(Fitch, 1991). The results found that students who were considered moderately involved in
student organizations (e.g., scores on the Extracurricular Involvement Inventory (EII) that were
scored between – 0.5 and + 0.5 SD) scored higher on the interpersonal value of benevolence (i.e.,
serving others) than those considered low involvement (scores lower than – 0.5 SD) and high
involvement (scores higher than + 0.5 SD) (Fitch, 1991). The results related to the interpersonal
value of benevolence highlights that being highly involved does not guarantee higher scores on
all of the interpersonal values, and that at least on this measure, being moderately involved is
linked to greater valuing of serving others than those highly involved. One reason for this
finding could possibly be that those highly involved were focused on themselves (Fitch, 1991).
Additionally, the study reported that students considered highly involved scored higher on the
interpersonal value of leadership than students who were lowly and moderately involved (Fitch,
1991). What is important to understand from this study is that the interpersonal value of
leadership was described as “being in charge of others and having authority over others” (Fitch,
1991, p. 28). This is significantly different from reciprocal leadership that focuses on mutual
goals and development (Komives, Lucas, et al., 2006). Although Fitch (1991) found that those
who were considered highly involved scored higher on the interpersonal value of leadership than
those who were moderately involved or lower, the definitions of leadership from Fitch and this
current study differ, which may lead to different results between the two studies.
Page 27
6
In a second study that reported results regarding intensity of involvement and leadership
development, the 2006 Multi-Institutional Study of Leadership (MSL), Dugan and Komives
(2007) concluded that involvement in too many student organizations was negatively related to
leadership outcomes when measured using the SCM. The recommendation from this study was
to encourage students to focus on one organization because the results indicated that being
involved in more than one organization did not have a positive influence on leadership
development as defined by SCM (Dugan & Komives, 2007). It is important to realize that this
finding and the related recommendation were not the main focus of the MSL, which was to
“increase the capacity of both leadership educators and institutions in developing the critical
leadership skills in students that are so needed by the society” (Dugan & Komives, 2007, p. 8).
The recommendation regarding involvement in student organizations was one of ten
recommendations resulting from analysis of the MSL data. With all of this in mind, little is yet
known about the relationship between this intensity of involvement in student organizations and
leadership development, either in one or multiple organizations.
As mentioned previously, most studies that looked at student organization involvement
focused on social Greek associations, campus-wide student governments, college athletics, and
community service opportunities. On most campuses, there is an organization, typically called
Residence Halls Association (RHA), representing a large group of students which has one
commonality: living in campus housing units. Unlike many of the other organizations on a
college campus, there are no additional requirements for being a member of RHA beyond living
on campus. Furthermore, since RHA represents all of the students who live in campus housing
units, typically the largest sub-group of students on a campus, RHAs are typically seen as a key
student organizations, along with the campus’ overall student government. Directors of
Page 28
7
university housing, or similar positions, rely on feedback from RHAs regarding policies,
procedures, and budgets relating to campus housing (Miller & Papish, 1993). The main advisor
of RHAs is a professional staff member whose job responsibilities include serving as the RHA
advisor (Boersig, 1993) In addition, typically at the beginning of each academic year, RHAs
spend a significant about of time (four hours or more) focused on developing member leadership
skills and values. This training usually is done in two sessions; one for the executive board
members and the second for the general RHA members. Due to RHAs presence on college
campuses, those they represent, and the training sessions, I am interested in knowing how
involvement in RHAs influences the development of college student leaders.
The purpose of this study is to identify the relationship between the intensity of
involvement in student organizations and college students’ leadership development. In other
words, are there signs of diminishing returns as college students’ intensity of involvement
increases in regards to their leadership development as defined by the Social Change Model of
Leadership Development? The question driving this study is: how does the intensity of
involvement in multiple student organizations, one of which is the campus-wide on-campus
housing student government/organization (RHA), influence college students’ leadership values?
Definition of Terms
The following is a list of those terms and abbreviations used in this study.
College Student. For the purpose of this study, the term college student refers to a
traditional-aged student, 18-23, who began their college experience 1-2 years after graduating
high school. Typically, students who are involved with RHAs meet this definition.
Student Organization. A student organization is a volunteer group of college students
with a common purpose (curricular or non-curricular) that is officially recognized by and
Page 29
8
registered with the department of Student Life, or similar department, at a higher education
institution. Recognized groups have complied with all of the policies for being a student
organization at that institution. Registered is defined as adhering to the yearly requirements that
leads to specific benefits, e.g. reserving meeting space or requesting event funding.
Quality. The accumulation of effort a college student puts forth to help the organization
reach its goals (Astin, 1984).
Quantity. The number of hours a college student commits to a certain organization
(Astin, 1984).
Intensity of Involvement. The function of the quality and quantity a college student
commits to a certain organization (Winston & Massaro, 1987).
Extracurricular Involvement Inventory. Assessment tool that transfers a student’s
intensity of involvement in student organizations into a numerical reference (Winston &
Massaro, 1987).
Socially Responsible Leadership Scale. Assessment tool built to measure a college
student’s development in the seven values of the Social Change Model of Leadership
Development (Tyree, 1998).
Residence Hall Association (RHA). The campus-wide student government organization
that represents all students living on campus.
Conceptual Framework
During the 1990s, leadership development theories based on college students and their
leadership experiences emerged (Dugan & Komives, 2007). The two most prominent theories
that developed are the Social Change Model of Leadership Development (SCM, Higher,
Education Research Institute [HERI], 1996) and the Leadership Challenge (Kouzes & Posner,
Page 30
9
2003). The Leadership Challenge was originally developed from hundreds of interviews with
individuals from the corporate world; the theory highlights five practices of exemplary leaders.
Although the creation of an instrument to measure the development of these theories in college
students emerged in the 1990s (Kouzes & Posner, 1998), the official Student Leadership
Challenge concept materialized in the early 2000s (Kouzes & Posner, 2009).
More recently, the Leadership Identity Development theory (Komives, Longerbeam, et
al., 2006; Komives, Owen, Longerbeam, Mainella, & Osteen, 2005) and the Relational
Leadership theory (Komives, Lucas, et al., 2006) joined the college student leadership
development arena. The Leadership Identity Development (LID) theory is considered a stage
theory and was developed using grounded theory (Komives, Longerbeam, et al., 2006). LID
argues that college students’ views of leadership move from the traditional view of leadership
that sees it as being a trait or behavior to the idea of leadership as mutual goals and development,
or interdependent (Komives, Longerbeam, et al., 2006). The first stage, Awareness, is when a
college student recognizes leaders and the concept of leadership but it is seen as something
others possess, not the student. As the student moves through the six stages, eventually the
student will reach the last stage, Integration/Synthesis. At this point, the student is aware of the
importance of being interdependent with fellow leaders and continues his/her own leadership
development which includes congruence (e.g., beliefs and actions are the same) (Komives,
Longerbeam, et al., 2006).
The Relational Leadership Model (Komives, Lucas, et al., 2006) puts relationships at the
core of the leadership development process. These relationships revolve around establishing a
commitment to a positive purpose by being inclusive of people and ideas, empowering
participants to be active, and being driven by ethical actions. The process, or how the purpose is
Page 31
10
accomplished, is just as pertinent as the outcomes. The Relational Leadership Model argues that
in order to be successful in the leadership process, individuals must be knowledgeable, self-
aware, aware of others, and willing to take action (Komives, Lucas, et al., 2006). The ultimate
goal of the Relational Leadership Model is for members to focus on the relational part of
leadership and work toward mutual goals and development.
Of the four theories briefly described, instruments to measure college students’ level of
leadership development were created for the Leadership Challenge and SCM. As mentioned
earlier, the Leadership Challenge was developed from interviews of individuals in the corporate
world and was then adapted to college students. SCM, on the other hand, was developed from
college students and their leadership experiences (HERI, 1996). Currently, the Leadership
Identity Development and Relational Leadership Model theories do not have instruments to
measure the level of development of college students.
The SCM focuses on how an individual develops leadership values through group
interactions that focus on positive change in the society (Kezar, Carducci, & Contreras-
McGavin, 2006). The overall concept of Reciprocal Leadership theories focuses on how group
interactions assist in a college student’s leadership development, which are explained in the next
chapter. Although there are no critiques of the SCM, the main concerns of Reciprocal
Leadership theories in general are the lack of resources on how to develop collaborative team
work in organizations that are hierarchical and bureaucratic in nature and the lack of attention on
the influence of the leader (Kezar et al., 2006). The team/group concentration of Reciprocal
Leadership theories is the main reason SCM is used as the framework for this study. Much of
college students’ leadership development is completed through involvement in student
organizations. These organizations, even though they usually consist of a president and
Page 32
11
executive board, have an overarching theme of team/group interaction. Due to this close
connection to team/group interaction and the fact SCM was created with college student leaders
in mind, it fits well with studying leadership development. Furthermore, there is an instrument
that is statistically reliable and valid based on it, and has been widely studied over the past 15
years.
The SCM was developed as a result of a grant from the Dwight D. Eisenhower
Leadership Development program (HERI, 1996). The assumptions of the SCM are (1)
leadership is more of a process and not a position, (2) leadership is collaborative, (3) all students
have the potential to be leaders, (4) leadership should be based on values, (5) leadership can be
developed through service to others and the community, and (6) leadership encourages change in
others and the society (HERI, 1996). The SCM supports the belief that any student can develop
leadership attributes, with or without serving in an executive board position. Furthermore,
leadership involves individuals working together to affect positive change in others and the
society, which can be done through service to the community. Since the model focuses on
positive change that can affect society in general, the creator named it the Social Change Model
of Leadership Development (HERI, 1996).
The goals of the SCM focus on developing self-knowledge and leadership competencies
in individual college students and enhancing positive change, specifically at higher education
institutions and the related communities (HERI, 1996). These goals are reached through the
connection of three components of the model: individual, group, and society (HERI, 1996). The
values and components connected to the SCM are individual values-Consciousness of Self,
Congruence, Commitment; group-Collaboration, Common Purpose, Controversy with Civility;
and society-Citizenship (see Table 1 for definitions, HERI, 1996).
Page 33
12
Table 1 Values Definitions for the Social Change Model of Leadership Development
Value Definition
Consciousness of Self Awareness of the beliefs, values, attitudes, and emotions that
motivate on to take action.
Congruence Thinking, feeling, and behaving with consistency, genuineness,
authenticity, and honesty towards others; actions are consistent
with most deeply-held beliefs and convictions.
Commitment The psychic energy that motivates the individual to serve and
that drives the collective effort; implies passion, intensity, and
duration, and is directed toward both the group activity as well
as its intended outcomes.
Collaboration To work with others in a common effort; constitutes the
cornerstone value of the group leadership effort because it
empowers self and others through trust.
Common Purpose To work with shared aims and value; facilitates the group’s
ability to engage in collective analysis of issues at hand and the
task to be undertaken.
Controversy with Civility Recognizes two fundamental realities of any creative group
effort; that differences in viewpoint are inevitable, and that
such differences must be aired openly, but with civility.
Civility implies respect for others, a willingness to hear each
other’s views, and the exercise of restraint in criticizing the
views and actions of others.
Citizenship The process whereby an individual and the collaborative group
become responsibly connected to the community and the
society through the leadership development activity. To be a
good citizen is to work for positive change on the behalf of
others and the community.
Change The ability to adapt to environments and situations that are
constantly evolving, while maintaining the core functions of
the group.
Source: Higher Education Research Institute. (1996). as cited in Dugan, J. P. and Komives, S.
R. (2010). Influences on college students’ capacities for socially responsible leadership.
Journal of College Student Development, 51(5), 525-549
Figure 1 highlights the connection between the three components and related values. The
arrows indicate that the development of a component’s values influence the development of
another component’s values. For example, the concept of Controversy with Civility will not be
developed unless the individuals involved have strong values related to Congruence and
Page 34
13
Commitment (Komives, Lucas, et al., 2006). Detailed descriptions of the key values and the
relationship between the three groups are found in chapter two.
Conclusion
Although developing societal leaders has been a focus of American higher education
since its inception, the vehicle for that development process has migrated from the formal
curriculum to extracurricular activities such as student organizations. Furthermore, the concept
of leaders and leadership has also morphed from being individualistic and trait-related to being
relational and developmental. Research shows that involvement in student organizations is
beneficial for college students’ development, i.e., psychosocial, cognitive, leadership. However,
Page 35
14
little is known about the influence of being involved in multiple organizations on leadership
development.
While there are several leadership development models constructed from college student
leadership experiences, the Social Change Model for Leadership Development was used in this
study. Two main reasons for this decision are (1) the model was developed from college
students’ experiences, and (2) there is a valid and reliable instrument built from the model. The
research question driving this study is: how does the intensity of involvement in multiple student
organizations, one of which is the campus-wide on-campus housing student
government/organization (RHA), influence college students’ leadership development?
Page 36
15
Chapter 2: Literature Review
The question driving this study is: how does the intensity of involvement in multiple
student organizations, one of which is the campus-wide on-campus housing student
government/organization (RHA), influence college students’ leadership development? With the
emergence of the Student Affairs profession in the early 1930s, colleges and universities
broadened their focus to educating the “whole student” (Terenzini, Pascarella, & Blimling, 1996,
p. 196), which included engaging students both in and outside of the classroom. Thelin (2004)
notes that since the inception of American higher education, college students have valued their
out-of-class experiences more than the knowledge gained in the classroom. As the student
population increased and became more diverse, the nature and number of these experiences have
grown to include student organizations that represent an array of student interests.
Consequently, students have opportunities to join a variety of organizations that reflect
their multiple interests, which has increased the likelihood that students are committed to more
than one organization at a time. Through this type of participation, students involved in student
organizations, either as an active member or as an executive board member, tend to develop
more positive interpersonal and intrapersonal skills than students who either only attended
meetings or were not involved in student organizations (Cooper et al., 1994; Fitch, 1991; Foubert
& Grainger, 2006). Furthermore, college students involved in student organizations are more
likely to increase their leadership attributes than students who do not participate in student
organizations (Dugan, 2006b; Dugan & Komives, 2007; Dugan & Komives, 2010). With that
said, little is known about the relationship between involvement in multiple student organizations
and leadership development. In other words, is the relationship linear, in which increases in
student organization involvement lead to increases in leadership development, or is the
Page 37
16
relationship curvilinear, where there is a point when an increase in one variable leads to a
decrease in the other variable?
This review of literature focuses on five specific topics. At the conclusion of this
chapter, the reader will have a better understanding of (1) the evolution of leadership theories
and ones that are prevalent in today’s society, (2) the Social Change Model for Leadership
Development (SCM, Higher Education Research Institute [HERI], 1996), (3) student
involvement theory and benefits of participating in registered student organizations, and (4).
residence hall associations. The gaps in the literature that lead to the purpose of this study are
also identified.
Evolution of Leadership Theories
In this section, the evolution of leadership development theories is discussed. These
theories can be divided between the industrial and post-industrial paradigms of leadership
(Komives, Lucas, et al., 2006). The industrial paradigm is defined as a focus on the hierarchical
concepts of leadership including leaders and followers (Finley, 1994). In the industrial
paradigm, the effectiveness of leadership is due to the leader, not to the relationship with others
(Finley, 1994). The post-industrial paradigm of leadership, on the other hand, is one that focuses
on the social relationship between those involved (Dugan, 2006b). The emphasis is on positive
change for the better of the organization, or community, and the effectiveness of leadership is
due to the relationship and all individuals connected to that organization.
The industrial paradigm includes leadership theories that purport that leaders are born,
not made; there are specific traits needed to be leader; there is only one way to lead; or that
different situations require different leadership (Kezar et al., 2006; Komives, Lucas, et al., 2006).
Although Komives, Lucas, et al. (2006) state that the emergence of these theories took place
Page 38
17
during the mid-1800s and lasted until the late-1900s, I argue that the industrial paradigm theories
were in existence during the early establishment of higher education institutions in the United
States, well before the mid-1800s. One reason for this argument is that one of the main goals of
higher education was to develop societal leaders from the sons of well-known business men and
clergy. In other words, help those who supposedly already have the leadership traits build on
those traits and develop into societal leaders. Even though these theories served American
higher education well during the early years, views about leadership development and the
relationship between leaders and followers evolved (Komives, Lucas, et al., 2006). In the late-
1900s, theories focusing on the importance of the relationship between all those involved in the
leadership experience and on the idea that leadership is not simply innate but can be taught
emerged (Kezar et al., 2006). These theories marked the beginning of the post-industrial
paradigm of leadership development.
The post-industrial paradigm encompasses two leadership approaches: reciprocal, and
chaos/systems (Komives, Lucas, et al., 2006). These approaches led to theories that focus on the
importance of the relationship between members of the organization, leaders and followers
together (Komives, Lucas et al., 2006). Theories under the reciprocal approach are based on the
belief that every member gains something from being involved in the organization, not just the
leader. Furthermore, the organization accomplishes its goals and visions through the
relationships built between the members. The overarching principle of the chaos/systems
approach is that everything is interconnected and relationships are critical to the success of the
organization (Kezar et al., 2006). Behaviors are adapted through interactions with the
environment and others. Since the SCM (HERI, 1996) falls under the reciprocal approach of
Page 39
18
leadership development, the following section discusses the major leadership theories that are
seen as reciprocal approaches.
Reciprocal Approach Theories
The reciprocal approach consists of several theories, however the three key theories are:
transformative leadership, servant-leadership, and followership (Komives, Lucas, et al., 2006).
Transformative leadership is built from the assumption that leadership is connected to the needs
and goals of the followers (Burns, 1978). The ultimate purpose of transformative leadership is
the development of deeper ethical goals and actions in all who are involved in the group, i.e.,
leaders and followers (Komives, Lucas, et al., 2006). The relationship between leaders and
followers is based on mutual motivation (Kuhnert & Lewis, 1987). Leaders such as John F.
Kennedy, Mother Teresa, and Martin Luther King, Jr. are examples of transformative leaders
(Bass, 1990). One way transformative leadership is seen in a college student organization is
when a president works with members of an organization, such as a community service group, to
highlight the level of homeless in a city. Ideally, working together on the project leads to greater
ethical aspirations and actions in the future. Transformational leadership is usually compared to
transactional leadership, which focuses more on how each person can benefit from the other’s
involvement, or when there is an exchange of possessions (Komives, Lucas, et al., 2006). A key
difference between these two theories is what the followers gain from the relationship. Through
transactional leadership, followers get something that is more self-serving while transformational
leadership assists in the development of deeper ethical goals and behavior. An example of
transactional leadership in a student organization is when members of the organization entice
students to become involved simply for the chance to put the activity on their resume; there is no
mention of how the involvement will better the students ethically. Due to the collaborative
Page 40
19
nature of transformational leadership, it is considered a reciprocal approach to leadership
development.
Servant-leadership theory is based on a person’s passion to serve others. Servant leaders
become involved in an organization, activity, or event because of their desire to assist others, not
because it looks good on their resume or because they want to be seen as the leader (Komives,
Lucas, et al., 2006). This is why the theory is called SERVANT-leadership; the term servant is
before leadership because serving others is their purpose, not being seen as a leader; even though
because of their passion to serve, these individuals become leaders (Greenleaf, 2002) An
example of this type of leadership is a college student who lives in a residence hall and joins the
policy and procedure committee of the Residence Hall Association in order to ensure the housing
policies are appropriate and to advocate for other residents. It is very likely that due to this
desire and level of commitment to the goals of the committee and to the community, the student
will be seen as a leader in this group. The student did not join simply to be seen as a leader in
the organization or to include the experience on a resume, but because the student wanted to
advocate for the residents. Servant-leadership is seen as a reciprocal approach to leadership
because the desire to serve others is more important than what the student gains from the
experience.
The last key theory under the heading of reciprocal approaches is followership. The
followership theory is based on the relationship between the leader and the followers. It is not a
relationship in which followers are passive, that leaders tell the followers what to do and they do
it. Instead, the effective follower is one who demonstrates critical thinking, not dependent on the
leader, and is active in process (Kelley, 1988). In this relationship, the effective follower listens
to the leader and determines how to help the leader reach the goals of the organization by
Page 41
20
thinking for themselves and bringing suggestions to the leader. It is also important for the
leaders to realize that they are not necessarily better than the followers, but that they are equal in
importance even if the responsibilities vary (Kelley, 1988). Smith (1996) described followership
as, “a subtle act of leadership” (p. 204), which links these roles closely together.
Summary
Understanding the evolution of leadership theories from those based on innate ability and
behavior to theories that stress the importance of mutual development and goals of all involved is
central to appreciate the current state of leadership development higher education institutions.
Although the birth of American higher education occurred during the industrial paradigm and the
prevalent theories of that time, leadership development opportunities available at American
higher education institutions now resemble the three major reciprocal approaches. The next
section describes another theory from the reciprocal approach to leadership development, Social
Change Model of Leadership Development (HERI, 1996) that is used as the main framework for
this study. I contend that SCM uses the three other reciprocal leadership theories as foundational
theories. The key difference between this theory and the three already described is that SCM
was developed for college students and their college experiences (HERI, 1996).
Social Change Model of Leadership Development
The Social Change Model of Leadership Development (SCM) is considered a reciprocal
approach since it is based on assumptions that leadership is collaborative and is more concerned
about the process of reaching goals than in the positions held in an organization (HERI, 1996).
SCM was created from a grant through the Dwight D. Eisenhower Leadership Development
program with the goal of creating a leadership theory based on college students (HERI, 1996).
SCM focuses on the development of self-knowledge and leadership values that are either
Page 42
21
individual, group, or societal. Improving values in one area/component likely leads to improving
values in another area/component. The main focus of SCM is that these interactions lead to
enhanced positive change in higher education institutions and related communities (HERI,
1996). SCM comprises seven values: Consciousness of Self, Congruence, Commitment,
Collaboration, Common Purpose, Controversy with Civility, and Citizenship. Each of the seven
values is described in more detail as well as how the three components build on each other.
Social Change Model Values
Consciousness of self (Individual). A simple definition of this value is being self aware
(HERI, 1996). However, Consciousness of Self involves more than being aware of who you are,
your personality, and what you value and believe; it also entails being able to look at your
actions and thoughts truthfully. In other words, an individual who has a strong Consciousness of
Self value analyzes the reasons behind his or her actions or thoughts; the individual is not simply
“doing” something but knows the reason for the action. Another term for this process is
mindfulness (HERI, 1996; Komives & Wagner, 2009).
It is possible for an individual to develop behaviors that comprise the Consciousness of
Self value. One way is to encourage feedback from others regarding behaviors displayed (HERI,
1996; Komives & Wagner, 2009). Collecting information from external sources, positive and
negative, can help an individual be aware of how others view his or her behaviors. Being open
and sincere to the feedback provided does not necessarily mean that the individual needs to agree
to the feedback and then change his or her actions or thoughts; rather, the individual should
reflect on the feedback and determine if the observation is accurate. For example, the president
of a student organization inadvertently offended members of the executive board with a decision
that led to several members being angry. The president then asks the board members for
Page 43
22
feedback on how things are going in the organization. The angry members may provide
feedback that does not accurately reflect their overall thoughts because the recent decision has
clouded the members’ views.
Personal reflection is another way an individual can enhance the Consciousness of Self
value (HERI, 1996; Komives & Wagner, 2009). Reflection can be done through journal writing,
quietly thinking about past events, or simply talking with friends. The goal is to analyze prior
experiences and determine if the actions and thoughts from the past accurately represent the
individual’s personality, beliefs, and values.
Congruence (Individual). Congruence means how well your actions fit with your
values and beliefs (HERI, 1996). For example, if a college student believes that everyone has a
right to voice an opinion, but this person is consistently interrupting others when sharing their
thoughts, then this individual is probably not displaying the Congruence value. In order to be
strong in the Congruence value, a college student must also be strong in the Consciousness of
Self value. One way that a college student can be aware of when his or her behaviors are not
congruent with personal values or beliefs is having an uncomfortable feeling when acting a
certain way. In the example above, if the college student is strong in the Consciousness of Self
value, he or she may feel uneasy when interrupting others, but does not understand the reason for
the discomfort. Personal reflection and feedback would help this college student become aware
of the incongruence between actions and values.
Commitment (Individual). Commitment describes the amount of time and energy a
college student puts towards an activity and connected outcomes, which relates to personal
values and passions (HERI, 1996). When the activity and outcomes are closely related to
personal values and passions, the student’s commitment will be high. On the other hand, if they
Page 44
23
are loosely connected, the student’s commitment is lower. In this situation, the likelihood that
the student will continue with the activity is low. An example of this low commitment is when a
college student who is passionate about giving back to the community through service decides to
join an organization that touts community service as one of its key pillars. However, during the
first couple of meetings, the topic of community service is briefly mentioned and organizational
members focus more on socializing with each other. The college student appreciates the
opportunity to get to know others in the organization, but values service to the community much
more. Since the organization seems to not value community service as much as the college
student, the student’s commitment to the organization is low. It is likely that the student will
withdraw from the organization and find another one that relates more closely to his or her
values and passions.
Collaboration (Group). The general definition of collaboration is working together with
common goal in mind (HERI, 1996). However, it is not simply meeting to discuss the common
goals or purpose. Collaboration also means having an open mind, discussing differences and
ultimately, coming to a mutual decision. This is different from compromise or cooperation.
Compromise usually entails each party involved letting go of a value or belief for the greater
good (Komives & Wagner, 2009); cooperation is seen when the parties involved combine efforts
to accomplish their individual goals, not mutual goals (HERI, 1996). Although compromise and
cooperation are seen in student organizations, SCM emphasizes reaching a mutual decision
between the parties, which entails self-awareness and willingness to adjust goals for the
betterment of the group, e.g., collaboration. When there is a disagreement in a collaborative
relationship, the parties involved focus on understanding each other and the reasons behind one’s
views, eventually redefining values in order to move the group forward. This process requires
Page 45
24
each party to examine their own individual values (e.g., Consciousness of Self, Congruence,
Commitment) while working for the common purpose of the group.
Common purpose (Group). One way of looking at the Common Purpose value is to
look at shared vision and goals (HERI, 1996). There are two ways shared visions and values are
established. The first is when the leader of a group provides his or her own vision for the group
and then “enrolls”, or persuades, members into that vision (HERI, 1996; Komives & Wagner,
2009). This is possible when the leader’s vision relates to the overall purpose of the group and
connects to the values of members. For example, the president of an outdoor adventure group
shares that his or her vision for the year is for the group to have more non-members than
members attend their weekend adventure trips to hopefully increase membership. Although the
group did not develop this vision together, it is likely that they will agree to it since it still
incorporates their weekend trips, which is the organization’s common purpose. However, when
it comes time for these weekend adventure outings, members may not be as supportive of non-
member attendance as they would be if they were part of creating the vision.
Being part of creating the vision is the other way a shared vision can be developed in
which the president “engages” members in developing the direction for the organization (HERI,
1996). Research has shown that when members are involved in developing the vision or goals
for the organization they are more likely to be committed to accomplishing those goals or vision
(Kouzes & Posner, 2003). With that said, engaging members in developing the common purpose
is not necessarily better than “enrolling” members. Instead, these two ways can be viewed at the
opposite ends of a continuum (HERI, 1996). The best way to develop a common purpose
depends on the positional leaders and members of the organization. If an organization consists
of members who have been part of the group for a year or more, engaging the members in
Page 46
25
determining the vision for the group may be the best route since members are more likely to
understand the mission of the group. However, if the membership is young, approximately less
than a year of involvement, sharing the president’s or executive board’s vision may be better
given that the membership is still learning about the group and its purpose. Another way to
explain the difference between engaging and enrolling members in establishing the group’s
vision is identifying members’ awareness of the group’s organizational culture e.g., beliefs,
ideology (Dill, 1982).
Controversy with civility (Group). Controversy and conflict are usually seen as
interchangeable (HERI, 1996), even while conflict has more of a negative connotation than
controversy (HERI, 1996; Komives & Wagner, 2009). This negative connotation focuses on
“winners” and “losers” and has more of a personal undercurrent (HERI, 1996). Additionally, a
fear of retaliation is connected to the term “conflict”, which may lead to those involved not being
honest with viewpoints (HERI, 1996). Controversy is completely opposite (HERI, 1996). The
undercurrent of “controversy” is that the individuals with differing viewpoints are focused on
resolving the differences in ways that will be favorable to all involved, a win/win situation
(Covey, 1990; HERI, 1996). When a student organization is able to agree to handle differing
opinions in a civil manner, members may feel comfortable sharing opinions that may not be the
same as others hold (Tjosvold, 1989). In order to focus on a win/win outcome, the students
involved need to believe in collaboration and working towards a common purpose (Covey,
1990). However, strongly held viewpoints or a focus on being right and winning will likely
prevent an organization or individuals from handling controversy with civility (Covey, 1990;
HERI, 1996). In order to develop a culture that is supportive of the Controversy with Civility
Page 47
26
value, the organization needs to focus on the other SCM values such as Consciousness of Self,
Congruence, Commitment, Common purpose, and Collaboration.
Citizenship (Society). Citizenship is active engagement in one’s community (HERI,
1996). A college student can be involved in multiple communities, such as their residence hall,
their major, or the overall university. Ideal citizenship is when a college student is a positive
addition to the specific community. One way to do this is to care for the community and help the
overall community reach its goals. Furthermore, the college student interacts with other
members of the community and becomes invested in the positive change that takes place in the
community (Komives & Wagner, 2009). On a college campus, positive citizenship is seen when
college students are involved in student government, campus-wide committees, or in an
activity/event that improves the university (HERI, 1996). For example, at a certain campus
recycling exists but is not promoted well and students continue to throw recyclable items in the
trash. A student organization strongly believes in recycling, promoting the different ways to
recycle and its simplicity. Therefore, the organization develops a campus-wide campaign to
increase the amount of recycling done in the residence halls. In this situation, the student
organization is working on improving the campus and showcasing positive citizenship. In order
to accomplish this task, the students must possess strong Consciousness of Self, Commitment,
and Congruence values. Furthermore, within the organization strong Collaboration, Common
Purpose, and Controversy with Civility values need to be present.
Interaction between Components
This section explains how development in one area’s (e.g., individual, group, society)
values can influence the development of another area’s values, and vice versa. The arrows in
Page 48
27
Figure 1 show this continuous feedback. Ultimately, Figure 1 (page 13) symbolizes the
importance of continuous learning and developing through the seven values.
Individual and group. The continuous feedback between these two areas is shown as
arrows A and B in Figure 1. Arrow A symbolizes the importance of being conscious of one’s
self, congruent, and committed to one’s values and passions when working in a group setting.
Not only are these three values interdependent, it is unlikely that an individual will be successful
in the group values of Collaboration, Common Purpose, and Controversy with Civility if the
individual values are not strong.
Arrow B represents how the development of the group values influences the development
of individual values. For example, individuals may believe that their actions are congruent with
their values and beliefs (Congruence). However, during a group meeting feedback is given to
individuals that indicates that is not true. Therefore, the individuals need to reflect on this
feedback and develop ways to ensure congruence. Another example is when the group is
experiencing controversy with civility. During this situation, an individual may need to re-
evaluate personal values and beliefs and therefore, their consciousness of self, in order to
understand the difference between one’s personal values and beliefs and the values and beliefs of
fellow group members. This may lead to changes in the individual’s values and beliefs for the
betterment of the group.
Group and society. Arrows C and D denote the relationship between the group values
and responsible citizenship. If a group is not handling controversy with civility but behaving
more in a competitive nature, then responsible citizenship, which encourages positive
engagement, is not likely to happen. However, if a group is working collaboratively with a
Page 49
28
common purpose and handling controversy civilly, the campus benefits from the supportive
nature. Positive change will be seen at the campus through responsible citizenship.
Arrow D signifies how the community can influence the group members and their
development. An example is when the Young Democrats organization decides to protest a
decision of the administration. The results of the protest, either positive or negative, will
influence the development of the group’s values and how the group will interact with campus in
the future. If the protest is handled in a responsible and caring manner, similar to controversy
with civility, the feedback from the society will be positive, or at least favorable. However, if the
protest is handled in an “us vs. them” mentality, the feedback will not be favorable and will
probably lead the organization to evaluate their common purpose and how they handled
controversy.
Society with individual. Arrow E represents how the individual and related values can
influence the development of responsible citizenship and communities. The values of the
individuals in a community influence its goals and commitment. If the individuals’ values of
Consciousness of Self, Commitment, and Congruence are positive and help develop a positive
community, the Citizenship value increases. However, if the individual values are not positive in
nature, i.e., the belief that government is corrupt, then the Citizenship value decreases.
Finally, Arrow F symbolizes how service to the community, or building responsible
citizenship, influences the individual. Through serving the campus community, a college student
will interact with others that will lead the student to analyze his/her individual values of
Consciousness of Self, Commitment, and Congruence. Imagine a college student who decided to
join student government in order to challenge the university’s policies. Although the student’s
individual values do not match those of the community, and may be seen as negative, the student
Page 50
29
is still involved in one of the largest organizations on campus and being a citizen. Through this
involvement, the student may begin to notice changes in his/her beliefs because of the differing
opinions in the organization. As a result of becoming involved in student government, the
student analyzed his/her individual values and adjusted them to new beliefs.
Research Using the Social Change Model
Although the Social Change Model of Leadership Development was introduced in 1996,
there was no instrument in place to measure college students’ development in the eight values of
the model. For her dissertation, Tyree (1998) developed an instrument to measure college
students’ development in the values called the Socially Responsible Leadership Scale (SRLS).
Further description about the scale is found in Chapter 3, Methodology. Since its inception, the
SRLS has been used for multiple theses and dissertations and is also the main component of the
Multi-Institutional Study on Leadership (MSL), developed in 2006 by Dugan and Komives
(2007). Even though there are a handful of studies focused on specific aspects of the SCM e.g.,
Citizenship and Change values (Durham Hynes, 2010; VanHecke, 2006), the majority of
research using the SCM as a framework collected data on all of the SCM values using the SRLS.
From a review of several dissertations and studies that used the SRLS, SRLS-R2 (the
second revision of the SRLS), or the MSL, I determined that college students who participated in
the studies consistently scored the highest on the Commitment value (Buschlen, 2010; Dugan,
2006b; Dugan & Komives, 2007; Gerhardt, 2008; Haber, 2006; Humphreys, 2007; McCurtis,
2012; Nobbe, 2012; Slife, 2007; Trujillo, 2009). The Commitment value focuses on the amount
of time and energy a college student puts forth towards the outcomes of the group (HERI, 1996).
This observation is not surprising since most, if not all, students are involved in student
organizations with outcomes that connect closely with their passions and therefore, want to help
Page 51
30
the organization succeed. Additionally, the instructions for the instruments asks the participants
to think of their involvement in registered student organizations so I argue that the participants
will rate themselves high on the statement related to the Commitment value.
The next two highest values, on average, are the Congruence and Common Purpose
values. The Congruence value is described as how well college students’ actions fit with their
values and beliefs while the Common Purpose value is defined as having a shared vision and
working towards that vision. What I find interesting is that college students score higher on the
Congruence value than on the Consciousness of Self value. This tells me that college students
are not aware of what they value and believe, yet their actions match their beliefs more often
than not. This seems to be in conflict; how can a college students’ actions match his/her beliefs
if he/she is not aware of his/her values and beliefs? Lee and King (2001) contend that this
disparity between stated values (what is verbalized) and active values (what is acted) is seen
more often than expected. Additionally, it may be difficult for a college student to realize what
values/beliefs are being seen by other students through his or her behaviors (Lee & King, 2001).
Further review of the research identified that participants consistently scored the lowest
on Controversy with Civility, Citizenship, and Change values with the Change value being the
lowest in the majority of the studies (Buschlen, 2010; Dugan, 2006b; Dugan & Komives, 2007;
Gerhardt, 2008; Haber, 2006; Humphreys, 2007; McCurtis, 2012; Nobbe, 2012; Slife, 2007;
Trujillo, 2009). Depending on the study, the lowest score rotated between these three. My
interpretation of this is that these three values are not emphasized as much as the other values in
student organizations. The Controversy with Civility value is one that needs practice and
dedicated time to develop. If the organization does not focus on how it connects to the large
campus community, I argue that the Citizenship value will not be high. Continual discussions on
Page 52
31
values that need to be developed are important to making improvements in values. For example,
in one study that used students in a leadership training course as the experimental group,
Citizenship was the third highest value (Buschlen, 2010), while the same value for the control
group (psychology classes) was the sixth highest (or third lowest) value. The assumption could
be made that the leadership class spent time talking about the connection to the greater campus
community in class and the participants understood the importance of Citizenship. This study is
the only anomaly regarding the Citizenship value and it was for the experimental group.
In a study somewhat similar to my current research, Gerhardt (2008) compared the MSL
scores of four groups of college students: involved in Greek organizations and at least one other
student organization, involved in three or more non-Greek organizations, involved in one to two
non-Greek organizations, and no involvement in student organizations. Gerhardt (2008) found
that the scores of students involved in Greek organizations and three or more non-Greek
organizations were not significantly different. When comparing scores between students
involved in three or more non-Greek organizations and one to two non-Greek organizations,
Gerhardt (2008) reported that college students involved in three or more non-Greek
organizations scored significantly higher on all of the values except for the Commitment and
Change values. The key differences between Gerhardt (2008) and my current study is that
Gerhardt (2008) looked strictly at involvement in organizations and not the intensity of that
involvement, specifically Greek social organizations. I took the intensity of involvement into
consideration as the main dependent variable and I did not use Greek organization involvement
as one of the groups.
The studies that use the SRLS, SRLS-R2, or MSL collected data from all students, no
matter their student organization involvement (Dugan, 2006b; Dugan & Komives, 2007; Haber,
Page 53
32
2006; Humphreys, 2007; Trujillo, 2009); from students participating in a leadership class
(Buschlen, 2010); from college students involved in specific organizations i.e., Greek
organizations (Gerhardt, 2008); or from students at specific institutions i.e., Gallaudet vs.
Hearing institutions (Slife, 2007). The current study will further the research regarding the
development of the eight values of the Social Change Model of Leadership Development by
looking at the intensity of involvement in student organizations and involvement in Residence
Hall Associations (RHAs) among students from across institutions located in a specific region of
the country. Later in the chapter, information will be shared about RHAs and the minimal
amount of research focused on the benefits of being involved in this type of organization.
Summary
Student organizations would not exist if not for the students. These students and the
organizations work to influence positive change in the higher education institution. This is one
of the main reasons the Social Change Model of Leadership Development was created and based
on the experiences of college students. Ultimately, colleges and universities want to see all
students, no matter the level of student organization involvement, become citizens of the
institutions. However, those involved in student organizations are more likely to develop a
connection to the university than those who are not involved in organizations, such as with
fellow students, staff members, and faculty members (Abrahamowicz, 1988). This supports the
connection between the group and society components of the model. The Social Change Model
of Leadership Development serves as a way to explain the development of leadership values in
college students.
Page 54
33
College Student Involvement and Student Organizations
This section includes literature related to Astin’s (1984) Theory of Student Involvement
and college student involvement in student organizations. There is a lot of research that looks at
the benefits of being involved in student organizations and how the benefits relate to
psychosocial, interpersonal, or leadership development. At the end of the section, the gap in
literature related to the intensity of involvement in student organizations will be highlighted.
Student Involvement Theory
Involvement. This term has many different meanings (Involvement, n.d.); however,
when connected to colleges and universities, there is a certain definition. Astin (1984) defined
involvement, specifically college student involvement, as “the amount of physical and
psychological energy that the student devotes to the academic experience” (p. 297). Using this
definition as a foundation, Astin (1984) proposed a theory that argues that students who are more
involved in their college experience are more likely to persist to graduation than those who are
not involved. This involvement occurs in several ways that compete for a finite amount of a
student’s time i.e., place of residence, academic involvement, student-faculty interactions,
athletic participation, or student organization involvement. Ultimately, the student determines
how much time is spent with each type of involvement.
Astin (1984) further explained that college student involvement can be measured
quantitatively (number of hours) or qualitatively (accumulation of energy/effort), and that
development and learning connected to an educational program (in-class or out-of-class) is
directly proportional to this quantity and quality of involvement in that program. In other words,
when a student spends more time and puts more effort into the same program, the learning and
development that comes from that involvement will increase as well. It is important to highlight,
Page 55
34
though, that Astin (1984) questioned if there might be a limit to the amount of the learning and
development that occurs when the level of involvement reaches a certain level.
Even though Astin (1984) described different types of involvement (e.g., place of
residence and student-faculty interactions), I argue that when the term is discussed in the higher
education context, involvement in student organizations is the main type of involvement
identified. The term “student organizations” encompasses a wide array of interests, ranging from
honor societies and sports groups to student governments, academic-related clubs, and social
Greek organizations. Out-of-class experiences such as participating in student organizations are
key to the psychosocial and leadership development of students (Abrahamowicz, 1988; Kuh,
1995; Moore, Lovell, McGann, & Wyrick, 1998).
Student Governments
The current study looked at involvement in campus-wide housing associations, e.g.,
RHAs. The RHA is considered the governing body for the students living in campus housing
(Komives & Tucker, 1993), which is different from the campus student government organization
(SGA) that represents all students at the institution. Both RHA and SGA organizations provide
services for the students they represent, manage budgets, and provide recommendations
regarding campus policies. Since RHAs have not been well studied, due to these similarities,
reviewing the literature on student government involvement and its relationship with leadership
development can provide some foundation for studying involvement in RHAs.
Since the early 1900s, student government organizations have been part of the college
campus (Golden & Schwartz, 1994). Originally, these organizations were seen as a way for
college administrators to keep order with the student body (Golden & Schwartz, 1994). The
student government was essentially an extension of the college administration with little
Page 56
35
decision-making responsibilities and not an independent entity that has power to make decisions
and influence campus policy. The 1960s and 1970s saw the control of student governments shift
from college administrators to students involved in the organizations as a result of the free
speech movement (Golden & Schwartz, 1994). The current structure of the majority of student
governments provides opportunity to influence campus policy and be an active part of the system
for the college students involved.
Even though student government organizations have been around for over 100 years,
research looking at the benefits of being involved in them is minimal, especially leadership skills
or value development (Downey, Bosco, & Silver, 1984; Kuh & Lund, 1994; Laosebikan-Buggs,
2009; Schuh & Laverty, 1983). The studies focus more on the benefits of involvement after
college (Downey et al., 1984; Schuh & Laverty, 1983), the experiences of student government
leaders (May, 2009; Miles, 2011), influence on career choice (Laosebikan-Buggs, 2009), and
general benefits of involvement in student governments (Kuh & Lund, 1994). Student
government organizations are known to be a great way to develop leadership skills and values
(Astin, 1993; Kuh & Lund, 1994; Pascarella & Terenzini, 2005; Romano, 1996); however,
studies looking at leadership development of any type as a result of that involvement have yet to
be identified.
Research on the Benefits of Student Organization Involvement
Throughout the past 30 years, research focused on the benefits of being involved in
student organizations looked at interpersonal skills, psychosocial skills, or leadership skills
development (Abrahamowicz, 1988; Cooper et al., 1994; Dugan & Komives, 2007; Fitch, 1991;
Foubert & Grainger, 2006). These studies used a variety of scales such as the College Student
Experiences Questionnaire (Pace, 1984) and the Student Development Task and Lifestyle
Page 57
36
Inventory (Winston, Miller, & Prince, 1987), which make comparing results from the studies
difficult even though each compared the development of students involved in student
organizations and students not involved in student organizations. The other main scale often
used to study involvement in student organizations is the Multi-Institutional Study for
Leadership (MSL), which includes the SRLS-R2 along with questions about self-efficacy
(Dugan & Komives, 2007).
The studies that used the Student Development Task and Lifestyle Inventory (Cooper et
al., 1994; Foubert & Grainger, 2006) each completed a three-year longitudinal examination,
either freshmen year and junior year or sophomore year and senior year, of undergraduates’
psychosocial development. Both compared college students’ development in relation to
Chickering’s (1969) Establishing and Clarifying Purpose vector between three main groups: not
involved in student organizations, involved in student organizations, and holding a leadership
position in an organization. The results of the post-tests of each study indicated that students
involved in student organizations, either as a leader or as a non-leader, scored statistically
significantly higher on all five measures the Establishing and Clarifying Purpose task (e.g.,
educational involvement, career planning, lifestyle planning, life management, and cultural
participation) than students who were not involved in student organizations (Cooper et al., 1994;
Foubert & Grainger, 2006).
Abrahamowicz (1988) used the College Student Experiences Questionnaire and found
that in terms of the quality of effort put forth in fourteen college experiences (i.e., clubs and
organizations, dormitory or fraternity or sorority), students who were members of a student
organization scored statistically significantly higher than students who were not involved. In
other words, students who were involved in organizations were involved in those fourteen
Page 58
37
experiences more often than students not involved in organizations. Furthermore,
Abrahamowicz (1988) reported that students who were members of student organizations
reported statistically significantly higher quality of relationships built with other students,
faculty, and administrative personnel than those who were not involved in student organizations.
In 2007, Dugan and Komives shared the results of the 2006 Multi-Institutional Study for
Leadership (MSL). The MSL instrument adapted the Socially Responsible Leadership Scale
(Tyree, 1998) and included questions regarding pre-college characteristics and leadership
efficacy. Dugan and Komives (2007) reported that students who were involved in student
organizations at any level scored statistically significantly higher on all of the SCM values than
students not involved in student organizations.
Although the above studies measured different outcomes, each reported that students
involved in student organizations scored statistically significantly higher than students not
involved in student organizations on their particular scale. Additionally, in each of these studies,
involvement in multiple student organizations was not studied. Dugan and Komives (2007)
mentioned that being involved in multiple organizations showed a negative relationship with the
SCM values. Their recommendation was to encourage students to become involved in one
student organization and continue that involvement throughout college (Dugan & Komives,
2007).
Research on Involvement in Multiple Student Organizations
Similar to research looking at the involvement in multiple student organizations at the
college level, there is also a large amount of research focused on adolescences and their
involvement in extracurricular activities and the outcomes of this involvement. In fact there is
concern from a variety of sources (i.e., media reports, books, research studies) that adolescences
Page 59
38
are involved in too many of these activities (Mahoney, Harris, & Eccles, 2006). These concerns
led to the development of the Over-Scheduling Hypothesis that is based on three assumptions:
(1) motivation for participating is extrinsic; (2) time commitment for activities hinders typical
family activities (e.g., dinnertime, family outings); and (3) participating is multiple activities
leads to developmental problems or negative relationships with parents (Mahoney et al., 2006).
A meta-analysis completed by Mahoney et al. (2006) concluded that for the majority of
adolescences, the motivation to participate in extracurricular activities is more intrinsic and the
involvement in multiple activities leads to positive development. However, there were a couple
studies documenting a certain level of involvement, which led to significantly lower levels of
well-being than adolescences who did not participate in activities or a curvilinear relationship
between the involvement and well-being outcomes (Cooper, Valentine, Nye, & Lindsay, 1999;
Marsh, 1992; Marsh & Kleitman, 2002). The similarities of the outcomes of adolescence and
college students being involved in extracurricular activities is not surprising since research in
both arenas support the notion that involvement in these activities does lead to positive
development in a variety of areas (e.g., academics, well-being). Furthermore, scholars raise the
question about if a limit to the benefit exists (Astin, 1984; Marsh, 1992; Marsh & Kleitman,
2002). Research on adolescence provides an opening in the research on college students and
their involvement in multiple organizations.
There are two studies that looked at involvement in multiple organizations. The earliest
study (Fitch, 1991) looked at the relationship between that involvement and the students’
development of interpersonal values using the Survey of Interpersonal Values (i.e., benevolence,
leadership, independence). Winston and Massaro’s (1987) Extracurricular Involvement
Inventory (EII) was used to determine the participants’ level of involvement. Moderately
Page 60
39
involved students were those who scored ±0.5 SD on the EII. Subsequently, lowly involved
students scored below -0.5 SD and highly involved students scored above 0.5 SD. Fitch (1991)
reported statistically significant differences on three of the interpersonal values: benevolence,
leadership and independence. Benevolence is described as serving others, Leadership is having
power over others, and Independence is not relying on others (Fitch, 1991). The moderately
involved participants scored significantly higher than the other two groups on the interpersonal
value of benevolence while lowly involved participants score significantly higher than the
moderately involved group on the interpersonal value of independence (Fitch, 1991). The highly
involved group scored significantly higher than the other two groups on the interpersonal value
of leadership (Fitch, 1991). It is important to realize that the definition of Leadership used by
Fitch (1991) is different from the definition used in this study. The SCM identifies leadership
more as a process that involves working with others for positive change in the greater society
(HERI, 1996), which is similar to the definition of benevolence.
The other study compared the MSL scores of college students involved in Greek
organizations and at least one other organization to students involved in (1) three or more non-
Greek organizations, (2) one to two non-Greek organizations, and (3) not involved in student
organizations and their development of the Social Change Model of Leadership Development
values (Gerhardt, 2008). The results of the study indicated students involved in three or more
non-Greek organizations scored statistically significantly higher than students not involved in
student organizations on all eight values of the SCM. Furthermore, when the students involved
in three or more non-Greek organizations were compared to those involved in 1-2 non-Greek
organizations, the student involved in three or more scores statistically significantly higher on all
of the values except Commitment and Change values (Gerhardt, 2008). Although this study
Page 61
40
provides evidence contrary to my current study, there are two key differences between the
studies. First, my study looked at students involved in RHAs and additional organizations;
Gerhardt (2008) used Greek organizations in one of the comparative groups. Second, and most
important, my study looked at the intensity of involvement, not simply being involved or not
involved in organizations. In other words, in my study a participant who is involved in two
organizations and holds leadership roles in both could have the same intensity of involvement as
a participant who is involved in three organizations but holds a leadership position in one of
those organizations.
Summary
The benefits of being involved in student organizations on a college campus are well
established since the early 1980s (Abrahamowicz, 1988; Astin, 1984, 1993; Pascarella &
Terenzini, 2005). In his seminal work on the Theory of Student Involvement, Astin (1984)
questioned one of his assumptions, stating that there may be a limit to the development of a
student when a certain level of involvement is reached. Two studies (Fitch, 1991; Gerhardt,
2008) essentially studied this query. Fitch (1991) looked at the intensity of involvement that
looks at the quality and quantity of a college student’s involvement in student organizations
while Gerhardt (2008) compared MSL scores of students involved in a certain number of
organizations. The current study combines the Fitch and Gerhardt studies by using the intensity
of involvement as the independent variable and the SCM values as the dependent variable. Fitch
(1991) mentioned that “moderation may be the key” to achieving balance (p. 28). My
assumption is that students with moderate intensity of involvement totals will have similar or
higher SCM value scores when compared to students with high intensity of involvement totals.
Page 62
41
Residence Hall Associations
This section discusses the different structures of campus housing student governments,
Residence Hall Associations (RHAs), the connection between leadership development and
RHAs, and research revolving around RHA involvement and leadership development. RHAs
serve as the governing body for students that live in campus-sponsored housing (Dunkel &
Schuh, 1998). Most, if not all, four-year higher education institutions that have campus housing
also have RHAs (Verry, 1993). Documentation on the origin of RHAs is like finding a needle in
a haystack; however, there is scholarly writing explaining the role RHAs play on a college
campus, as well as the importance of having an RHA (Miller & Papish, 1993; Werring, 1984).
There are three main purposes of RHAs that include working with the housing professional staff
in improving facilities, providing opportunities for students to get to know each other, and
serving as a leadership training ground (Komives & Tucker, 1993). The last purpose is crucial to
this study.
On most college campuses that sponsor campus housing there is more than one place
students can live, typically called a residence hall or apartments. Many campuses also identify
clusters of residence halls or apartments as a specific area. For example, on Michigan State
University’s campus there are five areas of campus with residence halls, or neighborhoods
(Residence Education and Housing Services, 2013). The benefits of living on-campus are well
documented (Astin, 1993; Pascarella & Terenzini, 2005). These benefits include being more
likely to persist and graduate from college, being satisfied with their college experience, holding
positive views regarding social change, and participating in extracurricular activities, such as
RHAs. On most campuses, each residence hall has its own government, which consists of the
typical leadership roles (e.g., president, vice president, secretary, and treasurer) and
Page 63
42
representatives from each floor. The purpose of a hall government is identical to that of an
RHA, but at the hall level. It is possible that a campus has an area government instead of hall
governments; this is typically seen on campuses that house fewer than one hundred students in
each residence hall. On the majority of campuses with campus housing, the separate hall
governments send one or two members to the RHA to represent that hall’s interest at the campus
level (Verry, 1993). The campus housing student government structure for a campus is initially
determined by the professional staff working with the group; however, eventually the students
involved in the organizations make the ultimate decision on the structure. This may include
changing titles and responsibilities of officers to disbanding an organization altogether. For the
current study, the government structure of RHAs and hall governments with representatives to
RHA are used as a reference point. Furthermore, when RHA is mentioned, the term also
includes hall governments because the two types of organizations are more similar than different
regarding structure and purpose.
No matter what type of government structure there is for students in on-campus housing,
in order for it to be successful, experts strongly encourage identifying a professional housing
staff member to serve as the main advisor for the organization (Komives & Tucker, 1993). As
mentioned above, one of the key purposes of RHAs is to serve as training grounds for leadership
development. One of the many responsibilities of the RHA advisor is to provide leadership
training opportunities for students involved in RHAs (Averill, 1993; Boersig, 1993). These
opportunities range from executive retreats at the beginning of each semester to leadership
conferences for hall government members (Komives & Tucker, 1993). There is much
information that can be shared during these events, however the main topics covered typically
include facilitating icebreakers (activities that encourage members to get to know each other) and
Page 64
43
team building activities (tasks that require the members to work together to accomplish specific
goals), reviewing positional responsibilities, goal setting, establishing expectations on how
everyone will work together, creating the budget, and planning for the year. These retreats
provide a foundation for the members of the RHAs; additional leadership development occurs
throughout the year when members need to make decisions, handle crises, manage controversy
with civility, or become overwhelmed with responsibilities. The RHA advisor is usually present
when any of these situations occur to provide suggestions and support so the members can make
the best choices for the organization.
Not only do RHAs provide college students the chance to hone their leadership,
communication, decision-making, and advocating skills but they do not limit who can become
involved. Although there may be additional requirements to serve in an executive role, the only
requirement to be a general member is to live on campus. Due to the minimal requirements, the
range of college students who are able to participate in RHA is vast. Similarly, RHA members
have the opportunity to develop their leadership skills and values, no matter the member’s level
of involvement. Since RHA members are also able to be involved in other student organizations,
I decided RHAs would work well in the study and can serve as a proxy for similar organizations
such as campus-wide student organizations.
National Association of College and University Residence Halls
Another avenue for developing leadership skills and values is through participation in
regional and national housing conferences (Hellwig-Olson & Tattershall, 1993). In 1954, RHAs
and housing professionals from Iowa State University, University of Colorado, University of
Missouri, and University of Northern Iowa established the Midwest Dormitory Conference in
hopes that ideas and information would be shared among professional staff and each university
Page 65
44
would grow from this exchange (Coleman & Dunkel, 2004; Dunkel & Schuh, 1998). In 1961,
the organization changed its name to the National Association of College and University
Residence Halls (NACURH) when a similar regional organization merged with the Midwest
Dormitory Conference (Coleman & Dunkel, 2004; Dunkel & Schuh, 1998). As of today, over
400 campuses in the United States, Canada, Mexico, Australia, and Qatar are members of
NACURH divided into eight regions (National Association of College and University Residence
Halls, n.d.,).
NACURH’s mission statement states its dedication and commitment to leadership
development of residence hall students and doing so through the many programs and services the
organization offers (NACURH, n.d.). One of those programs is sponsoring annual conferences
at the regional and national level. These conferences are typically 3 days and are for RHA
members to share ideas, network, and gain leadership skills through program sessions focused on
personal, professional, and organization growth. Not only do the students gain leadership skills
by attending these program sessions, but the majority of the session presenters are residence hall
students, either serving as executive board or general members. Although NACURH offers a
variety of leadership developments opportunities, the annual conferences have the opportunity to
reach a larger number of residence hall students.
Research on RHA Involvement and Leadership Development
RHAs are seen as a vehicle for developing student leaders (Averill, 1993; Dunkel &
Schuh, 1998; Komives & Tucker, 1993; Miller & Papish, 1993), although there are only a few
studies that provide evidence that students do develop leadership skills or values by being
involved in RHAs. The two studies that looked at leadership development and RHA
involvement took different approaches. One study interviewed alumni about their RHA
Page 66
45
involvement and asked them to reflect on their leadership development as a result of that
involvement (Rosch & Lawrie, 2011), while the other collected data on leadership skills from
students involved in RHAs at the time of the study (Romero-Aldaz, 2001).
In a recent study six college graduates who were involved in residence hall-related
organizations (i.e., RHA, hall government) were asked to share what they learned from this
involvement (Rosch & Lawrie, 2011). Although the study did not refer to the SCM and its
associated values, the skills and values highlighted in the study related well to the SCM. The
participants discussed how involvement in the organizations provided opportunity to improve
their ability to reflect and essential adjust beliefs and actions for the future (Rosch & Lawrie,
2011). This is an example of how students can improve their Consciousness of Self value
through feedback and reflection. Another result that was shared was how being involved in the
organization led to reinforcement of the students’ values and how the reinforcement led to their
leadership style being congruent to their values (Rosch & Lawrie, 2011). Even though the
Controversy with Civility value was not included directly studied, participants shared that
involvement led to improved problem solving, openness to ideas, and acknowledging ways
action can impact others (Rosch & Lawrie, 2011). Finally, the participants discussed the
importance of connecting to the broader community, i.e., the campus community (Rosch &
Lawrie, 2011). This qualitative study provided evidence that the SCM can serve as a model for
leadership development even when the model was not used in the study. Furthermore, the study
also highlights that involvement in RHAs provides sufficient opportunities to development the
values associated with the SCM.
Romero-Aldaz (2001) studied the skills achieved by students who served as leaders in
RHAs. Romero-Aldaz (2001) compared males with females and presidents of RHAs with
Page 67
46
students who represent the RHA at the regional level, e.g., National Communication
Coordinators. Using the Student Leadership Outcome Inventory (Crowder, 2000), Romero-
Aldaz compared the scores of seven different skills (e.g., critical thinking, career preparation,
organization and planning, time management, self-confidence, diversity awareness, and
technology) of the 266 participants. Females scored significantly higher than males on six of the
seven scales (the exception was technology skills) and the presidents scored significantly higher
than the National Communication Coordinators on the self-confidence skills (Romero-Aldaz,
2001). The results of the study suggest that females experience greater levels of development in
leadership skills than males in these two types of positions. The key difference between
Romero-Aldaz’s (2001) study and the current study is the focus of the dependent variable.
Romero-Aldaz (2001) looked at the skills developed as a result of the involvement in RHAs
while my study’s dependent variable consists of leadership values. Even though a couple of the
skills measured (e.g., critical thinking, self-confidence, and diversity awareness) could be
compared to the SCM values, the similarities are not enough to sufficiently compare the two
studies.
Summary
As a result of living in campus-sponsored housing, college students are automatically
members of the campus-wide housing organization, i.e., RHAs. There is only one other
organization on a college campus that can tout a similar characteristic: campus-wide student
government association. One of the main purposes of RHAs is to provide leadership
development opportunities for the members (Komives & Tucker, 1993). There are different
avenues through which this leadership development takes place, from local day-long conferences
to national 3-day leadership conferences. These experiences are supported by the university
Page 68
47
through the expectation that the organization advisors are housing professionals for whom being
the advisor is a responsibility. Even though RHA is seen as a way to develop student leaders,
few research studies focus on this involvement and its relationship with leadership development.
The studies that do look at leadership development provide a foundation for the current study.
Conclusion
After reviewing the literature focused on leadership development and involvement or
participation in student organizations, a gap can be identified when looking at involvement in
multiple organizations. The literature supports Astin’s (1984) theory of student involvement,
especially in regards to student organization involvement. However, there is minimal
information on the outcomes on leadership development and involvement in multiple
organizations. College administrators encourage students to become active in student
organizations, but very few establish limits to the level of that involvement or even differentiate
the benefits of the different forms of involvement. It can be argued that this is because college
students are considered adults and able to make their own decisions. However, college
administrators, specifically student affairs professionals, are seen as mentors and college students
rely on their insights regarding the college experience. This relationship is seen in the campus-
wide on-campus housing student organizations, RHAs. We need to know more about the
relationship between the intensity of involvement in multiple student organizations and
leadership development in order to assist college students in the navigation of the college
experience.
Page 69
48
Chapter 3: Methodology
This chapter reviews how I designed my study. I discuss my research design, sampling
framework, collection of data, analysis of the data, and the limitations of the study. The purpose
of this study is to identify the relationship between the intensity of involvement in student
organizations and college students’ leadership development. In other words, is there a point
when an increase in a student’s intensity of involvement no longer corresponds to an increase in
leadership values, as defined by the Social Change Model of Leadership Development? The
question driving this study is: how does the intensity of involvement in multiple student
organizations, one of which is the campus-wide on-campus housing student
government/organization (RHA), influence college students’ leadership development?
The research questions for this study are:
1. What is the relationship between college students’ intensity of involvement in
multiple student organizations and their leadership development as defined by the
Social Change Model of Leadership Development (Higher Education Research
Institute [HERI], 1996)?
2. Are there signs of diminishing returns regarding college students’ intensity of
involvement and their leadership development?
Research Design
The dependent variables for my study are the eight values of the Social Change Model
for Leadership Development (SCM, HERI, 1996). SCM was created in the mid-1990s as a result
of a grant from Dwight D. Eisenhower Leadership Development program (HERI, 1996). SCM
focuses on how an individual and the groups of which they are a part can assist in developing
positive change in the society. In the case of colleges and universities, the entire institution is
Page 70
49
considered the society. Change is seen as the overall value of the theory and the remaining seven
values work together to affect Change. The seven values are divided between the three main
components of the model: individual, group, society:
Individual: Consciousness of Self, Congruence, Commitment
Group: Collaboration, Common Purpose, Controversy with Civility
Society: Citizenship.
The main independent variable is the intensity of involvement in student organizations.
Intensity of Involvement was measured through the Extracurricular Involvement Inventory (EII,
Winston & Massaro, 1987). A detailed description of the EII is later in the chapter. Additional
independent variables included the following demographic information: year in college, class
level, major, GPA, age, gender, sexual orientation, ethnicity, international status, institutional
type, location of institution (i.e., what state or province), total enrollment at the institution, total
on-campus population, number of years in RHA-related organizations, type of RHA position
(e.g., hall government officer, general member, RHA officer), and the number of organizations
in which the participant is currently involved. Previous research provides support for variables
such as year in college, class level, gender, ethnicity, sexual orientation, and type of position
(Cooper et al., 1994; Dugan, 2006a; Dugan & Komives, 2007; Dugan et al., 2008; Foubert &
Grainger, 2006; Kezar & Moriarty, 2000). The remaining variables were collected either as a
requirement for using the Socially Responsible Leadership Scale, revision 2 (i.e., major, GPA,
and age) or as descriptors and used as a control variable (i.e., international status, institutional
type, location, enrollment, on-campus population, and years in RHA-relation organizations), if
needed.
Page 71
50
Sampling Framework
A sample is a representation of the larger population being studied (Remler & Van Ryzin,
2011). For the purpose of this study, the population being studied consists of college students
who participate in the campus-wide on campus student associations (RHAs) (Dunkel & Schuh,
1998). RHAs became prevalent on college campuses in the early twentieth century to serve as
the student government organization for students living on campus (Dunkel & Schuh, 1998).
One of the purposes of RHAs is to develop future societal leaders (Komives & Tucker, 1993).
Although RHAs have been part of the college campus since the early twentieth century and are
seen as a prominent student organization, few studies focus on college students’ involvement in
RHAs and possible influences of that involvement (Romero-Aldaz, 2001; Rosch & Lawrie,
2011). Furthermore, no RHA study used the SCM as its conceptual framework. This study fills
that gap in the literature.
The sample for this study consisted of college students from the states of Indiana, Illinois,
Michigan, Wisconsin, and the province, Ontario, Canada. These are the states and province that
are part of the Great Lakes Affiliate of College and University Residence Halls (GLACURH)
(National Association of College and University Residence Halls, n.d.). This type of sampling is
called convenience sampling since I am relying on a certain set of participants (Remler & Van
Ryzin, 2011). In the case of this study, the sample was from the participants of the annual
GLACURH regional conference, held every November at a member institution. On average, the
annual GLACURH regional conference brings 400-600 college students together for the 3-day
conference. (S. Cooke, personal communication, April 26, 2013). The 2013 GLACURH
Regional Conference had 571 undergraduate attendees (M. J. Koller, personal communication,
Page 72
51
June 18, 2014). All attendees were made aware of the opportunity to participate in the study
which led to 243 surveys being collected (42.6%).
Instrumentation
The instrument for this study combined two separate inventories that provide self-
reported data: Extracurricular Involvement Inventory (EII) (Winston & Massaro, 1987) and the
Socially Responsible Leadership Scale-Revised Version 2 (SRLS) (Tyree, 1998). As a doctoral
student at Michigan State University, I had access to an online survey program, Qualtrics, which
was used to administer the EII and SRLS electronically.
I received permission from Roger Winston (Appendix A) to use the EII and from the
National Clearinghouse for Leadership Programs (Appendix B) to use the SRLS-R2. This
permission also included shifting the administration of both from paper to an online data
software program, Qualtrics. The College of Education at Michigan State University purchased
a license allowing faculty and students access to use the program for collecting data. Two of the
key features of the program are the ability to display questions depending on certain answers and
the ability to direct participants from one survey to another while keeping the data separate and
anonymous. What this means is the data collected through the online administration of the EII
and SRLS-R2 was not connected to the form participants filled out if they wanted to be part of
the random drawing of incentives.
The survey consisted of demographic data, EII items, and SRLS-R2 items. The
demographics included: year in school, class level, age, gender, sexual orientation, ethnic
background, current GPA, institution type, population of institution and on campus living, length
of involvement in housing organizations, and number of organizations with which students are
currently involved. One of the stipulations for using the SRLS-R2 was collecting certain
Page 73
52
demographics: class level, age, gender, sexual orientation, ethnic background, and current GPA
in college. Since a student could be considered sophomore during their third year in college, I
asked for the number of years in college in addition to class level.
After inputting demographic information, participants were asked to complete an
Involvement Index for each student organization with which they were currently involved. Once
those are complete, the participants completed the SRLS-R2.
Extracurricular Involvement Inventory
Winston and Massaro (1987) believed that more information could be gathered regarding
college students’ involvement in student organizations than what the College Student
Experiences Questionnaire (CSEQ, Pace, 1984) collected in the Clubs and Organizations section
that included five statements on a student’s overall experience in student organizations, not each
organization separately. Winston and Massaro (1987) developed an instrument to measure
involvement in a student organization using Astin’s (1984) Student Involvement theory. Part of
the Student Involvement Theory states that the development of a student (i.e., psychosocial,
cognitive, skills) from an educational program, either in-class or out-of-class, is directly
proportional to the quantity and quality of the student’s involvement (Astin, 1984). Quantity is
defined as the number of hours devoted to the educational program and quality is defined as the
accumulation of effort used to assist the program in reaching its goals (Astin, 1984). In the case
of this study, student organizations were the educational program used.
Winston and Massaro (1987) defined the relationship between the quantity and quality of
a student’s involvement in a student organization as the “intensity of involvement”. Quantity
was measured as the total number of hours devoted to the specific organization during the most
recent four weeks (Winston & Massaro, 1987). Quality is more difficult to determine. Winston
Page 74
53
and Massaro (1987) measured the quality of a student’s involvement using the frequency of
attending meetings, being involved in discussion and decisions, attending sponsored events,
holding a position, promoting the organization on campus, and taking on responsibilities. A
student who attends meetings but does not make the effort to get to know others, take on
additional responsibilities, or share with others about their involvement would have a low level
of “intensity of involvement.” A high level of intensity would be seen when a student not only
attends meetings but is active in the decision making process, promotes the organization to those
not currently involved, and participates in sponsored events.
The EII is the sum of a student’s Involvement Index (INIX) intensity scores, one for each
organization (Winston & Massaro, 1987). The INIX consists of eight questions related to a
student’s involvement in that specific organization for the past four weeks (see Appendix C), two
of which are simply informational (e.g., type of organization and office held). The remaining six
questions relate to the quantity and quality of involvement. The quantity of involvement is
measured by the number of hours involved in an organization during the most recent four weeks,
while the quality of involvement is the sum of answers to five statements related to the student’s
involvement during the most recent four weeks: attend meetings, promote organization, attend
events, hold a position, and complete responsibilities (Winston & Massaro, 1987). Since the
information collected through the INIX is not quantifiable, Winston and Massaro (1987)
assigned scores for these six questions. For every eight hours spent with an organization, a
student scored 1 point (e.g., 1-8, 9-16, 17-24, etc.). For example, if a student recorded 10 hours
of involvement with an organization, the student’s score for quantity of involvement is 2. The
five questions that determine quality of involvement were assigned a 3 for “very often”, 2 for
Page 75
54
“often”, 1 for “occasionally”, and 0 for “never” and all other responses. The total quality of
involvement scores for a student is the sum of the five questions.
The overall INIX score for the student’s involvement in a specific organization is the
product of the quantity of involvement score and the quality of involvement score. For example,
a student who spent 10 hours with an organization (quantity score=2) and answered “often” for
all five questions (quality score=2*5=10) would have an INIX intensity score of 20 (2*10). The
EII overall score for a student is the sum of the student’s INIX intensity scores for all
organizations with which they are involved.
Winston and Massaro (1987) used two separate studies to establish reliability and validity
for the EII. Reliability describes how consistent a measure is (Remler & Van Ryzin, 2011).
Another way to describe reliability is how well the results from one study compare to the results
from another study using the same measures, or instrument. Winston and Massaro (1987) stated
that the Pearson product-moment correlations were established from having a subgroup complete
the EII again after two weeks. The reported correlation value was .97. Validity refers to how
well the measures actually measure the construct they are meant to measure (Remler & Van
Ryzin, 2011). Validity was measured by first correlating the EII results with the Clubs and
Organizations section results of the College Student Experiences Questionnaire (CSEQ) and then
by correlating the EII scores between contrasting groups (Winston & Massaro, 1987). The
correlations were .45 and .55, respectively. Correlations measure the linear relationship between
two variables or, in this case, the scores from two inventories (Ott & Longnecker, 2010).
Correlations range from +1.00 to -1.00, describing the strength of the correlation as well as the
direction (positive or negative) (Ott & Longnecker, 2010). The test-retest correlation of .97 is
considered a strong positive correlation since it is very close to +1.00; this indicates the results
Page 76
55
from the first and second administrations are closely related. The validity correlation scores are
not as strong as the reliability correlation since they are .45 and .55. These measures indicate a
positive relationship between the EII and the Clubs and Organization section of the CSEQ and a
positive relationship between the two contrasting groups that completed the EII. Although these
correlations are not as strong, Winston and Massaro (1987) stated that they were statistically
significant at the p < .001 level. In other words, the EII is reliable and valid.
Socially Responsible Leadership Scale-Revised Version 2
The original Socially Responsible Leadership Scale (Tyree, 1998) was created in order to
measure the eight values of the Social Change Model for Leadership Development:
Consciousness of Self, Congruence, Commitment, Collaboration, Common Purpose,
Controversy with Civility, Citizenship, and Change (HERI, 1996). The research team used the
Social Change Model for Leadership Development Guidebook, Version III (HERI, 1996) as a
guide for developing the items for the scale. The final scale was pared down to 104 items from
the 291 that were initial developed (Tyree, 1998). The remaining 104 items not only connected
to one of the eight values of the model but also fall into one of three types of actions described in
the SCM: knowing, being, and doing (HERI, 1996, Tyree, 1998). Each item was written as a
statement so the participants would rate their agreement level: strongly agree, agree, neither
agree nor disagree, disagree, and strongly disagree (Tyree, 1998). Additionally, there are a
number of statements that are negatively worded in order to check response reliability.
The scale used for the Socially Responsible Scale scored the agreement levels as such: 1
for strongly disagree, 2 for disagree, 3 for neither agree nor disagree, 4 for agree, and 5 for
strongly agree. The scale was reversed for the negatively worded statements in order to score
Page 77
56
those items accurately. The scores for each value is the mean score of the 12-14 statements
connected to that value (Tyree, 1998).
In 2006, the original Socially Responsible Leadership Scale was revised and the 104-item
scale was pared down further to a 68-item scale, while maintaining reliability and validity
(National Clearinghous for Leadership Programs, n.d.). The revised version is called Socially
Responsible Leadership Scale, Revised Version 2 (SRLS-R2) (See Appendix D). The original
SRLS and the SRLS-R2 reported the following reliability, using Cronbach’s alpha:
Table 2 Reliability of the original SRLS and SRLS-R2
Construct Original SRLS
Cronbach’s alpha
(Tyree, 1998)
SRLS-R2 Cronbach’s alpha
(NCLP, n.d.)
Consciousness of Self .82 .78
Congruence .82 .79
Commitment .85 .83
Collaboration .77 .80
Common Purpose .82 .81
Controversy with Civility .69 .72
Citizenship .92 .90
Change .78 .82
Source: National Clearinghouse for Leadership Programs (n.d.). Socially responsible
leadership scale revised version 2: Using the SRLS-R2 for research and assessment, p. 10.
College Park, MD, University of Maryland College Park.
These correlations indicate strong positive relationships between the statements for each value.
For example, the value, Consciousness of Self is measured by a student’s answers to nine
statements (i.e., I am able to articulate my priorities, I can describe how I am similar to other
people) (NCLP, n.d.). The .78 for Conscious of Self value for the SRLS-R2 signifies that the
Consciousness of Self value statements have a strong internal reliability.
In order to determine the validity of the statements and their relation to the assigned
construct, Tyree (1998) ran correlations between each statement and the sum of the scores for the
assigned construct. The correlations for all of the original statements were statistically
Page 78
57
significantly except for one which was part of the collaboration construct. The range of the r
scores for those that were statistically significant was .2718 to .7701 while the r-scores for one
statement not significant was .0100. The SRLS-R2 was revised in a way to retain the validity of
the instrument (NCLP, n.d.). For the complete list of correlations, see Appendix E.
Data Collection
Data were collected during the regional GLACURH conference, held from November 22-
24, 2013 at Michigan State University. Conference attendees were from a range of institutions
with campus housing from Indiana, Illinois, Michigan, Wisconsin, and Ontario, Canada.
Information about the research project was shared in the conference booklet and at the
conference through posted signs and verbal announcements at the opening session and other
sessions. At the end of the survey, participants had the opportunity to enter into a drawing for
gift certificates as an incentive for completing the survey. If a participant indicated interest in
the gift certificate drawing, the participant was directed to a completely new survey to collect
their contact information for the drawing. This information was not connected to the data
collected from the EII and SRLS-R2.
Computer stations were set up in a central location during the conference Friday evening
during social time, Saturday morning and afternoon, and after the closing banquet on Saturday
evening. Conference attendees were given a link to the survey if they wanted to still participate
after the conference. Since the conference was the weekend before Thanksgiving, the survey
remained open for two weeks after the conference. I also asked the conference advisor to send
an email on my behalf to the RHA advisors in the GLACURH region to share with their students
after the conference. The email provided the survey link to attendees who may not have had the
opportunity to complete the survey during the conference.
Page 79
58
Data Analysis
The data were analyzed through SPSS version 21. Initially, the data were analyzed
through bivariate comparisons, t-tests, and analysis of variances (ANOVA) (Ott & Longnecker,
2010; Pallant, 2013). Correlations between the overall SCM value score and each of the
independent variables, e.g., EII scores, gender, ethnic background, year in college, were run to
determine the type of relationships between them. For the independent variables that had two
groups (i.e., gender), t-tests were completed to determine statistical differences in the dependent
variable scores (Pallant, 2013). ANOVAs were run to determine statistical significance between
the independent variable with more than two groups and the dependent variable, the overall
SRLS score.
Once the correlations were determined, using the literature as support, I completed a
multiple regression (Remler & Van Ryzin, 2011) with the overall SRLS score as the dependent
variable and the EII score as the main independent variable to answer the first research question
that asked about the relationship between the EII score and the overall SRLS score. The multiple
regression was controlled for the institution’s enrollment, participant’s number of years in RHA,
gender, sexual orientation, ethnicity, class level, GPA, and type of RHA position. I also ran the
multiple regressions with each of the single values (i.e., Consciousness of Self, Collaboration,
Citizenship) and components (e.g., individual, group, society) as the dependent variable. In a
similar dissertation, Gerhardt (2008) analyzed the SRLS scores of college students determined
by the number of organizations in which they were involved. Therefore, an additional multiple
regression was completed using the number of involvement indexes as the main independent
variable instead of the EII score to determine which independent variable, or both, were
statistically correlated with the overall SRLS score. This study looked at college students
Page 80
59
involved in multiple student organizations. In order to determine the answer to the research
questions focused on students involved in multiple student organizations, I split the data into two
sets: students involved in one organization and students involved in multiple organizations (two
or more). I then re-ran the multiple regressions for each set with the EII score as the main
independent variable and the overall SRLS score, each single value, and each component as the
dependent variable.
My second research question asked if there are signs of diminishing returns regarding the
relationship between the EII score and the overall SRLS score. Another way of explaining this is
determining a tipping point at which the development of the leadership values is minimal, static,
or reduced. Perce and Aguinis (2013) also used the term, “Too-Much-of-a-Good Thing” Effect,
in the field of management to describe this concept. All of these descriptions (diminishing
returns, tipping point, Too-Much-of-a-Good-Thing) are connected to curvilinear relationships
between two variables. In order to answer my second question, I needed to perform a multiple
regression that included a variable that was the square of the EII score (Aiken & West, 1991).
For example, if a participant had an EII score of 10, then new variable, EIISQ, would be 100.
Once the regression was ran, I used the coefficients (b) of the EII score (b1) and EII square (b2)
variables in the following formula to determine the point (X) in which an increase in the EII
score no longer indicated an increase in the overall SRLS score: X = -b1 / 2 * b2. I also ran
similar regressions when the data were split between students involved in one organization and
involved in multiple organizations.
Page 81
60
Limitations
As with any type of research, there were limitations to consider. First and foremost, the
data collected were self-reported by the college students. Although the hope is that students
accurately reported their experiences, it cannot be guaranteed (Remler & Van Ryzin, 2011).
Humans have a tendency to report experiences in a way that shows them in a better light (Remler
& Van Ryzin, 2011). Even though it can be argued that college students are eager and willing to
share their experiences and may do so more accurately, the limitations of self-reporting need to
be kept in mind when analyzing data.
Another limitation was that the data were collected at one specific conference. The
attendees of this conference were from four different states and one Canadian province. This
leads to the limitation that the data collected may not be generalizable to the larger population of
the United States or Canada; however, there still may be lessons others can learn from the
results. Furthermore, the data are relatable to only those who attended the conference. Students
who did not attend the conference were not able to complete the survey.
Using the campus-wide housing student organization (RHAs) as the common
denominator for the study is another limitation of the study. Although students organizations
typically have similar processes and positions (e.g., general meetings, activities, president, vice
president), how each organization uses these processes vary. With that said, the RHAs from
across the GLACURH tend to have similar processes and positions since the RHAs are members
of GLACURH and NACURH. Therefore, the data collected may not be able to be generalized to
students who are only involved in non-campus housing student organizations.
The data may be skewed regarding the intensity of involvement because the EII asks
participants to consider the most recent four weeks when completing the Involvement Index
Page 82
61
inventories. Typically, there is preparation time for the GLACURH conference during these four
weeks, especially the two weeks before the conference. Therefore the Involvement Index score
may be higher than normal due to the conference preparation. This may also lead to lower
Involvement Index scores for other organizations.
An additional limitation is the online dissemination of the instrument. As mentioned
earlier, the total EII score is the sum of the Involvement Indexes completed by a participant; one
index per organization. I stated in the survey instructions at the beginning of each new
Involvement Index to complete the next index of organization #2, #3, etc. What I found when
the students were completing the Involvement Index section of the instrument, some did not read
the top of the new screen and thought the instrument was repeating itself. This led to participants
possibly completing fewer Involvement Indexes than the number of organizations in which they
were currently involved.
Conclusion
The research questions for this study were: (1) what is the relationship between college
students’ intensity of involvement in multiple student organizations and their leadership
development as defined by the Social Change Model of Leadership Development (HERI, 1996);
(2) are there signs of diminishing returns regarding college students’ level of involvement and
their leadership development? Data were collected through convenience sampling at a regional
conference of the National Association of College and University Residence Halls held at
Michigan State University in November 2013. The main independent variable was the college
students’ Intensity of Involvement scores, which are created by completing the Extracurricular
Involvement Inventory (Winston & Massaro, 1987). The dependent variables were the college
students’ scores from the Socially Responsible Leadership Scale, revision 2 (NCLP, n.d.), based
Page 83
62
on the Social Change Model of Leadership Development (HERI, 1996). Data were analyzed at
the individual value level, component level (individual, group, society), and overall SCM value
level. In the next chapter, the results from the survey and analysis of the data are discussed.
Page 84
63
Chapter 4: Findings
In this chapter I share information gathered from data collection, including reasons for
eliminating participants, participants’ demographics, and how the data were used to answer the
study’s two research questions. The purpose of this study was to identify the relationship
between the intensity of involvement in student organizations and college students’ leadership
development. In other words, is there a point when an increase in a student’s intensity of
involvement no longer corresponds to an increase in leadership values, as defined by the Social
Change Model of Leadership Development? The question driving this study was: how does the
intensity of involvement in multiple student organizations, one of which is the campus-wide on-
campus housing student government/organization (RHA), influence college students’ leadership
development?
The research questions for this study are:
1. What is the relationship between college students’ intensity of involvement in
multiple student organizations and their leadership development as defined by the
Social Change Model of Leadership Development (Higher Education Research
Institute [HERI], 1996)?
2. Are there signs of diminishing returns regarding college students’ intensity of
involvement and their leadership development?
Participants
Participants in the study were college students attending the annual regional Great Lakes
Affiliate of College and University Residence Halls (GLACURH) conference held at Michigan
State University in November 2013. The conference attendees were enrolled at colleges and
universities located in Illinois, Indiana, Michigan, Wisconsin, and Ontario, Canada. There were
Page 85
64
571 undergraduate attendees at the conference, all made aware of the opportunity to participate
in the study, and 243 surveys were collected (42.6%) (M. J. Koller, personal communication,
June 18, 2014). One of the requirements of IRB approval was allowing participants the option to
refuse to answer questions. Therefore, incomplete surveys were possible. While reviewing the
data, 39 surveys were deemed incomplete and were removed from the analysis. The reasons for
removing the surveys were the following: two participants did not accept the consent form;
seven did not complete any part of the survey; nine only completed the demographic portion of
the survey; five did not provide information pertinent to the main independent variable, the
Extracurricular Involvement Inventory (EII) score; and sixteen did not complete enough of the
dependent variable portion of the survey to provide an accurate score.
The remaining 204 surveys were completed by 132 females (64.7%), 71 males (34.8%),
and one participant who indicated being both male and female (0.5%). Participants had the
option to choose “rather not say” with regards to the sexual orientation with which they identify.
Eight participants chose “rather not say” and two simply did not provide an answer. The
remaining 194 participants’ sexual orientation breakdown was: 158 (81.4%) heterosexual, 22
(11.3%) gay/lesbian, and 14 (7.2%) bisexual. The ethnicity of the participants was as follows:
166 (82.6%) White/Caucasian, 16 (8%) African American/Black, 1 (0.5%) Latino/Latina, 1
(0.5%) Pacific Islander/Native Hawaiian, and 17 (8.5%) Multi-racial. Two participants stated
that their race was not included in the choice set on the survey and one participant did not answer
the question. With regards to how many years the participants have been in college, the
breakdown was as follows: 61 (29.9%) first year; 65 (31.9%) second year; 41 (20.1%) third
year; 28 (13.7%) fourth year; 7 (3.4%) fifth year; and 2 (1%) sixth year or more.
Page 86
65
Table 3 Demographics of Participants (n=204)
Gender Male Female Male/Female
71 (34.8%) 132 (64.7%) 1 (0.5%)
Sexual
Orientation
Heterosexual Gay/Lesbian Bisexual Rather
Not Say
No
Answer
158
(81.4%)
22
(11.3%)
14
(7.2%) 8 2
Ethnicity
White/
Caucasian
African/
African
American
Latino/
Latina
Pacific
Islander/
Native
Hawaiian
Multi-
racial
Race Not
Included
No
Answer
166
(82.6%)
1
(0.5%)
1
(0.5%)
1
(0.5%)
17
(8.5%) 2 1
Years in
College
First Second Third Fourth Fifth Sixth +
61
(29.9%)
65
(31.9%)
41
(20.1%)
28
(13.7%)
7
(3.4%)
2
(1%)
The data were collected at a conference specifically for college students involved in on-
campus housing organizations (RHA). This involvement could have been at the residence
hall/area organization level (hall government) or at the campus-wide organization level such as a
Residence Hall Association. For this study both types of organizations were described as on-
campus housing organizations (RHA). The following demographic data related directly to that
involvement. One participant did not indicate the number of years of involvement in on-campus
housing organizations. Of the remaining 203 participants, 96 (47.3%) were in their first year
while 61 (30%) had two years of experience, 31 (15.3%) had three years, 12 (5.9%) had four
years, and 3 (1.5%) had five years of experience in on-campus housing organizations.
Participants chose one of thirteen options regarding the type of involvement that also included
the type of position held, if the participant held one (i.e., no position, hall government president,
RHA treasurer), in these organizations. Table 4 includes a list of 13 options from which
participants had to choose. Due to the large number of options for type of involvement, I
collapsed the groups from thirteen to five: general member (n=43, 21.2%), hall government
Page 87
66
member (n=64, 31.5%), RHA member (n=48, 23.6%), hall government representative to RHA
(n=38, 18.7%), and RHA representative to the region (National Communications Coordinator)
(n=10, 4.9%). One participant did not indicate a type of involvement.
Table 4 Position Held in Hall Government or RHA, possible responses
No position-general member RHA president
Area/Hall Representative to RHA RHA Vice President
Hall Government President RHA Secretary
Hall Government Vice President RHA Treasurer
Hall Government Secretary NCC (National Communications Coordinator)
Hall Government Treasurer RHA other, please specify
Hall Government other, please specify
Additional demographics collected included class level, majors, grade point average,
state or province in which the institution is located, type of institution (e.g., 2-year, 4-year,
public, private), the enrollment numbers of the institution, the number of beds available in
campus housing, and the number of organizations involved. The majority of the participants
were either freshmen or sophomores (n=123, 60.3%) and were involved in two or three student
organizations (107, 52.4%). Furthermore, roughly three-quarters of the participants were
between the ages of 18-20 (n=156, 76.5%) and had a cumulative GPA of a 3.00 or above (159,
77.9%). With the exception of Ontario, Canada, the participants were, more or less, evenly
distributed among the four states: Indiana, Illinois, Michigan, and Wisconsin. The enrollment of
the participants’ institutions fell mostly in the 3,000-9,999, 10,000-19,999, and more than 19,999
ranges (181, 88.4%). Additionally, the majority of beds available in campus housing ranged
from 1,000 to 9,999 (156, 76.5%). Tables 5-11 provide the breakdown for each of these
demographics.
Page 88
67
Table 5 Class Level of Participants
Frequency Percent
First year/Freshman 60 29.4
Sophomore 63 30.9
Junior 45 22.1
Senior 27 13.2
Graduate 1 0.5
Missing Data 8 3.9
204 100.0
Table 6 Age of Participants
Frequency Percent
17 1 0.5
18 43 21.1
19 63 30.9
20 50 24.5
21 31 15.2
22 8 3.9
23 4 2.0
24 1 0.5
25 2 1.0
28 1 0.5
204 100.0
Table 7 Grade Point Average (GPA) of Participants
Frequency Percent
3.50-4.00 81 39.7
3.00-3.49 78 38.2
2.50-2.99 32 15.7
2.00-2.49 6 2.9
< 1.99 2 1.0
Missing Data 5 2.5
204 100.0
Table 8 Location of Institution
Frequency Percent
Indiana 31 15.2
Illinois 51 25.0
Michigan 51 25.0
Ontario, Canada 15 7.4
Wisconsin 55 27.0
Other 1 0.5
204 100.0
Page 89
68
Table 9 Enrollment of Institution
Frequency Percent
1,000-2,999 18 8.8
3,000-9,999 55 27.0
10,000-19,999 58 28.4
> 19,999 68 33.3
Missing Data 5 2.5
204 100.0
Table 10 Number of Beds in Campus Housing
Frequency Percent
< 1,000 11 5.4
1,000-2,999 53 26.0
3,000-4,999 56 27.5
5,000-9,999 47 23.0
> 9,999 33 16.2
Missing Data 4 2.0
204 100.0
Table 11 Number of Organizations Involved In versus Number of Involvement Indexes
Completed
Organizations Involved Indexes Completed Difference
Frequency Percent Frequency Percent
One 36 17.6 41 20.1 +5
Two 50 24.5 53 26.0 +3
Three 57 27.9 52 25.5 -5
Four 40 19.5 37 18.1 -3
Five 10 4.9 13 6.4 +3
Six 11 5.4 8 3.9 -3
204 100.0 204 100.0
The Majors variable was initially split into 22 categories, with “other” being number 23,
as identified by the College Student Experience Questionnaire (Pace, 1984). This questionnaire
is one of the most widely used surveys to determine how college students’ quality of effort and
perceptions correlate with their personal growth regarding to a holistic set of learning outcomes.
To simplify data analysis, I used Anthony Biglan’s classification of disciplines (1973), which is a
three-dimensional classification of common postsecondary education majors. The three
Page 90
69
dimensions are Hard/Soft, Pure/Applied, and Life/Non-Life that lead to dividing the common
postsecondary majors into eight groups (See table 12).
Table 12 Common Postsecondary Majors Divided by Biglan’s Classification
Hard Soft
Life Non-Life Life Non-Life
Pure Biology,
Biochemistry,
Genetics, Physiology,
etc.
Mathematics,
Physics, Chemistry,
Geology,
Astronomy,
Oceanography, etc.
Psychology,
Sociology,
Anthropology,
Political
Science, Area
Study, etc.
Linguistics,
Literature,
Communications,
Creative Writing,
Economics,
Philosophy,
Archaeology,
History,
Geography, etc.
Applied Agriculture,
Psychiatry, Medicine,
Pharmacy, Dentistry,
Horticulture, etc.,
Civil Engineering,
Telecommunication
Engineering,
Mechanical
Engineering,
Chemical
Engineering,
Electrical
Engineering,
Computer Science,
etc.
Recreation,
Arts, Education,
Nursing,
Conservation,
Counseling, HR
Management,
etc.
Finance,
Accounting,
Banking,
Marketing,
Journalism,
Library And
Archival
Science, Law,
Architecture,
Interior Design,
Crafts, Arts,
Dance, Music,
etc.
Source. Goel, S. (2010, July 27). Well rounded curriculum – An insight from Biglan’s
classification of disciplines. Engineering and Computing Education: Reflections and Ideation.
Retrieved from http://goelsan.wordpress.com/2010/07/27/biglans-classification-of-disciplines/
For my study I decided to not include the Life/Non-Life dimension because the original 22
categories limited the ability to place majors in to this dimension. For example, one major
option in my study’s survey was Business with suggestions of management, marketing, and
accounting. In Biglan’s classification, management is considered a Life dimension while the
other two are Non-Life. However, when a participant marked Business on the survey, it was
impossible to determine the Life/Non-Life dimension. Therefore, the participants’ majors were
Page 91
70
collapsed into one of four groups based on the remaining two dimensions (Hard/Soft and
Pure/Applied) of Biglan’s classifications: Hard-Pure, Hard-Applied, Soft-Pure, and Soft-
Applied (see table 13).
Table 13 Majors using Biglan’s Hard/Soft and Pure/Applied
Frequency Percent
Hard & Pure 19 9.3
Hard & Applied 34 16.7
Soft & Pure 44 21.6
Soft and Applied 97 47.5
Missing 10 4.9
204 100.0
In order to determine if the study’s sample was representative of the study’s population
(undergraduate conference attendees), I compared the sample’s demographics to the
demographics of the study’s population and undergraduate students attending Michigan State
University (MSU). MSU’s undergraduate population was used because MSU has a large
undergraduate population, which is likely to represent the demographics of the study’s
population. Since the only demographic I was able to compare between the study’s sample and
population was gender, I decided to use MSU’s undergraduate population when comparing the
study sample’s Gender, Ethnicity, GPA, Age, and Class Level. Table 14 provides the
comparisons with the survey data being adjusted to the categories provided by MSU data results.
When the gender breakdown of the study’s sample was compared with the breakdown of the
study’s population, the percentages were almost identical: Conference attendees: male-37.3%,
female-62.7%; Survey Participants: male-34.8%, female-64.7% (M. J. Koller, personal
communication, June 18, 2014). The comparisons of the study’s sample demographics with the
study’s population and with MSU’s undergraduate population, although not exact, provide
support that the study’s sample is representative of the study’s population.
Page 92
71
Table 14 Survey Demographics vs. MSU Demographics
Survey Participants Michigan State University
Gender* Male Female Male Female
34.8% 64.7% 50% 50%
Ethnicity* White/Caucasian Non-White/
Caucasian
White/Caucasian Non-White/
Caucasian
83% 10% 69% 31%
GPA** 2.50 – 4.00 2.49 and below 2.50 – 4.00 2.49 and below
93.6% 3.9% 99.5% 0.4%
Class
Level***
Freshmen/
Sophomore
Junior/Senior Freshmen/
Sophomore
Junior/Senior
60.3% 35.3% 42.5% 57.5%
Age* Average Age 24 or Older Average Age 24 or Older
20 2% 20 4%
*. CollegePortrait.com (College Portrait, 2013)
**. MSU’s Common Data Set, 2013-2014 (Michigan State University, 2013)
***. MSU’s Headcount by Academic Level and Student Category (Michigan State University,
Spring 2010)
Independent Variables
Overall, data pertaining to 17 independent variables were collected in order to determine
the participant’s intensity of involvement. The majority of the independent variables were
demographic data, including items required by the National Clearinghouse for Leadership
Programs to use the SRLS-R2 in this study (see Appendix F). The participant first indicated the
number of student organizations in which he/she was currently involved. This number led to the
same number of Involvement Indexes (INIX) being generated by the survey for the participant to
complete, one for each student organization (Winston & Massaro, 1987). Each INIX included
questions about the type of organization, position held in that organization, if any, the total
number of hours during the most recent four-week period spent regarding the organization, and
five statements which measured the quality of the participant’s (See Appendix C). The total of
an INIX is the number of hours multiplied by the sum of the students’ answers to five statements
related to the quality of that involvement. In order to score an INIX, the number of hours a
participant entered was assigned 1 point for every eight hours spent on the organization and the
Page 93
72
answers to the quality of involvement statements ranged from 0-3, 0 for “never” and 3 for “very
often”. The minimum INIX score was 0 and the maximum was 150 (10 for the number of hours
multiplied by 15, a score of 3 for each of the five statements).
The main independent variable, the Extracurricular Involvement Inventory (EII) score,
was created by summing the totals of the Involvement Indexes each participant completed. The
minimum EII score was 0 and if six INIXs were completed, the maximum score was 900 (150 x
6). While analyzing the data, I found that many participants did not complete all of the indexes
they were expected to fill out. For example, one participant who indicated being involved in four
organizations only completed one INIX. Therefore, I created a new independent variable, Total
Indexes, to provide an accurate count of indexes completed. See table 11 to compare the
Number of organizations and the Total INIXs completed.
The remaining independent variables were identified as either ordinal or nominal. The
ordinal variables were Year in College, Class Level, Age, Institution Enrollment, On Campus
Population, and Years in RHA. Major, Gender, Sexual Orientation, Ethnicity, Institution Type,
Location of Institution, and Position in RHA were nominal variables. The location of the
institution was included strictly as a demographic variable for possible future analysis between
locations, therefore it was excluded from further analyses in this document. In addition, the
initial review of the data indicated that all participants attended four-year institutions. Since all
participants indicated attending a 4-year institution, this variable was also excluded from further
analyses.
When working with regressions and correlations, using nominal variables with more than
two groups is difficult since the numeric values are simply place holders (Field, 2012). When a
nominal variable includes only two groups, one is coded 0 and the other is coded 1 (See Table
Page 94
73
15). However, this is not possible with more than two groups. In order to accurately represent
variables with more than two groups, dummy variables are created. Dummy variables are used
to represent groups of participants in zeroes and ones (Field, 2012). A dummy variable is
created for each group of the variable in which one group is coded 1 and the remaining groups
are coded 0. Then these new variables are included in the regression. In the current study, the
Majors variable was divided into four dummy variables, each representing one of the four
groups: Hard-Pure, Hard-Applied, Soft-Pure, and Soft-Applied.
Additionally, I decided to collapse the Sexual Orientation and Ethnicity variables into
two groups primarily due to the number of participants indicated as a non-majority (i.e.,
gay/lesbian or African American/African). This also minimized the number of variables
included in the regression. For example, Ethnicity now included two groups instead of five
dummy variables, each representing one of the Ethnicity groups. The Ethnicity variable was
narrowed to White/Caucasian and Non-White/Caucasian, and the Sexual Orientation variable
was adjusted to Heterosexual and Non-Heterosexual. The final variable I chose to collapse
further was Position in RHA. When I reviewed the five new groups I identified two positions
serving a dual role: RHA Representative and Communications Coordinator. In both of these
positions, the individual was part of two organizations. In the case of the RHA Representative,
this individual was a member of RHA and of the hall/area government he/she represents. In a
similar way, the Communications Coordinator served as the institution’s representative to the
regional association and was a member of the institution’s RHA. The remaining three positions
(general member, hall government, and RHA) were considered single role positions. Therefore,
I created the RHA position variable to indicate membership to one of two groups: Dual Position
and Single Position. Table 15 shows how the nominal variables with two groups were coded.
Page 95
74
Table 15 Codes for Gender, Sexual Orientation, Ethnicity, and RHA Positions
Coded as 0 Coded as 1
Gender Female Male
Sexual Orientation Non-Heterosexual Heterosexual
Ethnicity Non-White/ Caucasian White/Caucasian
RHA Position Single Dual
In order to rule out extraneous variables, I ran correlations between the independent
variables to determine which ones were statistically significantly correlated to each other. Table
16 provides the results of the correlations. Due to the statistically significant positive
correlations between the EII, number of organizations, and number of INIX variables, I decided
to use the EII as the proxy for the other two variables. In a similar fashion, the correlations
between the number of years in college, class level, age, and number of years in RHA variables
were also positively and significantly correlated. The class level variable correlated the highest
with the years in college, age, and number of years in RHA variable. There is also research on
the relationship between class level and extracurricular involvement (Cooper et al., 1994;
Foubert & Grainger, 2006). Therefore, I decided to use Class Level as a proxy for years in
college and age variables. I kept number of years in RHA (RHAyear) as a separate variable
because it represents the commonality of the participants. Lastly, the correlation between the
institution’s enrollment and on-campus population variables was statistically significant and
positive. Therefore, I decided to use the overall institution population as a proxy for the on-
campus population variable since the institution population is more likely to be commonly
known.
As a review, not all of the independent variables were included in running the linear
regressions that answered the research questions. Several were chosen to serve as proxies for
other variables to minimize the number of predictors used that leads to the degrees of freedom
Page 96
75
for which to account. Therefore, the following variables were used: EII, institutional
enrollment, type of RHA position (single/dual), GPA, gender, sexual orientation, ethnicity, class
level, and number of years in RHA organizations. Literature supports the inclusion of most of
these variables: type of RHA position (Cooper et al., 1994; Foubert & Grainer, 2006), gender
(Case, 2011; Dugan, 2006a; Dugan & Komives, 2007; Kezar & Moriarty, 2000), sexual
orientation (Dugan et al., 2008), ethnicity (Dugan & Komives, 2007; Kezar & Moriarty, 2000;
Trujillo, 2009), and class level (Cooper et al., 1994; Foubert & Grainger, 2006). The remaining
variables used, institutional enrollment and GPA, have a statistically significant correlation (-
.156) with each other, one of which (GPA) also has a statistically significant correlation with the
EII (-.190). Therefore, I decided to include institutional enrollment and GPA in the multiple
regression.
Table 16 Pearson r Correlations of Independent Variables
EII INIXs # of
Orgs
Year in
College
Class
Level GPA Age
Institution
enrollment
Beds on
Campus
Indexes .394**
Orgs .382** .958**
Years .136 -.008 -.008
Class .191** .061 .084 .803**
GPA -.190** .000 .022 -.074 -.071
Age .149* .038 .029 .728** .752** .103
Inst.
Enroll. .136 -.076 -.097 .009 .033 -.156* .017
Beds -.045 -.034 -.065 -.108 -.076 -.014 -.106 .579**
Years in
RHA .230** .061 .057 .702** .751** -.073 .626** .029 -.119
**. Correlation is significant at the 0.01 level (2-tailed).
*. Correlation is significant at the 0.05 level (2-tailed).
Page 97
76
Dependent Variable
The dependent variable was determined by using the Socially Responsible Leadership
Scale (SRLS), which measured leadership development as defined by the Social Change Model
(SCM, HERI, 1996). The basic premise of the SCM is that leadership development is based on
values instead of skills or traits. Values focus on the individual person, the group, or the related
society, seven in total. The ultimate focus of the SCM is enacting positive change.
The SRLS consisted of 68 statements, each represented one of the seven SCM values,
including the Change value. Participants were asked to rate his/her level of agreement of each
statement, 1 for strongly disagree to 5 for strongly agree. The score for each value was the
average of the statements measuring the specific value (See Appendix D). Therefore the score
for each value was between 1.00 and 5.00. Each of the seven SCM values was connected to a
specific component of the SCM, three in total:
Individual: Consciousness of Self value, Congruence value, Commitment value
Group: Collaboration value, Common Purpose value, Controversy with Civility value
Society: Citizenship value (HERI, 1996).
The component scores are the average of the questions/statements related to the values that are
part of that component. For example, the Self component consists of the Consciousness of Self,
Congruence, and Commitment values. The overall SRLS score was the average of all statements
and ranged from 1.00 to 5.00.
In order to determine which, if any, of the independent variables had a statistically
significant relationship with the overall SRLS score, which was the primary dependent variable,
I completed a bivariate comparison with the independent variables. These results are found in
Table 17. From these results, the only independent variable with a statistically significant
Page 98
77
correlation with the overall SRLS score was the EII variable and it was a positive correlation. I
also completed bivariate comparisons between the EII variable and the eight SCM values and
three SCM components. A review of these results show that the EII variable’s correlation with
all of the SCM components and six of the eight values was statistically significant. The two
exceptions were the Controversy with Civility and Change values. These results are found in
Table 18.
Table 17 Pearson r Correlations of Independent Variables with the overall SRLS Score
Overall SRLS Score
EII .211**
# of Indexes .029
# of Orgs .046
Year in College .057
Class Level .039
GPA .072
Age .088
Gender -.040
Sexual Orientation -.023
Ethnicity .049
RHA Position -.106
Institution enrollment -.014
On Campus Population -.026
Year in RHA .085
**. Correlation is significant at the 0.01 level (2-tailed).
I also ran T-tests and Analysis of Variances (ANOVAs) to determine if there was a
difference between the overall SRLS score means between independent variable groups (Field,
2012). For the independent variables with only two groups (e.g., gender, sexual orientation,
ethnicity, and dual/single RHA positions), I completed independent t-tests to compare the overall
SRLS scores between these variables’ groups (Pallant, 2013). For each of these variables, there
was no significant difference between the variable’s two groups. Furthermore, the magnitude of
the differences in the means was small, except for the dual/single RHA positions. Table 19
Page 99
78
shows the means, standard deviations, t-scores, significance, and mean difference for each of
listed variables and associated groups
Table 18 Pearson r Correlations between the EII and the SCM Values and Components
EII
Consciousness of Self .146*
Congruence .151*
Commitment .190**
Self Component .187**
Collaboration .232**
Common Purpose .278**
Controversy with Civility .047
Group Component .220**
Citizenship/Society Component .262**
Change .113
**. Correlation is significant at the 0.01 level (2-tailed).
*. Correlation is significant at the 0.05 level (2-tailed).
.
Table 19 T-tests for Independent Variables with Two Groups
Gender t(203) = 0.571, p = 0.568, two-tailed; Mean Difference = 0.032
Mean SD Mean SD
Male 4.244 0.412 Female 4.212 0.357
Sexual
Orientation
t(204) = 0.332, p = 0.741, two-tailed; Mean Difference = 0.021
Mean SD Mean SD
Heterosexual 4.217 0.372 Non-Heterosexual 4.237 0.395
Ethnicity t(204) = 0.585, p = 0.562, two-tailed; Mean Difference = 0.047
Mean SD Mean SD
White/Caucasian 4.230 0.353 Non-White 4.138 0.471
RHA Positions t(204) = -1.509, p = 0.133, two-tailed; Mean Difference = -0.093
Mean SD Mean SD
Single 4.244 0.380 Dual 4.151 0.361
With the exception of the EII variable, the remaining variables were ordinal with more
than two groups. In order to determine if the difference between the means of the overall SRLS
score of these groups was significant, ANOVAs were conducted. Table 20 provides the F-value
and p-value of each test, and eta squared to determine if the magnitude of the difference in the
Page 100
79
groups’ means, either small, moderate, or large. From the ANOVAs, there was a statistically
significant difference at the p < .05 level in the overall SRLS scores for the different Class levels:
F (3, 191) = 3.474, p = .017. The actual difference in mean score between these groups was
moderate. The effect size, calculated using eta squared, was .052. Post-hoc comparisons using
the Tukey HSD test indicated that the mean score for seniors (M = 4.386, SD = .300) was
significantly different from the juniors (M = 4.107, SD = .345). The remaining class levels did
not different significantly with the juniors or seniors. The ANOVAs for the remaining variables
indicated no significant differences between the mean overall SRLS score means for the
associated groups.
Table 20 ANOVA Results for Ordinal Independent Variables
Variable (n) df1 (# of
categories-1)
df2
(n-df1-1)
F value P value Eta
squared
Year in College (204) 5 198 1.281 0.274 0.031
Class Level (195) 3 191 3.474 0.017* 0.052
Majors (194) 3 190 1.166 0.324 0.018
GPA (199) 4 194 0.695 0.596 0.014
State (203) 4 198 0.517 0.723 0.010
Inst. Enrollment (199) 3 195 1.644 0.181 0.025
On Campus Population (200) 4 195 1.026 0.395 0.021
RHA Year (203) 4 198 1.957 0.12 0.036
# of Orgs (204) 5 198 1.548 0.177 0.038
# of Indexes (204) 5 198 1.303 0.264 0.032
*. p < 0.05 level.
Research Question #1: Relationship between Intensity of Involvement and Leadership
Development
To determine the relationship between the independent variable EII and the dependent
variable of overall SRLS score, I ran a multiple regression to fit a linear model to the data in
order to predict the values of the overall SRLS score from the independent variables (Field,
2012).
Page 101
80
There were nine variables I needed to control for in the multiple regression. These
variables were divided into three levels: institutional, group, and individual. The institutional
variable used was the institutional enrollment since the correlation with the other relevant
institutional level variable, on-campus population, was a statistically significant positive
correlation at the p < .01 level. The two group variables used were the EII and type of RHA
position (single or dual). Lastly, the individual related variables included were GPA, class level,
gender, sexual orientation, ethnicity, and number of years in RHA. There is relevant research
that identifies each of the chosen variables has a significant relationship, either positive or
negative, with extracurricular involvement and therefore, were included in the analysis (Case,
2011; Dugan, 2006a; Dugan et al., 2008; Foubert & Grainger, 2006; Hernandez et al., 1999;
Moore et al., 1998; Schuh & Laverty, 1983; Trujillo, 2009).
The multiple regression was run excluding cases listwise, meaning if a case, or
participant, was missing one piece of data of the predictors used it would be excluded from the
test (Pallant, 2013). As a result of the predictors used, 184 cases were analyzed, which is 90.2%
of the total number of cases. Tables 21 – 24 show the correlations between the predictors and
the independent variable (overall SRLS score), Regression Model Summary, ANOVA table, and
the coefficients of the predictors. The nine predictors explained 10.5% of the variance in the
overall SRLS score, F (9, 174) = 2.262, p < .05. Only one predictor’s contribution to the change
in the SRLS score was statistically significant, EII (beta = .300, p < .01). Due to related research
(Gerhardt, 2008) that compared college students’ SRLS scores determined by the number of
organizations in which the students were involved, I also ran a multiple regression with the total
number of indexes completed as the main independent variable, replacing the EII score. The
Page 102
81
results from the test are found in tables 25 and 26. The nine predictors were not able to
significantly explain the variance in the dependent variable, the overall SRLS score.
Table 21 Overall SRLS Score Correlations with Regression Predictors
Predictor Pearson Correlation Significance (1-tailed)
EII .308 .000**
Gender -.056 .223
Sexual Orientation -.078 .147
Ethnicity .024 .372
RHA Position -.079 .142
GPA .084 .129
Class Level .042 .287
Number of RHA Years .068 .179
Institution Enrollment .050 .252
**. Correlations significant at .001 (1-tailed)
Table 22 Regression Model Summary with the EII Score
R R Squared Adjusted R Square Std. Error of the Estimate
.324 .105 .058 .353
Table 23 ANOVA with the EII Score
Model Sum of Squares df Mean Square F Sig.
Regression
Residual
Total
2.536
21.677
24.213
9
174
183
.282
.125
2.262 .020*
*. p < .05 level
Table 24 Coefficients with the EII Score
Model
Unstandardized
Coefficients
Standardized
Coefficients t Sig.
B Std. Error Beta
(Constant)
EII
Gender
S. Orientation
Ethnicity
RHA Position
GPA
Class Level
RHA Years
Institution
4.154
.002
-.028
-.025
.034
-.063
.007
-.014
.005
.006
.172
.000
.057
.067
.071
.063
.032
.037
.041
.027
.300
-.036
-.029
.035
-.073
.017
-.041
.014
.016
24.201
3.985
-.479
-.374
.474
-1.003
.219
-.380
.126
.211
.000
.000**
.633
.709
.636
.317
.827
.704
.900
.833
**. p < .01 level
Page 103
82
Table 25 Regression Model Summary with the Total Number of INIXs
R R Squared Adjusted R Square Std. Error of the Estimate
.180 .033 -.018 .367
Table 26 ANOVA with the Total Number of INIXs
Model Sum of Squares df Mean Square F Sig.
Regression
Residual
Total
.788
23.425
24.213
9
174
183
.088
.135
.650 .753
*. p < .05 level
The overall SRLS score is the mean of all 68 questions of the SRLS. However, the SRLS
also measures the eight values of the SCM as well as its three components, Self, Group, and
Society. Each of the 68 statements represented one of the eight SCM values. The score for each
value was the average of scores of the statements related each value. The component scores
were determined by averaging the scores of the statements related to the values that make up the
specific component. Each of the values and related components were considered aspects of a
college student’s leadership development, so I ran separate multiple regressions with the same
predictors, but with the eight values and three components scores as the dependent variable. The
complete multiple regression results can be found in Appendix H, however the R squared, F
value and Significance, and significant beta values for the eight values and three components
scores are shared in Table 27. The results show that the nine predictors were able to statistically
explain significant variance in the dependent variable for the Commitment, Collaboration,
Common Purpose, and Citizenship values and the Group component. The EII predictor
contributed significantly to the variance for all of the above dependent variables.
Page 104
83
Table 27 Multiple Regressions for SCM Values and Components with EII
D.V. R R
Squared F Sig.
Largest
Beta Sig.
Consciousness
of Self .267 .071 1.485 .157 .232 .003**
Congruence .272 .074 1.541 .137 .249 .001**
Commitment .328 .108 2.335 .017* .303 .000**
Self .301 .091 1.924 .051 .304 .000**
Collaboration .360 .129 2.875 .003** .320 .000**
Common
Purpose .356 .127 2.807 .004** .342 .000**
Controversy
with Civility .202 .041 .820 .599 .119^ .125
Group .337 .113 2.474 .011* .309 .000**
Citizenship/
Society .322 .104 2.241 .022* .304 .000**
Change .287 .082 1.730 .085 -.173^^ .020*
*. p < .05 level
**. p < .01 level
The largest beta for six of the nine values was related to the EII variable (scores range 0-900).
^. Represents Ethnicity (0 = non-White/Caucasian; 1 = White/Caucasian)
^^. Represents RHA Positions (0 = single role; 1 = dual role)
Since my research questions focused on involvement in multiple organizations, I decided
to collapse the INIX variable from six groups into two: one organization and multiple
organizations. This provided additional answers specific to involvement in multiple
organizations. Therefore, I split the data into two sections: one organization (n=41) and
multiple organizations (n=163). I ran the multiple regressions listwise, which means cases that
do not include data for all of the variables in the model were removed. This resulted in 38 cases
(92.7%) actually being analyzed in the one organization section and 146 cases (89.6%) for the
multiple organizations section. The results show that the nine predictors were not able to
significantly explain the variance in the dependent variables for participants involved in only one
organization. This is likely due to the sample size for cases involved in one organization. The
complete multiple regression results for participants involved in one organization can be found in
Appendix I. The results for the participants involved in multiple organizations show that the
Page 105
84
nine predictors were able to significantly explain the variance in the dependent variables:
Commitment, Collaboration, Common Purpose, and Citizenship values and the Group
component. The EII predictor contributed significantly to the variance for all five dependent
variables. Table 28 reports the results of the multiple regression for the Commitment,
Collaboration, Common Purpose, and Citizenship values and the Group component. The
complete multiple regression results for participants involved multiple organizations can be
found in Appendix J.
Table 28 Multiple Regressions for Specific SCM Values and Components with EII for
Participants in Multiple Organizations
D.V. R R
Squared F Sig.
Largest
Beta Sig.
Commitment .344 .118 2.025 .041* .277 .002**
Collaboration .394 .155 2.772 .005** .308 .000**
Common
Purpose .369 .136 2.388 .015* .339 .000**
Group .357 .128 2.211 .025* .293 .001**
Citizenship/
Society .340 .115 1.971 .047* .281 .002**
*. p < .05
**. p < .01
The largest beta for the four values and Group component was related to the EII variable (scores
range 0 = 900)
Summary
The first research question was, What is the relationship between college students’
intensity of involvement in multiple student organizations and their leadership development as
defined by the Social Change Model of Leadership Development (HERI, 1996)? In order to
answer this question, I ran multiple regressions using nine independent variables as the main
predictors. The first multiple regression was conducted to predict how much of the variance in
the overall SRLS score could be explained by the nine predictors. The results show that 10.5%
Page 106
85
of the variance could be explained by the nine predictors, F (9, 174) = 2.262, p < .05, with the
EII variable statistically contributing the most to that variance (beta - .300, p < .01).
Since the overall SRLS score included scores at the value level and the component level,
multiple regressions were run to determine if the variance in those variables could be
significantly explained by the nine predictors. The variance in four values and one component
scores were significantly explained by the predictors: Commitment, F (9, 174) = 2.335, p < .05,
Collaboration, F (9, 174) = 2.875, p < .01; Common Purpose, F (9, 174) = 3.807, p < .01;
Citizenship/Society Component, F (9, 174) = 2.241, p < .05; and Group Component, F (9, 174) =
2.474, p < .05. The EII variable was the predictor that significantly contributed to the variances
in all of these values and components.
When the data were split between cases involved in one organization and multiple
organizations, the multiple regressions run identified significant explanations of variances for
four values and the group component for the multiple organization cases: Commitment F (9,
136) = 2.025, p < .01; Collaboration F (9, 136) = 2.772 p < .01; Common Purpose F (9, 136) =
2.388, p < .05; Citizenship F (9, 136) = 1.971, p < .05; and Group F (9, 136) – 2.211 p < .05.
The EII variable was the predictor that significantly contributed to the variance in all four values
and the group component. The nine predictors did not significantly explain the variance in any
of the dependent variables for the one organization cases. The discussion of these results will be
in Chapter 5.
Research Question #2: Diminishing Returns in Leadership Development Variables
The second research question was: Are there signs of diminishing returns regarding
college students’ intensity of involvement and their leadership development? In order to
determine if there was a point in relation to the intensity of involvement where the development
Page 107
86
of leadership values was no longer increasing at the same rate, additional analyses were required.
Spearman’s Law of Diminishing Returns (Jensen, 2003) explains the relationship between two
variables that shows smaller advances in the dependent variable as the independent variable
increases at the same rate. Although it is well known as an economic term related to supply and
demand, the concept can be used in a variety of fields including education (Pierce & Aguinis,
2013). For the current study, my goal was to determine if there was an intensity of involvement
level/score where development of leadership values as defined by the SCM would taper off. In
other words, is there a tipping point where a certain level of involvement, or intensity, is no
longer a benefit to developing leadership values?
In order to answer this question, the analyses required the use of a quadratic equation that
incorporates the square of the independent variable identify possible diminishing returns in
multivariate models (Aiken & West, 1991). Since the EII variable was the only variable that was
continuous, it was the only one that required the squared variable. I then re-ran the multiple
regressions from question 1 with the addition of the new variable, EII Squared. Results from
these tests are shared in Tables 29 and 30. These results provided the data needed to complete
the second part of the tests, which is solving the following formula: X = -b1/2b2, where X is the
tipping point for the independent variable (EII), b1 is the regression coefficient for the EII
variable, and b2 is the regression coefficient for the EII Squared variable. This equation is
derived from the quadratic formula, b1 + 2b2X = 0, adjusted to solve for X (Aiken & West,
1991). Table 31 shows the tipping point of the EII variable (219) that indicated score beyond
which an increase in the EII is likely to coincide with a decline in the overall SRLS score for the
entire group.
Page 108
87
Table 29 ANOVA of overall SRLS score with EII and EII Squared Variables
Model
Sum of
Squares df
Mean
Square F Sig.
Regression
Residual
Total
3.298
20.915
24.213
10
173
183
.330
.121
2.728 .004**
**. p < .01
Table 30 Coefficients of overall SRLS score with EII and EII Squared
Model
Unstandardized Coefficients
Standardized
Coefficients
t Sig. B Std. Error Beta
(Constant)
EII
EII Squared
Gender
Sexual Orientation
Ethnicity
RHA Position
GPA
Class Level
Years in RHA
Institution
4.133
.004
-9.153E-006
-.024
-.015
.032
-.072
-.001
-.028
.003
-.007
.169
.001
.000
.057
.066
.070
.062
.032
.037
.041
.027
.823
-.539
-.032
-.017
.033
-.083
-.002
-.080
.007
-.018
24.410
3.723
-2.510
-.422
-.220
.452
-1.159
-.020
-.755
.069
-.242
.000
.000
.013
.674
.826
.652
.248
.984
.451
.945
.809
Table 31 Determining Tipping Point of EII score for Sample
Entire Sample
EII Variable
0 Returna
% Cases
219
5.39% (11 cases)
a Value of X when b1 + 2b2X = 0.
Similar to the first research question, I also ran the same tests with the same predictors,
but with the data split between participants involved in one organization (n=41) and those
involved in multiple organizations (n=163). The results from these analyses are seen in tables
32-36. Table 32 shows the F-value was not statistically significant for participants involved in
one organization, while Table 34 shows the F-value was statistically significant for participants
involved in multiple organizations. Table 33 highlights the coefficients for the predictors,
Page 109
88
including the EII Squared, resulting from the multiple regression for participants involved in one
organization and Table 35 highlights the coefficients from the multiple regression for
participants involved in multiple organizations. Table 36 shows the tipping point in the EII
variable for participants involved in multiple organizations was 224. This indicated the point
beyond which an increase in the EII is likely to coincide with a decline in the overall SRLS score
for participants involved in multiple organizations. The meaning from these results is discussed
in Chapter 5.
Table 32 ANOVA of overall SRLS score with EII and EII Squared for Participants in One
Organization
Model
Sum of
Squares df
Mean
Square F Sig.
Regression
Residual
Total
1.290
3.125
4.415
10
27
37
.129
.116
1.114 .388
*. p < .05
Table 33 Coefficients of overall SRLS score with EII and EII Squared for Participants in One
Organization
Model
Unstandardized Coefficients
Standardized
Coefficients
t Sig. B Std. Error Beta
(Constant)
EII
EII Squared
Gender
Sexual Orientation
Ethnicity
RHA Position
GPA
Class Level
Years in RHA
Institution
3.952
-.004
8.198E-005
-.070
-.057
.074
.201
-.037
-.017
-.028
.074
.371
.007
.000
.117
.158
.196
.167
.071
.081
.124
.076
-.306
.722
-.102
.068
.067
.215
-.089
-.054
-.066
.206
10.647
-.570
1.345
-.599
.362
.377
1.202
-.514
-.214
-.226
.968
.000
.574
.190
.554
.721
.709
.240
.612
.832
.823
.342
Page 110
89
Table 34 ANOVA of overall SRLS score with EII and EII Squared for Participants in Multiple
Organizations
Model
Sum of
Squares df
Mean
Square F Sig.
Regression
Residual
Total
2.717
16.843
19.560
10
135
145
.272
.125
2.177 .023*
*. p < .05
Table 35 Coefficients of overall SRLS score with EII and EII Squared for Participants in
Multiple Organizations
Model
Unstandardized Coefficients
Standardized
Coefficients
t Sig. B Std. Error Beta
(Constant)
EII
EII Squared
Gender
Sexual Orientation
Ethnicity
RHA Position
GPA
Class Level
Years in RHA
Institution
4.161
.004
-8.933E-006
.013
-.046
.005
-.112
.010
-.032
.000
-.018
.195
.001
.000
.068
.076
.079
.069
.038
.045
.046
.032
.838
-.570
.017
-.052
.006
-.132
.024
-.090
-.001
-.048
21.372
2.852
-2.037
.190
-.601
.065
-1.617
.266
-.718
-.008
-.542
.000
.005
.044
.850
.549
.948
.108
.791
.474
.994
.588
Table 36 Determining Tipping Point of EII score for Participants in Multiple Organizations
Multiple Organizations Section
EII Variable
0 Returna
% Cases
224
6.75% (11 cases)
a Value of X when b1 + 2b2X = 0.
Summary
To answer the second research question, I used a quadratic equation to determine if there
was a curvilinear relationship between the EII score (intensity of involvement) and the SRLS
score (leadership development). In other words, I wanted to know if there was a certain EII
score that indicated a decrease in the SRLS score, known as the tipping point. The quadratic
equation used was b1 + 2b2X = 0 (Aiken & West, 1991). The equation included the square of
Page 111
90
any continuous independent variable used in the analysis. For this study, the only independent
variable that was continuous was the EII score; therefore a new variable was created, EII
Squared. Multiple regressions were run to provide the data needed to solve the quadratic
equation. The regression coefficient for the EII score is represented by b1 and the regression
coefficient for EII Squared by b2. In order to solve for X, the tipping point for the EII score, the
equation was adjusted: X = -b1/2b2.
Multiple regressions were run on the entire sample (n=204) and then on the data split
between cases involved in one organization (n=41) or multiple organizations (n=163). The
multiple regressions resulted in a statistically significant F-score for the entire sample, with the
tipping point for the entire sample was an EII score of 219. When the data were split between
participants involved in one organization or multiple organizations, the F-score for participants
in multiple organizations was statistically significant and a tipping point of 224 in the EII
variable. The regressions ran for participants involved in one organization was not statistically
significant; therefore there was no identifiable tipping point.
Conclusion
In this chapter I provided the participants’ demographic information and how each of
those items were incorporated, or not incorporated, in the analyses used to answer the two
research questions. Furthermore, I reviewed how data regarding the intensity of involvement
(EII) and leadership development (SCM) were combined to create the main independent
variable, the EII score, and the dependent variables. Multiple regressions were run to answer the
two research questions. The data were run as the entire sample and then split between
participants involved in one organization or multiple organizations. The results of the multiple
Page 112
91
regressions showed positive statistically significant relationships between the intensity of
involvement and leadership development for the entire sample and for participants involved in
multiple organizations. Additionally, the regressions run to answer question 2 resulted in
determining a tipping point in the EII score beyond which it is likely to coincide with a decline in
the overall SRLS score for the entire sample and for the participants involved in multiple
organizations.
Chapter 5 will share the discussion of this data and how it relates to the current research
on involvement in extracurricular activities.
Page 113
92
Chapter 5: Discussion and Conclusion
In this chapter I begin with a brief review of the problem and the purpose of the study. I
then share my interpretations of the findings, implications for key players (i.e., student affairs
professionals and researchers), and recommendations for future research. Since the inception of
higher education in North America, students considered learning from out-of-classroom
activities just as valuable, if not more valuable, than learning from in the classroom (Thelin,
2004). Initially, out-of classroom activities were in-depth debates or physical games among the
students (Thelin, 2004). As the years passed, more and more institutions saw the creation of
actual sport teams, Greek organizations, honorary societies, and student organizations related to
specific topics (Moore et al., 1998).
Throughout the past half century, studies have measured the outcomes of attending
college and of being involved in a specific student organization (Moore, et al., 1998).
Furthermore, the outcomes, positive and negative, varied between academic achievement,
cognitive development, moral development, and psychosocial/personal development
(Abrahamowicz, 1988; Chickering & Reisser, 1993; Hernandez et al., 1999). The overall
consensus, though, has been that being involved in the college experience is more likely to lead
to positive overall development and persistence to graduation. Although studies on the influence
of attending college are prevalent in the past 50 years, it has only been since the 1990s that
studies focused on college students’ leadership development became part of the landscape
(Komives, Lucas, et al., 2006). In the 1990s, two instruments measuring college students’
leadership development emerged: the Socially Responsible Leadership Scale (SRLS, Tyree,
1998) and the Student Leadership Practice Inventory (Kouzes & Posner, 1998). Both were
developed from an established leadership theory. The main difference between the two theories
Page 114
93
is the Social Change Model for Leadership Development (Higher Education Research Institute
[HERI], 1996), the theory from which the SRLS was developed, was created from the actual
experiences of college students. The other theory, The Leadership Challenge (Kouzes & Posner,
2003) was developed from experiences of leaders in the business industry.
Most studies looking at the leadership development of college students focused on the
influence of one type of organization or activity such as community service. Very few looked at
involvement in multiple student organizations and its influence on leadership development
(Fitch, 1991; Gerhardt, 2008). The problem investigated in this study is how a college student’s
intensity of involvement in multiple registered student organizations is related to the student’s
leadership development. Although there are two main leadership development theories available
to measure college students’ leadership development, one has been used more frequently than the
other: the Social Change Model of Leadership Development. Therefore, this theory was used as
the current study’s framework.
The purpose of this study was to identify the relationship between the intensity of
involvement in student organizations and college students’ leadership development. In other
words, is there a point when an increase in a student’s intensity of involvement no longer
corresponds to an increase in leadership values, as defined by the Social Change Model of
Leadership Development? The research questions for this study were:
1. What is the relationship between college students’ intensity of involvement in
multiple student organizations and their leadership development as defined by the
Social Change Model of Leadership Development (HERI, 1996)?
2. Are there signs of diminishing returns regarding college students’ intensity of
involvement and their leadership development?
Page 115
94
The intensity of involvement is the product of the quantity of the involvement (hours
spent) and the quality of the involvement (effort put towards achieving an organization’s goals)
(Winston & Massaro, 1987). The Extracurricular Involvement Inventory (EII, Winston &
Massaro, 1987) was developed to provide a quantifiable score that represents a college student’s
intensity of involvement. The main component of the EII is the Involvement Index (INIX) form
a college student completes for each of the student organizations in which the student is currently
active. The final EII score is the sum of the (INIX) scores for a college student. The INIX score
was the sum of the quality statement scores (5 in total) multiplied by quantity score (see
Appendix C). The participants’ leadership development was determined by completing the
Socially Responsible Leadership Scale (SRLS, National Clearinghouse for Leadership Programs
[NCLP], n.d.) that is based on the Social Change Model (HERI, 1996). This model states that
leadership is based more on values and not specific skills or traits. These values are either
individually-, group-, or societal-based:
Individual: Consciousness of Self, Congruence, Commitment
Group: Collaboration, Common Purpose, Controversy with Civility
Society: Citizenship (see table 37 for descriptions)
The score for each value and component was the average of the scores for the related statements
(ranging from 1-5, 1 for strongly disagree and 5 for strongly agree), and the overall SRLS score
was the average of the scores for all statements. The research questions were answered with
“leadership development” defined as the overall SRLS, individual values, and components,
separately.
Interpretation of Findings
In this section I will provide my interpretations of the survey results as they relate to the
two research questions for the entire sample and when the sample was split into cases of those
Page 116
95
who were involved in one organization and involved in multiple organizations determined by the
number of involvement indexes (INIXs) completed. Furthermore, I will situate my findings
within the extant relevant research.
Research Question #1
Overall Leadership Development (Overall SRLS score). Research studies that focus
on the influence involvement in student organizations has on a college student’s development
have ranged from the overall college experience (Abrahamowicz, 1988) to specific areas such as
psychosocial development (Cooper et al., 1994; Foubert & Grainger, 2006) and leadership
development (Campbell, Smith, Dugan, & Komives, 2012; Cress, Astin, Zimmerman-Oster, &
Burkhardt, 2001; Dugan, 2006b; Posner, 2009a). Most of these studies support Astin’s (1984)
Student Involvement theory, which states that the more a college student is involved in their
college experience the more likely the student is to persist until graduation. The unique aspect
about this study is that it focused not only on the quantity of the involvement (number of
organizations) and the class level of the participants, but also the quality of that involvement.
Statements to determine the quality of the involvement related to the frequency of the student’s
participation in meetings and activities, promotion of the organization to others, and fulfillment
of the student’s responsibilities for the organization. There is only one other study that used
intensity of involvement as the independent variable, but placed the cases in one of three groups:
+0.5 SD, ±0.5 SD, and -0.5 SD (Fitch, 1991). The current study used the independent variable,
EII, as a continuous variable and did not separate the cases by the standard deviations.
Therefore, this study provided additional information about the intensity, or level, of
involvement in student organizations and its relationship with leadership development.
Page 117
96
The results from this study are no different from these previous studies. The results
indicated that the EII, along with the additional eight predictors, was able to explain a significant
amount of the variance in the dependent variable, the overall SRLS score, in the participants
(F(9,174) = 2.262, p = .02). As predicted, the variable that contributed the most to the variance
was the EII score (beta = .300, p = .000). Therefore, there is a significant positive relationship
between the intensity of involvement of a college student and the student’s leadership
development. The fact that the EII contributed the most to the variance supports the suggestion
that we should study more than the class level of students or the number of organizations in
which students’ are involved when looking at the development of students, especially their
leadership development. In fact, the correlations between the overall SRLS score (leadership
development) and the two independent variables used in previous studies (number of
organizations and class level) were not significant. This contradicted the results of a similar
study (Gerhardt, 2008), which indicated significant differences in the SRLS scores of college
students who were involved in three or more organizations and students involved in 1-2
organizations.
Additionally, the results from the current study’s correlation between leadership
development and class level contradicted longitudinal studies that compared college students’
psychosocial development as a freshmen and once again as a junior or senior (Cooper et al.,
1994; Foubert & Grainger, 2006) and reported there was a substantial difference between these
class levels. Although leadership development is not the same as psychosocial development,
there are similarities between the Social Change Model (HERI, 1996) and Chickering and
Reisser’s (1993) identity theory that assist in comparing the current study’s results with the
results from these two previous studies. The instrument Cooper et al., (1994) and Foubert and
Page 118
97
Grainger (2006) used, the Student Development Task and Lifestyle Inventory (Winston et al.,
1987), measured certain concepts from Chickering and Reisser’s theory: establishing and
clarifying purpose, managing interpersonal relationships, and academic autonomy. Two of these
concepts, establishing and clarifying purpose and managing interpersonal relationships, are
similar to the SCM values of Consciousness of Self, Congruence, Collaboration, and
Controversy with Civility.
Since the number of involvement indexes a participant completed did not always equal
the number of student organizations in which the participant was involved, I used the Total
Number of Indexes variable as a proxy for the number of student organizations. In order to
compare the results using the number of organizations and using the EII as the main independent
variable, I also ran multiple regressions replacing the EII with the Total Number of Indexes
variable and keeping the other eight predictors. The results showed that the nine predictors were
not able to explain a significant amount variance in the overall SRLS score (F(9, 174) = .650, p =
.753). Therefore, in this study, the overall SRLS score did not have a significant relationship
regarding the number of involvement indexes a participant completed, which also means there
was no significant relationship between the number of organizations in which a student is
involved and leadership development.
The main focus of this study is the relationship between the intensity of involvement and
leadership development for college students’ who are involved in more than one student
organization. The number of organizations the participants were involved in ranged from one to
six, so I needed to divide the data into two groups: participants involved in one organization and
participants involved in multiple organizations. The entire sample of 204 was split into one
Page 119
98
group of 41 (involvement in one organization) and one group of 163 (involvement in multiple
organizations).
Since the number of participants in the group based on involvement in one organization
was less than 100, the results from the regressions were skewed and inaccurate interpretation of
the results. With that said, the results from the multiple regression for participants involved in
one organization indicated a positive relationship but it was not a significant one (F(9, 28) =
1.008, p = .457). The results from the multiple regression for participants involved in multiple
organizations also showed a positive relationship between the intensity of involvement and
leadership development (F(9, 136) = 1.914, p = .055), but similar to those involved in one
organization, the relationship was not significant. These results support the assumption that the
relationship between intensity of involvement in multiple organizations and leadership
development is positive. However, the results of the current study’s regression models do not
statistically confirm the positive relationship. Therefore, when the first question is focused on
the intensity of involvement in multiple organizations and its relationship with leadership
development, there is no support for a significant relationship, positive or negative.
Individual Values and Components. The Social Change Model consists of seven
values that lead to positive social change and the development of leadership values (see table
37). Part of this study was to also determine the type of relationship between the intensity of
involvement and each of the seven values and the three components of the Social Change Model.
Results from running the multiple regressions for each value and each component showed that
the nine predictors were able to significantly explain the variance in several values and
components: Commitment value (F(9, 174) = 2.335, p = .017), Collaboration value (F(9, 174) =
2.875, p = .003), Common Purpose value (F(9, 174) = 2.807, p = .004), Citizenship
Page 120
99
value/Society component (F(9, 174) = 2.241, p = .022) and the Group component (F(9, 174) =
2.474, p = .001). The EII variable significantly contributed the most to the variance in all of
these dependent variables. An interesting observation is how these results compare to the
bivariate comparison of the EII variable and the individual values and component scores.
The results of the bivariate comparison (table 18) showed that the EII variable had
significant correlations with all values and components of the SCM with the exception of the
Controversy with Civility and Change values. The results of the multiple regressions highlighted
the importance of the additional predictors (GPA, class level, institutional enrollment, gender,
sexual orientation, ethnicity, RHA position, and year in RHAs) in analyzing the relationship
between EII and SCM values and components. The additional predictors altered the relationship
between the EII and the values of Consciousness of Self and Congruence; both are values that
are part of the Individual/Self component. An argument could be made that the reason for this is
that college students are very focused on the values connected to the group and the larger society
(e.g., the institution): Collaboration, Common Purpose, and Citizenship. The Commitment
value, although it is a self-component value, is the value that connects with the group component
values. Table 37 provides a brief explanation of the seven values.
I also contend that the reason the nine predictors did not significantly predict the
variances in the Consciousness of Self and Congruence values is a result of the environment in
which the data were collected. The participants were at a conference geared towards college
students currently in student organizations. Most of the participants were around their group
members more than other weeks due to preparation for the conference. Therefore, I argue that
the values related to the group or the institution could rate higher than the self-component values
not related to group work. During the conference, the attendees were encouraged to support their
Page 121
100
institutions through clothing, cheers, and giveaway items. I believe this focus of the conference
connects with the Citizenship value/Society component results.
Table 37 Values Definitions for the Social Change Model of Leadership Development
Value Definition
Self Component Values
Consciousness of Self Awareness of the beliefs, values, attitudes, and emotions that
motivate one to take action.
Congruence Thinking, feeling, and behaving with consistency, genuineness,
authenticity, and honesty towards others; actions are consistent
with most deeply-held beliefs and convictions.
Commitment The psychic energy that motivates the individual to serve and
that drives the collective effort; implies passion, intensity, and
duration, and is directed toward both the group activity as well
as its intended outcomes.
Group Component Values
Collaboration To work with others in a common effort; constitutes the
cornerstone value of the group leadership effort because it
empowers self and others through trust.
Common Purpose To work with shared aims and value; facilitates the group’s
ability to engage in collective analysis of issues at hand and the
task to be undertaken.
Controversy with Civility Recognizes two fundamental realities of any creative group
effort; that differences in viewpoint are inevitable, and that
such differences must be aired openly, but with civility.
Civility implies respect for others, a willingness to hear each
other’s views, and the exercise of restraint in criticizing the
views and actions of others.
Society Component Value
Citizenship The process whereby an individual and the collaborative group
become responsibly connected to the community and the
society through the leadership development activity. To be a
good citizen is to work for positive change on the behalf of
others and the community.
Overall Value
Change The ability to adapt to environments and situations that are
constantly evolving, while maintaining the core functions of
the group.
Note. Source: Higher Education Research Institute. (1996). as cited in Dugan, J. P. and
Komives, S. R. (2010). Influences on college students’ capacities for socially responsible
leadership. Journal of College Student Development, 51(5), 525-549
Page 122
101
Related research consistently had the Citizenship value as one of the three lowest values, along
with the Controversy with Civility and Change values. The current study’s results related to the
Controversy with Civility and Change values are not surprising because related research show
that those two values are consistently the lowest rated scores among college students (Buschlen,
2010; Dugan, 2006b; Dugan & Komives, 2007; Gerhardt, 2008; Haber, 2006; Nobbe, 2012;
Slife, 2007; Trujillo, 2009).
I also ran multiple regressions with each single value and component as the independent
variable after I split the data between participants involved in one organization and participants
involved in multiple organizations. Similar to the overall SRLS score results, the nine predictors
did not provide a significant explanation of the variance in any of the values or components for
the participants involved in one organization. This is very likely due to the fact that size of the
group (n=41) was smaller than 100. Data with less than 100 cases do not lead to accurate or
significant results (Field, 2012). Therefore, further research is needed to realistically compare
college students involved in one organization with students involved in multiple organizations.
Regressions run with the data from participants involved in multiple organizations
showed that the nine predictors were able to significantly explain the variance in the
Commitment value (F(9, 136) = 2.025, p = .041), Collaboration value (F(9, 136) = 2.772, p =
.005), Common Purpose value (F(9, 136) = 2.388, p = .015), Citizenship value/Society
component (F(9, 136) = 1.971, p = .047), and Group component (F(9, 136) = 2.211, p = .025).
These are similar results to the entire sample results for the values and components. In fact, if
you compare the p-values of each of these values and components and arrange them lowest to
highest, the list would be the same for the entire sample and for the participants involved in
multiple organizations (lowest to highest): Collaboration, Common Purpose, Group,
Page 123
102
Commitment, and Citizenship. I do not find this surprising, though, since the participants
involved in multiple organizations is 80% of the entire sample (163 of 204). Although the nine
predictors were not able to substantially explain the variance in the overall SRLS score for
participants involved in multiple organizations, the predictors were able to significantly explain
the variance in four of the seven values and two of the three components. Furthermore, the EII
was the predictor that significantly contributed to the variance in the four values and two
components. Therefore, when the first research question is focused on the values and
components of leadership development, there is support for significant position relationships
between the EII and each of the four values and two components.
Research Question #2
In Astin’s (1984) seminal work on the Student Involvement theory, he raised a question
regarding a point in a student’s involvement where an increase in involvement ceases to lead to
an increase in development of a college student, or may become counterproductive. After
thorough review of relevant research, there is no study that questions a point in a college
student’s college experience, in general or in student organizations, at which the increased
involvement in activities no longer results in an increase in the student’s development. The
second part of this study focused on determining if there was a point, or score, in a college
student’s intensity of involvement that represents the point at which an increase in the intensity
of involvement is less likely to result in an increase in the student’s leadership development.
A college student’s intensity of involvement, or Extracurricular Involvement Inventory
(EII) score, is the sum of the scores of the student’s intensity of involvement for each student
organization in which the student is involved (Winston & Massaro, 1987). The student’s
intensity of involvement for an organization is determined by the student’s answers on the
Page 124
103
Involvement Index (INIX) that includes questions regarding the type of organization, the
student’s role, the number of hours dedicated to the organization during the most recent four
weeks, and five questions about the quality of the involvement determined by the frequency of
the activity (Very Often, Often, Occasionally, and Never). Table 38 lists the
questions/statements included on the INIX.
Table 38 Questions and Statements from the Involvement Index
Statement Purpose Possible Answers
What type of organization is it? Information only 13 options
In the last four weeks, . . .
. . . for approximately how many hours have
you been involved with this group or
organization and its activities or programs?
Quantity Self entry
. . . have you held an office in this organization
or a position equivalent to one of the
following offices?
Information only 7 options
. . . when I attended meetings, I expressed my
opinion and/or took part in the discussion
Quality
Question #1
Very Often, Often,
Occasionally, Never*
. . . when I was away from members of the
group/organization, I talked with others
about the organization and its activities, or
wore a pin, jersey, etc. to let others know
about my membership.
Quality
Question #2
Very Often, Often,
Occasionally, Never
. . . when the group/organization sponsored a
program or activity, I made an effort to
encourage other students and/or members
to attend.
Quality
Question #3
Very Often, Often,
Occasionally, Never*
. . . I volunteered or was assigned
responsibility to work on something that
the group/organization needed to have
done.
Quality
Question #4
Very Often, Often,
Occasionally, Never
. . . I fulfilled my assigned duties or
responsibilities to the group/organization
on time.
Quality
Question #5
Very Often, Often,
Occasionally, Never*
*. Indicates additional options that were scored zero (0) in the calculation. See Appendix D.
The number of hours dedicated to an organization was scored 1-point for every eight
hours (1-8 hours = 1 point; 9-16 hours = 2 points); so if a student recorded 15 hours, the quantity
score would be 2. The five quality questions were scored 0-3, with 3 representing Very Often
Page 125
104
and 0 representing Never. The INIX score was determined by multiplying the sum of the 5
quality scores by the quantity score. For example, the student who dedicated 15 hours to an
organization marked Very Often for all 5 quality statements (3*5 = 15); the INIX score for the
student would be 30 (2*15 = 30). The range for the quality of involvement is 0-15 and the range
for the quantity is 0-10. Therefore, the maximum score for an INIX is 150. The maximum
number of INIX a student could complete was six, so the maximum EII score is 900 (150*6 =
900).
Results from the multiple regression run to answer question two indicated that there was
a point where an increase in the EII score was less likely to lead to an increase in the leadership
development (overall SRLS score) for a college student. This point was determined by using a
quadratic equation that integrated the square of the EII score (Aiken & West, 1991). The result
of the equation indicated that the approximate EII score that corresponded to the “tipping point”
for the entire sample was 219; 11 participants had an EII score higher than 219, or 5.39% of the
204 participants. When the participants were split between those involved in one organization
and involved in multiple organizations, the results of the multiple regressions showed that there
was no “tipping point” for the participants involved in one organization, however there was a
point for the participants involved in multiple organizations. The approximate EII score
corresponding to the “tipping point” for the participants involved in multiple organizations was
224; of the 163 participants in this group, 11 participants had an EII score higher than 224
(6.75%). These “tipping points” (219 and 224), when averaged (222), were approximately 62%
of the maximum EII score for the sample (0-360). However, when compared to the possible
maximum EII score of 900, 222 is approximately 25% of 900.
Page 126
105
Although the “tipping point” is a larger percentage of the sample’s EII scores, it is only a
quarter of the general maximum score. This means 75% of the possible maximum range of EII
scores (0-900) is higher than the average “tipping point”. Even though the possible maximum
score of 900 is theoretical, I argue that college students’ EII scores could still be higher than the
current study’s “tipping point” of 222 since the majority of the possible range of EII scores is
larger than the “tipping point”. Therefore, students involved in two or more student
organizations at the most extreme intensity level (INIX score = 150) could have an EII score
larger than current study’s the “tipping point”. In reality, this does not mean all students
involved in two or more organizations would have an EII score at that level, but knowing this
information helps staff acknowledge that scoring an EII larger than 222 is more likely than not.
What do the EII scores of 219, 222 (the average), and 224 represent in relation to a
college student’s actual involvement in student organizations? The “tipping point” could
potentially be reached by a college student who is involved in two organizations by spending 80
hours or more during the most recent 4 weeks (20 hours/week) at the highest level of quality
(Very Often for all 5 questions) in one organization (INIX score = 150) and then spending 33-40
hours (~10 hours/week) during the most recent 4 weeks at almost the highest level of quality
(14/15) in another organization (INIX score = 75). This intensity of involvement leads to an EII
score of 225, which is three points higher than the average EII score. If this college student
proceeded to become involved in another organization at the same intensity level as in the other
organizations, it is likely the student’s leadership development would not increase but may begin
to decrease or remain stagnant. Furthermore, other aspects of the student’s college experience
may also be affected, most likely negatively; such as academic performance, healthy habits (e.g.,
eating, exercising, sleeping), or relationships with others (e.g., family, significant other, friends).
Page 127
106
The unique aspect of using the intensity of involvement in student organizations as the
independent variable is the multiple ways college students could reach the same level of
involvement. For example, another way a college student could reach an EII score of ~222 is by
being active in three organizations, but not necessarily at the highest level (12 or 13 instead of
15), and dedicating 10-12 hours per week (41-48 total hours in 4 weeks) in each of the
organizations. Table 40 shows how the EII score would be calculated for this student.
Table 39 Example of a College Student’s Overall Intensity of Involvement
Org. Total
Hours
Quantity
Score
Quality
Q1
Score
Quality
Q2
Score
Quality
Q3 Score
Quality
Q4
Score
Quality
Q5 Score
Org #1 43 6 3 2 3 2 3
INIX #1 = 78 (6*13) Total Quality 3+2+3+2+3 = 13
Org #2 41 6 2 2 2 3 3
INIX #2 = 72 (6*12) Total Quality 2+2+2+3+3 = 12
Org #3 48 6 1 2 3 3 3
INIX #3 = 72 (6*12) Total Quality 1+2+3+3+3 = 12
EII Score = 222 (78+72+72)
Another example that is possibly more realistic involves spending, on average, 5
hours/week in an organization and the quality of the involvement is either Often (2) or
Occasionally (1). For this type of involvement in one organization with a Quality score of 8
(2+2+2+1+1) and a Quantity score of 3 (20 hours in 4 weeks), the INIX score would be 24 (8*3).
If a college student’s total intensity of involvement in student organizations was at the “tipping
point” level, EII = ~222, the student would need to be involved in 9 organizations (24*9 = 216).
A student being involved in this number of organizations is unlikely. This example highlights
that a college student who is moderately involved (approximately half of the maximum quality
score of 15) in student organizations, up to nine of them, would continue to benefit from the
involvement as it relates to leadership development. It also leads to the idea that the “tipping
point” is more relevant for the college students whose quality of involvement score is higher than
Page 128
107
8 (15/2 = 7.5, half of the maximum quality score), especially those who spend more time with
the student organization and related events than potentially with other aspects of their lives, i.e.,
studying, exercising, sleeping, or visiting family.
I wanted to see how the “tipping point” of 219 (the calculated tipping point for the entire
sample) compared to the average number of hours and average number of INIXs completed by
the participants. The average number of hours the participants dedicated to an organization over
a 4-week period was 19 hours (quantity score of 3) and the average number of INIXs completed
was 3. When I calculated the EII score with the assumption that the quality of involvement score
for each organization was the highest (5*3=15), the total EII score was 135 (15*3 = 45; 45*3 =
135), 84 points lower than the “tipping point” of 219, or 62% of the “tipping point”. At first, I
was concerned that this “average” EII score was much lower than the “tipping point”, but then I
realized that the number of organizations in which participants were involve was skewed towards
the lower amounts; 71% of the participants completed one, two, or three INIXs, while 29%
completed more than three. The amounts entered for the number of hours dedicated to
organizations were also skewed more to the lower end for the entire sample; the mean was 19
hours over the 4 weeks, but the median was 28 hours. When the frequency of a variable is
skewed it is likely that the average of that variable is also skewed in the same direction and is not
an accurate average (Field, 2012). I decided to calculate the EII score with the median hours
(28) and with the quality of involvement remaining the same; the EII score was 180 (45*4 –
180). Again, this EII score was lower than the “tipping point” of the EII score.
This leads to me to contend that determining a college student’s intensity of involvement
is more relevant for students who are actively involved in two or more organizations. The 11
participants whose EII score was higher than 222 were all involved in two or more organizations:
Page 129
108
1 = 2 organizations; 4 = 3 organizations; 4 = 4 organizations; 1 = 5 organizations; 1 = 6
organizations. This analysis also supports the fact that students can reach a certain EII score in
many ways. Therefore, there is no specific equation that leads to the potential of no longer
developing leadership values through student organization involvement; instead, it is
individually-based. At the same time, these results provide support that there is a limit to the
amount of involvement that leads to positive development of leadership values.
When I began researching this topic, I used my own experiences, as an undergraduate
student and as a student affairs professional, to guide my assumptions regarding a “tipping point”
in college students’ intensity of involvement in student organizations. I believed that a large
number of our students, not the majority, would be close or over the calculated “tipping point.”
The results from this study adjusted my assumptions and beliefs regarding the number of
students’ who’s EII score is larger than the “tipping point.” Even though a smaller number of
students (n=11) had EII scores larger than 219, this number of students provides evidence that
further research in this area would be beneficial for college students.
Summary
The results from this study as they relate to the two research questions provided support
that a college student’s intensity of involvement influences the student’s development of
leadership values that are defined by the Social Change Model of Leadership Development
(HERI, 1996). More specifically, the intensity of involvement influenced leadership
development in the values of Commitment, Collaboration, Common Purpose, and Citizenship;
all of which are related to being in a group. This influence supports the idea that being involved
in student organizations increases the leadership development of college students (Cress et al.,
Page 130
109
2001; Dugan, 2006b; Kezar et al., 2006; Kouzes & Posner, 2009; McIntire, 1989), especially
students involved in multiple organizations.
Furthermore, a “tipping point” in the EII score was identified at which point an increase
in the student’s leadership development is less likely to occur, especially for students involved in
multiple organizations. The results provided support for my original premise that there was a
significant relationship between a college student’s intensity of involvement (EII score) and
leadership development (overall SRLS score), and that there would be a “tipping point” beyond
which an increase in the intensity of involvement is less likely to lead to an increase in leadership
development. These results also support Astin’s (1984) suspicion of a limit to the benefit of
involvement as it related to a college student’s development. Although a small percentage of
participants’ EII scores were above the study’s “tipping point”, the study offers a starting point
for future research on the benefits of being involved in student organizations and the concept of a
“tipping point” at which benefits of that involvement on leadership values are no longer present.
Implications and Recommendations
This study has provided information useful to the field of student affairs and the
professionals who work with college students, especially those involved in student organizations.
One of the main goals of this study was to fill a gap in the literature on college students’
involvement in student organizations and their leadership development. Most of the previous
research on student organization involvement looked at the number of organizations in which
students’ are involved. This study looked at a combination of factors that make up college
students’ involvement, its quantity and quality, and the relationship between the combination of
these factors, the intensity of involvement, and leadership development that is described by the
Social Change Model (HERI, 1996). This section provides suggestions on how the results from
Page 131
110
this study can be used by student affairs professionals and researchers. Recommendations for
future research are also discussed.
Implications for Student Affairs Professionals
The results from this study provide several implications for student affairs professionals,
especially those who directly interact with college students involved in student organizations.
The study’s results support the fact that the more a college student is involved in their college
experience, the more likely they are to develop values related to leadership (Dugan, 2006b). In
addition to supporting past research, the results also provide suggestions that relate to college
students and their involvement in student organizations. First, college students need to be
encouraged to get involved in at least one student organization. The study showed that being
involved in at least one organization influenced the college student’s leadership development,
similar to what Dugan and Komives (2007) found. Although the predictors were not able to
significantly explain the increase in the overall leadership development (overall SRLS score) for
students involved in one organization, there were still signs that the relationship between the
predictors and leadership development was positive. In other words, being involved in at least
one organization is more likely to lead to overall leadership development. Therefore, student
affairs professionals should continue to encourage college students to be involved in at least one
student organization as a way to develop leadership values. With this said, the current study did
not include college students who were not involved in any student organizations. This “control
group” would have provided a “baseline” to which the EII and SRLS scores for participants
involved in one organization could be compared. Therefore, the previous recommendations are
based more on previous research (Dugan & Komives, 2007; Gerhardt, 2008) than on results from
this study.
Page 132
111
Second, the results imply that there is a point in the overall range of college students’
intensity of involvement, the EII score (EII), that represents the level of involvement at which an
increase in leadership development is less likely to occur as the intensity of involvement
increases. This point is usually known as the tipping point; in the case of the current study, an
EII of 222 represented the tipping point. College students are able to reach the intensity of
involvement’s tipping point through different involvement scenarios, such as being highly
involved in two organizations or being moderately involved in four organizations. Students who
are involved in more than one student organization are more likely to reach the EII tipping point
since all of the participants whose EII was higher than the tipping point were involved in more
than one organization.
Previous research supports the idea that being involved in more organizations leads to
greater development of leadership values (Gerhardt, 2008); however, Gerhardt’s (2008) study
did not consider the effort college students put towards those organizations, or the quality of the
involvement. Although the current study did not have the exact same variables that Gerhardt
(2008) used, the current study’s correlation between the number of organizations in which
college students were involved and leadership development was not significant; this was
different from Gerhardt’s (2008) results. Therefore, the likelihood is slim that only the number
of organizations in which students are involved has a significant influence on the students’
leadership development. Including intensity of involvement in student organizations in research
studies focused on the outcomes of being involved in student organizations provides more
realistic results regarding the relationship between a college students’ involvement in student
organization and the students’ leadership development. Knowing these results allows student
affair professionals to focus more on a student’s intensity of involvement in student
Page 133
112
organizations, not just the number of student organizations, and how the intensity may be
influencing the student’s leadership development. In turn, this knowledge may alter how student
affairs professionals talk to students about their involvement in student organizations as well as
other aspects of their lives (i.e., academic performance, healthy behaviors).
Since college students’ involvement in multiple organizations was the commonality
among participants whose EII was higher than the “tipping point”, student affairs professionals
may want to focus more on the college students who are involved in more than one organization
to ensure these students’ leadership values are continuing to develop and are not remaining the
same or decreasing. The results indicate students involved in one student organization are not
likely to reach the “tipping point”; the development of their leadership values is continuing.
Knowing a college student’s EII in a specific student organizations provides details that student
affairs professionals can use when talking with the student. If a student has an EII lower than
150, but has the desire to develop their leadership values, a student affairs professional can use
the information about the student’s current quality level to provide suggestions on how to
increase the student’s quality of involvement. For example, a student affairs professional could
suggest the student volunteer for events or projects and attend more activities sponsored by the
student organization. Additionally, the student affairs professional could ask the student to
represent the student organization at an event. If a student has a higher EII, close to or over the
tipping point of 222, student affairs staff members can use the EII as support to encourage the
student to decrease their level of involvement by either reducing responsibilities or eliminating
an organization.
The results show that an ideal way to use the EII is on an individual basis. For example,
students involved in two student organizations are just as capable of surpassing the EII tipping
Page 134
113
point as a student involved in six student organizations; while college students involved in three
or more organizations are just as capable to have an EII well below the tipping point. Therefore,
the EII is best used with each individual college student rather than providing examples of
student involvement (number of organizations and hours involved and quality of effort) to
groups of students and having each student estimate their own intensity of involvement. Using
the EII in this way allows student affairs professionals the chance to discuss the student’s reasons
for the intensity level of involvement in student organizations as well as the potential outcomes
as a result of the involvement. Furthermore, the student has the opportunity to analyze the
reasons and outcomes hoped for and determine if his/her current level of involvement is
reasonable and productive. The student affairs professional could facilitate a similar activity
with a group of students, but the activity may not be as effective if it was completed in an
individual meeting with each student.
The Social Change Model consists of seven values related to leadership (table 37). These
values focus on either the student (individual component), student organization (group
component), or the institution (society component). Although the values and components are
separate, development in one value or component is likely to lead to development in the
remaining values and components. When the data were analyzed at the Component level of the
Social Change Model (Individual, Group, and Society), the results highlighted that the predictors
were not able to explain the changes in the Individual component that includes the
Consciousness of Self, Congruence, and Commitment values. When the data were analyzed at
the individual value level, the predictors explained the change only in the Commitment value of
the Individual component. Since Commitment focuses on the amount of effort a student puts
towards a group/student organization, these results are not surprising because the Collaboration
Page 135
114
and Common Purpose values, both in the group component, had similar results. Although the
predictors were not able to explain the change in the Consciousness of Self and Congruence
values, the results did indicate a positive relationship with the EII. The Consciousness of Self
value represents the level of awareness a student has regarding their personal beliefs, values,
attitudes, and emotions and how the awareness encourages the student to act on them (HERI,
1996). The Congruence value relates to the Consciousness of Self value because Congruence
highlights how well a student’s actions, thoughts, and feelings represent the student’s beliefs,
values, attitudes, and emotions (HERI, 1996). From these results, student affairs professionals
need to offer additional opportunities, beyond being involved in the student organization, to
develop the Consciousness of Self and Congruence values.
Student affairs professionals can assist in college students’ development of these values
in several ways. One way is to administer self-assessment instruments such as the Myers-Briggs
Typology Inventory to the students and review the results with them. This provides students the
opportunity to learn more about themselves, which leads to increasing the students’
Consciousness of Self value. Another way practitioners can assist in the development of the
Consciousness of Self value is through activities that require the students to think about and
make more conscious their beliefs, values, attitudes, and emotions; for example, creating a
personal creed or participating in a values auction that helps students connect their beliefs and
values to actions, and as a result, will likely have a better understanding of them. These
activities can be facilitated throughout the academic year, whenever staff, or a student, notices
that students are struggling with knowing who they are or what they believe. Having a strong
Congruence value would be beneficial in increasing the Consciousness of Self value.
Page 136
115
In order to increase the Congruence value, students need to be aware of their actions
and/or thoughts and how these connect with the students’ own beliefs, values, attitudes, and
emotions. Student affairs professionals can assist in the development of students’ Congruence
value by offering feedback regarding actions and comments that may contradict the students’
beliefs and values. This feedback may be seen as a reality check for the students regarding the
lack of connection, or level of connection, between actions, thoughts, beliefs, and values. If the
connection is weak, then the student’s Congruence value is likely low and the student needs to
determine how to improve the connection, which will lead to an increase in the student’s
Congruence value. Another way to help students become aware of their level of congruence is
by facilitating a value-laden scenario (e.g., shipwreck or survival exercise) in which a valid
argument can be made in support of each option. Throughout the activity, students must decide
how each will solve the problem (getting off the island or who are the people to save) and
provide their explanations. These decisions and explanations give students the opportunity to
connect their thoughts and actions to their own beliefs and values.
The nine predictors were able to significantly explain the variance in the Group
component of the Social Change Model, but not the variance in the Controversy with Civility
value. Even though involvement in student organizations leads to an increase in the Controversy
with Civility value (Gerhardt, 2008), the result’s from this study indicated that the intensity of
involvement was not able to substantially explain the variance in the value. In order to assist in
the development of this value in college students, student affairs professionals can use similar
activities that were suggested for developing Congruence, as well as problem-based case studies
related to college student leaders (Marshall & Hornak, 2008). Once each student has completed
the activity individually, the group then determines one “answer” to the exercise. In these group
Page 137
116
activities, establishing ground rules regarding behaviors is crucial. The ground rules provide a
level playing field for providing feedback and receiving feedback. The rules can also focus on
creating an environment that is open to all suggestions and encourages a win-win mentality.
Another suggestion for increasing the Controversy with Civility value is using the Restorative
Justice concept in group sessions. Restorative Justice focuses on ways to restore harm caused by
a crime (Centre for Justice and Reconciliation, 2014). The people involved meet and determine
how to repair the damage done to the community. Even though it may not be an actual crime
committed in a student organization, this concept can be used when students need to reach an
agreement for a situation. Since Restorative Justice centers on a win-win result, this concept can
be beneficial in developing the Controversy with Civility value in college students.
The survey was administered during an on-campus housing student conference. This
allowed me to collect the amount of data that I did (243 initial participants). From my previous
experience in advising on-campus housing student organizations, I am aware that the amount of
hours spent roughly four weeks before the conference working with RHAs is typically larger
than the amount spent during weeks following the conference. Therefore, the EII for the
housing-related organization is likely to be skewed higher than normal. From this information, I
suggest that student affairs professionals administer the EII multiple times during the year. If it
is administered as a pre-test and post-test (4 weeks into each semester or quarter), student affairs
professionals can compare the EIIs and observe any changes from the pre-test to the post-test.
These changes, if any, provide information about the students’ quantity and quality of
involvement in student organizations and the development of their leadership values. This, in
turn, allows the student affairs professionals to have intentional conversations with students
Page 138
117
regarding organizational involvement, encouraging more or less involvement, depending on the
results of the EII and SRLS.
Although the study may not have looked at the relationship between the quantity and
quality of involvement in student organizations, the results from the study support the idea that
the relationship between these two aspects of involvement is directly proportional. If a college
student is actively involved in an organization (e.g., holding a position, attending activities,
fulfilling responsibilities), the likelihood the student is spending a lot of time in an organization
is high. Furthermore, if a student’s quality of involvement is low, it is likely that the amount of
time spent in the organization will also be low since the student is not necessarily attending
activities or fulfilling responsibilities. When a student affairs professional is aware that a college
student is either spending a large amount of time in an organization or responsible for several
duties for the organization, the professional can infer the student’s EII is high and possibly close
to the tipping point. This may lead to administering the EII to the student in order to identify the
student’s actual intensity of involvement in not only that one organization but also any other
organization in which the student is involved. The results from the EII can lead to a discussion
the professional has with the student regarding his/her involvement in student organizations,
hopefully leading to the student deciding how to manage the involvement, which may mean
decreasing the number of organizations. As a result of taking action, the student’s development
of leadership values is more likely to increase and not remain static.
The current study was developed with the student affairs professional in mind, especially
those working with on-campus housing organizations, and providing empirical support for
Astin’s (1984) question about a point where an increase in involvement no longer leads to
positive results in the student’s development. The implications shared provide ways that student
Page 139
118
affairs practitioners can incorporate the interpretations of these results into their daily work with
college students.
Implications for Researchers
Literature based on involvement in student organizations rarely discusses the possible
outcomes for college students who are involved in more than one organization (Fitch, 1991;
Gerhardt, 2008; Logue, Hutchens, & Hector, 2005). Student affairs practitioners are aware,
anecdotally, that there is a limit to the benefit of being involved in multiple organizations.
However, there is limited research that supports this assumption (Dugan & Komives, 2007;
Fitch, 1991). The current study furthers the literature related to involvement in multiple student
organizations and outcomes related to leadership development. The study’s results suggest that
researchers need to develop studies focused on the influence involvement in multiple student
organizations has on college students’ development in a variety of areas, e.g., moral
development, psychosocial development, overall college experience. Since approximately one-
third of college students are involved in “many” student organizations (Dugan & Komives,
2007), additional research focused on the influence of involvement in multiple student
organizations on students’ development is recommended. As a result, researchers and student
affairs professionals will learn more about the relationship between a student’s intensity of
involvement and his/her development in a certain area, i.e., leadership.
The results from the study also support the inclusion of the EII in studies related to
involvement in student organizations. The EII provides data related to the quantity of a college
student’s involvement as well as the quality of the involvement. The results show that including
these two parts of a college student’s involvement provides a more accurate view of the
relationship between involvement and student development, specifically in leadership values.
Page 140
119
Additionally, a student’s leadership development has a stronger and substantial connection with
the EII score when compared to its connection with the number of organizations in which the
student is involved. Studies that continue to use only the number of organizations in which a
student is involved as the independent variable are not providing realistic results regarding
college students’ development. I am not suggesting that the number of organizations should be
removed from analyses, but encouraging the inclusion of the EII in future research on college
students’ involvement in student organizations and its relationship with college students’
development in other areas such as cognitive, moral, or psychosocial. This study did not look at
these areas of college student development, however the results provide support to study these
different relationships.
The current study’s participants were involved in at least one on-campus housing
organization that is seen as the governing body for the students living on campus. Additionally,
roughly 80% of the participants were involved in more than one organization. Therefore, the
current study’s results include participants’ intensity of involvement in non on-campus housing
organizations. Researchers can use these results to inform future studies on the outcomes from
being involved in similar organizations such as the campus-wide student government or the
social Greek community’s governing bodies. Furthermore, researchers could incorporate the
intensity of involvement in studies that look at academic and non-academic related organizations
in order to determine if there are differences between these two types of organizations.
Ultimately, including intensity of involvement in student organizations in future studies on
student organization involvement will provide additional information to assist student affairs
professionals in their interactions with college students and advising student organizations.
Page 141
120
Recommendations for Future Research
This is the first study that examined the relationship between the intensity of involvement
in multiple student organizations and leadership development. Furthermore, it is the first to
determine if there is a point in the intensity of involvement in student organizations where an
increase in the intensity is less likely to result in an increase in a student’s development,
especially leadership development. The results from the current study not only support my
assumption regarding a limit to the benefits of involvement in student organizations as it relates
to leadership development, but the results open the door to future research related to the topic.
The current study focused on the relationship between the intensity of involvement in
student organizations and leadership development for the entire sample and when the sample was
divided between participants involved in one organization and those involved in multiple
organizations. Additional analyses of these data could entail dividing the data by varying
independent variables such as gender, year in college, type of RHA position, or years in RHA.
The results from these analyses could provide further information regarding the relationship
between the intensity of involvement and leadership as well as determining a “tipping point” for
a particular demographic, i.e., females, sophomores, or RHA presidents.
The participants for this study were from a variety of colleges and universities from
Indiana, Illinois, Michigan, Wisconsin, and Ontario, Canada. Additional research with the same
instrument could be conducted at a single institution with students in a variety of organizations
(i.e., no involvement to involvement in six organizations) to determine the experiences of that
institution’s college students. The results from this study would provide professional staff
information about their students’ experiences and allow the staff to develop interventions or
support systems to assist in their students’ development, leadership and otherwise. Another
Page 142
121
recommendation is to focus on collecting data from more than 100 students involved in one
organization or none. There was only a small number of participants in the group involved in
only one organization; therefore, the results were less likely to represent the population.
Although all of my participants were involved in at least one organization, a recommendation
can be made to administer the instrument to students not involved in any organization to serve as
a control group, ensuring there are more than 100 students who meet that requirement.
Since this survey was administered at an annual conference that is held around the same
time each year, I recommend researchers using this survey to administer the instrument at
another time of the year. Doing so would provide information about students’ involvement level
at varying times in the academic calendar. For example, a researcher could begin administering
the survey instrument via the internet during October to a variety of institutions, either state-,
region-, or nation-wide. Although students would be able to complete the survey during the
same timeframe in October, that time period would fall at different points in the students’
academic terms. Therefore, the “busyness” of the participants would fluctuate and potentially
lead to typical levels of intensity in their student organization involvement.
The Involvement Indexes (INIXs) that make up the EII score ask students to share if they
hold a position and which type. Further research on how holding a position in the organization
or not, the number of positions held, or the type of position held influences the relationship
between intensity of involvement and leadership development is recommended. The data could
be split between holding and not holding a position, the different positions, or the number of
positions held, or to determine if there is a notable difference in the leadership development. The
data could also be sorted by the type of organization, or extracurricular activity, to see if
Page 143
122
involvement in one type of organization leads to higher leadership development (overall SRLS
score) than another type of organization, or determine there is no difference.
This research focused on the maximum level of the intensity of involvement in student
organizations and college students’ development of leadership values. Literature supports the
idea that involvement in at least one organization leads to development of these values (Dugan,
2006b; Dugan & Komives, 2007). The results from this study highlight that students involved in
the same number of organizations can have different EII scores as well as development of their
leadership values. Therefore, I recommend that future research looks at the concept of a
minimum level of intensity of involvement in student organizations at which point an increase in
leadership values is likely to occur. This research would provide administrators support for
encouraging students to become involved a student organization at a certain level.
The data collected for the study was done at one point in the participants’ college
experience. This led to not truly measuring the participants’ development of leadership values,
but more what was their current “score” for each value. In order to assess the development of
the SCM leadership values, administering the instrument as part of a longitudinal study is
recommended. The pre- and post-tests can be varied between years in college (e.g., end of first
year and end of second year) or between semesters (e.g., beginning of the fall semester and end
of spring semester). This research would provide further support for the idea of a “tipping point”
between a college student’s intensity of involvement and leadership development.
Finally, I recommend further research look at the relationship between the intensity of
involvement and other types of development (e.g., psychosocial, academic development,
cognitive, moral). Related studies focus on college student psychosocial development and the
influence involvement in student organizations has on that development (Cooper et al., 1994;
Page 144
123
Foubert & Grainger, 2006). However, in both of these studies the researchers compared the
psychosocial development of first year students with either juniors or seniors. Imagine what
could be learned if a study similar to Cooper et al., (1994) or Foubert and Grainger (2006) was
done comparing the relationship between the EII and psychosocial development and then
splitting the data by class level. Furthermore, future research looking at how the intensity of
involvement in student organization influences college students’ persistence and time to degree
would provide additional evidence to support Astin’s Student Involvement Theory (1984; 1994).
Conclusion
Leadership development can be found in a variety of activities and environments on a
college campus and faculty and staff can assist in that development. However, during the past 30
years, college administrators and faculty have relied on student affairs professionals to provide
most of the leadership development initiatives for college students through student organizations
(McIntire, 1989). Research has shown that being involved in student organizations leads to
students developing skills required for future careers, persisting to graduation, and improving
leadership values (Astin, 1993; Dugan, 2006b). With that said, many student affairs
professionals wonder if there is a point at which the level of involvement in student
organizations no longer is of benefit. The results from the current confirm there is a significant
positive relationship between a college student’s intensity of involvement and leadership
development. More importantly, the results identified a point in the intensity of involvement at
which an increase in leadership development is less likely to occur. Further research in this area
will continue to provide crucial information on the outcomes of being involved in multiple
student organizations.
Page 146
125
Appendix A
Figure 2 Approval to use Extracurricular Involvement Inventory
Page 147
126
Appendix B
Figure 3 Approval to use Socially Responsible Leadership Scale, Revision 2
Page 148
127
Appendix C
Involvement Index (Extracurricular Involvement Inventory)
Please indicate: (1) the type of organizations it is, (2) the approximate number of hours you have
been involved (for example, attending meetings, working on projects, or playing games) with
this group or organization in the last four weeks, and (3) leadership position held, if any. Then,
answer questions 1 through 5 below.
What type of organization is it? (Check one.)
( ) Social Fraternity/Sorority ( ) Intercollegiate Athletic Team
( ) Religious ( ) Academic (academic department or major related)
Club or Society
( ) Academic Honorary ( ) Programming (e.g., Student Center/Union, lecture or
concert committee)
( ) Intramural Sports Team ( ) Student Publication (e.g., newspaper, magazine, or
yearbook)
( ) Service or Philanthropic ( ) Performing Group (e.g., choir, drama production,
debate team)
( ) Governance (hall council, RHA) ( ) Governance (student government, student judiciary)
( ) Other (Please Specify): ___________________________________
In the last four weeks, for approximately how many hours have you been involved with this
group or organization and its activities or programs? _________________Hours
In the last four weeks, have you held an office in this organization or a position equivalent to
one of the following offices? (Check one.)
( ) President/Chairperson/Team ( ) Treasurer
Captain/Editor
( ) Vice-President/Vice Chairperson ( ) Committee/Task Force/Project Chairperson
( ) Secretary ( ) I held no office or leadership position.
( ) Other Office, Please specify: _____________________________
Please respond to the following statements about your involvement in the above student
organization or group. Check the one best response for each statement.
1. When I attended meetings, I expressed my opinion and/or took part in the discussions.
( ) Very Often ( ) Often ( ) Occasionally ( ) Never
( ) I attended no meetings in the past four weeks.
( ) The group/organization held no meetings in the past four weeks.
Page 149
128
2. When I was away from members of the group/organization, I talked with others about the
organization and its activities, or wore a pin, jersey, etc. to let others know about my
membership.
( ) Very Often ( ) Often ( ) Occasionally ( ) Never
3. When the group/organization sponsored a program or activity, I made an effort to encourage
other students and/or members to attend.
( ) Very Often ( ) Often ( ) Occasionally ( ) Never
( ) The organization had no programs or activity during the past four weeks.
4. I volunteered or was assigned responsibility to work on something that the group/organization
needed to have done.
( ) Very Often ( ) Often ( ) Occasionally ( ) Never
5. I fulfilled my assigned duties or responsibilities to the group/organization on time.
( ) Very Often ( ) Often ( ) Occasionally ( ) Never
( ) I had no duties or responsibilities except to attend meetings.
Please continue until you have completed an Involvement Index for every student group or
organization in which you have been involved in the last four weeks.
Winston, R. B., & Massaro, A. V. (1987). Extracurricular involvement inventory: An instrument
for assessing intensity of student involvement. Journal of College Student Personnel, 28(2), 169-
175.
Page 150
129
Appendix D
The SRLS Scale
The reliability testing for this instrument was conducted with the questions in the order provided
below. Changing the order of the questions could result in an “order effect” which would need to
be accounted for in the study.
Note: A negative sign (-) in front of a question number indicates a negative response question.
Scores for these items should be reversed BEFORE running any statistical analysis.
The following scale should be provided along with each question:
1 = Strongly Disagree
2 = Disagree
3 = Neither Agree nor Disagree
4 = Agree
5 = Strongly Agree
Table 40 SRLS Items Sorted in Order
1 I am open to others’ ideas Controversy with Civility
2 Creativity can come from conflict Controversy with Civility
3 I value differences in others Controversy with Civility
4 I am able to articulate my priorities Consciousness of Self
5 Hearing differences in opinions enriches my thinking Controversy with Civility
-6 I have a low self esteem Consciousness of Self
-7 I struggle when group members have ideas that are
different from mine
Controversy with Civility
-8 Transition makes me uncomfortable Change
9 I am usually self confident Consciousness of Self
10 I am seen as someone who works well with others Collaboration
11 Greater harmony can come out of disagreement Controversy with Civility
12 I am comfortable initiating new ways of looking at things Change
13 My behaviors are congruent with my beliefs Congruence
14 I am committed to a collective purpose in those groups to
which I belong
Common Purpose
15 It is important to develop a common direction in a group
in order to get anything done
Common Purpose
16 I respect opinions other than my own Controversy with Civility
17 Change brings new life to an organization Change
18 The things about which I feel passionate have priority in
my life
Consciousness of Self
19 I contribute to the goals of the group Common Purpose
20 There is energy in doing something a new way Change
-21 I am uncomfortable when someone disagrees with me Controversy with Civility
22 I know myself pretty well Consciousness of Self
Page 151
130
Table 40 (cont’d)
23 I am willing to devote time and energy to things that are
important to me
Commitment
24 I stick with others through the difficult times Commitment
-25 When there is a conflict between two people, one will win
and the other will lose
Controversy with Civility
-26 Change makes me uncomfortable Change
27 It is important to me to act on my beliefs Congruence
28 I am focused on my responsibilities Commitment
29 I can make a difference when I work with others on a task Collaboration
30 I actively listen to what others have to say Collaboration
31 I think it is important to know other people’s priorities Common Purpose
32 My actions are consistent with my values Congruence
33 I believe I have responsibilities to my community Citizenship
34 I could describe my personality Consciousness of Self
35 I have helped to shape the mission of the group Common Purpose
-36 New ways of doing things frustrate me Change
37 Common values drive an organization Common Purpose
38 I give time to making a difference for someone else Citizenship
39 I work well in changing environments Change
40 I work with others to make my communities better places Citizenship
41 I can describe how I am similar to other people Consciousness of Self
42 I enjoy working with others toward common goals Collaboration
43 I am open to new ideas Change
44 I have the power to make a difference in my community Citizenship
45 I look for new ways to do something Change
46 I am willing to act for the rights of others Citizenship
47 I participate in activities that contribute to the common
good
Citizenship
48 Others would describe me as a cooperative group member Collaboration
49 I am comfortable with conflict Controversy with Civility
50 I can identify the differences between positive and
negative change
Change
51 I can be counted on to do my part Commitment
52 Being seen as a person of integrity is important to me Congruence
53 I follow through on my promises Commitment
54 I hold myself accountable for responsibilities I agree to Commitment
55 I believe I have a civic responsibility to the greater public Citizenship
-56 Self-reflection is difficult for me Consciousness of Self
57 Collaboration produces better results Collaboration
58 I know the purpose of the groups to which I belong Common Purpose
59 I am comfortable expressing myself Consciousness of Self
Page 152
131
Table 40 (cont’d)
60 My contributions are recognized by others in the groups I
belong to
Collaboration
61 I work well when I know the collective values of a group Common Purpose
62 I share my ideas with others Controversy with Civility
63 My behaviors reflect my beliefs Congruence
64 I am genuine Congruence
65 I am able to trust the people with whom I work Collaboration
66 I value opportunities that allow me to contribute to my
community
Citizenship
67 I support what the group is trying to accomplish Common Purpose
68 It is easy for me to be truthful Congruence
National Clearinghouse for Leadership Programs. (n.d.). Socially responsible leadership scale
revised version 2: Using the SRLS-R2 for research and assessment. College Park, MD:
University of Maryland College Park.
Page 153
132
Appendix E
SRLS Constructs and the Individual Items
Table 41 Correlations between the sum of the scores for each construct and the individual items
Consciousness of
Self
Congruence Commitment Collaboration
Item r Item r Item r Item r
6 .5856* 13 .5807* 23 .4369* 8 .4452*
7 .5923* 21 .5043* 26 .5346* 20 .6021*
12 .7236* 28 .6176* 30 .5987* 49 .5574*
17 .4556* 47 .5242* 35 .6013* 50 .5682*
18 .6804* 53 .6895* 38 .6980* 52 .5956*
34 .4447* 58 .6958* 43 .6544* 55 .4213*
41 .3635* 68 .5470* 44 .5453* 59 .5829*
42 .5923* 79 .4763* 48 .6876* 67 .6889*
55 .6711* 83 .4235* 74 .3635* 84 .5660*
66 .6030* 88 .5622* 78 .6769* 87 .5881*
89 .4948* 97 .7484* 81 .6946* 93 .5259*
92 .6922* 98 .6108* 82 .7058* 99 .5414*
105 .5399* 100 .6539* 102 .0100
96 .2718*
Common Purpose Controversy with
Civility
Citizenship Change
Item r Item r Item r Item r
3 .5666* 1 .4671* 5 .5891* 16 .5624*
9 .5717* 2 .4650* 11 .7326* 22 .3741*
29 .6667* 4 .5317* 15 .6990* 25 .5548*
31 .5871* 10 .5544* 19 .7270* 33 .5088*
36 .6736* 14 .4421* 27 .5076* 37 .5373*
40 .5638* 24 .4412* 54 .7548* 46 .6767*
51 .5482* 32 .4946* 61 .6842* 57 .5740*
56 .6390* 39 .4355* 63 .6247* 62 .7026*
60 .5192* 45 .3749* 65 .7636* 69 .5989*
64 .2839* 76 .5598* 70 .7088* 71 .5813*
91 .6701* 80 .4663* 72 .6702* 77 .4503*
94 .7066* 89 .3822* 73 .7650* 90 .4779*
103 .6181* 95 .5267* 85 .7224*
101 .7701*
*p ≤ .01
(NCLP, n.d.)
Page 154
133
APPENDIX F
Demographic Questions from Survey Instrument
* Questions required to use SRLS-R2
What year are you in college?
Options: 1st, 2nd, 3rd, 4th, 5th, 6th or more
*What is your current class level?
Options: First year/freshman, Sophomore, Junior, Senior, Graduate Student, other
Please identify your current field of study, or your major. (Check all that apply).
Agriculture
Biological/life sciences (biology, biochemistry, botany, zoology, etc.)
Business (accounting, business administration, marketing, management, etc.)
Communication (speech, journalism, television/radio, etc.)
Computer and information sciences
Education
Engineering
Ethnic, cultural studies, and area studies
Foreign languages and literature (French, Spanish, etc.)
Health-related fields (nursing, physical therapy, health technology, etc.)
History
Humanities (English, literature, philosophy, religion, etc.)
Liberal/general studies
Mathematics
Multi/interdisciplinary studies (international relations, ecology, environmental studies, etc.)
Parks, recreation, leisure studies, sports management
Physical sciences (physics, chemistry, astronomy, earth sciences, etc.)
Pre-professional (pre-dental, pre-medical, pre-veterinary)
Public administration (city management, law enforcement, etc.)
Social sciences (anthropology, economics, political science, psychology, sociology, etc.)
Visual and performing arts (art, music, theater, etc.)
Undecided
Other
*What is your best estimate of your grades as far in college? (Assume 4.00 = A).
Options: 3.50-4.00; 3.00-3.49; 2.50-2.99; 2.00-2.49; 1.99 or less; No college GPA
*What is your age? (open answer)
*What is your gender? (Check all that apply)
Options: Male; Female; Transgender
Page 155
134
*What is your sexual orientation? (Mark all that apply)
Options: Heterosexual; Bisexual; Bay/Lesbian; Rather not say
*Please indicate your ethnic background. (Mark all that apply)
Options: White/Caucasian; African American/Black; Asian American/Asian; Native
Hawaiian/Pacific Islander; Latino/Latina; Multiracial; Race/ethnicity not included
above
Are you considered an international student?
Options: Yes; No
Describe your institution
Options: 2-year institution; 4-year institution; Public; Private
In what state/province is your institution?
Options: Indiana; Illinois; Michigan; Ontario; Wisconsin; Other
Describe your institution enrollment and on-campus housing population size.
Institution enrollment options: 1,000-2,999; 3,000-9,999; 10,000-19,999; > 19,999
On-campus housing population options: < 1,000; 1,000-2,999; 3,000-4,999; 5,000-9,999;
> 9,999
How many years have you been involved with your hall government and/or RHA?
Options: 1, 2, 3, 4, 5, 6 or more
What position do you hold in your hall government or RHA?
Options: No position-general member; Area/Hall Representative to RHA; Hall Government
President; Hall Government Vice President; Hall Government Secretary; Hall
Government Treasurer; Hall Government other (please specify); RHA President;
RHA Vice President; RHA Secretary; RHA Treasurer; NCC; RHA other (please
specify)
How many registered student organizations are you currently involved in? (RHA and hall
government count as one.)
Options: 1; 2; 3; 4; 5; 6
Page 156
135
APPENDIX G
Consent Form
Research Participant Information and Consent Form
You are being asked to participate in a research study looking at the relationship between the
intensity of involvement in multiple registered student organizations and leadership
development. In order to participate in the study, you must be an undergraduate student who is
involved in either a residence hall government or residence hall association, or both.
Involvement in additional registered student organizations is preferred, but not required. You
must be at least 18 years old to participate in this research. You will need to complete the three
sections of the following survey, which will take you about 10 minutes.
Participation in this research project is completely voluntary. We do not anticipate any risks to
you participating in this study other than those encountered in day-to-day life. You have the right
to say no. You may change your mind at any time and withdraw. You may choose not to
answer specific questions or to stop participating at any time. If you decide not to take part or to
skip some of the questions, it will not affect your current or future relationship with the Great
Lakes Affiliate of College and University Residence Halls (GLACURH) or with Michigan State
University.
There is no cost to the participant to be part of this research project. Participants who complete
the survey will have the choice to opt-in to a drawing for 5 $20 Amazon.com gift cards at the end
of the survey. Participants who complete the survey during the annual GLACURH conference
will receive a coupon to a well-known chain restaurant, i.e., McDonald’s, Dunkin’ Donuts, or
Coldstone Creamery.
The researcher conducting this study is Sheila Coressel. If you have questions later, you may
contact Sheila Coressel at [email protected] or at 419-494-4558. If you have any questions or
concerns regarding your rights as a subject in this study, you may contact Dr. Marilyn Amey,
professor, at [email protected] or at 517- 432-1056.
If you have questions or concerns about your role and rights as a research participant, would like
to obtain information or offer input, or would like to register a complaint about this study, you
may contact, anonymously if you wish, the Michigan State University’s Human Research
Protection Program at 5173552180, Fax 5174324503, or email [email protected] or regular mail
at 207 Olds Hall, MSU, East Lansing, MI 48824.
By clicking on the “Accept” button below, you indicate your voluntary agreement to
participate in this online survey.
Page 157
136
APPENDIX H
Multiple Regression Results for SCM Values and Components
Consciousness of Self value Regression
Table 42 Correlations with Regression Predictors (Consciousness of Self)
Predictor Pearson Correlation Significance (1-tailed)
EII .240 .001**
Gender -.021 .388
Sexual Orientation -.010 .447
Ethnicity .067 .182
RHA Position -.019 .398
GPA .047 .264
Class Level .106 .077
Number of RHA Years .066 .187
Institution Enrollment .061 .206
**. Correlations significant at .01 (1-tailed)
Table 43 Regression Model Summary with the EII Score (Consciousness of Self)
R R Squared Adjusted R Square Std. Error of the Estimate
.267 .071 .023 .469
Table 44 ANOVA with the EII Score (Consciousness of Self)
Model Sum of Squares df Mean Square F Sig.
Regression
Residual
Total
2.939
38.260
41.199
9
174
183
.327
.220
1.485 .157n
Page 158
137
Table 45 Coefficients with the EII Score (Consciousness of Self)
Model
Unstandardized
Coefficients
Standardized
Coefficients t Sig.
B Std. Error Beta
(Constant)
EII
Gender
S. Orientation
Ethnicity
RHA Position
GPA
Class Level
RHA Years
Institution
3.765
.002
-.034
.038
.096
-.005
.005
.054
-.037
.016
.228
.001
.076
.089
.095
.084
.043
.050
.055
.036
.232
-.034
.034
.077
-.005
.009
.119
-.075
.033
16.511
3.024
-.444
.427
1.014
-.062
.115
1.092
-.682
.441
.000
.003**
.6567
.670
.312
.951
.909
.277
.496
.660
**. p < .01 level
Congruence value Regression
Table 46 Correlations with Regression Predictors (Congruence)
Predictor Pearson Correlation Significance (1-tailed)
EII .248 .000**
Gender -.064 .194
Sexual Orientation -.003 .481
Ethnicity -.054 .235
RHA Position .016 .415
GPA .045 .271
Class Level .015 .421
Number of RHA Years .070 .171
Institution Enrollment .052 .240
**. Correlations significant at .01 (1-tailed)
Table 47 Regression Model Summary with the EII Score (Congruence)
R R Squared Adjusted R Square Std. Error of the Estimate
.272 .074 .026 .463
Table 48 ANOVA with the EII Score (Congruence)
Model Sum of Squares df Mean Square F Sig.
Regression
Residual
Total
2.968
37.230
40.197
9
174
183
.330
.214
1.541 .137
Page 159
138
Table 49 Coefficients with the EII Score (Congruence)
Model
Unstandardized
Coefficients
Standardized
Coefficients t Sig.
B Std. Error Beta
(Constant)
EII
Gender
S. Orientation
Ethnicity
RHA Position
GPA
Class Level
RHA Years
Institution
4.319
.002
-.058
.056
-.065
.013
-.013
-.039
.044
.012
.225
.001
.075
.088
.093
.082
.042
.049
.054
.035
.249
-.060
.050
-.053
.012
-.025
-.086
.090
.026
19.201
3.255
-.775
.632
-.693
.158
-.317
-.796
.822
.344
.000
.001**
.440
.528
.489
.875
.752
.427
.412
.731
**. p < .01 level
Commitment value Regression
Table 50 Correlations with Regression Predictors (Commitment)
Predictor Pearson Correlation Significance (1-tailed)
EII .267 .000**
Gender -.011 .440
Sexual Orientation -.041 .290
Ethnicity -.076 .154
RHA Position -.072 .167
GPA -.022 .383
Class Level -.052 .241
Number of RHA Years .004 .476
Institution Enrollment -.039 .300
**. Correlations significant at .01 (1-tailed)
Table 51 Regression Model Summary with the EII Score (Commitment)
R R Squared Adjusted R Square Std. Error of the Estimate
.328 .108 .062 .394
Table 52 ANOVA with the EII Score (Commitment)
Model Sum of Squares df Mean Square F Sig.
Regression
Residual
Total
3.259
26.987
30.246
9
174
183
.362
.155
2.335 .017*
*. p < .05 level
Page 160
139
Table 53 Coefficients with the EII Score (Commitment)
Model
Unstandardized
Coefficients
Standardized
Coefficients t Sig.
B Std. Error Beta
(Constant)
EII
Gender
S. Orientation
Ethnicity
RHA Position
GPA
Class Level
RHA Years
Institution
4.752
.002
.012
-.029
-.105
-.078
-.045
-.059
.024
-.023
.192
.000
.064
.075
.080
.070
.036
.042
.046
.030
.303
.014
-.030
-.099
-.081
-.096
-.151
.057
-.056
24.814
4.029
.191
-.390
-1.325
-1.117
-1.242
-1.416
.528
-.762
.000
.000**
.849
.697
.187
.265
.216
.159
.598
.447
**. p < .01 level
Self Values Component Regression
Table 54 Correlations with Regression Predictors (Self Component)
Predictor Pearson Correlation Significance (1-tailed)
EII .294 .000**
Gender -.039 .301
Sexual Orientation -020 .394
Ethnicity -.021 .390
RHA Position -.027 .359
GPA .030 .344
Class Level .031 .337
Number of RHA Years .057 .220
Institution Enrollment .033 .330
**. Correlations significant at .01 (1-tailed)
Table 55 Regression Model Summary with the EII Score (Self Component)
R R Squared Adjusted R Square Std. Error of the Estimate
.301 .091 .043 .376
Table 56 ANOVA with the EII Score (Self Component)
Model Sum of Squares df Mean Square F Sig.
Regression
Residual
Total
2.445
24.567
27.012
9
174
183
.272
.141
1.924 .051
Page 161
140
Table 57 Coefficients with the EII Score (Self Component)
Model
Unstandardized
Coefficients
Standardized
Coefficients t Sig.
B Std. Error Beta
(Constant)
EII
Gender
S. Orientation
Ethnicity
RHA Position
GPA
Class Level
RHA Years
Institution
4.279
.002
-.027
.022
-.025
-.024
-.018
-.015
.010
.002
.183
.000
.061
.072
.076
.067
.034
.040
.044
.029
.304
-.033
.023
-.024
-.026
-.040
-.039
.026
.004
23.416
4.001
-.436
.301
-.326
-.351
-.516
-.367
.238
.058
.000
.000**
.663
.764
.745
.726
.606
.714
.812
.954
**. p < .01 level
Collaboration value Regression
Table 58 Correlations with Regression Predictors (Collaboration)
Predictor Pearson Correlation Significance (1-tailed)
EII .328 .000**
Gender -.019 .399
Sexual Orientation -.075 .155
Ethnicity -.038 .306
RHA Position -.089 .115
GPA .152 .020*
Class Level .006 .466
Number of RHA Years .013 .433
Institution Enrollment .075 .155
*. Correlations significant at .05 (1-tailed)
**. Correlations significant at .01 (1-tailed)
Table 59 Regression Model Summary with the EII Score (Collaboration)
R R Squared Adjusted R Square Std. Error of the Estimate
.360 .129 .084 .443
Table 60 ANOVA with the EII Score (Collaboration)
Model Sum of Squares df Mean Square F Sig.
Regression
Residual
Total
5.076
34.143
39.219
9
174
183
.564
.196
2.875 .003**
**. p < .01 level
Page 162
141
Table 61 Coefficients with the EII Score (Collaboration)
Model
Unstandardized
Coefficients
Standardized
Coefficients t Sig.
B Std. Error Beta
(Constant)
EII
Gender
S. Orientation
Ethnicity
RHA Position
GPA
Class Level
RHA Years
Institution
4.162
.002
.015
-.041
-.019
-.098
.043
-.018
-.024
.014
.215
.000
.072
.084
.090
.079
.041
.047
.052
.034
.320
.015
-.037
-.016
-.090
.080
-.039
-.050
.029
19.319
4.304
.203
-.483
-.213
-1.248
1.051
-.373
-.472
.402
.000
.000**
.839
.630
.832
.214
.295
.710
.637
.688
**. p < .01 level
Common Purpose value Regression
Table 62 Correlations with Regression Predictors (Common Purpose)
Predictor Pearson Correlation Significance (1-tailed)
EII .344 .000**
Gender -.059 .214
Sexual Orientation -.031 .337
Ethnicity .012 .436
RHA Position -.045 .272
GPA .066 .187
Class Level .046 .266
Number of RHA Years .101 .085
Institution Enrollment .050 .248
**. Correlations significant at .01 (1-tailed)
Table 63 Regression Model Summary with the EII Score (Common Purpose)
R R Squared Adjusted R Square Std. Error of the Estimate
.356 .127 .082 .402
Table 64 ANOVA with the EII Score (Common Purpose)
Model Sum of Squares df Mean Square F Sig.
Regression
Residual
Total
4.077
28.075
32.151
9
174
183
.453
.161
2.807 .004**
**. p < .01 level
Page 163
142
Table 65 Coefficients with the EII Score (Common Purpose)
Model
Unstandardized
Coefficients
Standardized
Coefficients t Sig.
B Std. Error Beta
(Constant)
EII
Gender
S. Orientation
Ethnicity
RHA Position
GPA
Class Level
RHA Years
Institution
4.221
.002
-.045
.031
.016
-.041
-.005
-.032
.037
.006
.195
.000
.065
.076
.081
.072
.037
.043
.047
.031
.342
-.051
.031
.015
-.041
-.010
-.078
.084
.014
21.608
4.595
-.681
.408
.198
-.571
-.125
-.743
.783
.194
.000
.000**
.497
.684
.844
.569
.901
.459
.435
.846
**. p < .01 level
Controversy with Civility value Regression
Table 66 Correlations with Regression Predictors (Controversy with Civility)
Predictor Pearson Correlation Significance (1-tailed)
EII .129 .041*
Gender -.031 .336
Sexual Orientation -.109 .070
Ethnicity .108 .073
RHA Position -.050 .251
GPA .034 .323
Class Level .057 .220
Number of RHA Years .065 .192
Institution Enrollment .018 .404
*. Correlations significant at .05 (1-tailed)
Table 67 Regression Model Summary with the EII Score (Controversy with Civility)
R R Squared Adjusted R Square Std. Error of the Estimate
.202 .041 -.009 .432
Table 68 ANOVA with the EII Score (Controversy with Civility)
Model Sum of Squares df Mean Square F Sig.
Regression
Residual
Total
1.375
32.431
33.806
9
174
183
.153
.186
.820 .599
Page 164
143
Table 69 Coefficients with the EII Score (Controversy with Civility)
Model
Unstandardized
Coefficients
Standardized
Coefficients t Sig.
B Std. Error Beta
(Constant)
EII
Gender
S. Orientation
Ethnicity
RHA Position
GPA
Class Level
RHA Years
Institution
3.949
.001
-.012
-.095
.134
-.035
.009
.005
.000
.001
.210
.000
.070
.082
.087
.077
.039
.046
.050
.033
.111
-.013
-.093
.119
-.034
.019
.012
.000
.001
18.809
1.424
-.165
-1.160
1.541
-.457
.235
.105
-.003
.017
.000
.156
.869
.248
.125
.648
.814
.916
.998
.986
Group Values Component Regression
Table 70 Correlations with Regression Predictors (Group Component)
Predictor Pearson Correlation Significance (1-tailed)
EII .320 .000**
Gender -.043 .282
Sexual Orientation -.087 .121
Ethnicity .031 .339
RHA Position -.074 .158
GPA .103 .083
Class Level .043 .282
Number of RHA Years .069 .175
Institution Enrollment .058 .216
**. Correlations significant at .01 (1-tailed)
Table 71 Regression Model Summary with the EII Score (Group Component)
R R Squared Adjusted R Square Std. Error of the Estimate
.337 .113 .068 .353
Table 72 ANOVA with the EII Score (Group Component)
Model Sum of Squares df Mean Square F Sig.
Regression
Residual
Total
2.778
21.709
24.487
9
174
183
.309
.125
2.474 .011*
*. p < .05 level
Page 165
144
Table 73 Coefficients with the EII Score (Group Component)
Model
Unstandardized
Coefficients
Standardized
Coefficients t Sig.
B Std. Error Beta
(Constant)
EII
Gender
S. Orientation
Ethnicity
RHA Position
GPA
Class Level
RHA Years
Institution
4.111
.002
-.014
-.035
.044
-.058
.016
-.015
.004
.007
.172
.000
.058
.067
.071
.063
.032
.037
.041
.027
.309
-.018
-.040
.046
-.067
.037
-.042
.011
.018
23.930
4.121
-.240
-.520
.614
-.924
.488
-.394
.098
.249
.000
.000**
.810
.604
.540
.357
.626
.694
.922
.804
**. p < .01 level
Citizenship value/Society Values Component Regression
Table 74 Correlations with Regression Predictors (Citizenship/Society Component)
Predictor Pearson Correlation Significance (1-tailed)
EII .308 .000**
Gender -.020 .395
Sexual Orientation -.098 .094
Ethnicity -.007 .463
RHA Position -.031 .336
GPA .085 .126
Class Level .009 .453
Number of RHA Years .055 .228
Institution Enrollment .051 .247
**. Correlations significant at .01 (1-tailed)
Table 75 Regression Model Summary with the EII Score (Citizenship/Society Component)
R R Squared Adjusted R Square Std. Error of the Estimate
.322 .104 .058 .448
Table 76 ANOVA with the EII Score (Citizenship/Society Component)
Model Sum of Squares df Mean Square F Sig.
Regression
Residual
Total
4.045
34.894
38.939
9
174
183
.449
.201
2.241 .022*
*. p < .05 level
Page 166
145
Table 77 Coefficients with the EII Score (Citizenship/Society Component)
Model
Unstandardized
Coefficients
Standardized
Coefficients t Sig.
B Std. Error Beta
(Constant)
EII
Gender
S. Orientation
Ethnicity
RHA Position
GPA
Class Level
RHA Years
Institution
4.342
.002
.015
-.074
.002
-.033
.008
-.042
.020
.004
.218
.000
.073
.085
.091
.080
.041
.048
.052
.034
.304
.015
-.067
.001
-.030
.015
-.094
.041
.009
19.937
4.026
.203
-.866
.017
-.416
.197
-.881
.379
.126
.000
.000**
.839
.387
.986
.678
.844
.380
.705
.900
**. p < .01 level
Change value Regression
Table 78 Correlations with Regression Predictors (Change)
Predictor Pearson Correlation Significance (1-tailed)
EII .172 .010**
Gender -.112 .065
Sexual Orientation -.101 .086
Ethnicity .057 .222
RHA Position -.182 .007**
GPA .098 .094
Class Level .034 .323
Number of RHA Years .047 .264
Institution Enrollment .032 .335
**. Correlations significant at .01 (1-tailed)
RHA Position (Single Position = 0; Dual Position = 1)
Table 79 Regression Model Summary with the EII Score (Change)
R R Squared Adjusted R Square Std. Error of the Estimate
.287 .082 .035 .488
Table 80 ANOVA with the EII Score (Change)
Model Sum of Squares df Mean Square F Sig.
Regression
Residual
Total
3.735
41.732
45.467
9
174
183
.415
.240
1.730 .085
Page 167
146
Table 81 Coefficients with the EII Score (Change)
Model
Unstandardized
Coefficients
Standardized
Coefficients t Sig.
B Std. Error Beta
(Constant)
EII
Gender
S. Orientation
Ethnicity
RHA Position
GPA
Class Level
RHA Years
Institution
4.036
.001
-.095
-.059
.103
-.204
.033
-.012
-.005
.010
.238
.001
.080
.093
.099
.087
.045
.052
.057
.037
.152
-.091
-.050
.079
-.173
.057
-.024
-.010
.021
16.946
1.989
-1.186
-.637
1.045
-2.344
.726
-.222
-.094
.278
.000
.048*
.237
.525
.298
.020
.469
.825
.925
.781
*. p < .05 level
Page 168
147
APPENDIX I
Multiple Regression Results for SCM Values and Components for Participants Involved in
One Organization
Overall SRLS score Regression
Table 82 Correlations with Regression Predictors (One Org.; Overall SRLS score)
Predictor Pearson Correlation Significance (1-tailed)
EII .407 .006**
Gender -.101 .274
Sexual Orientation .134 .211
Ethnicity .118 .241
RHA Position .228 .084
GPA -.136 .207
Class Level -.035 .417
Number of RHA Years .050 .383
Institution Enrollment .064 .352
**. Correlations significant at .01 (1-tailed)
Table 83 Regression Model Summary with the EII Score (One Org.; Overall SRLS score)
R R Squared Adjusted R Square Std. Error of the Estimate
.495 .245 .002 .345
Table 84 ANOVA with the EII Score (One Org.; Overall SRLS score)
Model Sum of Squares df Mean Square F Sig.
Regression
Residual
Total
1.080
3.335
4.415
9
28
37
.120
.119
1.008 .457
Page 169
148
Table 85 Coefficients with the EII Score (One Org.; Overall SRLS score)
Model
Unstandardized
Coefficients
Standardized
Coefficients t Sig.
B Std. Error Beta
(Constant)
EII
Gender
S. Orientation
Ethnicity
RHA Position
GPA
Class Level
RHA Years
Institution
3.966
.005
-.092
.074
.138
.165
-.026
-.012
-.024
.022
.376
.002
.117
.160
.193
.167
.072
.082
.125
.067
.376
-.135
.088
.124
.176
-.064
-.037
-.056
.061
10.536
2.101
-.786
.463
.716
.987
-.366
-.147
-.188
.326
.000
.045*
.438
.648
.480
.332
.717
.884
.852
.747
*. p < .05 level
Consciousness of Self value Regression
Table 86 Correlations with Regression Predictors (One Org.; Consciousness of Self)
Predictor Pearson Correlation Significance (1-tailed)
EII .375 .010**
Gender -.195 .121
Sexual Orientation -.081 .315
Ethnicity .123 .232
RHA Position .232 .080
GPA -.054 .374
Class Level .151 .183
Number of RHA Years .191 .125
Institution Enrollment -.095 .285
**. Correlations significant at .01 (1-tailed)
Table 87 Regression Model Summary with the EII Score (One Org.; Consciousness of Self)
R R Squared Adjusted R Square Std. Error of the Estimate
.521 .272 .038 .484
Table 88 ANOVA with the EII Score (One Org.; Consciousness of Self)
Model Sum of Squares df Mean Square F Sig.
Regression
Residual
Total
2.447
6.562
9.009
9
28
37
.272
.234
1.160 .357
Page 170
149
Table 89 Coefficients with the EII Score (One Org.; Consciousness of Self)
Model
Unstandardized
Coefficients
Standardized
Coefficients t Sig.
B Std. Error Beta
(Constant)
EII
Gender
S. Orientation
Ethnicity
RHA Position
GPA
Class Level
RHA Years
Institution
3.848
.007
-.158
-.094
.347
.219
.052
.031
.031
-.079
.528
.003
.165
.225
.271
.234
.101
.116
.176
.093
.370
-.161
-.078
.219
.164
.088
.067
.052
-.155
7.287
2.106
-.958
-.417
1.283
.934
.511
.270
.179
-.850
.000
.044*
.346
.680
.210
.358
.613
.789
.859
.402
*. p < .05 level
Congruence value Regression
Table 90 Correlations with Regression Predictors (One Org.; Congruence)
Predictor Pearson Correlation Significance (1-tailed)
EII .278 .046*
Gender -.148 .188
Sexual Orientation .153 .179
Ethnicity .090 .297
RHA Position .296 .036
GPA -.266 .054
Class Level .036 .415
Number of RHA Years .134 .211
Institution Enrollment .125 .228
*. Correlations significant at .05 (1-tailed)
Table 91 Regression Model Summary with the EII Score (One Org.; Congruence)
R R Squared Adjusted R Square Std. Error of the Estimate
.513 .263 .026 .504
Table 92 ANOVA with the EII Score (One Org.; Congruence)
Model Sum of Squares df Mean Square F Sig.
Regression
Residual
Total
2.538
7.212
9.658
9
28
37
.282
.254
1.109 .389
Page 171
150
Table 93 Coefficients with the EII Score (One Org.; Congruence)
Model
Unstandardized
Coefficients
Standardized
Coefficients t Sig.
B Std. Error Beta
(Constant)
EII
Gender
S. Orientation
Ethnicity
RHA Position
GPA
Class Level
RHA Years
Institution
4.054
.003
-.182
.253
.074
.369
-.139
-.007
.013
.060
.550
.003
.172
.234
.282
.244
.105
.120
.183
.097
.161
-.179
.205
.045
.267
-.229
-.015
.021
.114
7.370
.910
-1.058
1.082
.262
1.512
-1.318
-.061
.072
.620
.000
.371
.299
.288
.795
.142
.198
.952
.943
.450
Commitment value Regression
Table 94 Correlations with Regression Predictors (One Org.; Commitment)
Predictor Pearson Correlation Significance (1-tailed)
EII .294 .037*
Gender .107 .260
Sexual Orientation .324 .024
Ethnicity .109 .257
RHA Position .203 .111
GPA -.140 .201
Class Level -.265 .054
Number of RHA Years -.123 .231
Institution Enrollment -.053 .377
*. Correlations significant at .05 (1-tailed)
Table 95 Regression Model Summary with the EII Score (One Org.; Commitment)
R R Squared Adjusted R Square Std. Error of the Estimate
.544 .296 .070 .397
Table 96 ANOVA with the EII Score (One Org.; Commitment)
Model Sum of Squares df Mean Square F Sig.
Regression
Residual
Total
1.856
4.407
6.263
9
28
37
.206
.157
1.310 .276
Page 172
151
Table 97 Coefficients with the EII Score (One Org.; Commitment)
Model
Unstandardized
Coefficients
Standardized
Coefficients t Sig.
B Std. Error Beta
(Constant)
EII
Gender
S. Orientation
Ethnicity
RHA Position
GPA
Class Level
RHA Years
Institution
4.374
.003
.057
.259
.103
.241
-.062
-.117
.053
-.049
.433
.003
.135
.184
.222
.192
.083
.095
.144
.077
.207
.070
.260
.078
.217
-.127
-.302
.104
-.114
10.108
1.199
.426
1.409
.466
1.255
-.750
-1.236
.365
-.634
.000
.240
.674
.170
.645
.220
.460
.227
.718
.531
Self Values Component Regression
Table 98 Correlations with Regression Predictors (One Org.; Self Component)
Predictor Pearson Correlation Significance (1-tailed)
EII .374 .010**
Gender -.106 .263
Sexual Orientation .143 .196
Ethnicity .126 .225
RHA Position .291 .038*
GPA -.183 .135
Class Level -.014 .468
Number of RHA Years .094 .288
Institution Enrollment -.004 .490
*. Correlations significant at .05 (1-tailed)
**. Correlations significant at .01 (1-tailed)
Table 99 Regression Model Summary with the EII Score (One Org.; Self Component)
R R Squared Adjusted R Square Std. Error of the Estimate
.511 .261 .024 .395
Table 100 ANOVA with the EII Score (One Org.; Self Component)
Model Sum of Squares df Mean Square F Sig.
Regression
Residual
Total
1.541
4.363
5.904
9
28
37
.171
.156
1.099 .395
Page 173
152
Table 101 Coefficients with the EII Score (One Org.; Self Component)
Model
Unstandardized
Coefficients
Standardized
Coefficients t Sig.
B Std. Error Beta
(Constant)
EII
Gender
S. Orientation
Ethnicity
RHA Position
GPA
Class Level
RHA Years
Institution
4.092
.004
-.094
.140
.175
.276
-.050
-.031
.032
-.023
.431
.003
.134
.183
.221
.191
.082
.094
143
.076
.292
-.119
.144
.136
.256
-.105
-.083
.066
-.054
9.504
1.650
-.700
.763
.792
1.446
-.604
-.329
.226
-.296
.000
.110
.490
.452
.435
.159
.551
.744
.823
.769
Collaboration value Regression
Table 102 Correlations with Regression Predictors (One Org.; Collaboration)
Predictor Pearson Correlation Significance (1-tailed)
EII .335 .020*
Gender -.120 .236
Sexual Orientation .158 .171
Ethnicity -.076 .324
RHA Position .140 .201
GPA -.076 .326
Class Level -.174 .149
Number of RHA Years -.144 .194
Institution Enrollment -.011 .474
*. Correlations significant at .05 (1-tailed)
Table 103 Regression Model Summary with the EII Score (One Org.; Collaboration)
R R Squared Adjusted R Square Std. Error of the Estimate
.468 .219 -.032 .425
Table 104 ANOVA with the EII Score (One Org.; Collaboration)
Model Sum of Squares df Mean Square F Sig.
Regression
Residual
Total
1.422
5.068
6.490
9
28
37
.158
.181
.873 .560
**. p < .01 level
Page 174
153
Table 105 Coefficients with the EII Score (One Org.; Collaboration)
Model
Unstandardized
Coefficients
Standardized
Coefficients t Sig.
B Std. Error Beta
(Constant)
EII
Gender
S. Orientation
Ethnicity
RHA Position
GPA
Class Level
RHA Years
Institution
4.481
.005
-.136
.096
-.119
.140
-.035
-.017
-.123
.037
.464
.003
.145
.197
.238
.206
.089
.102
.155
.082
.340
-.164
.094
-.088
124
-.070
-.044
-.239
.086
9.656
1.869
-.941
.485
-.500
.680
-.392
-.170
-.795
.453
.000
.072
.355
.631
.621
.502
.698
.866
.433
.654
**. p < .01 level
Common Purpose value Regression
Table 106 Correlations with Regression Predictors (One Org.; Common Purpose)
Predictor Pearson Correlation Significance (1-tailed)
EII .386 .008**
Gender -.074 .330
Sexual Orientation .143 .195
Ethnicity .040 .406
RHA Position .305 .031*
GPA -.143 .197
Class Level -.020 .452
Number of RHA Years .134 .211
Institution Enrollment .163 .164
*. Correlations significant at .05 (1-tailed)
**. Correlations significant at .01 (1-tailed)
Table 107 Regression Model Summary with the EII Score (One Org.; Common Purpose)
R R Squared Adjusted R Square Std. Error of the Estimate
.515 .265 .029 .428
Table 108 ANOVA with the EII Score (One Org.; Common Purpose)
Model Sum of Squares df Mean Square F Sig.
Regression
Residual
Total
1.860
5.145
7.005
9
28
37
.207
.184
1.124 .379
Page 175
154
Table 109 Coefficients with the EII Score (One Org.; Common Purpose)
Model
Unstandardized
Coefficients
Standardized
Coefficients t Sig.
B Std. Error Beta
(Constant)
EII
Gender
S. Orientation
Ethnicity
RHA Position
GPA
Class Level
RHA Years
Institution
3.935
.005
-.108
.178
.026
.264
-.043
-.046
.048
.058
.468
.003
.146
.199
.240
.208
.089
.102
.156
.083
.300
-.125
.169
.018
.224
-.084
-.113
.089
.129
8.415
1..698
-.738
.894
.108
1.273
-.486
-.451
.306
.706
.000
.101
.467
.379
.915
.214
.630
.655
.762
.486
Controversy with Civility value Regression
Table 110 Correlations with Regression Predictors (One Org.; Controversy with Civility)
Predictor Pearson Correlation Significance (1-tailed)
EII .233 .080
Gender -.078 .321
Sexual Orientation -.018 .458
Ethnicity .232 .080
RHA Position .058 .365
GPA -.084 .309
Class Level .019 .454
Number of RHA Years .065 .349
Institution Enrollment .233 .080
*. Correlations significant at .05 (1-tailed)
Table 111 Regression Model Summary with the EII Score (One Org.; Controversy with Civility)
R R Squared Adjusted R Square Std. Error of the Estimate
.436 .190 -.071 .402
Table 112 ANOVA with the EII Score (One Org.; Controversy with Civility)
Model Sum of Squares df Mean Square F Sig.
Regression
Residual
Total
1.059
4.524
5.583
9
28
37
.118
.162
.728 .680
Page 176
155
Table 113 Coefficients with the EII Score (One Org.; Controversy with Civility)
Model
Unstandardized
Coefficients
Standardized
Coefficients t Sig.
B Std. Error Beta
(Constant)
EII
Gender
S. Orientation
Ethnicity
RHA Position
GPA
Class Level
RHA Years
Institution
3.524
.004
-.092
-.123
.302
-.003
-.017
.018
-.080
.108
.438
.003
.137
.186
.225
.195
.084
.096
.146
.078
.286
-.119
-.131
.241
-.003
-.037
.049
-.168
.268
8.039
1.543
-.673
-.658
1.342
-.017
-.206
.186
-.550
1.392
.000
.134
.506
.516
.190
.987
.838
.854
.587
.175
Group Values Component Regression
Table 114 Correlations with Regression Predictors (One Org.; Group Component)
Predictor Pearson Correlation Significance (1-tailed)
EII .395 .007**
Gender -.112 .252
Sexual Orientation .121 .235
Ethnicity .075 .327
RHA Position .212 .101
GPA -.125 .227
Class Level -.073 .331
Number of RHA Years .023 .446
Institution Enrollment .156 .176
**. Correlations significant at .01 (1-tailed)
Table 115 Regression Model Summary with the EII Score (One Org.; Group Component)
R R Squared Adjusted R Square Std. Error of the Estimate
.504 .254 .014 .334
Table 116 ANOVA with the EII Score (One Org.; Group Component)
Model Sum of Squares df Mean Square F Sig.
Regression
Residual
Total
1.060
3.117
4.177
9
28
37
.118
.111
1.058 .422
*. p < .05 level
Page 177
156
Table 117 Coefficients with the EII Score (One Org.; Group Component)
Model
Unstandardized
Coefficients
Standardized
Coefficients t Sig.
B Std. Error Beta
(Constant)
EII
Gender
S. Orientation
Ethnicity
RHA Position
GPA
Class Level
RHA Years
Institution
3.980
.005
-.112
.050
.069
.134
-.032
-.015
-.052
068
.364
.002
.113
.155
.187
.162
.070
.080
.121
.064
.381
-.168
.062
.064
.147
-.080
-.048
-.126
.195
10.936
2.141
-.986
.325
.373
.827
-.458
-.191
-.428
1.054
.000
.041*
.333
.748
.712
.415
.651
.650
.672
.301
**. p < .01 level
Citizenship value/Society Values Component Regression
Table 118 Correlations with Regression Predictors (One Org.; Citizenship/Society Component)
Predictor Pearson Correlation Significance (1-tailed)
EII .302 .033*
Gender .027 .436
Sexual Orientation .106 .264
Ethnicity -.032 .425
RHA Position .179 .141
GPA -.203 .111
Class Level .012 .471
Number of RHA Years .096 .283
Institution Enrollment .034 .419
**. Correlations significant at .01 (1-tailed)
Table 119 Regression Model Summary with the EII Score (One Org.; Citizenship/Society
Component)
R R Squared Adjusted R Square Std. Error of the Estimate
.379 .144 -.131 .469
Table 120 ANOVA with the EII Score (One Org.; Citizenship/Society Component)
Model Sum of Squares df Mean Square F Sig.
Regression
Residual
Total
1.035
6.158
7.194
9
28
37
.115
.220
.523 .845
*. p < .05 level
Page 178
157
Table 121 Coefficients with the EII Score (One Org.; Citizenship/Society Component)
Model
Unstandardized
Coefficients
Standardized
Coefficients t Sig.
B Std. Error Beta
(Constant)
EII
Gender
S. Orientation
Ethnicity
RHA Position
GPA
Class Level
RHA Years
Institution
4.258
.003
.016
.132
-.073
.167
-.088
-.016
.023
.006
.512
.003
.159
.218
.262
.227
.098
.112
.170
.091
.217
.019
.123
-.052
.140
-.168
-.039
.043
.014
8.324
1.139
.102
.605
-.279
.736
-.897
-.146
.135
.069
.000
.264
.920
.550
.782
.468
.377
.885
894
.946
Change value Regression
Table 122 Correlations with Regression Predictors (One Org.; Change)
Predictor Pearson Correlation Significance (1-tailed)
EII .336 .020*
Gender -.072 .334
Sexual Orientation .172 .151
Ethnicity .193 .123
RHA Position .055 .372
GPA .048 .388
Class Level -.096 .283
Number of RHA Years -.110 .255
Institution Enrollment -.024 .444
*. Correlations significant at .05 (1-tailed)
Table 123 Regression Model Summary with the EII Score (One Org.; Change)
R R Squared Adjusted R Square Std. Error of the Estimate
.469 .220 -.030 .448
Table 124 ANOVA with the EII Score (One Org.; Change)
Model Sum of Squares df Mean Square F Sig.
Regression
Residual
Total
1.585
5.614
7.199
9
28
37
.176
.200
.879 .555
Page 179
158
Table 125 Coefficients with the EII Score (One Org.; Change)
Model
Unstandardized
Coefficients
Standardized
Coefficients t Sig.
B Std. Error Beta
(Constant)
EII
Gender
S. Orientation
Ethnicity
RHA Position
GPA
Class Level
RHA Years
Institution
3.634
.007
-.100
.046
.313
.046
.064
.013
-.101
.000
.488
.003
.152
.208
.250
.217
.093
.107
.163
.086
.406
-.114
.043
.221
.038
.123
.032
-.187
.000
7.441
2.231
-.657
.221
1.251
.211
.687
.124
-.624
.001
.000
.034*
.516
.827
.221
.834
.498
.902
.538
.999
*. p < .05 level
Page 180
159
APPENDIX J
Multiple Regression Results for SCM Values and Components for Participants Involved in
Multiple Organizations
Overall SRLS score Regression
Table 126 Correlations with Regression Predictors (Multi-Orgs)
Predictor Pearson Correlation Significance (1-tailed)
EII .293 .000**
Gender -.058 .244
Sexual Orientation -.126 .064
Ethnicity .018 .415
RHA Position -.154 .032*
GPA .130 .059
Class Level .059 .238
Number of RHA Years .061 .232
Institution Enrollment .065 .217
*. Correlations significant at .05 (1-tailed)
**. Correlations significant at .01 (1-tailed)
Table 127 Regression Model Summary with the EII Score (Multi-Orgs)
R R Squared Adjusted R Square Std. Error of the Estimate
.335 .112 .054 .357
Table 128 ANOVA with the EII Score (Multi-Orgs)
Model Sum of Squares df Mean Square F Sig.
Regression
Residual
Total
2.199
17.361
19.560
9
136
145
.244
.128
1.914 .055
Page 181
160
Table 129 Coefficients with the EII Score (Multi-Orgs)
Model
Unstandardized
Coefficients
Standardized
Coefficients t Sig.
B Std. Error Beta
(Constant)
EII
Gender
S. Orientation
Ethnicity
RHA Position
GPA
Class Level
RHA Years
Institution
4.174
.001
-.002
-.061
.023
-.112
.023
-.008
-.007
.003
.197
.000
.068
.077
.079
.070
.038
.044
.046
.031
.265
-.002
-.069
.025
-.131
.054
-.022
-.019
.007
21.205
3.054
-.025
-.791
.288
-1.593
.600
-.178
-.155
.083
.000
.003**
.980
.430
.774
.114
.550
.859
.877
.934
**. p < .01 level
Consciousness of Self value Regression
Table 130 Correlations with Regression Predictors (Multi-Orgs; Consciousness of Self)
Predictor Pearson Correlation Significance (1-tailed)
EII .222 .004**
Gender .018 .416
Sexual Orientation .010 .450
Ethnicity .067 .212
RHA Position -.086 .150
GPA .069 .205
Class Level .092 .134
Number of RHA Years .029 .365
Institution Enrollment .119 .077
**. Correlations significant at .01 (1-tailed)
Table 131 Regression Model Summary with the EII Score (Multi-Orgs; Consciousness of Self)
R R Squared Adjusted R Square Std. Error of the Estimate
.275 .076 .015 .466
Table 132 ANOVA with the EII Score (Multi-Orgs; Consciousness of Self)
Model Sum of Squares df Mean Square F Sig.
Regression
Residual
Total
2.418
29.470
31.888
9
136
145
.269
.217
1.240 .276
Page 182
161
Table 133 Coefficients with the EII Score (Multi-Orgs; Consciousness of Self)
Model
Unstandardized
Coefficients
Standardized
Coefficients t Sig.
B Std. Error Beta
(Constant)
EII
Gender
S. Orientation
Ethnicity
RHA Position
GPA
Class Level
RHA Years
Institution
3.663
.001
.003
.062
.090
-.083
.017
.056
-.056
.040
.256
.001
.089
.100
.104
.091
.049
.057
.060
.041
.195
.003
.055
.076
-.076
.032
.124
-.117
.084
14.284
2.202
.031
.619
.874
-.905
.347
.992
-.928
.975
.000
.029*
.975
.537
.384
.367
.729
.323
.355
.332
*. p < .05 level
Congruence value Regression
Table 134 Correlations with Regression Predictors (Multi-Orgs; Congruence)
Predictor Pearson Correlation Significance (1-tailed)
EII .213 .005**
Gender -.061 .231
Sexual Orientation -.045 .296
Ethnicity -.068 .207
RHA Position -.072 .195
GPA .124 .068
Class Level .006 .472
Number of RHA Years .037 .331
Institution Enrollment .067 .211
**. Correlations significant at .01 (1-tailed)
Table 135 Regression Model Summary with the EII Score (Multi-Orgs; Congruence)
R R Squared Adjusted R Square Std. Error of the Estimate
.247 .061 -.001 .450
Table 136 ANOVA with the EII Score (Multi-Orgs; Congruence)
Model Sum of Squares df Mean Square F Sig.
Regression
Residual
Total
1.796
27.555
29.351
9
136
145
.200
.203
.985 .455
Page 183
162
Table 137 Coefficients with the EII Score (Multi-Orgs; Congruence)
Model
Unstandardized
Coefficients
Standardized
Coefficients t Sig.
B Std. Error Beta
(Constant)
EII
Gender
S. Orientation
Ethnicity
RHA Position
GPA
Class Level
RHA Years
Institution
4.347
.001
-.016
.007
-.067
-.068
.028
-.037
.020
.008
.248
.001
.086
.096
.100
.088
/047
.055
.058
.039
.200
-.017
.006
-.059
-.065
.055
-.085
.044
.017
17.530
2.240
-.191
.072
-.668
-.765
.595
-.671
.350
.200
.000
.027*
.849
.943
.505
.446
.553
.503
.727
.842
*. p < .05 level
Commitment value Regression
Table 138 Correlations with Regression Predictors (Multi-Orgs; Commitment)
Predictor Pearson Correlation Significance (1-tailed)
EII .248 .001**
Gender -.060 .237
Sexual Orientation -.133 .055
Ethnicity -.101 .113
RHA Position -.148 .038*
GPA .001 .497
Class Level .002 .490
Number of RHA Years .017 .419
Institution Enrollment -.013 .438
*. Correlations significant at .05 (1-tailed)
**. Correlations significant at .01 (1-tailed)
Table 139 Regression Model Summary with the EII Score (Multi-Orgs; Commitment)
R R Squared Adjusted R Square Std. Error of the Estimate
.344 .118 .060 .390
Table 140 ANOVA with the EII Score (Multi-Orgs; Commitment)
Model Sum of Squares df Mean Square F Sig.
Regression
Residual
Total
2.777
20.720
23.498
9
136
145
.309
.152
2.025 .041*
*. p < .05 level
Page 184
163
Table 141 Coefficients with the EII Score (Multi-Orgs; Commitment)
Model
Unstandardized
Coefficients
Standardized
Coefficients t Sig.
B Std. Error Beta
(Constant)
EII
Gender
S. Orientation
Ethnicity
RHA Position
GPA
Class Level
RHA Years
Institution
4.873
.002
.006
-.109
-.144
-.126
-.051
-.031
.005
-.022
.215
.000
.075
.084
.087
.077
.041
.048
.050
.034
.277
.007
-.114
-.141
-.135
-.111
-.081
.013
-.054
22.663
3.198
.080
-1.302
-1.656
-1.648
-1.237
-.659
.108
-.638
.000
.002**
.937
.195
.100
.102
.218
.511
.914
.525
**. p < .01 level
Self Values Component Regression
Table 142 Correlations with Regression Predictors (Multi-Orgs; Self Component)
Predictor Pearson Correlation Significance (1-tailed)
EII .266 .001**
Gender -.038 .323
Sexual Orientation -.061 .233
Ethnicity -.036 .335
RHA Position -.117 .080
GPA .078 .174
Class Level .041 .310
Number of RHA Years .033 .348
Institution Enrollment .071 .196
**. Correlations significant at .01 (1-tailed)
Table 143 Regression Model Summary with the EII Score (Multi-Orgs; Self Component)
R R Squared Adjusted R Square Std. Error of the Estimate
.290 .084 .023 .372
Table 144 ANOVA with the EII Score (Multi-Orgs; Self Component)
Model Sum of Squares df Mean Square F Sig.
Regression
Residual
Total
1.721
18.780
20.501
9
136
145
.191
.138
1.385 .201
Page 185
164
Table 145 Coefficients with the EII Score (Multi-Orgs; Self Component)
Model
Unstandardized
Coefficients
Standardized
Coefficients t Sig.
B Std. Error Beta
(Constant)
EII
Gender
S. Orientation
Ethnicity
RHA Position
GPA
Class Level
RHA Years
Institution
4.294
.001
-.003
-.013
-.040
-.092
-.002
-.004
-.010
.009
.205
.000
.071
.080
.083
.073
.039
.045
.048
.032
.260
-.003
-.015
-.042
-.106
-.004
-.011
-.026
.023
20.978
2.944
-.036
-.168
-.484
-1.263
-.048
-.087
-.208
.264
.000
.004**
.971
.867
.629
.209
.962
.931
.835
.792
**. p < .01 level
Collaboration value Regression
Table 146 Correlations with Regression Predictors (Multi-Orgs; Collaboration)
Predictor Pearson Correlation Significance (1-tailed)
EII .340 .000**
Gender .000 .498
Sexual Orientation -.126 .064
Ethnicity -.026 .378
RHA Position -.138 .048*
GPA .200 .008**
Class Level .047 .286
Number of RHA Years .036 .331
Institution Enrollment .104 .106
*. Correlations significant at .05 (1-tailed)
**. Correlations significant at .01 (1-tailed)
Table 147 Regression Model Summary with the EII Score (Multi-Orgs; Collaboration)
R R Squared Adjusted R Square Std. Error of the Estimate
.394 .155 .099 .450
Table 148 ANOVA with the EII Score (Multi-Orgs; Collaboration)
Model Sum of Squares df Mean Square F Sig.
Regression
Residual
Total
5.060
27.582
32.643
9
136
145
.562
.203
2.772 .005**
**. p < .01 level
Page 186
165
Table 149 Coefficients with the EII Score (Multi-Orgs; Collaboration)
Model
Unstandardized
Coefficients
Standardized
Coefficients t Sig.
B Std. Error Beta
(Constant)
EII
Gender
S. Orientation
Ethnicity
RHA Position
GPA
Class Level
RHA Years
Institution
4.058
.002
.080
-.089
-.015
-.131
.067
-.015
-.022
.008
.248
.001
.086
.096
.100
.088
.048
.055
.058
.039
.308
.080
-.079
-.013
-.120
.124
-.032
-.046
.017
16.357
3.632
.933
-.925
-.153
-1.485
1.409
-.265
-.379
.212
.000
.000**
.352
.357
.878
.140
.161
.792
.705
.833
**. p < .01 level
Common Purpose value Regression
Table 150 Correlations with Regression Predictors (Multi-Orgs; Common Purpose)
Predictor Pearson Correlation Significance (1-tailed)
EII .348 .000**
Gender -.066 .214
Sexual Orientation -.076 .182
Ethnicity .016 .423
RHA Position -.135 .052
GPA .115 .083
Class Level .063 .224
Number of RHA Years .085 .153
Institution Enrollment .039 .321
**. Correlations significant at .01 (1-tailed)
Table 151 Regression Model Summary with the EII Score (Multi-Orgs; Common Purpose)
R R Squared Adjusted R Square Std. Error of the Estimate
.369 .136 .079 .398
Table 152 ANOVA with the EII Score (Multi-Orgs; Common Purpose)
Model Sum of Squares df Mean Square F Sig.
Regression
Residual
Total
3.397
21.499
24.896
9
136
145
.377
.158
2.388 .015*
*. p < .05 level
Page 187
166
Table 153 Coefficients with the EII Score (Multi-Orgs; Common Purpose)
Model
Unstandardized
Coefficients
Standardized
Coefficients t Sig.
B Std. Error Beta
(Constant)
EII
Gender
S. Orientation
Ethnicity
RHA Position
GPA
Class Level
RHA Years
Institution
4.284
.002
-.019
-.005
.013
-.103
.015
-.021
.013
-.012
.219
.000
.076
.085
.088
.078
.042
.048
.051
.035
.339
-.022
-.005
.012
-.108
.031
-.052
.031
-.028
19.558
3.957
-.252
-.061
.146
-1.327
.353
-.429
.257
-.340
.000
.000**
.801
.952
.884
.187
.725
.669
.798
.734
**. p < .01 level
Controversy with Civility value Regression
Table 154 Correlations with Regression Predictors (Multi-Orgs; Controversy with Civility)
Predictor Pearson Correlation Significance (1-tailed)
EII .118 .078
Gender -.025 .382
Sexual Orientation -.129 .060
Ethnicity .090 .139
RHA Position -.075 .186
GPA .058 .244
Class Level .065 .216
Number of RHA Years .061 .233
Institution Enrollment -.022 .398
Table 155 Regression Model Summary with the EII Score (Multi-Orgs; Controversy with Civility)
R R Squared Adjusted R Square Std. Error of the Estimate
.204 .041 -.022 .446
Table 156 ANOVA with the EII Score (Multi-Orgs; Controversy with Civility)
Model Sum of Squares df Mean Square F Sig.
Regression
Residual
Total
1.168
27.007
28.175
9
136
145
.130
.199
.653 .749
Page 188
167
Table 157 Coefficients with the EII Score (Multi-Orgs; Controversy with Civility)
Model
Unstandardized
Coefficients
Standardized
Coefficients t Sig.
B Std. Error Beta
(Constant)
EII
Gender
S. Orientation
Ethnicity
RHA Position
GPA
Class Level
RHA Years
Institution
4.026
.001
.011
-.116
.106
-.048
.022
.012
-.008
-.021
.245
.001
.085
.095
.099
.087
.047
.054
.057
.039
.093
.012
-.111
.095
-.047
.045
.028
-.018
-.048
16.399
1.030
.129
-1.216
1.073
-.550
.479
.216
-.144
-.551
.000
.305
.898
.226
.285
.583
.633
.829
.886
.582
Group Values Component Regression
Table 158 Correlations with Regression Predictors (Multi-Orgs; Group Component)
Predictor Pearson Correlation Significance (1-tailed)
EII .319 .000**
Gender -.034 .340
Sexual Orientation -.132 .055
Ethnicity .031 .357
RHA Position -.138 .048*
GPA .150 .035*
Class Level .069 .203
Number of RHA Years .071 .197
Institution Enrollment .050 .275
*. Correlations at .05 (1-tailed)
**. Correlations significant at .01 (1-tailed)
Table 159 Regression Model Summary with the EII Score (Multi-Orgs; Group Component)
R R Squared Adjusted R Square Std. Error of the Estimate
.357 .128 .070 .360
Table 160 ANOVA with the EII Score (Multi-Orgs; Group Component)
Model Sum of Squares df Mean Square F Sig.
Regression
Residual
Total
2.578
17.618
20.196
9
136
145
.286
.130
2.211 .025*
*. p < .05 level
Page 189
168
Table 161 Coefficients with the EII Score (Multi-Orgs; Group Component)
Model
Unstandardized
Coefficients
Standardized
Coefficients t Sig.
B Std. Error Beta
(Constant)
EII
Gender
S. Orientation
Ethnicity
RHA Position
GPA
Class Level
RHA Years
Institution
4.123
.001
.024
-.070
.035
-.094
.035
-.008
-.006
-.008
.198
.000
.069
.077
.080
.071
.038
.044
.046
.031
.293
.031
-.079
.037
-.109
.082
-.022
-.015
-.022
20.792
3.397
.350
-.910
.433
-1.335
.915
-.179
-.123
-.264
.000
.001**
.727
.364
.666
.184
.362
.858
.902
.792.
**. p < .01 level
Citizenship value/Society Values Component Regression
Table 162 Correlations with Regression Predictors (Multi-Orgs; Citizenship/Society
Component)
Predictor Pearson Correlation Significance (1-tailed)
EII .301 .000**
Gender -.045 .295
Sexual Orientation -.145 .041*
Ethnicity .010 .455
RHA Position -.087 .149
GPA .147 .038*
Class Level .006 .471
Number of RHA Years .036 .335
Institution Enrollment .075 .184
*. Correlations significant at .05 (1-tailed)
**. Correlations significant at .01 (1-tailed)
Table 163 Regression Model Summary with the EII Score (Multi-Orgs; Citizenship/Society
Component)
R R Squared Adjusted R Square Std. Error of the Estimate
.340 .115 .057 .451
Table 164 ANOVA with the EII Score (Multi-Orgs; Citizenship/Society Component)
Model Sum of Squares df Mean Square F Sig.
Regression
Residual
Total
3.612
27.693
31.304
9
136
145
.401
.204
1.971 .047*
*. p < .05 level
Page 190
169
Table 165 Coefficients with the EII Score (Multi-Orgs; Citizenship/Society Component)
Model
Unstandardized
Coefficients
Standardized
Coefficients t Sig.
B Std. Error Beta
(Constant)
EII
Gender
S. Orientation
Ethnicity
RHA Position
GPA
Class Level
RHA Years
Institution
4.347
.002
.028
-.113
.023
-.073
.040
-.045
.007
.001
.249
.001
.086
.097
.100
.088
.048
.055
.058
.039
.281
.028
-.102
.019
-.068
.075
-.101
.014
.003
17.486
3.239
.324
-1.165
.227
-.823
.838
-.827
.117
.037
.000
.002**
.747
.246
.821
.412
.404
.410
.907
.970
**. p < .01 level
Change value Regression
Table 166 Correlations with Regression Predictors (Multi-Orgs; Change)
Predictor Pearson Correlation Significance (1-tailed)
EII .164 .024*
Gender -.126 .065
Sexual Orientation -.159 .027*
Ethnicity .037 .330
RHA Position -.230 .003**
GPA .107 .099
Class Level .063 .225
Number of RHA Years .072 .193
Institution Enrollment .049 .280
**. Correlations significant at .01 (1-tailed)
RHA Position (Single Position = 0; Dual Position = 1)
Table 167 Regression Model Summary with the EII Score (Multi-Orgs; Change)
R R Squared Adjusted R Square Std. Error of the Estimate
.315 .099 .039 .503
Table 168 ANOVA with the EII Score (Multi-Orgs; Change)
Model Sum of Squares df Mean Square F Sig.
Regression
Residual
Total
3.786
34.448
38.235
9
136
145
.421
.253
1.661 .104
Page 191
170
Table 169 Coefficients with the EII Score (Multi-Orgs; Change)
Model
Unstandardized
Coefficients
Standardized
Coefficients t Sig.
B Std. Error Beta
(Constant)
EII
Gender
S. Orientation
Ethnicity
RHA Position
GPA
Class Level
RHA Years
Institution
4.107
.001
-.088
-.114
.072
-.252
.025
-.004
-.006
.017
.277
.001
.096
.108
.112
.099
.053
.061
.065
.044
.112
-.081
-.093
.055
-.212
.043
-.008
-.011
.033
14.814
1.278
-.912
-1.059
.642
-2.552
.470
-.069
-.092
.384
.000
.203
.364
.291
.533
.012*
.639
.945
.927
.702
*. p < .05 level
Page 192
171
BIBLIOGRAPHY
Page 193
172
BIBLIOGRAPHY
Abrahamowicz, D. (1988). College involvement, perceptions, and satisfaction: A study of
membership in student organizations. Journal of College Student Development, 29(3),
233-238.
Aiken, L. S., & West, S. G. (1991). Multiple regression: Testing and interpreting interactions.
Newbury Park, CA: Sage Publications, Inc.
Astin, A. W. (1984). Student involvement: A developmental theory for higher education. Journal
of College Student Personnel, 25(4), 297-308.
Astin, A. W. (1993). What matters in college?: Four critical years revisited. San Francisco:
Jossey-Bass.
Astin, A. W., & Sax, L. (1998). How undergraduates are affected by service participation.
Journal of College Student Development, 39, 251-263.
Averill, V. (1993). Responsibilities of being an RHA advisor. In N. W. Dunkel & C. L. Spencer
(Eds.), Advice for advisors: The development of an effective residence hall association
(pp. 19-26). Columbus, OH: Association of College and University Housing Officers-
International.
Baker, C. N. (2008). Under-Represented College Students and Extracurricular Involvement: The
Effects of Various Student Organizations on Academic Performance. Social Psychology
of Education: An International Journal, 11(3), 273-298.
Biglan, A. (1973). Relationships between subject matter characteristics and the structure and
output of university departments. Journal of Applied Psychology, 57(3), 204-213.
Boersig, P. (1993). The first advising position. In N. W. Dunkel & C. L. Spencer (Eds.), Advice
for advisors: The development of an effective residence hall association (pp. 9-18).
Columbus, OH: Association of College and University Housing Officers-International.
Buschlen, E. (2010). Can college students learn to lead? An examination of a collegiate
leadership course using the social change model of leadership. (Doctoral dissertation).
Retrieved from ProQuest Dissertation and Theses database. (UMI No. 3351998)
Campbell, C. M., Smith, M., Dugan, J. P., & Komives, S. R. (2012). Mentors and college student
leadership outcomes: The importance of position and process. Review of Higher
Education, 35(4), 595-625.
Case, K. F. (2011). A gendered perspective on student involvement in collegiate clubs and
organizations in Christian higher education. Christian Higher Education, 10(3), 30-30.
Page 194
173
Centre for Justice and Reconciliation. (2014). Restorative justice online. Retrieved 2014 August
3, from http://www.restorativejustice.org/
Chickering, A. W. (1969). Education and identity (1st ed.). San Francisco,: Jossey-Bass.
Chickering, A. W., & Reisser, L. (1993). Education and identity (2nd ed.). San Francisco:
Jossey-Bass Publishers.
Coleman, J. K., & Dunkel, N. W. (2004). 50 Years of residence hall leadership - NACURH, Inc.
Columbus, OH: National Association of College and University Residence Halls.
College Portrait. (2013). Michigan State University college portrait: Students characteristics.
Retrieved June 23, 2014, from http://www.collegeportraits.org/MI/MSU/characteristics
Cooper, D., Healy, M., & Simpson, J. (1994). Student development through involvement:
Specific changes over time. Journal of College Student Development, 35(2), 98-102.
Cooper, H., Valentine, J. C., Nye, B., & Lindsay, J. J. (1999). Relationships between five after-
school activities and academic achievement. Journal of Educational Psychology, 91(2),
369-378. doi: http://dx.doi.org/10.1037/0022-0663.91.2.369
Covey, S. R. (1990). The seven habits of highly effective people: Restoring the character ethic.
New York, NY: Fireside.
Cress, C. M., Astin, H. S., Zimmerman-Oster, K., & Burkhardt, J. C. (2001). Developmental
outcomes of college students' involvement in leadership activities. Journal of College
Student Development, 42(1), 15-27.
Crowder, M. (2000). Student leadership outcomes inventory. Virginia Polytechnic State
University.
Dill, D. D. (1982). The management of academic culture: Notes on the management of meaning
and social integration. Higher Education, 11(3), 303-320.
Downey, R. G., Bosco, P. J., & Silver, E. M. (1984). Long-term outcomes of participation in
student government. Journal of College Student Personnel, 25(3), 245-250.
Dugan, J. P. (2006a). Explorations using the social change model: Leadership development
among college men and women. Journal of College Student Development, 47(2), 217-
225. doi: 10.1353/csd.2006.0015
Dugan, J. P. (2006b). Involvement and leadership: A descriptive analysis of socially responsible
leadership. Journal of College Student Development, 47(3), 335-343. doi:
10.1353/csd.2006.0028
Dugan, J. P., & Komives, S. R. (2007). Developing leadership capacity in college students:
College Park, MD: National Clearinghouse for Leadership Programs.
Page 195
174
Dugan, J. P., & Komives, S. R. (2010). Influences on college students' capacities for socially
responsible leadership. Journal of College Student Development, 51(5), 525-549.
Dugan, J. P., Komives, S. R., & Segar, T. C. (2008). College student capacity for socially
responsible leadership: Understanding norms and influences of race, gender, and sexual
orientation. NASPA Journal, 45(4), 475-500.
Dunkel, N. W., & Schuh, J. H. (1998). Advising student groups and organizations (1st ed.). San
Francisco, Calif.: Jossey-Bass.
Durham Hynes, S. L. (2010). Perceptions of the capacity for change as a component of
leadership development as reported by select populations of college students:
Implications for college student leadership development. (Doctoral dissertation).
Retrieved from ProQuest Dissertation and Theses database (UMI No. 3370691)
Field, A. (2012). Discovering Statistics Using IBM SPSS Statistics (4. ed.). London: Sage
Publications Ltd.
Finley, N. E. (1994). Leadership: The collaborative process. Journal of Leadership Studies, 1(3),
57-66.
Fitch, R. T. (1991). The interpersonal values of students at differing levels of extracurricular
involvement. Journal of College Student Development, 32(1), 24-30.
Foubert, J. D., & Grainger, L. U. (2006). Effects of involvement in clubs and organizations on
the psychosocial development of first-year and senior college students. NASPA Journal,
43(1), 166-182.
Gerhardt, C. B. (2008). The social change model of leadership development: Differences in
leadership development by levels of student involvement with various university student
groups. (Doctoral dissertation). Retrieved from ProQuest Dissertations & Theses
database. (UMI No. 3340075)
Goel, S. (2010, July 27). Well rounded curriculum - An insight from Biglan's classification of
disciplines. Retrieved from http://goelsan.wordpress.com/2010/07/27/biglans-
classification-of-disciplines/
Golden, D. C., & Schwartz, H. L. (1994). Building an ethical and effective relationship with
student government leaders. In M. C. Terrell & M. J. Cuyjet (Eds.), Developing student
government leadership (pp. 19-30). San Francisco, CA: Jossey-Bass.
Grandzol, C., Perlis, S., & Draina, L. (2010). Leadership Development of Team Captains in
Collegiate Varsity Athletics. Journal of College Student Development, 51(4), 403-418.
Greenleaf, R. K. (2002). Essentials of servant-leadership. In L. C. Spears & M. Lawrence (Eds.),
Focus on leadership: Servant-leadership for the Twenty-First Century (pp. 19-25). New
York City, NY: John Wiley & Sons, Inc.
Page 196
175
Haber, P. (2006). Cocurricular involvement, formal leadership roles, and leadership education:
Experiences predicting college student socially responsible leadership outcomes.
(Master’s thesis). Available from ProQuest Dissertations and Theses database (UMI No.
1436359)
Hellwig-Olson, B., & Tattershall, B. (1993). State, regional, and national conferences:
Attendance, structure and benefits. In N. W. Dunkel & C. L. Spencer (Eds.), Advice for
advisors: The development of an effective residence hall association (pp. 187-195).
Columbus, OH: Association of College and University Housing Officers-International.
Hernandez, K., Hogan, S., Hathaway, C., & Lovell, C. D. (1999). Analysis of the literature on
the impact of student involvement on student development and learning: More questions
than answers? NASPA Journal, 36, 184-197.
Higher Education Research Institute. (1996). A social change model of leadership development:
guidebook: Version III. College Park, MD: National Clearinghouse for Leadership
Programs.
Humphreys, M. J. (2007). Predictors of socially responsible leadership: Application of the social
change model to an Eastern European undergraduate population. (Doctoral dissertation).
Retrieved from ProQuest Dissertation and Theses database. (UMI No. 3292177)
Hunt, S., & Rentz, A. L. (1994). Greek-letter social group members' involvement and
psychosocial development. Journal of College Student Development, 35(4), 289-296.
Involvement. (n.d.). Retrieved November 29, 2010, from http://dictionary.reference.com
Jensen, A. R. (2003). Regularities in Spearman's law of diminishing returns. Intelligence, 31(2),
95-105.
Kezar, A., Carducci, R., & Contreras-McGavin, M. (2006). Rethinking the "L" word in higher
education. ASHE Higher Education Report, 31(6), 1-218. doi: 10.1002/aehe.3106
Kezar, A., & Moriarty, D. (2000). Expanding our understanding of student leadership
development: A study exploring gender and ethnic identity. Journal of College Student
Development, 41(1), 55-69.
Komives, S. R., Longerbeam, S. D., Owen, J. E., Mainella, F. C., & Osteen, L. (2006). A
Leadership Identity Development Model: Applications from a Grounded Theory. Journal
of College Student Development, 47(4), 401-418. doi: 10.1353/csd.2006.0048
Komives, S. R., Lucas, N., & McMahon, T. R. (2006). Exploring leadership: For college
students who want to make a difference. (2nd ed.).
Komives, S. R., Owen, J. E., Longerbeam, S. D., Mainella, F. C., & Osteen, L. (2005).
Developing a Leadership Identity: A Grounded Theory. Journal of College Student
Development, 46(6), 593-611. doi: 10.1353/csd.2005.0061
Page 197
176
Komives, S. R., & Tucker, G. L. (1993). Successful residence hall government: Themes from a
national study of select hall government structures. In N. W. Dunkel & C. L. Spencer
(Eds.), Advice for advisors: The development of an effective residence hall association
(pp. 27-43). Columbus, OH: Association of College and University Housing Officers-
International.
Komives, S. R., & Wagner, W. (2009). Leadership for a better world: Understanding the social
change model of leadership development (1st ed.). San Francisco, CA: Jossey-Bass.
Kouzes, J. M., & Posner, B. Z. (1998). Student leadership practices inventory. San Francisco,
CA: Jossey-Bass.
Kouzes, J. M., & Posner, B. Z. (2003). The leadership challenge (3rd ed.). San Francisco, CA:
Jossey-Bass.
Kouzes, J. M., & Posner, B. Z. (2009). The student leadership challenge: Five practices for
exemplary leaders. San Francisco, CA: Jossey-Bass.
Kuh, G. D. (1995). The other curriculum: Out-of-class experiences associated with student
learning and personal development. Journal of Higher Education, 66(2), 123-155.
Kuh, G. D., & Lund, J. P. (1994). What students gain from participating in student government.
In M. C. Terrell & M. J. Cuyjet (Eds.), Developing student government leadership (pp. 5-
18). San Francisco, CA: Jossey-Bass.
Kuhnert, K. W., & Lewis, P. (1987). Transactional and transformational leadership: A
constructive/developmental analysis. Academy of Management. The Academy of
Management Review, 12(4), 648.
Laosebikan-Buggs, M. O. (2009). An investigation of the impact of student government
involvement at one public Historically Black university on the career choice of African
American student participants. (Doctoral dissertation). Retrieved from ProQuest
Dissertation and Theses database. (UMI No. 3394745)
Lee, R. J., & King, S. N. (2001). Discovering the leader in you: A guide to realizing your
personal leadership potential. San Fransicso, CA: Jossey-Bass.
Logue, C. T., Hutchens, T. A., & Hector, M. A. (2005). Student leadership: A phenomenological
exploration of postsecondary experiences. Journal of College Student Development,
46(4), 393-408.
Mahoney, J. L., Harris, A. L., & Eccles, J. S. (2006). Organized Activity Participation, Positive
Youth Development, and the Over-Scheduling Hypothesis. Social Policy Report. Volume
20, Number 4 (pp. 32): Society for Research in Child Development. 2950 South State
Street Suite 401, Ann Arbor, MI 48104.
Page 198
177
Marsh, H. W. (1992). Extracurricular activities: Beneficial extension of the traditional
curriculum or subversion of academic goals? Journal of Educational Psychology, 84(4),
553-562. doi: http://dx.doi.org/10.1037/0022-0663.84.4.553
Marsh, H. W., & Kleitman, S. (2002). Extracurricular School Activities: The Good, the Bad, and
the Nonlinear. Harvard Educational Review, 72(4), 464-514.
Marshall, S. M., & Hornak, A. M. (2008). A day in the life of a college student leader : case
studies for undergraduate leaders (1st ed.). Sterling, Va.: Stylus Pub.
Laosebikan-Buggs, M. O. (2009). An investigation of the impact of student government
involvement at one public Historically Black university on the career choice of African
American student participants. (Doctoral dissertation). Retrieved from ProQuest
Dissertation and Theses database. (UMI No. 3394745)
McIntire, D. D. (1989). Student Leadership Development: A Student Affairs Mandate. NASPA
Journal, 27(1), 75-79.
Michigan State University. (2013). Common data set 2013-2014. Retrieved June 23, 2014, from
http://opb.msu.edu/institution/documents/CDS_2013-2014.pdf
Michigan State University. (Spring 2010). Headcounts by academic level and student category.
InfoPages Unit Selection Menu. Retrieved June 23, 2014, from
http://opbweb01.dev.ais.msu.edu/infopages/StandardReportsFrame.htm
Miles, J. M. (2011). Reflections of student government association leaders: Implications for
advisors. College Student Journal, 45(2), 324-332.
Miller, C., & Papish, R. (1993). Relationships RHAs have with their institutions. In N. W.
Dunkel & C. L. Spencer (Eds.), Advice for advisors: The development of an effective
residence hall association (pp. 99-107). Columbus, OH: Association of College and
University Housing Officers-International.
Miller, C. D., & Kraus, M. (2004). Participating but Not Leading: Women's Under-
Representation in Student Government Leadership Positions. College Student Journal,
38(3), 423.
Moore, J., Lovell, C. D., McGann, T., & Wyrick, J. (1998). Why involvement matters: A review
of research on student involvement in the collegiate setting. College Student Affairs
Journal, 17(2), 4-17.
National Association of College and University Residence Halls. (n.d.,). National Association of
College and University Residence Halls. from http://www.nacurh.org/
National Clearinghous for Leadership Programs. (n.d.). Socially responsible leadership scale
revised version 2: Using the SRLS-R2 for research and assessment. College Park, MD:
University of Maryland College Park.
Page 199
178
Nobbe, J. E. (2012). Citizenship Education in Public Higher Education: Curricular Strategies to
Promote the Development of Civic Knowledge, Skills, and Attitudes. (Doctoral
dissertation). Retrieved from ProQuest Dissertation and Theses database. (UMI No.
3519184)
Ott, L., & Longnecker, M. (2010). An introduction to statistical methods and data analysis (6th
ed.). Australia ; United States: Brooks/Cole Cengage Learning.
Pace, R. C. (1984). Measuring the quality of college atudent experiences. An account of the
development and use of the college student experiences questionnaire (pp. 142): Higher
Education Research Institute, Graduate School of Education, University of California,
Los Angeles, CA 90024 ($7.95).
Pallant, J. (2013). SPSS survival manual : A step by step guide to data analysis using IBM SPSS
(5th ed.). Maidenhead, Berkshire. U.K. ; New York, NY: Open University Press.
Pascarella, E. T., & Terenzini, P. T. (2005). How college affects students (Vol. 2). San Francisco:
Jossey-Bass.
Pierce, J. R., & Aguinis, H. (2013). The too-much-of-a-good-thing effect in management.
Journal of Management, 39(2), 313-338.
Posner, B., & Brodsky, B. (1993). The leadership practices of effective RAs. Journal of College
Student Development, 34(4), 300-304.
Posner, B. Z. (2004). A Leadership development instrument for students: Updated. Journal of
College Student Development, 45(4), 443-456. doi: 10.1353/csd.2004.0051
Posner, B. Z. (2009a). A Longitudinal Study Examining Changes in Students' Leadership
Behavior. Journal of College Student Development, 50(5), 551-563.
Posner, B. Z. (2009b). A longitudinal study examining changes in students’ Leadership behavior.
Journal of College Student Development, 50(5), 551-563. doi: 10.1353/csd.0.0091
Posner, B. Z., & Brodsky, B. (1994). Leadership practices of effective student leaders: Gender
makes no difference. NASPA Journal, 31(2), 113-120.
Remler, D. K., & Van Ryzin, G. G. (2011). Research methods in practice: Strategies for
description and causation. Thousand Oaks, Calif.: SAGE Publications.
Residence Education and Housing Services. (2013). Neighborhoods. Retrieved 2013 August 26,
from http://liveon.msu.edu/neighborhoods
Romano, C. R. (1996). A Qualitative Study of Women Student Leaders. Journal of College
Student Development, 37(6), 676-683.
Page 200
179
Romero-Aldaz, P. I. (2001). The leading edge: Outcomes achieved by residence hall association
leaders. (Master’s thesis). Retrieved from http://scholar.lib.vt.edu/theses/available/etd-
05102001-141415/
Rosch, D. M., & Lawrie, J. D. (2011). Recent alumni perceptions of hall government leadership
learning. Journal of College and University Student Housing, 37(2), 54-70.
Schuh, J. H., & Laverty, M. (1983). The perceived long-term influence of holding a significant
student leadership position. Journal of College Student Personnel, 24(1), 28-32.
Slife, N. (2007). Exploring leadership among deaf college students: A comparative study at a
population serving institution and predominantly hearing institutions. (Master’s thesis).
Retrieved from ProQuest Dissertation and Theses database. (UMI No. 1446191)
Terenzini, P. T., Pascarella, E., & Blimling, G. S. (1996). Students' out-of-class experiences and
their influence on learning and cognitive development: A literature review. Journal of
College Student Development, 37(2), 149-162.
Thelin, J. (2004). A history of American higher education. Baltimore, MD: Johns Hopkins
University Press.
Tjosvold, D. (1989). Managing conflict: The key to making your organization work.
Minneapolis, MN: Team Media.
Trujillo, C. W. (2009). College involvement and leadership development in higher education:
The role of race/ethnicity, sex, and mentoring relationships. (Doctoral dissertation).
Retrieved from ProQuest Dissertation and Theses database. (UMI No. 3363101)
Tyree, T. M. (1998). Designing an instrument to measure socially responsible leadership using
the Social Change Model of Leadership Development. (Doctoral dissertation). Retrieved
from ProQuest Dissertations and Theses database. (UMI No. 9836493)
VanHecke, J. R. (2006). Responsible citizenship among college students: A study of predictive
experiences and values. (Doctoral dissertation). Retrieved from ProQuest Dissertation
and Theses databases. (UMI No. 3238103)
Verry, B. (1993). The organizational structures of RHAs. In N. W. Dunkel & C. L. Spencer
(Eds.), Advice for advisors: The development of an effective residence hall association
(pp. 45-53). Columbus, OH: Association of College and University Housing Officers-
International.
Werring, C. J. (1984). The purpose of residence hall student government: One conceptual model.
The Journal of College and University Student Housing, 14(1), 40-43.
Williams, M., & Winston, R. B., Jr. (1985). Participation in organized student activities and
work: Differences in developmental task achievement of traditional aged college
students. NASPA Journal, 22(3), 52-59.
Page 201
180
Winston Jr, R. B., & Saunders, S. A. (1987). The Greek experience: Friend or foe of student
development? In R. Winston Jr, W. R. Neules III & J. H. Opper Jr (Eds.), Fraternities
and sororities on the contemporary college campus (Vol. 40). San Francisco, CA:
Jossey-Bass.
Winston, R. B., & Massaro, A. V. (1987). Extracurricular involvement inventory: An instrument
for assessing intensity of student involvement. Journal of College Student Personnel,
28(2), 169-175.
Winston, R. B., Miller, T. K., & Prince, J. (1987). Student development task and lifestyle
inventory. Athens, GA.