Biophysical Journal Volume 72 May 1997 2304-2319 The Interaction of Quinone and Detergent with Reaction Centers of Purple Bacteria. 1. Slow Quinone Exchange Between Reaction Center Micelles and Pure Detergent Micelles Vladimir P. Shinkarev and Colin A. Wraight Department of Plant Biology, Center for Biophysics and Computational Biology, University of Illinois, Urbana, Illinois 61801-3837 USA ABSTRACT The kinetics of light-induced electron transfer in reaction centers (RCs) from the purple photosynthetic bacterium Rhodobacter sphaeroides were studied in the presence of the detergent lauryldimethylamine-N-oxide (LDAO). After the light-induced electron transfer from the primary donor (P) to the acceptor quinone complex, the dark re-reduction of P+ reflects recombination from the reduced acceptor quinones, QA- or QB- The secondary quinone, QB, which is loosely bound to the RC, determines the rate of this process. Electron transfer to QB slows down the return of the electron to P+, giving rise to a slow phase of the recovery kinetics with time Tp 1 s, whereas charge recombination in RCs lacking QB generates a fast phase with time TAP 0.1 s. The amount of quinone bound to RC micelles can be reduced by increasing the detergent concentration. The characteristic time of the slow component of P+ dark relaxation, observed at low quinone content per RC micelle (at high detergent concentration), is about 1.2-1.5 s, in sharp contrast to expectations from previous models, according to which the time of the slow component should approach the time of the fast component (about 0.1 s) when the quinone concentration approaches zero. To account for this large discrepancy, a new quantitative approach has been developed to analyze the kinetics of electron transfer in isolated RCs with the following key features: 1) The exchange of quinone between different micelles (RC and detergent micelles) occurs more slowly than electron transfer from QB- to P+; 2) The exchange of quinone between the detergent "phase" and the QB binding site within the same RC micelle is much faster than electron transfer between QA- and P+; 3) The time of the slow component of P' dark relaxation is determined by (n)21, the average number of quinones in RC micelles, calculated only for those RC micelles that have at least one quinone per RC (in excess of QA.). An analytical function is derived that relates the time of the slow component of P' relaxation, Tp, and the relative amplitude of the slow phase. This provides a useful means of determining the true equilibrium constant of electron transfer between QA and QB (LAB), and the association equilibrium constant of quinone binding at the QB site (KQ). We found that LAB = 22 + 3 and KQ = 0.6 + 0.2 at pH 7.5. The analysis shows that saturation of the QB binding site in detergent-solubilized RCs is difficult to achieve with hydrophobic quinones. This has important implications for the interpre- tation of apparent dependencies of QB function on environmental parameters (e.g. pH) and on mutational alterations. The model accounts for the effects of detergent and quinone concentration on electron transfer in the acceptor quinone complex, and the conclusions are of general significance for the study of quinone-binding membrane proteins in detergent solutions. GLOSSARY kAP rate constant of back reaction between QA and P+ kp(n) rate constant of P+ dark relaxation in RC micelle w th n quinones k second-order rate constant for transfer of quinone from a detergent micelle to a RC micelle (Eq. 22) k-2 rate constant for back-transfer of quinone from RC micelle to detergent micelles (Eq. A9) k-PP the apparent backward rate constant for the transition from k + 1 to k quinone molecules in a RC micelle (Eq. A10) Received for publication 12 August 1996 and in final form 30 January 1997. Address reprint requests to Dr. Colin A. Wraight, Department of Plant Biology, University of Illinois, 190 ERML/MC-051, 1201 W. Gregory Dr., Urbana, IL 61801-3838. Tel.: 217-333-3245; Fax: 217-244-1336; E-mail: [email protected]. C 1997 by the Biophysical Society 0006-3495/97/05/2304/16 $2.00 K1 = KI'd[Q]deequilibrium constant for partitioning of the first quinone in a RC micelle (Eq. 23) K2 = K2'[Qidet equilibrium constant for partitioning the second and subsequent quinones in a RC micelle (Eq. 23) KQ generalized equilibrium constant for quinone binding at thc QB site (Eq. 3) KQ dimensionless intramicellar association constant for quinone binding at the QB site KQ(n) dimensionless equilibrium constant for quinone binding in a RC micelle with n quinones LAB equilibrium constant for one electron transfer between QA and QB Lap= LABKQ/(l + KQ)apparent equilibrium constant for one electron transfer between QA and QB LapP(n) apparent equilibrium constant for one electron transfer between QA and QB in a RC micelle with n quinones n number of quinone molecules in a RC detergent micelle 2304
Transcript
Biophysical Journal Volume 72 May 1997 2304-2319
The Interaction of Quinone and Detergent with Reaction Centers ofPurple Bacteria. 1. Slow Quinone Exchange Between Reaction CenterMicelles and Pure Detergent Micelles
Vladimir P. Shinkarev and Colin A. WraightDepartment of Plant Biology, Center for Biophysics and Computational Biology, University of Illinois, Urbana, Illinois 61801-3837 USA
ABSTRACT The kinetics of light-induced electron transfer in reaction centers (RCs) from the purple photosyntheticbacterium Rhodobacter sphaeroides were studied in the presence of the detergent lauryldimethylamine-N-oxide (LDAO).After the light-induced electron transfer from the primary donor (P) to the acceptor quinone complex, the dark re-reductionof P+ reflects recombination from the reduced acceptor quinones, QA- or QB- The secondary quinone, QB, which is looselybound to the RC, determines the rate of this process. Electron transfer to QB slows down the return of the electron to P+,giving rise to a slow phase of the recovery kinetics with time Tp 1 s, whereas charge recombination in RCs lacking QBgenerates a fast phase with time TAP 0.1 s. The amount of quinone bound to RC micelles can be reduced by increasing thedetergent concentration. The characteristic time of the slow component of P+ dark relaxation, observed at low quinonecontent per RC micelle (at high detergent concentration), is about 1.2-1.5 s, in sharp contrast to expectations from previousmodels, according to which the time of the slow component should approach the time of the fast component (about 0.1 s)when the quinone concentration approaches zero. To account for this large discrepancy, a new quantitative approach hasbeen developed to analyze the kinetics of electron transfer in isolated RCs with the following key features: 1) The exchangeof quinone between different micelles (RC and detergent micelles) occurs more slowly than electron transfer from QB- to P+;2) The exchange of quinone between the detergent "phase" and the QB binding site within the same RC micelle is much fasterthan electron transfer between QA- and P+; 3) The time of the slow component of P' dark relaxation is determined by (n)21,the average number of quinones in RC micelles, calculated only for those RC micelles that have at least one quinone per RC(in excess of QA.). An analytical function is derived that relates the time of the slow component of P' relaxation, Tp, and therelative amplitude of the slow phase. This provides a useful means of determining the true equilibrium constant of electrontransfer between QA and QB (LAB), and the association equilibrium constant of quinone binding at the QB site (KQ). We foundthat LAB = 22 + 3 and KQ = 0.6 + 0.2 at pH 7.5. The analysis shows that saturation of the QB binding site indetergent-solubilized RCs is difficult to achieve with hydrophobic quinones. This has important implications for the interpre-tation of apparent dependencies of QB function on environmental parameters (e.g. pH) and on mutational alterations. Themodel accounts for the effects of detergent and quinone concentration on electron transfer in the acceptor quinone complex,and the conclusions are of general significance for the study of quinone-binding membrane proteins in detergent solutions.
GLOSSARY
kAP rate constant of back reaction betweenQA and P+
kp(n) rate constant of P+ dark relaxation in RCmicelle w th n quinones
k second-order rate constant for transfer ofquinone from a detergent micelle to a RCmicelle (Eq. 22)
k-2 rate constant for back-transfer of quinonefrom RC micelle to detergent micelles (Eq.A9)
k-PP the apparent backward rate constant for thetransition from k + 1 to k quinonemolecules in a RC micelle (Eq. A10)
Received for publication 12 August 1996 and in final form 30 January1997.Address reprint requests to Dr. Colin A. Wraight, Department of PlantBiology, University of Illinois, 190 ERML/MC-051, 1201 W. Gregory Dr.,Urbana, IL 61801-3838. Tel.: 217-333-3245; Fax: 217-244-1336; E-mail:[email protected] 1997 by the Biophysical Society0006-3495/97/05/2304/16 $2.00
K1 = KI'd[Q]deequilibrium constant forpartitioning of the first quinone in a RCmicelle (Eq. 23)
K2 = K2'[Qidet equilibrium constant forpartitioning the second and subsequentquinones in a RC micelle (Eq. 23)
KQ generalized equilibrium constant forquinone binding at thc QB site (Eq. 3)
KQ dimensionless intramicellar associationconstant for quinone binding at the QB site
KQ(n) dimensionless equilibrium constant forquinone binding in a RC micelle with nquinones
LAB equilibrium constant for one electrontransfer between QA and QB
Lap= LABKQ/(l + KQ)apparent equilibriumconstant for one electron transfer betweenQA and QB
LapP(n) apparent equilibrium constant for oneelectron transfer between QA and QB in aRC micelle with n quinones
n number of quinone molecules in a RCdetergent micelle
2304
Interaction of Quinones with Reaction Centers
(n) = n"C/nRc average number of quinones perRC micelle (also equal to [Q]RC/[RC])
(n)2_' average quinone content of RC-detergentmicelles exhibiting the slow component ofP+ dark relaxation
P870 or P bacteriochlorophyll dimer in the RCPo probability (fraction) that RC micelle has
zero quinonepi probability (fraction) of RC micelles with i
quinonesQAI QB the primary and secondary quinone-type
electron acceptors in the RC[Qidet concentration of quinone in detergent
micelles, calculated per total volume of thesystem
LQ]RC concentration of quinone in RC micelles,calculated per total volume of the system
R S/(1 - S) ratio of the slow and fastcomponents of the P+ dark relaxation
S fraction of the slow component of the P+dark relaxation
a partition coefficient characterizing thevacancy of the QB binding site (Eq. Al 1)
p = K/K2 = 1 + K+ constant, characterizingthe strength of the quinone binding at theQB binding site
TAP fast time of P+ dark relaxation, TAP = 1/kAP
Tp slow time of P+ dark relaxation, Tp = l/kp
INTRODUCTION
Photosynthetic reaction centers (RCs) from purple bacteriaare one of the best-studied membrane proteins with well-known function. The structures of RCs from two species,Rhodobacter sphaeroides and Rhodopseudomonas viridis,have been determined precisely by x-ray analysis of crystals(Deisenhofer and Michel, 1989; Allen et al., 1987; El-Kabbani et al., 1991; Ermler et al., 1994; Deisenhofer et al.,1995). The cofactors, bound to the RC, play the role ofnative reporter groups, allowing sensitive monitoring ofstructure-function relationships in the RC. These properties,together with their suitability for molecular biology work,make RCs a useful model for other integral membraneproteins.Of the five essential constituents of isolated RCs-pro-
tein, cofactors, detergent (phospholipids), water, and ions-the function and structural organization of the latter threeare less well studied because of limited information avail-able from x-ray structural analysis, partly because of theirdisordering in the crystals. Knowledge of the interactions ofall of these components is needed for a proper understand-ing of the principal mechanisms of RC functioning. Thestudy of the dynamics of detergent interaction with solubi-lized membrane proteins is also of general importance toour understanding of these systems, and to our ability to usethem as models of native membranes.
RCs have been widely studied in the presence of variousdetergents, of which LDAO (lauryl dimethylamine-N-ox-ide) has been used most frequently (Feher and Okamura,1978). Even though the RC structure has been determined toatomic resolution, current knowledge concerning the inter-action of detergent with RCs is limited, as detergent doesnot form regular structures in the crystals. By measuringneutron diffraction from reaction center crystals with H2O/D,O contrast variation, it was shown that detergent mole-cules fill the available space around the membrane-spanningca-helices (Roth et al., 1989, 1991 ). Different estimates giveabout 200-300 molecules of LDAO bound to the RC (Feherand Okamura, 1978; Gast et al., 1994). This is 3-4 timesmore than the aggregation number (-75) for pure LDAOdetergent micelles (Neugebauer, 1994).
In isolated RCs, after the light-induced electron transferfrom the primary donor (P) to the acceptor quinone complex(QA and QB), the dark reduction of P+ reflects chargerecombination from the reduced acceptor quinones (re-viewed in Shinkarev and Wraight, 1993):
kBP
'i h, kABP QAQB P+QAQB P QAQB (1)
kAl' kBA
where kAP, kAB, etc. are rate constants of electron transferfrom QA to P+, from QA to QB, etc. The direct electrontransfer from QB to P+ (rate constant kBP) is negligible inwild-type RCs from Rb. sphaeroides, and charge recombi-nation from QB occurs by repopulation of QA (Kleinfeld etal., 1984a). The direct transfer will be ignored in this work.The primary quinone, QA, is tightly bound and functions
as a prosthetic group, but the secondary quinone, QB isreadily extracted. When QB is absent, the electron transferPQA P- P~QA occurs with a lifetime (TAP= 1/kAP) of about0.1 s. When QB is present, electron transfer from QA to QBis rapid. QB is very tightly bound and does not dissociate,even on a time scale of minutes. Transfer of the electron toQB slows down the recombination process (re-reduction ofP+) in proportion to the value of the electron transferequilibrium constant (LAB - kAB/kBA):
Tp = TAp(l + LAB) (2)where Tp is the observed time of P+ re-reduction with func-tional QB, and TAP is the lifetime of P+QA recombination.
This formulation, however, is only valid if the QB bindingsite is fully occupied. In general, the binding of QB is notsaturated. Within a micelle, or in the native membrane, theresidence times for both quinone and quinol (in contrast tothe semiquinone) are not more than a millisecond, and thebinding equilibrium is established rapidly from the imme-diate quinone pool, i.e., the membrane in vivo, or from thelocal micelle environment in isolated, detergent-solubilizedRCs. (This is easily deduced from steady-state measure-ments of RC turnover, which requires binding of quinoneand release of quinol, and the known similarity of theirbinding affinities (Wraight, 1982; Crofts and Wraight,1983). Under light-limiting conditions, the turnover time of
2305Shinkarev and Wraight
Volume 72 May 1997
RCs in detergent suspensions has been reported to be about1 ms (Rongey et al. 1993), equivalent to a quinone exchangetime of 2 ms (2e- per quinol reduced), and more recentmeasurements in our laboratory show quinone exchangerates of at least 1 ms- ' (J. W. Larson and C. A. Wraight,unpublished observations).) Taking this into account, thecharge recombination scheme is modified as follows(Wraight, 1981):
PQAQB 2A P+QAQ LAB*-P+QAQB
$KQ KQ (3)
PQA P QAkAP
Here KQ is the dimensionless equilibrium constant of qui-none binding (we assume, for simplicity, that KQ = KQ, i.e.,there is no light-induced effect on quinone binding). KQ =
Kt[Q], where [Q] is the concentration of free quinone insolution. If the quinone pool is rapidly and homogeneouslyavailable to all RCs, the kinetics of P+ re-reduction areexpected to be monophasic, with a lifetime that approachesa limiting slow value as the quinone concentration is raised(reviewed in Shinkarev and Wraight, 1993):
= TAp(1 + LI) (4)
where
Lapp- LABKE$[Q] (S)
AB 1 +K±[Q]
The relationships of Eqs. 4 and 5 can be demonstratedunder certain circumstances (Wraight and Stein, 1983).However, in isolated RCs, with natural isoprenoid quinones,the kinetics are generally biphasic, with a fast phase arisingfrom RCs lacking QB, i.e., P+QX recombination, and a slowphase from RCs with QB present. Qualitatively, this isreadily understandable in terms of a quinone distributionamong micelles, with exchange between micelles beingslow. Nonetheless, the lifetime of the slow component isstill expected to be dependent on the effective quinoneconcentration in the RC micelle, roughly in accordance withEqs. 4 and 5. In fact, the nature and behavior of both phasesare anomalous. In some detergents, the lifetimes of bothphases are quinone concentration dependent, whereas inother detergents neither phase exhibits significant dependence.
Although much characterization of the acceptor quinoneshas been performed on isolated RCs, the underlying behav-ior of the quinone binding equilibrium has never beenquantitatively accounted for. In this work we examine thedependence of electron transfer on quinone binding,through variation of the LDAO concentration, in Rb. spha-eroides RCs. The characteristic time of the slow componentof P+ dark relaxation, observed at low quinone content perRC micelle (at high detergent concentration), is about 1.2-1.5 s, in marked contrast to expectations from the model
component should approach the time of the fast component(about 0.1 s) when [Q] -O 0. To account for this discrep-ancy, as well as other aspects of isolated RC behavior, anew quantitative approach to analyzing the kinetics of elec-tron transfer in detergent-solubilized RCs has been devel-oped, which takes into account known aspects of the RC-quinone binding equilibrium and quinone partitioning intohydrophobic phases. The analysis is in good correspon-dence with a previous model (Wraight and Stein, 1983) forhigh quinone concentration, but differs from it significantlyfor low quinone concentrations. The analytical expressionsderived here are applicable to the experimental methodol-ogy of flash-induced, single turnovers, but the conclusionsare of wider significance for detergent-solubilized mem-brane proteins.
MATERIALS AND METHODS
Conditions for the growth of Rb. sphaeroides cells (wild type, strain Ga,and R26 mutant), as well as isolation of RCs from French press-disruptedcells, were essentially as described by Mar6ti and Wraight (1988).
Absorption changes were measured on a home-made single-beam spec-trophotometer. RCs as prepared had approximately one secondary quinoneper RC and were used with no addition of exogenous quinone. After eachaddition of detergent, the sample was adapted for 5-10 min before mea-surement. All measurements were done at 22°C. Deconvolution of thekinetic curves into two, three, and more exponentials was accomplishedwith the program DISCRETE (Provencher, 1986). Deconvolution of thekinetic curves into two exponential components revealed smooth depen-dencies of the observed times (of about 1 s and 0.1 s) on variableparameters, such as detergent or quinone concentration. Attempts to de-convolute the experimental curves into three exponential components ledto irregular dependencies of the observed times and amplitudes on variableparameters. Therefore we limited the deconvolution of the experimentalcurves to two exponential components (plus a constant). All calculationswere made on the software "GIM" (Dr.Achev Development, Tempe, AZ).
RESULTS
Effect of detergents on P+ dark relaxation
Fig. 1 shows the kinetics of absorption changes at 430 nm(reflecting changes of P+) at different LDAO concentra-tions. The addition of LDAO leads to progressive changesin the kinetics of the dark relaxation of P+. Deconvolutionof the kinetic curves usually revealed two exponential com-ponents with times of a few hundred milliseconds (slowcomponent) and -100 ms (fast component). The relativeamplitudes of the two phases were clearly dependent on theLDAO concentration.
Fig. 2 shows the time and relative amplitude of the fastand slow components of the P+ dark relaxation as a functionof LDAO concentration added to the sample. The time ofthe fast component is almost independent of the LDAOconcentration (Fig. 2 A). The relative amplitude of the fastcomponent increases significantly as the concentration ofLDAO increases (Fig. 2 B). The behavior of the time of theslow component at very low LDAO concentrations is noveland somewhat unexpected. We believe it is associated withaggregation of the RCs, and we will address it in a subse-
2306 Biophysical Journal
(see Eqs. 4 and 5), according to which the time of the slow
Interaction of Quinones with Reaction Centers
E, 0.6ND
CI
bc 02
0.0-
-02
FIGURELDAO-RC(0, 0.0049increasing7.5. The c
quinone wEven at thdecrease ii
quent pathe slowwhereastially. TIthe crit(HemelrThe Ic
detergenbe signi
1.0
3:
A
P. . .m ..
in" - v v
0.0 0.2 0.4 0.6 0.8 1.0
LDAO, %
0.8-
VN 0.6-
0
-0 0.4-
E
0.2-
IU0
UmU
VU
VV
VVVv
B
vv
V
V
U
.
..
I ,I, II.I..10.0 0.2 0.4 0.6 0.8 1.0
LDAO, %
kAP LAB
PQAQB(Q)n- <- P QAQB(Q)n-I " >P QAQB-(Q)n-1$ KQ(n) $ KQ(n)
PQA(-.. )(Q)n ( P QA(-.. *)(Q)nkAP
(6)where (Q)n indicates the free quinones (i.e., not bound to theQB binding site) within an RC micelle containing a total ofn quinones. (...) denotes the vacant QB binding site. Thedimensionless equilibrium constant of quinone binding isassumed to be proportional to the total number of secondaryquinones per RC micelle, n (n = 1, 2, 3, etc.):
[PQAQB(Q)n-1] +KQ(n PQA(...)(Q)n] I:= KQ
FIGURE 2 (A) Dependence of the time (in seconds) of the slow (-) andfast (V) components of P+ dark relaxation on LDAO concentration in Rb.sphaeroides RCs. (B) Dependence of the relative amplitudes of the slow(a) and fast (V) components of P+ dark relaxation on LDAO concentra-tion. Conditions are as in Fig. 1.
(7)
KQ is a (dimensionless) intramicellar association constantfor quinone binding. (In a homogeneous solution, the freequinone concentration is established by the average binding
-M
2.0-
1.5-
cn
-o01.0-
ciiE
0.0-
Shinkarev and Wraight 2307
detergent micelles, is in sharp contrast to simple homoge-neous models of the quinone-reaction center interaction(reviewed in Shinkarev and Wraight, 1993), according towhich decreasing the quinone concentration should reducethe time of the slow component to that of the fast compo-nent (about 0.1 s) as [Q] -> 0. This behavior of the darkrelaxation of P870+ at low quinone concentrations requiresreevaluation of the current descriptions.
DISCUSSION
Scheme of reactions. Apparent equilibriumconstant of electron transfer between QA and QB
o 50 1000 1500 As a result of exchange of quinones between differentTime, msec micelles, there exist two different types of RC micelles: 1)
1 Kinetics of the P+ dark relaxation measured at 430 nminwithout quinone (except QA): 2) with one or more quinones
-s of Rb. sphaeroides at different added LDAO concentrations in excess of QA. (All references to "quinone" in this analysis0.015, 0.03, 0.049, 0.073, 0.12, 0.22, 0.31, 0.47, 0.68, 0.89%), are to secondary or pool quinone, and do not include QA,from top to bottom. Incubation medium: 50 mM HEPES, pH which is presumed to be present in and tightly bound to allconcentration of reaction centers was 2.5 tkM. No exogenous RCs.) This is the underlying origin of the biphasic kineticsras added. All curves are normalized to 1 to account for dilution. of P+ re-reduction. As outlined in the Introduction, how-e highest concentrations of detergent, there was no measurablen signal amplitude beyond the dilution effect. ever, the kinetics of the slow phase are expected to vary
with quinone concentration, in contrast to the observedbehavior. To understand the nature of the problem let us
tper. Above -0.02% LDAO, however, the time of assume, first, that the dark relaxation of P+ occurs fasterphase is almost constant, decreasing only slightly than redistribution of quinones between RC micelles andthe amplitude of the slow phase decreases substan- detergent micelles. (The term "RC micelle" will be taken tohis concentration is close to a recent value given for mean a mixed micelle of RC protein and detergent.):ical micelle concentration (CMC) for LDAO In the microscopic two-phase system, with slow quinoneijk et al., 1995). exchange between micelles, the controlling variable for therng time of the slow phase (1.2-1.5 s), even at high electron transfer equilibrium is the number, n, of secondary/It concentrations, where the quinone is expected to pool quinone molecules in a RC micelle. Quinone bindingficantly diluted in the hydrophobic phase of the at the QB binding site of a particular micelle with n quinone
molecules can then be described by a scheme similar to Eq.
Volume 72 May 1997
to many RCs:
konRC + Q >RCQB
koffRCQB >RC + Q
In a micelle with one RC, it is not. As a first approximationwe take the on rate as proportional to n, the total number ofquinones present in the RC micelle. Thus the overall bind-ing equilibrium constant, KQ(n), will also be proportional ton.)
Using Eq. 6, which neglects direct electron transfer fromQB to P+, and taking into account 1) fast electron exchangebetween QA and QB, and 2) fast exchange of quinonebetween binding site and RC micelle, we can write thefollowing expression for the rate constant of the dark relax-ation of P+ in RC micelles with n quinones:
k) kAp(l + KQ n) kAP(IP 1 +(1+ LAB)KQ n 1 +LAB(n)
correspond to the slow components of the P+ dark reduction(Eq. 6).
Equation 11 clearly shows that there is more than oneslow component of the P+ dark relaxation:
P (slow) = ple kp(l)t + p2e-kp(2)t + (12)
and it follows that a one-exponential approximation for theslow phase of P+ dark relaxation has sense only when allkp(i), i 2 1, are close to each other. Current analyses ofelectron transfer in RCs make the following single-expo-nential approximation:
P+(slow) e-kp((n))t(pI + P2 + .) (13)
where (n) is the average number of quinones per RC mi-celle, (n) = [Q]RC/[RC]; [Q]RC is the concentration ofquinone in RC micelles, calculated per the whole volume ofthe system, and kp((n)) is given by (compare with Eqs. 8 and9)
(8)
wherewhere
L pp(n) - LABK<1B + K~. fl (9)
is the apparent equilibrium constant of electron transferbetween QA and QB, which depends on the quinone anddetergent content of the RC micelle. (In principle, one canexpect KQ to be dependent on the amount of detergentassociated with the RC, and this may account, in part, forthe anomalous behavior seen at very low detergent concen-trations (Figs. 1 and 2). In the region considered here,however (.0.02% LDAO), we assume that the detergent-binding capacity of the RCs is saturated.)
Equation 8 can be rewritten for lifetimes (Tp = l/kp,TAP l/kAP) as follows:
Tp(n) = TAp(1 + LAs(n)) =TAP + l+ K )n (10)
Kinetics of P+ dark relaxation
In the limit of slow redistribution of quinones between RCmicelles and detergent micelles, the kinetics of P+ are givenby the sum of terms, each of which corresponds to adifferent number of quinones (0, 1, 2, ... ) in the RCmicelle:
P+ = poe-kP(O)t + ple-kp()t + p2e-kp(2)t + . (11)
Here kp(0), kp(l), etc. are the rate constants of dark reduc-tion of P+ in RC micelles with zero, one, etc. quinones perRC in excess Of QA' given by Eq. 8; pi is the fraction of RCmicelles with i quinones. It is evident that the rate constant
kp(0) corresponds to the fast phase of the P+ dark reduction(PQ kAP P+QA), whereas rate constants kp(l), kp(2), etc.
k(In)) - kAPkAB- 1 + LAPB((n~)
LAP ((n)) = LpK}(n)1B + (n
(14)
(15)
(Although Eqs. 8 and 14 look very similar, there is a verybig difference between them. Equation 8 is the exact ex-pression for the particular fraction of RCs with n quino-nes-the whole P+ decay kinetics would involve a sum ofsuch terms over n. Equation 14 is the one exponentialapproximation for all fractions, with (n) as the averagenumber of quinones (see also Eq. 13 for a definition). Asimilar comment applies to Eq. 17, except for the use of(n):'.) As discussed below, this expression is adequatewhen the average number of quinones per RC micelle issignificantly greater than 1. However, it predicts that kpapproaches the rate constant kAp, as the average number ofquinones approaches zero. This conclusion is directly con-tradicted by experimental observations, as represented bythe data in Fig. 2.
Average number of quinones per RC micelle inthe fraction that has at least one quinone per RC
To address the contradiction encountered at low quinoneconcentrations, we must take into account that the slowcomponent of P+ dark relaxation is observed only in thoseRCs that have one or more quinones per micelle. Thus wemust consider the average number of quinones averagedonly over those RC micelles that have at least one quinone:
[Q]RC [Q]RC/[RC] (n)( [RC]'- [RC]1I/[RC] p(at least one quinone)
(16)
2308 Biophysical Journal
Interaction of Quinones with Reaction Centers
3C)a) < >>10)
<1
0 1 2 3Number of quinones per RC
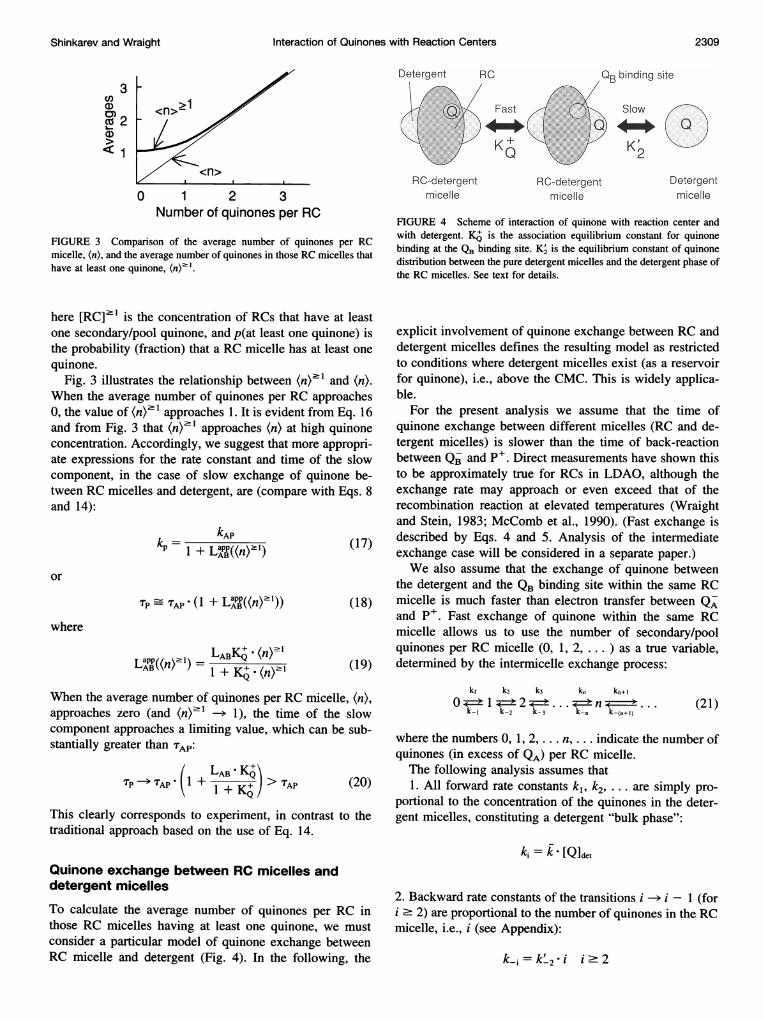
FIGURE 3 Comparison of the average number of quinones per RCmicelle, (n), and the average number of quinones in those RC micelles thathave at least one quinone, (n)2.
here [RC] ' is the concentration of RCs that have at leastone secondary/pool quinone, and p(at least one quinone) isthe probability (fraction) that a RC micelle has at least onequinone.
Fig. 3 illustrates the relationship between (n)2 and (n).When the average number of quinones per RC approaches0, the value of (n)21 approaches 1. It is evident from Eq. 16and from Fig. 3 that (n)>l approaches (n) at high quinoneconcentration. Accordingly, we suggest that more appropri-ate expressions for the rate constant and time of the slowcomponent, in the case of slow exchange of quinone be-tween RC micelles and detergent, are (compare with Eqs. 8and 14):
kAP1 + LA((n) ) (17)
or
Tp TAP- (1 + LaPP((n)')) (18)where
LABKQ - (np'Lapp((n)21) = (n(19)
When the average number of quinones per RC micelle, (n),approaches zero (and (n)>l-> 1), the time of the slowcomponent approaches a limiting value, which can be sub-stantially greater than TAP:
TP >TAP'(1 + LAB KQ) >TAP (20)
This clearly corresponds to experiment, in contrast to thetraditional approach based on the use of Eq. 14.
Quinone exchange between RC micelles anddetergent micelles
To calculate the average number of quinones per RC inthose RC micelles having at least one quinone, we mustconsider a particular model of quinone exchange betweenRC micelle and detergent (Fig. 4). In the following, the
Detergent RC QB binding <
Fast Slow
K2...
RC-detergentmicelle
RC-detergenmicelle
site
Detergentmicelle
FIGURE 4 Scheme of interaction of quinone with reaction center andwith detergent. KA is the association equilibrium constant for quinonebinding at the QB binding site. K' is the equilibrium constant of quinonedistribution between the pure detergent micelles and the detergent phase ofthe RC micelles. See text for details.
explicit involvement of quinone exchange between RC anddetergent micelles defines the resulting model as restrictedto conditions where detergent micelles exist (as a reservoirfor quinone), i.e., above the CMC. This is widely applica-ble.
For the present analysis we assume that the time ofquinone exchange between different micelles (RC and de-tergent micelles) is slower than the time of back-reactionbetween Q- and P+. Direct measurements have shown thisto be approximately true for RCs in LDAO, although theexchange rate may approach or even exceed that of therecombination reaction at elevated temperatures (Wraightand Stein, 1983; McComb et al., 1990). (Fast exchange isdescribed by Eqs. 4 and 5. Analysis of the intermediateexchange case will be considered in a separate paper.)We also assume that the exchange of quinone between
the detergent and the QB binding site within the same RCmicelle is much faster than electron transfer between QAand P+. Fast exchange of quinone within the same RCmicelle allows us to use the number of secondary/poolquinones per RC micelle (0, 1, 2, . . . ) as a true variable,determined by the intermicelle exchange process:
k1 k2 k3 kn k.+I
0k I2 2.. .n('. .
k-I k-2 k-3 k-n k-(n+ 1)(21)
where the numbers 0, 1, 2, ... n, ... indicate the number ofquinones (in excess of QA) per RC micelle.The following analysis assumes that1. All forward rate constants k1, k2, . . . are simply pro-
portional to the concentration of the quinones in the deter-gent micelles, constituting a detergent "bulk phase":
ki = k [Q]det
2. Backward rate constants of the transitions i -> i - 1 (fori . 2) are proportional to the number of quinones in the RCmicelle, i.e., i (see Appendix):
k-i=k'2*i i.2
Shinkarev and Wraight 2309
it
Volume 72 May 1997
3. The backward rate constant k-I is different from k' 2because of the binding of quinone at the QB binding site (seeAppendix):
(I)a)0)
The presumption that the backward rate constants (kj) areproportional to the number of quinones in the RC micellerepresents a limiting case of "weak binding" or low occu-pancy of the QB site. The opposite case of strong binding atthe QB site, where k-i = k' 2 *(i-1), i . 2, is outlined inthe Appendix. As shown below, the situation for LDAO-solubilized RCs lies between these limiting cases, but theweak binding formalism gives good agreement and is sim-ple to handle.
Equation 21 can now be reformulated as (see Appendix)
k[Q] k[Q] k[Q] k[Q] k[Q]0 --*'2s ... 'n '...
IC2/0 +KQ) 2kS2 3142 nk2 (n+ 1)k 2
(22)
The RC micelle transitions of Eq. 22 can also be repre-sented using only equilibrium constants:
K, K2/2 K2/3 K2/n K2/(n+ 1)
0()I1 < >2 )>3. ..< >n< >.. . (23)
Both equilibrium constants, K1 and K2, are proportional tothe quinone concentration in detergent micelles:
where p = 1 + KQ.We can now use Eq. 23 to calculate the average number
of quinones per RC ((n)), as well as the average number ofquinones in those RC micelles that have at least one quinone((n)t).
Calculation of (n) and (n)21 for Eq. 23
As shown in the Appendix, the average number of quinonesper RC micelle for Eq. 23 is
pK2eK2 f pK2(1 + K2) K2<< 1
( ) 1 + p(eK2 -1) K K2>>1(25)
Note that the average number of quinones per RC dependson both K2 (involving partitioning between RC micelle anddetergent) and KQ. (involving equilibrium between the QBbinding site and the detergent of the same RC micelle). Fig.5 shows the dependence of the average number of quinonesper RC, (n), on the equilibrium constant K2 for differentvalues of KQ.
4
3
2
1
0
0 1 2 3 4
K2
FIGURE 5 Dependence of (n), the average number of quinones per RC,on the quinone distribution constant K2 as a function of the associationconstant KY, calculated from Eq. 25. Values of KA from bottom to top are0, 1, 3, 7, 15, 31, 63. The dashed line represents the dependence of (n)'',the average number of quinones per RC in those RCs that have at least onequinone, on K2, calculated from Eq. 26.
The average number of quinones per RC micelle for Eq.23, calculated for those RC micelles that have at least onequinone per RC, is (see Appendix)
K2(n)" = -K2 (26)
Fig. 5 (dashed line) shows the dependence of (n)' on K2.Note that (n)2' depends only on K2 and does not depend onKQ. One can see that (n) approaches (n)2' as the bindingconstant KQ is increased. It is also evident from Eqs. 25 and26 and Fig. 5 that when K2 -- 0 (e.g., [Q]det -> 0), theaverage number of quinones per those RC micelles contrib-uting to the slow phase of the P+ dark reduction, (n)2,approaches 1, while the value of (n) approaches 0, with aslope depending on the value of KQ.
It is noteworthy that a formally similar expression isobtained on the basis of a Poisson distribution of quinonesbetween different RC micelles, which presumes no specificaffinity for quinone at the QB binding site and equal distri-bution between RC micelles and pure detergent micelles(see Appendix):
(n) = ln(n)(nI - e (n (27)
Approximations for the rate constant of P+ darkrelaxation and apparent equilibrium constant LABPThe similarity of Eqs. 26 and 27, the equivalence of (n) andK2 for large K2 (Fig. 5, Eq. 25), and the independence of(n) 1 from KQ (Eq. 26) lead us to suggest the use of Eq. 27for estimating (n)2' instead of the correct Eq. 26. (This isimportant from an experimental point of view, as the aver-age number of quinones per RC is easier to measure and to
2310 Biophysical Journal
k-I = k-l2/(l + K.)
Interaction of Quinones with Reaction Centers
A\C:V
0)
Differences
0
0 1 2 3K2
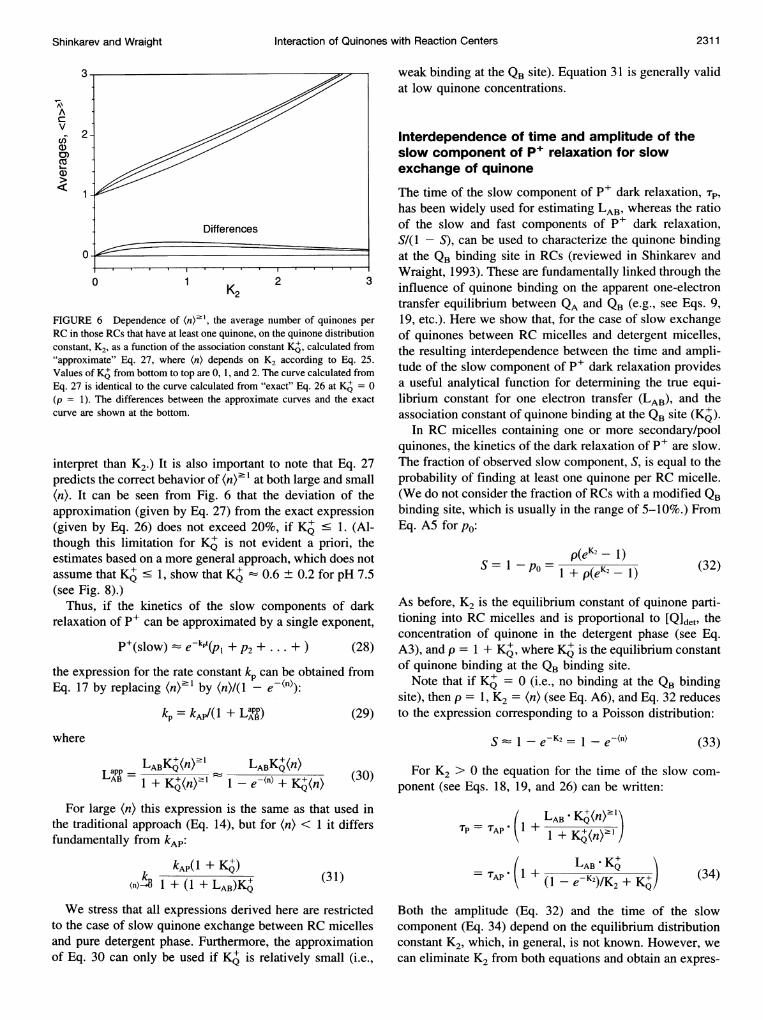
FIGURE 6 Dependence of (n)"1, the average number of quinones perRC in those RCs that have at least one quinone, on the quinone distributionconstant, K2, as a function of the association constant K4, calculated from"approximate" Eq. 27, where (n) depends on K2 according to Eq. 25.Values of KA from bottom to top are 0, 1, and 2. The curve calculated fromEq. 27 is identical to the curve calculated from "exact" Eq. 26 at KQ = 0(p = 1). The differences between the approximate curves and the exactcurve are shown at the bottom.
interpret than K2.) It is also important to note that Eq. 27predicts the correct behavior of (n)2 1 at both large and small(n). It can be seen from Fig. 6 that the deviation of theapproximation (given by Eq. 27) from the exact expression(given by Eq. 26) does not exceed 20%, if K C 1. (Al-though this limitation for KQ is not evident a priori, theestimates based on a more general approach, which does notassume that KQ . 1, show that KQ 0.6 ± 0.2 for pH 7.5(see Fig. 8).)
Thus, if the kinetics of the slow components of darkrelaxation of P+ can be approximated by a single exponent,
P+(slow) = e-kpt(p + P2 + ...+ ) (28)
the expression for the rate constant kp can be obtained fromEq. 17 by replacing (n)"' by (n)/(1 - e- W):
kp = kAp/(1 + LAPP) (29)
weak binding at the QB site). Equation 31 is generally validat low quinone concentrations.
Interdependence of time and amplitude of theslow component of P+ relaxation for slowexchange of quinone
The time of the slow component of P+ dark relaxation, Tp,has been widely used for estimating LAB, whereas the ratioof the slow and fast components of P+ dark relaxation,S/(1 - S), can be used to characterize the quinone bindingat the QB binding site in RCs (reviewed in Shinkarev andWraight, 1993). These are fundamentally linked through theinfluence of quinone binding on the apparent one-electrontransfer equilibrium between QA and QB (e.g., see Eqs. 9,19, etc.). Here we show that, for the case of slow exchangeof quinones between RC micelles and detergent micelles,the resulting interdependence between the time and ampli-tude of the slow component of P+ dark relaxation providesa useful analytical function for determining the true equi-librium constant for one electron transfer (LAB), and theassociation constant of quinone binding at the QB site (KQ).
In RC micelles containing one or more secondary/poolquinones, the kinetics of the dark relaxation of P+ are slow.The fraction of observed slow component, S, is equal to theprobability of finding at least one quinone per RC micelle.(We do not consider the fraction of RCs with a modified QBbinding site, which is usually in the range of 5-10%.) FromEq. A5 for po:
p(eK2 - 1 )S= 1 -Po= 1 +p(eK2- 1) (32)
As before, K2 is the equilibrium constant of quinone parti-tioning into RC micelles and is proportional to [Q]det, theconcentration of quinone in the detergent phase (see Eq.A3), and p = 1 + KQ, where K+ is the equilibrium constantof quinone binding at the QB binding site.
Note that if KQ = 0 (i.e., no binding at the QB bindingsite), then p = 1, K2 = (n) (see Eq. A6), and Eq. 32 reducesto the expression corresponding to a Poisson distribution:
where (33)
LABKZ(n)' LABKZ(n)1 + KQ(n)' 1 -(n) + KQ(n) (
For large (n) this expression is the same as that used inthe traditional approach (Eq. 14), but for (n) < 1 it differsfundamentally from kAp:
For K2 > 0 the equation for the time of the slow com-ponent (see Eqs. 18, 19, and 26) can be written:
I + KQ (n)-'
k kAP(I +KK)(n)4 1 + (1 + LAB)KQ (31)
We stress that all expressions derived here are restrictedto the case of slow quinone exchange between RC micellesand pure detergent phase. Furthermore, the approximationof Eq. 30 can only be used if K6 is relatively small (i.e.,
=A(1 ± LAB ;K\\AP- (1- e-K2)/K2 + KQ~ (34)
Both the amplitude (Eq. 32) and the time of the slowcomponent (Eq. 34) depend on the equilibrium distributionconstant K2, which, in general, is not known. However, wecan eliminate K2 from both equations and obtain an expres-
Shinkarev and Wraight 2311
S .-. I e-K2 = I e-(n)
Volume 72 May 1997
sion describing the dependence of the time of the slowcomponent on the fraction of slow component:
Tp f(S; LAB, KQ)This equation contains two parameters: the "true" equilib-rium constant of electron transfer between QA and QB, LAB,and the intramicellar equilibrium binding constant, KQ.
Using the notation R = S/(1 - S) for the ratio of the slowand fast components, we have from Eq. 32
K, = ln(1 + Rlp) (35)
1 -e-K = Rf(R +p) (36)
Inserting Eqs. 35 and 36 into Eq. 34 gives
TP TAP LP - LAB KQTAP AB -(R/(R + p))/ln(1 + Rlp) + K (
(TAP is usually nearly constant over a wide range of differentconditions. Thus the ratio (Tp - TAP)/TAP is frequently afunction of Tp only.) This equation describes the relation-ship between the observed time, Tp, and the observed frac-tion of the slow component of P+ reduction, S = R/(R + 1).The limits of the relationship between TP and S are:For S 0 (R -- 0),
(TP - TAP)/TAP -LAB KSIl+K+
or
TP TAP ( 1
20
C
CZ,c 15
100a
B
-0
.5
0
Q-
a)
0 0.5 1Fraction of slow component
LAB - KQ+ +
20 B
U,
o 150
E -
.t
-0i:-, 10 - =-a) -
a)C 5 -.0-
0-
O- . .
0 0.5 1Fraction of slow component
FIGURE 7 Theoretical dependence of LAPP = (p- TAP)/TAP, the ap-parent equilibrium constant of electron transfer between QA and QB, on thefraction of the slow component, calculated from Eq. 37, corresponding to
the case of weak quinone binding at the QB binding site ( ), and Eqs.A2 1 and A22, corresponding to the case of strong quinone binding at theQB binding site (- ). (A) Dependence on the quinone binding constantKQ (with equilibrium constant LAB = 20). The values of KQ from top to
bottom are 5, 2, 1, and 0.5, respectively. (B) Dependence on equilibriumconstant LAB (with quinone binding constant KQ = 0.5). The values of LABfrom top to bottom are 25, 20, 15, 10, and 5, respectively.
For S 1 (R -> oo),
(Tp - TAp)/TAp LAB
or
TP TAp' (I +LAB)
(40)
(41)
Fig. 7 shows the theoretical dependence of the apparentequilibrium constant, LAPP = (TP-TAP)/TAP on the fractionof slow component, S, given by Eq. 37 for different LAB andKQ. One can see that L'PP is very sensitive to both K<; (Fig.7 A) and LAB (Fig. 7 B). Note, however, that the relationshipbetween LapP and S is quite flat over much of the range.Even as S approaches 0, Lapp is significant, reflecting thefact that one quinone in an RC micelle is substantiallydifferent from none. As S increases, LaPP responds onlyweakly until S reaches about 0.8. The final dependence, asS approaches 1 and LAPB approaches its limiting value ofLAB, is very steep.
Fig. 8 shows (Tp -TAP)/TAP as a function of the fractionof slow component, using experimental data, includingthose of Fig. 2. The dependence of (Tp -TAP)/TAP on S ischaracterized by two parameters, LAB and KQ. Using non-linear regression, we determined that LAB - 22 + 3 and KQ= 0.6 + 0.2. The experimentally observed dependence ofthe apparent equilibrium constant on the fraction of slow-component wild-type Rb. sphaeroides RCs is relativelyweak. However, the fits are very sensitive to this plateaurange of the data (see Fig. 7). Furthermore, the procedurehas general significance and can also be used for mutantRCs or RCs from other species, as well as for differentdetergents under different conditions, such as lower tem-perature, pH, and salt.
It should be noted that the "true" value of LAB may not bereadily apparent from easily achievable values of the slowphase amplitude. Thus, even at S = 0.8, indicating 80% of
B 15-5-
c
-I
0.0 1.00.5
Fraction of slow component
FIGURE 8 Experimental dependence of (TP -TAP)/TAP (= LAPP) on thefraction of the slow component of P+ dark relaxation in Rb. sphaeroidesRCs, obtained by changing the LDAO concentration. Conditions are as inFig. 1. The data points are fitted to Eq. 37, with LAB = 22 and KQ = 0.6.
U
21) I
(
2312 Biophysical Journal
Interaction of Quinones with Reaction Centers
the RC micelles have at least one quinone, L P'P is barelyhalf the limiting value of LAB. This is consistent with K6 =0.6, implying that 1.6 quinones per micelle are required forhalf-saturation Of QB binding, whereas a single quinonequalitatively converts the P+ recombination kinetics fromfast to "slow."
Analysis of derived LAB and KQ values
Our value of LAB 22 is 40-60% higher than previouslyreported values based on the kinetics of P+Q- chargerecombination (Mancino et al., 1984; Kleinfeld et al.,1984a; McComb et al., 1990). However, it is in goodagreement with the estimate of Arata and Parson (1981)from the integrated yield of emission of delayed fluores-cence from an excited singlet state formed by recombinationof P QB-A higher value of LAB for Q-10 as QB, is also in very
good agreement with those obtained for Q-0, an unpreny-lated water-soluble analog, when extrapolated to saturatingconcentrations (McComb et al., 1990; Wraight and Stein,1983). A lower value for Q-0, reported by Kleinfeld et al.(1984b), was determined at a single, subsaturating concen-tration. The apparent difference between Q-0 and prenyl-ubiquinones has been discussed in terms of the relativecontributions of the quinone headgroup and prenyl tail inestablishing binding interactions with the RC protein (Mc-Comb et al., 1990; Warncke et al., 1994). It is clear that,because of its water solubility, Q-0 approaches saturation ina simple, hyperbolic fashion (Wraight and Stein, 1983). Itnow seems that the distribution of hydrophobic prenyl-quinones in the microscopic two-phase system can depressthe measured value of LAB for these compounds.The good agreement with the value of LAB obtained by
Arata and Parson (1981) may arise from the fact that thedelayed fluorescence is integrated over the lifetime of theP+Q- decay, which will minimize the error in the relativecontribution of the slow phase kinetics.The difficulty in achieving saturation at the QB binding
site, in detergent-solubilized RCs, has important implica-tions for the interpretation of effects imputed to changes inLAB. For example, the pH dependence of the P+QB recom-bination kinetics has been taken to reflect pH dependence ofthe electron transfer equilibrium constant, LAB. This is onlyvalid as long as the QB binding site is saturated, otherwisethe pH dependence is indicative only of LAPP. The contri-butions of LAB and KA cannot then be distinguished unlessthe quinone concentration dependence is measured andtaken into account. Similar caveats apply to the interpreta-tion of mutational effects on LAB. In a site-directed mutantof Rb. sphaeroides (TyrL222_>Phe), we have previouslyreported that the pH dependence of QB function is entirelydue to changes in KQ, rather than LAB (Takahashi et al.,1990). Furthermore, when contributions for KQ and LAB areseparated, similar behavior is evident in wild-type RCs forboth Q-0 and Q-10 (C. A. Wraight, unpublished observa-
tions), casting some doubt on current analyses of the cou-pled proton and electron transfer processes of the acceptorquinones (reviewed in Okamura and Feher, 1992, 1995;Shinkarev and Wraight, 1993). A strong pH dependence ofquinone binding was also reported for RCs of Chromatiumminutissimum (Shinkarev et al., 1991).
Quinone partitioning between RC anddetergent micelles
The model presented here includes two different equilibriainvolving quinone molecules (see Fig. 4): fast equilibriumbetween the QB binding site and detergent phase inside theRC micelle (equilibrium constant Ks), and slow exchangebetween RC and detergent micelles (equilibrium constant,Ks). The derived relationship between Tp and S (Eq. 37)depends only on K+, but K , and hence the partition coef-ficient for quinone between the RC and detergent micelles,can also be determined. As a first indication, we note thatthe value of K+ = 0.6 is equivalent to 1.6 quinones per RCmicelle. With about 300 LDAO molecules per RC, thisequates to a mole fraction 1/200 (quinone: detergent +quinone). This appears to be substantially weaker bindingthan that indicated by the quinone content on a total deter-gent phase basis, e.g., in 0.1% LDAO the dissociationconstant for Q-10 binding to the QB site is approximately1/2600 (McComb et al., 1990). However, proper compari-son of these values, to yield a partition coefficient forquinone equilibrium between RC and detergent micelles,requires knowledge of the relative micelle concentrationsand volumes, and must be based on quantitations of the freequinone concentrations.
K' can, in fact, be determined directly from the depen-dence of the fraction S of the slow component of the P+dark relaxation on the quinone concentration. According toEq. 32 we can write
or
Sp(eK2- 1) = 1 -S
K2= ln(1 + p(1 S))
(42)
(43)
Using the estimated value for KQ 0.6, we have p = 1 +K -1.6. Hence, at S = 0.5,
(K2)0.5 = K2([Q]det)o.5 0.5 (44)When all concentrations are based on the total (aqueous)
volume of the sample, the total quinone concentration,[Q]tot, is the sum of the quinone concentrations in thedetergent phase, [Qidet, and in the RC micelles, [Q]RC:
[Q]tot = [Q]det + [Q]RC = [Q]det + (n)[RC] (45)
[Q]tot can be estimated from the amplitude of the slow phaseat zero added detergent, when all of the quinone is associ-
Shinkarev and Wraight 2313
Volume 72 May 1997
ated with RC micelles ([Q]0to = [Q]RC). From Fig. 2, S =0.8, meaning that 80% of all RC micelles have at least onequinone. The average quinone content of these RC micelles(see Eq. A6) is
pK2eK2(n) = 1 + p(eK2 -1) (46)
At S = 0.8, with p = 1.6, we find from Eq. 43 that (K2)0.8= 1.25. Hence, from Eq. 46, (n)0.8 = 1.4, i.e., 1.4 Q per RC.With [RC] = 2.5 ,uM, the total quinone concentration is[Q]tot = 1.4 X 2.5 = 3.5 ,uM. This distribution of quinoneis in excellent agreement with the relationship between Sand quinone content, determined by extraction and chemicalassay (Okamura et al., 1982).At half-saturation of the slow phase amplitude (S = 0.5),
half of the RC micelles have at least one quinone. Followingthe same procedure, we find that (n)05 = 0.63. So (IQ]RC)O05= 0.63 X 2.5 = 1.6 jiM and ([Q]det)0.5 = [Qtot-([Q]RC)O.5 = 3.5 - 1.6 = 1.9,M.The concentration of free quinone in the RC micelles,
[Q]frece, can be determined for Eq. A9, using the approxi-mation of replacing the average of a function by the func-tion of the average (>opkf(k) f((n)); see also next sec-tion). Hence,
[Q]free [RC] *(l+K(n)_+ ((n) -1)K +(n)K+(47)
For S = 0.5, (n)05 0.63 and ([Q]fRC ).5 0.9 ,uM.We can now determine the partition coefficient, defined
as
[Q]f[ee C [QIRC [Det]rmic (48)[Q]det/IDet]mic [Q]tndet [RC]
where [Det]Rc and [Det] are the concentrations of detergentin RC and detergent micelles, respectively, and nRCt = 300is the number of molecules of detergent per RC micelle(Roth et al., 1989, 1991; Gast et al., 1994, 1996; Hemelrijket al., 1995). [Det]mic can be obtained from the detergentconcentration in excess of the CMC. S = 0.5 is reached atan added detergent concentration of 0.17% (see Fig. 2), or7.4 mM LDAO. With a CMC between 1 and 2 (Hemelrijket al., 1995), [Det]mic = 5.4-6.4 mM, which we round to 6mM. With these values in Eq. 49, we can evaluate thepartition coefficient, Kp = 4 ± 1. Thus RC micelles adsorbthe quinone better than the detergent phase, although notstrongly. This may reflect a greater hydrophobicity due, forexample, to the nature of the membrane-spanning domain ofthe RC, or to the greater size of the RC micelle. The LDAOmolecule is quite small (12 carbons), and it is easy toimagine that the long (50 carbons) and very hydrophobicisoprene side chain of the quinone is not readily accommo-dated in a detergent micelle.
0.1 Ca)DC/) U
CZ CO
B'. <n>=O.1m0 0
0 1 2 3
Time, seca)COCn-C
0-
+0
0
Time, sec
.5
<n>=0.5
0 - --
0 1 2 3
Time, seca)
Q-Co0.10
+0FD
Time, sec
FIGURE 9 Time dependence of the P+ dark relaxation calculated forthree different models as a function of the average number of quinones perRC, (n), assuming that LAB = 20, KQ+ = 0.6, kAp = 10. , "Exact"description of the P+ dark relaxation as the sum of exponential terms:P+(slow) = p,e-kp(I)t + p2e- kp(2)t + . . . + p8e-kp(8)t, where each pi iscalculated from the Poisson distribution: pi = ((n)1e-<11i!). Values of kp(n)are calculated using Eq. 8. -- -, Approximate description of the P+ darkrelaxation as a single exponential on the basis of the "discrete" modelproposed here: P+(slow) = e-kP((n> n)t(PI + P2 + . . . + P8)' where each pis calculated from the Poisson distribution; kp((n)"1) is given by Eq. 29. ,--.Description of the P+ dark relaxation as a single exponential on the basisof the traditional "continuum" approach: P+(slow) = e -kP((n)t(pI + P2 +P8)O where each pi is calculated from the Poisson distribution; kp((n)) iscalculated from Eq. 14. Note different ordinate scales at the lower valuesof (n).
Why the traditional approach fails to describe thekinetics of P+ dark relaxation at lowquinone content
The traditional approach, which explicitly or implicitly ap-plies homogeneous kinetics to the description of P+ darkrelaxation, fails drastically at low quinone concentration(see Fig. 9, dotted line). The main reason for this is that thereal physical system, established by quinone distribution, isdiscrete, i.e., the number of quinone molecules in a partic-ular RC micelle changes only by integral steps, 0, 1, etc.This cannot by analyzed by continuum methods. Thus theactual quinone content in a particular RC micelle may jump,for example, from 1 to 0, without attaining any intermediatevalues, but the traditional approach, based on bulk phasequinone concentrations (or average numbers of quinonesper RC), assumes that the quinone content in the RC micelledecreases continuously from 1 to 0. The relative error inapplying the continuum approach is less the larger thenumber of quinones per RC, but can be very high if theaverage number of quinones per RC is close to zero. Ex-perimentally, it is evident that, whereas the average numberof quinones per RC can change continuously, the kinetics ofP+ dark relaxation do not. In Rb. sphaeroides, the rates ofP+ dark reduction without quinone (v- 0.1 s) and with one
quinone (T- 1 s) differ 10-fold. The observed time of the
2314 Biophysical Journal
Interaction of Quinones with Reaction Centers
slow component is determined by the equilibrium constantLAB. In other species or in mutant strains, LAB can be muchlarger than in wild-type Rb. sphaeroides. In such cases, thedifference between the traditional (continuum) and newdescriptions can be more than two orders of magnitude.The difference between the new and traditional ap-
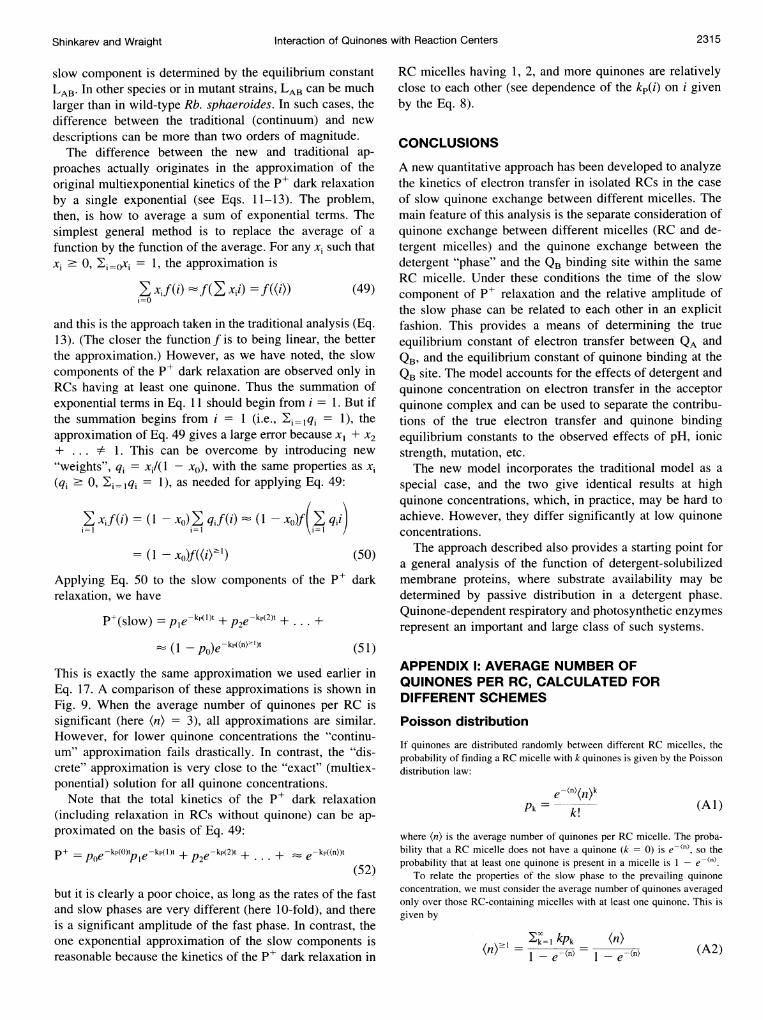
proaches actually originates in the approximation of theoriginal multiexponential kinetics of the P+ dark relaxationby a single exponential (see Eqs. 11-13). The problem,then, is how to average a sum of exponential terms. Thesimplest general method is to replace the average of afunction by the function of the average. For any xi such thatxi 0O, Ei=cx - 1, the approximation is
Exif (i):: f( xii) = f ( i)(49)i=O
and this is the approach taken in the traditional analysis (Eq.13). (The closer the functionf is to being linear, the betterthe approximation.) However, as we have noted, the slowcomponents of the P+ dark relaxation are observed only inRCs having at least one quinone. Thus the summation ofexponential terms in Eq. 11 should begin from i - 1. But ifthe summation begins from i = 1 (i.e., Ei=lqi 1), theapproximation of Eq. 49 gives a large error because xl + x2+ ... * 1. This can be overcome by introducing new"weights", qi = xi/(1 - xo), with the same properties as xi(qi ' 0, Ei=qi = 1), as needed for applying Eq. 49:
Exifi
=( xo) Eqif(i ) (Ii=l i=l
xo)f(E qi)
= (1 - XO)f((iO)') (50)Applying Eq. 50 to the slow components of the P+ darkrelaxation, we have
P (slow) ple kp(I)t + p2e-kp(2)t + +
(1 - po)e- kp((n)-')t (51)
This is exactly the same approximation we used earlier inEq. 17. A comparison of these approximations is shown inFig. 9. When the average number of quinones per RC issignificant (here (n) = 3), all approximations are similar.However, for lower quinone concentrations the "continu-um" approximation fails drastically. In contrast, the "dis-crete" approximation is very close to the "exact" (multiex-ponential) solution for all quinone concentrations.
Note that the total kinetics of the P+ dark relaxation(including relaxation in RCs without quinone) can be ap-proximated on the basis of Eq. 49:
but it is clearly a poor choice, as long as the rates of the fastand slow phases are very different (here 10-fold), and thereis a significant amplitude of the fast phase. In contrast, theone exponential approximation of the slow components isreasonable because the kinetics of the P+ dark relaxation in
RC micelles having 1, 2, and more quinones are relativelyclose to each other (see dependence of the kp(i) on i givenby the Eq. 8).
CONCLUSIONS
A new quantitative approach has been developed to analyzethe kinetics of electron transfer in isolated RCs in the caseof slow quinone exchange between different micelles. Themain feature of this analysis is the separate consideration ofquinone exchange between different micelles (RC and de-tergent micelles) and the quinone exchange between thedetergent "phase" and the QB binding site within the sameRC micelle. Under these conditions the time of the slowcomponent of P+ relaxation and the relative amplitude ofthe slow phase can be related to each other in an explicitfashion. This provides a means of determining the trueequilibrium constant of electron transfer between QA andQB, and the equilibrium constant of quinone binding at theQB site. The model accounts for the effects of detergent andquinone concentration on electron transfer in the acceptorquinone complex and can be used to separate the contribu-tions of the true electron transfer and quinone bindingequilibrium constants to the observed effects of pH, ionicstrength, mutation, etc.The new model incorporates the traditional model as a
special case, and the two give identical results at highquinone concentrations, which, in practice, may be hard toachieve. However, they differ significantly at low quinoneconcentrations.
The approach described also provides a starting point fora general analysis of the function of detergent-solubilizedmembrane proteins, where substrate availability may bedetermined by passive distribution in a detergent phase.Quinone-dependent respiratory and photosynthetic enzymesrepresent an important and large class of such systems.
APPENDIX 1: AVERAGE NUMBER OFQUINONES PER RC, CALCULATED FORDIFFERENT SCHEMES
Poisson distribution
If quinones are distributed randomly between different RC micelles, theprobability of finding a RC micelle with k quinones is given by the Poissondistribution law:
e-(n)Pkn)Pk ::
1, (Al)
where (n) is the average number of quinones per RC micelle. The proba-bility that a RC micelle does not have a quinone (k = 0) is e-(ny, so theprobability that at least one quinone is present in a micelle is I e- n.
To relate the properties of the slow phase to the prevailing quinoneconcentration, we must consider the average number of quinones averagedonly over those RC-containing micelles with at least one quinone. This isgiven by
k= 1 kpPk (n)(nX' = 1-e (n) -e- (n) (A2)
2315Shinkarev and Wraight
Volume 72 May 1997
When the average number of quinones per RC micelle is close to zero((n)--O), the average number of quinones per those RC micelles contrib-uting to the slow phase of the P+ dark reduction, (n)2', approaches 1.When the average number of quinones per micelle is much greater than 1,(n)21 approaches (n). This relationship is shown in Fig. 3.
Scheme considering the equilibrium between RCand detergent
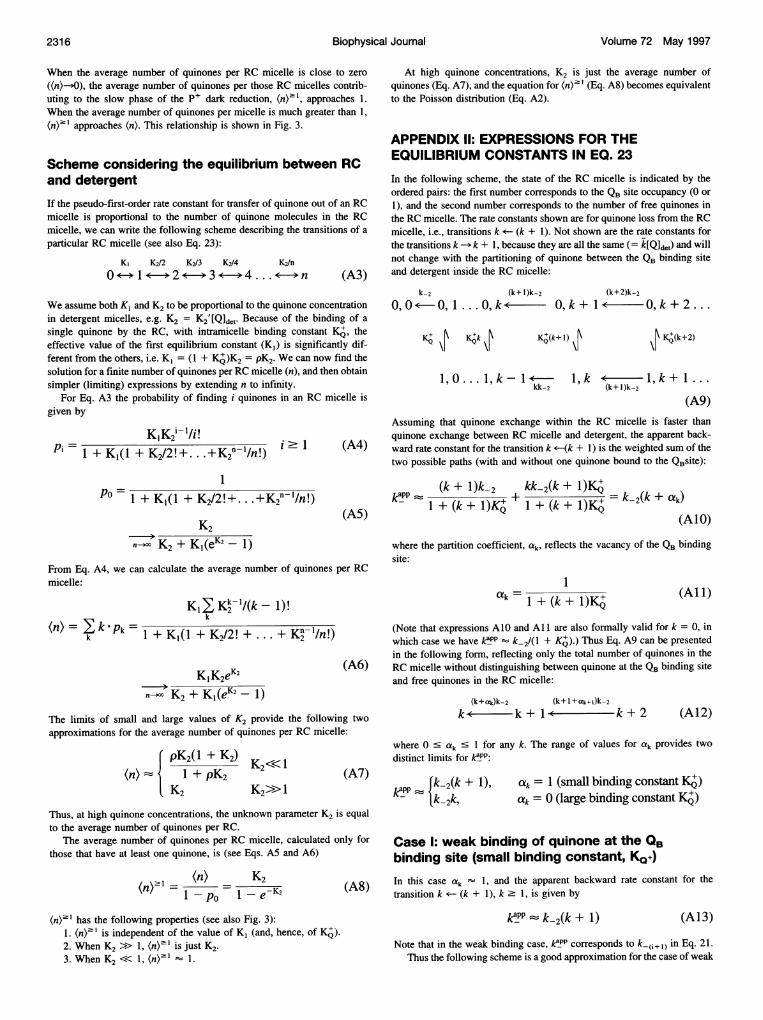
If the pseudo-first-order rate constant for transfer of quinone out of an RCmicelle is proportional to the number of quinone molecules in the RCmicelle, we can write the following scheme describing the transitions of aparticular RC micelle (see also Eq. 23):
K, K2/2 K2/3 K2/4 K2/n
0,E) <->2 >3 ) >4. <- > n (A3)
We assume both K, and K2 to be proportional to the quinone concentrationin detergent micelles, e.g. K2 = K2'[Q]det. Because of the binding of asingle quinone by the RC, with intramicelle binding constant KQ, theeffective value of the first equilibrium constant (KI) is significantly dif-ferent from the others, i.e. K1 = (1 + KQ)K2 = pK2. We can now find thesolution for a finite number of quinones per RC micelle (n), and then obtainsimpler (limiting) expressions by extending n to infinity.
For Eq. A3 the probability of finding i quinones in an RC micelle isgiven by
The limits of small and large values of K2 provide the following two
approximations for the average number of quinones per RC micelle:
(pK2(1+ K2)K<
(n) 1 + pK2K2 K2>> I
(A7)
At high quinone concentrations, K2 is just the average number ofquinones (Eq. A7), and the equation for (n)2' (Eq. A8) becomes equivalentto the Poisson distribution (Eq. A2).
APPENDIX II: EXPRESSIONS FOR THEEQUILIBRIUM CONSTANTS IN EQ. 23
In the following scheme, the state of the RC micelle is indicated by theordered pairs: the first number corresponds to the QB site occupancy (O or1), and the second number corresponds to the number of free quinones inthe RC micelle. The rate constants shown are for quinone loss from the RCmicelle, i.e., transitions k -- (k + 1). Not shown are the rate constants forthe transitions k -> k + 1, because they are all the same (= k[Qldet) and willnot change with the partitioning of quinone between the QB binding siteand detergent inside the RC micelle:
(A9)Assuming that quinone exchange within the RC micelle is faster thanquinone exchange between RC micelle and detergent, the apparent back-ward rate constant for the transition k *-(k + 1) is the weighted sum of thetwo possible paths (with and without one quinone bound to the QBsite):
(k + l)k-2 kk-2(k+ 1)K+=l+ (k+1)K6+ l +(k +lI)KY_ 2k+
(A10)
where the partition coefficient, ak, reflects the vacancy of the QB bindingsite:
1ak=1 + (k + I)KQ (All)
(Note that expressions Al0 and All are also formally valid for k = 0, inwhich case we have kaPP k-2/( + KQ).) Thus Eq. A9 can be presentedin the following form, reflecting only the total number of quinones in theRC micelle without distinguishing between quinone at the QB binding siteand free quinones in the RC micelle:
(k+Cak)k-2 (k+ 1 + ak+ I)k-2k -k + 1 - k +2 (A12)
where 0 s ak S 1 for any k. The range of values for ak provides two
Thus, at high quinone concentrations, the unknown parameter K2 is equalto the average number of quinones per RC.
The average number of quinones per RC micelle, calculated only forthose that have at least one quinone, is (see Eqs. A5 and A6)
(n)= K2 (A8)
(n)'1 has the following properties (see also Fig. 3):1. (n)1 is independent of the value of K1 (and, hence, of KQ).2. When K2 >> 1, (n)21 is just K2.3. When K2<< 1, (n)1' 1.
Case 1: weak binding of quinone at the QBbinding site (small binding constant, KQ(+)In this case ak 1, and the apparent backward rate constant for thetransition k *- (k + 1), k . 1, is given by
kapP=k 2(k+ 1) (A13)
Note that in the weak binding case, kaPP corresponds to k-(i+ 1) in Eq. 21.Thus the following scheme is a good approximation for the case of weak
2316 Biophysical Journal
_Fp k-2(k + I),k := .k-2k,
Interaction of Quinones with Reaction Centers
quinone binding at the QB site (low occupancy): description of RC function at different quinone contents:
The latter scheme is identical to Eq. 23, analyzed in the text.
Case II: strong binding of quinone at the QBbinding site (large binding constant, KQ+)In this case ak 0, and the apparent backward rate constant for thetransition k - (k + 1) is given by
ka-PP EA2k (A15)
Incorporating this into a scheme similar to Eq. A14b, involving only thenumbers of quinones, gives
Note that the main difference between this scheme and Eq. A14b, corre-sponding to weak binding, is a shift in number dependence of the expres-sion for the equilibrium constants, i.e., K2/k - K2/(k- 1).
Using Eq. A16, we find the following equations, which provide a full
To find the relationship between time and relative amplitude of the slowcomponent similar to Eq. 37, we can eliminate K2 by using equations forthe apparent equilibrium constant,
TABLE I Comparison of strong and weak binding formalisms
Weak quinone binding approximation, Eq. 23 Strong quinone binding approximation, Eq. A16Variable of the model (considered in the main text) (ak 1 in Eq. A12)* (considered in the Appendix) (ak 0 in Eq. A12)
Probability that RC micelle 1 Ihas zero quinone, Po Po = 1 + p(eK2 - 1) (Eq. A5) Po 1 + pK2eK2 (Eq. A7)
Fraction of the slow p(eK2 - 1) pK2eK2component, S S 1 + p(eK2 1) (Eq 32) SpK K2
Average number of pK2e K2 p K2eK2( (+ K2)quinones per RC micelle, (n) 1 + p(eK2 - 1) K2 (Eq. A6) (n) +pK2e K2 K2 (Eq. A19)(n) 1+ pK2eK2
Average number of K2 (n)2 = I + K2 (Eq. A20)quinones per RC (ne-K2 (Eq. A8)micelles exhibiting theslow component of P+dark relaxation, (n)2'
Approximation of LAPP Lapp - LABY(n) LABKQ app LABKQ (I + (n)) LABY'Jusing average number of AB A+K(n) A+K A1 K& + (n)) L( + K Eqquinones per RC micelle
Interdependence between TP- TAP LAB *KQ See Eqs. A21 and A22the time and amplitude TAP (R/(R + p))/ln(l + Rip) + K+ (Eq. 37)of the slow component
*ak = 1/(I + (k + 1)KQ), where KQ is the binding equilibrium constant and k is the number of quinone molecules in the RC micelle. The conditionak 1 is satisfied when (k + 1)KQ << 1.
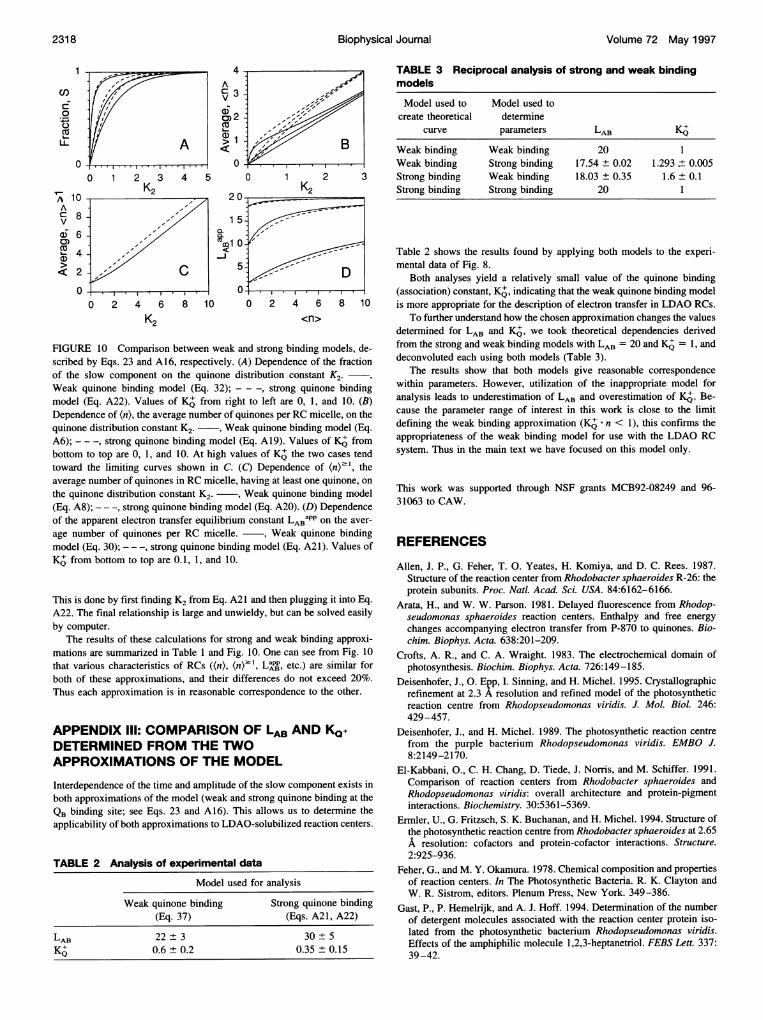
FuREo 10 Comaionsbetw Weakand ong binding models dE-
of the slow component on the quinone distribution constant K2.Weak quinone binding model (Eq. 32); - - -, strong quinone bindingmodel (Eq. A22). Values of KA from right to left are 0, 1, and 10. (B)Dependence of (n), the average number of quinones per RC micelle, on thequinone distribution constant K2. , Weak quinone binding model (Eq.A6); -- -, strong quinone binding model (Eq. A19). Values ofKD frombottom to top are 0, 1, and 10. At high values of K othe two cases tendtoward the lim-iting curves shown in C. (C) Dependence of (np' , theaverage number of quinones in RC micelle, having at least one quinone, onthe quinone distribution constant K2. ~, Weak quinone binding model(Eq. A8); - - -, strong quinone binding model (Eq. A20). (D) Dependenceof the apparent electron transfer equilibrium constant LABapp on the aver-
age number of quinones per RC micelle. , Weak quinone bindingmodel (Eq. 30); - - -, strong quinone binding model (Eq. A21). Values ofKQ from bottom to top are 0.1, 1, and 10.
This is done by first finding K2 from Eq. A21 and then plugging it into Eq.A22. The final relationship is large and unwieldy, but can be solved easilyby computer.
The results of these calculations for strong and weak binding approxi-mations are summarized in Table 1 and Fig. 10. One can see from Fig. 10that various characteristics of RCs ((n), (n)2', L pp, etc.) are similar forboth of these approximations, and their differences do not exceed 20%.Thus each approximation is in reasonable correspondence to the other.
APPENDIX III: COMPARISON OF LAB AND KQ+DETERMINED FROM THE TWOAPPROXIMATIONS OF THE MODEL
Interdependence of the time and amplitude of the slow component exists inboth approximations of the model (weak and strong quinone binding at theQB binding site; see Eqs. 23 and A16). This allows us to determine theapplicability of both approximations to LDAO-solubilized reaction centers.
Table 2 shows the results found by applying both models to the experi-mental data of Fig. 8.
Both analyses yield a relatively small value of the quinone binding(association) constant, K4, indicating that the weak quinone binding modelis more appropriate for the description of electron transfer in LDAO RCs.
To further understand how the chosen approximation changes the valuesdetermined for LAB and KQ, we took theoretical dependencies derivedfrom the strong and weak binding models with LAB = 20 and Kg = 1, anddeconvoluted each using both models (Table 3).
The results show that both models give reasonable correspondencewithin parameters. However, utilization of the inappropriate model foranalysis leads to underestimation of LAB and overestimation of KQ. Be-cause the parameter range of interest in this work is close to the limitdefining the weak binding approximation (Kg * n < 1), this confirms theappropriateness of the weak binding model for use with the LDAO RCsystem. Thus in the main text we have focused on this model only.
This work was supported through NSF grants MCB92-08249 and 96-31063 to CAW.
REFERENCES
Allen, J. P., G. Feher, T. 0. Yeates, H. Komiya, and D. C. Rees. 1987.Structure of the reaction center from Rhodobacter sphaeroides R-26: theprotein subunits. Proc. Natl. Acad. Sci. USA. 84:6162-6166.
Arata, H., and W. W. Parson. 1981. Delayed fluorescence from Rhodop-seudomonas sphaeroides reaction centers. Enthalpy and free energychanges accompanying electron transfer from P-870 to quinones. Bio-chim. Biophys. Acta. 638:201-209.
Crofts, A. R., and C. A. Wraight. 1983. The electrochemical domain ofphotosynthesis. Biochim. Biophys. Acta. 726:149-185.
Deisenhofer, J., 0. Epp, I. Sinning, and H. Michel. 1995. Crystallographicrefinement at 2.3 A resolution and refined model of the photosyntheticreaction centre from Rhodopseudomonas viridis. J. Mol. Biol. 246:429-457.
Deisenhofer, J., and H. Michel. 1989. The photosynthetic reaction centrefrom the purple bacterium Rhodopseudomonas viridis. EMBO J.8:2149-2170.
El-Kabbani, O., C. H. Chang, D. Tiede, J. Norris, and M. Schiffer. 1991.Comparison of reaction centers from Rhodobacter sphaeroides andRhodopseudomonas viridis: overall architecture and protein-pigmentinteractions. Biochemistry. 30:5361-5369.
Ermler, U., G. Fritzsch, S. K. Buchanan, and H. Michel. 1994. Structure ofthe photosynthetic reaction centre from Rhodobacter sphaeroides at 2.65A resolution: cofactors and protein-cofactor interactions. Structure.2:925-936.
Feher, G., and M. Y. Okamura. 1978. Chemical composition and propertiesof reaction centers. In The Photosynthetic Bacteria. R. K. Clayton andW. R. Sistrom, editors. Plenum Press, New York. 349-386.
Gast, P., P. Hemerijk, and A. J. Hoff. 1994. Determination of the numberof detergent molecules associated with the reaction center protein iso-lated from the photosynthetic bacterium Rhodopseudomonas viridis.Effects of the amphiphilic molecule 1,2,3-heptanetriol. FEBS Lett. 337:39-42.
Shinkarev and Wraight Interaction of Quinones with Reaction Centers 2319
Gast, P., P. Hemelrijk, H. J. van Gorkom, and A. J. Hoff. 1996. Theassociation of different detergents with the photosynthetic reaction cen-ter protein of Rhodobacter sphaeroides R26 and the effects on itsphotochemistry. Eur. J. Biochem. 239:805-809.
Hemelrijk, P. W., P. Gast, H. J. van Gorkom, and A. J. Hoff. 1995. Theassociation of different detergents with the photosynthetic reaction cen-ters protein of Rhodobacter sphaeroides R26 and the effects on itsphotochemistry. In Photosynthesis: From Light to Biosphere, Vol. 1. P.Mathis, editor. Kluwer Academic Publishers, Dordrecht, The Nether-lands. 643-646.
Kleinfeld, D., E. C. Abresch, M. Y. Okamura, and G. Feher. 1984a.Damping of oscillations in the semiquinone absorption in reaction cen-ters after successive flashes. Determination of the equilibrium betweenQQBXQ> QAQ-. Biochim. Biophys. Acta. 765:406-409.
Kleinfeld, D., M. Y. Okamura, and G. Feher. 1984b. Electron transfer inreaction centers of Rhodopseudomonas sphaeroides. I. Determination ofthe charge recombination pathway of D+QAQB and free energy andkinetic relations between QAQB -> QAQB. Biochim. Biophys. Acta.766:126-140.
Mancino, L. J., D. P. Dean, and R. E. Blankenship. 1984. Kinetics andthermodynamics of the P870+Q- -> P870+Q- reaction in isolatedreaction centers in the photosynthetic bacterium Rhodopseudomonassphaeroides. Biochim. Biophys. Acta. 764:46-54.
Mar6ti, P., and C. A. Wraight. 1988. Flash-induced H' binding by bacte-rial photosynthetic reaction centers. Influences of the redox states of theacceptor quinones and primary donor. Biochim. Biophys. Acta. 934:329-347.
McComb, J. C., R. R. Stein, and C. A. Wraight. 1990. Investigations on theinfluence of head-group substitution and isoprene side-chain length inthe function of primary and secondary quinones of bacterial reactioncenters. Biochim. Biophys. Acta. 1015:158-171.
Neugebauer, J. 1994. A Guide to the Properties and Uses of Detergents inBiology and Biochemistry. Calbiochem. Hoechst Celanese Corporation,San Diego, CA.
Okamura, M. Y., R. J. Debus, D. Kleinfeld, and G. Feher. 1982. Quinonebinding sites in reaction centers from photosynthetic bacteria. In Func-tion of Quinones in Energy Conserving Systems. B. L. Trumpower,editor. Academic Press, New York. 299-317.
Okamura, M. Y., and G. Feher. 1992. Proton transfer in reaction centersfrom photosynthetic bacteria. Annu. Rev. Biochem. 61:861-896.
Provencher, S. W. 1976. A Fourier method for analysis of exponentialdecay curves. Biophys. J. 16:27-41.
Rongey, S. H., M. L. Paddock, G. Feher, and M. Y. Okamura. 1993.Pathway of proton transfer in bacterial reaction centers: second-sitemutation Asn-M44--* Asp restores electron and proton transfer in reac-tion centers from the photosynthetically deficient Asp-L213 -> Asnmutant of Rhodobacter sphaeroides. Proc. Natl. Acad. Sci. USA. 90:1325-1329.
Roth, M., B. Arnoux, A. Ducruix, and F. Reiss-Husson. 1991. Structure ofthe detergent phase and protein-detergent interactions in crystals of thewild-type (strain Y) Rhodobacter sphaeroides photochemical reactioncenter. Biochemistry. 30:9403-9413.
Roth, M., A. Lewit-Bentley, H. Michel, J. Deisenhofer, R. Huber, and D.Oesterhelt. 1989. Detergent structure in crystals of a bacterial photosyn-thetic reaction centre. Nature. 340:659-661.
Shinkarev, V. P., M. I. Verkhovsky, J. Sabo, N. I. Zakharova, and A. A.Kononenko. 1991. Properties of photosynthetic reaction centers isolatedfrom chromatophores of Chromatium minutissimum. Biochim. Biophys.Acta. 1098:117-126.
Shinkarev, V. P., and C. A. Wraight. 1993. Electron and proton transfer inthe acceptor quinone complex of reaction centers of phototrophic bac-teria. In The Photosynthetic Reaction Center, Vol. 1. J. Deisenhofer andJ. R. Norris, editors. Academic Press, San Diego, CA. 193-255.
Takahashi, E., P. Mar6ti, and C. A. Wraight. 1990. Site-directed mutagen-esis of Rhodobacter sphaeroides reaction center: the role of tyrosineL222. In Current Research in Photosynthesis, Vol. 1. M. Baltschevsky,editor. Kluwer Academic Publishers, Norwell, MA. 169-172.
Warncke, K., M. R. Gunner, B. S. Braun, L. Gu, C.-A. Yu, J. M. Bruce, andP. L. Dutton. 1994. Influence of hydrocarbon tail structure on quinonebinding and electron-transfer performance at the QA and QB sites of thephotosynthetic reaction center protein. Biochemistry. 33:7830-7841.
Wraight, C. A. 1981. Oxidation-reduction physical chemistry of the ac-ceptor quinone complex in bacterial photosynthetic reaction centers.Evidence for a new model of herbicide activity. Isr. J. Chem. 21:348-354.
Wraight, C. A. 1982. The involvement of stable semiquinone in the twoelectron gates of plant and bacterial photosynthesis. In Function ofQuinones in Energy Conserving Systems. B. L. Trumpower, editor.Academic Press, New York. 181-197.
Wraight, C. A., and R. R. Stein. 1983. Bacterial reaction centers as a modelfor photosystem II: turnover of the secondary acceptor quinone. In TheOxygen Evolving System of Photosynthesis. Y. Inoue et al., editors.Academic Press, Tokyo. 383-392.