27
Article: Directors’ and officers’ insurance and shareholder protection The Journal of Financial Perspectives EY Global Financial Services Institute March 2014 | Volume 2 – Issue 1

Article:Directors’ and officers’ insurance and shareholder protection
The Journal of
Financial PerspectivesEY Global Financial Services Institute March 2014 | Volume 2 – Issue 1

The EY Global Financial Services Institute brings together world-renowned thought leaders and practitioners from top-tier academic institutions, global financial services firms, public policy organizations and regulators to develop solutions to the most pertinent issues facing the financial services industry.
The Journal of Financial Perspectives aims to become the medium of choice for senior financial services executives from banking and capital markets, asset management and insurance, as well as academics and policymakers who wish to keep abreast of the latest ideas from some of the world’s foremost thought leaders in financial services. To achieve this objective, a board comprising leading academic scholars and respected financial executives has been established to solicit articles that not only make genuine contributions to the most important topics, but are also practical in their focus. The Journal will be published three times a year.
gfsi.ey.com
The articles, information and reports (the articles) contained within The Journal are generic and represent the views and opinions of their authors. The articles produced by authors external to EY do not necessarily represent the views or opinions of EYGM Limited nor any other member of the global EY organization. The articles produced by EY contain general commentary and do not contain tailored specific advice and should not be regarded as comprehensive or sufficient for making decisions, nor should be used in place of professional advice. Accordingly, neither EYGM Limited nor any other member of the global EY organization accepts responsibility for loss arising from any action taken or not taken by those receiving The Journal.

EditorShahin Shojai EY LLP
Advisory EditorsDai Bedford EY LLPShaun Crawford EY LLP Carmine DiSibio EY LLP
Special Advisory EditorsDavid ColeSwiss Re Paul FeeneyOld Mutual Wealth Paolo Fiorentino UniCredit
Editorial BoardViral V. Acharya New York UniversityJohn Armour University of OxfordTom Baker University of Pennsylvania Law SchoolPhilip Booth Cass Business School and IEAJosé Manuel CampaIESE Business SchoolKalok Chan Hong Kong University of Science and TechnologyJ. David Cummins Temple UniversityAllen Ferrell Harvard Law SchoolThierry Foucault HEC ParisRoland Füss University of St. GallenGiampaolo Gabbi SDA BocconiBoris Groysberg Harvard Business SchoolScott E. Harrington The Wharton SchoolPaul M. Healy Harvard Business SchoolJun-Koo Kang Nanyang Business SchoolTakao Kobayashi Aoyama Gakuin UniversityHoward Kunreuther The Wharton School
Deborah J. Lucas Massachusetts Institute of TechnologyMassimo Massa INSEADPatricia A. McCoy University of Connecticut School of LawTim Morris University of OxfordJohn M. Mulvey Princeton UniversityRichard D. Phillips Georgia State UniversityPatrice Poncet ESSEC Business SchoolMichael R. Powers Tsinghua UniversityAndreas Richter Ludwig-Maximilians-UniversitaetPhilip Rawlings Queen Mary, University of LondonRoberta Romano Yale Law SchoolHato Schmeiser University of St. GallenPeter SwanUniversity of New South WalesPaola Musile Tanzi SDA BocconiMarno Verbeek Erasmus UniversityIngo Walter New York UniversityBernard Yeung National University of Singapore
Editorial
Ratan Engineer EY LLP David Gittleson EY LLP Bill Schlich EY LLP
Mark HartiganZurich Robert W. JenkinsLondon Business School Thomas C. WilsonAllianz
Directors’ and officers’ insurance and shareholder protectionby M. Martin Boyer, CEFA Professor of Finance and ClRANO Fellow, HEC Montréal, Université de MontréalCorporate directors are liable for the corporation’s actions as well as their own. Strangely, and by far, the most likely plaintiffs in a lawsuit against corporate directors are the shareholders who appointed them in the first place. As a result, directors often require protection so that their personal wealth is not expropriated in the event of a good faith error. There are three ways to protect a director’s wealth: corporate indemnification plans, limited liability provision, and directors’ and officers’ (D&O) insurance policies. Of the three types of protection, D&O insurance is arguably the strangest, not because shareholders purchase it to protect directors in case of a lawsuit, but because it also protects shareholders. Despite the extremely popular nature of D&O insurance to protect board members in the U.K., the U.S. and Canada, the study of the drivers of demand for D&O insurance remains a largely unexplored territory as few papers have been devoted to this aspect of corporate governance. Is D&O insurance part of the compensation package? Is it a tool to align the manager’s incentives with those of the shareholders? Is it truly designed to protect corporate directors or other stakeholders, such as the shareholders? Using an original database of Canadian public corporations, I test a set of hypotheses that should determine the demand for D&O insurance. The analysis presented in this article suggests that D&O insurance protects the shareholders’ wealth more than the directors’.
Executive summary
1The Journal of Financial Perspectives
Part 2: Tactical
Directors’ and officers’ insurance and shareholder protectionM. Martin BoyerCEFA Professor of Finance and ClRANO Fellow, HEC Montréal, Université de Montréal 1
AbstractCorporate directors are liable for the corporation’s actions as well as their own. Strangely, and by far, the most likely plaintiffs in a lawsuit against corporate directors are the shareholders who appointed them in the first place. As a result, directors often require protection so that their personal wealth is not expropriated in the event of a good faith error. There are three ways to protect a director’s wealth: corporate indemnification plans, limited liability provisions and directors’ and officers’ (D&O) insurance policies. Of the three types of protection, D&O insurance is arguably the strangest not because shareholders purchase it to protect directors in case of a lawsuit, but because it also protects shareholders. Using an original database, I test a set of hypotheses that should determine the demand for D&O insurance. My analysis suggests that D&O insurance protects the shareholders’ wealth more than the directors’.
1 I conducted much of this research while visiting the Finance division at the Sauder School of Business of the University of British Columbia. I wish to thank Murray Carlson, Gilles Chemla, John Core, Mark Huson, Kai Li, Hernan Ortiz Molina, Randall Morck and Ralph Winter for their comments on this research, as well as seminar participants at the University of Alberta, the University of British Columbia and the University of Connecticut. And, I cannot dismiss the valuable discussions and the continuing work I have on this topic with Sharon Tennyson and Léa Stern. This research was sponsored by the Social Science and Humanities Research Council of Canada. The continuing support of ClRANO is also gratefully acknowledged.

2 The Journal of Financial Perspectives
Directors’ and officers’ insurance and shareholder protection
1. Introduction1.1 Economic importance of D&O insuranceAs representatives of the corporation, directors and officers are personally responsible and liable for actions committed in its name. One way for corporate directors to protect their personal wealth is to have the corporation buy insurance on their behalf. This insurance is known as D&O insurance. According to different Towers–Watson surveys, the proportion of U.S. firms that carry D&O insurance hovers around 95% throughout the years. The market penetration of D&O insurance is smaller in Canada and is approximately 80%. One possible reason why D&O insurance has become increasingly popular is that lawsuits against management are becoming more frequent. Recurring surveys of Towers–Watson show that one-fifth of all American public corporations had at least one lawsuit brought against their directors in the previous 10 years. Although carrying D&O insurance is the norm, the sum of all D&O insurance premiums paid by U.S. corporations is only a small proportion of the billions of dollars paid in corporate insurance each year. The role of D&O insurance is to cover managers in case they are sued as representatives of the corporation or for breach of duty toward the firm’s stakeholders [see Bradley and Shipani (1989), for more on the topic]. Managers are covered for their court expenses as well as for any settlement arising from the lawsuit, subject of course to a maximum amount (the policy limit). As D&O insurance protects managers against liability lawsuits brought unto them as managers of the corporation, this is not too different from other types of insurance. What is surprising, however, is that most lawsuits originate from the firm’s stakeholders. Lawsuits usually originate from shareholders (close to 50%), employees (30%) and clients (15%). In a sense, shareholders purchase insurance for managers to protect them against shareholder lawsuits. Allowing shareholder to sue the firm and its managers is important as it makes it possible to deal with classic agency problems, since lawsuits act as a disciplinary force on managers and directors [see Becht et al. (2003), and Bauer et al. (2008)].
D&O insurance is only one of the three ways that a corporation can protect directors’ wealth while they serve on corporate boards. A corporation could also amend its charter so that the directors’ liability is limited. Limited liability provisions (LLPs) all but eliminate the directors’ personal financial responsibility toward the firm and its shareholders. LLPs became necessary after the 1984 landmark court decision known as Smith versus
Van Gorkom [see Hartmann and Rogers (1991), and Hanks (1988), for more details on the case and its impact]. Gutierrez (2000) reports that more than 70% of American corporations adopted limited liability provisions in an effort to attract the best possible corporate directors. Brook and Rao (1994) show that firms in financial distress (i.e., the firms whose directors are more likely to be sued) gain from adopting LLPs. Presumably, LLPs allow managers in financially distressed firms to adopt more frequently hero-or-zero strategies when they know they cannot be sued in case of a bankruptcy. Because security litigation settlements may be quite large, and because directors are personally responsible for these amounts, directors seek protection to prevent the use of their personal assets to compensate plaintiffs in these lawsuits. D&O insurance supposedly provides such protection, so individuals require it before they agree to serve as a corporate director.
A second way that a corporation can protect its directors is through corporate indemnification plans (CIPs). CIPs give directors a certain protection against a third-party lawsuit. CIPs are mandatory in the sense that corporations are legally responsible to indemnify directors for court costs that result from a third-party lawsuit if the directors are found innocent of the allegations made against them. CIPs may also be available to the directors even if they are found guilty if, for example, the prejudice was caused in the best interest of the corporation. If that is the case, a director could be indemnified for court expenses and damages. Given that LLPs are frequently part of the corporate charter and CIPs are mandatory, it is not clear why directors would need D&O insurance on top of it all. LLPs limit the amount a director may be responsible for, and CIPs pay for damages to third parties.
Why do corporations purchase D&O insurance on behalf of their directors instead of letting directors purchase such liability insurance directly on the marketplace, just as medical malpractice insurance? I argue in this paper that D&O insurance is not designed to protect directors as much as it is designed to protect the shareholders’ wealth. Put differently, D&O insurance acts as a deep out-of-the-pocket put option for shareholders [see also Romano (1991a), Gutierrez (2003), and Boyer and Tennyson (2012)]. According to Romano (1991a), the largest benefactors of D&O insurance are not the directors, but the shareholders. Directors are already protected under LLPs and CIPs. As a result,

3The Journal of Financial Perspectives
shareholders purchase D&O insurance on behalf of their directors in case shareholders, who feel they were wronged, decide to sue the directors for improper conduct as their representatives on the board. Similar to Romano (1991a), Gutierrez (2003) also sees D&O insurance as an instrument that benefits shareholders instead of directors. Gutierrez suggests that D&O insurance works as a commitment device for efficient shareholder litigation. This shareholder protection hypothesis could also explain why D&O insurance is so widely used to protect corporate directors in common law countries (such as the U.S., Canada2 and the U.K.). Indeed, if common law countries are better at protecting shareholder rights [see Shleifer and Vishny (1997), and LaPorta et al. (1998, 2000)], why is D&O insurance so prevalent given that it reduces director accountability? One reason may be that D&O insurance protects shareholders more than managers.
Other explanations exist as to why corporations purchase D&O insurance on behalf of its directors. Core (1997) offers two such explanations: managerial risk aversion and managerial compensation [see also Parry and Parry (1991)]. D&O insurance also works as a monitoring tool as insurers are asked to monitor the directors [see O’Sullivan (1997), Holderness (1990), and Core (2000)]. Although risk aversion, compensation and monitoring may appear to be good reasons to purchase D&O insurance, corporations have access to better instruments to achieve those goals: risk aversion is best dealt with by amending the corporate charter to include limited liability provisions; managerial compensation is better served with option, stock and cash distribution; and monitoring is better done by having large shareholders.
1.2 FindingsMy findings are based on an original dataset of publicly traded Canadian corporations that filed their annual reports between 1 January 1993 and 31 December 1998. Canadian data is used because the Ontario Securities Commission that oversees the Toronto Stock Exchange mandates that basic D&O insurance information (policy limit, deductible and premium) be made public in the corporations’ management proxies and information circulars. One of the most interesting results of the paper is that I test the Romano (1991a) and Gutierrez (2003) hypothesis that
2 In Canada, Bill 198 of the Ontario Securities Act introduced the notion of derivatives lawsuits into Canada [see Emerson and Clarke (2003), LaCroix (2012), and Heys and Berenblut (2012)].
D&O insurance acts as a deep-pocket payer of last resort for shareholders and debt holders. Controlling for other factors, such as director risk aversion and board monitoring, I find evidence that greater shareholder and debt holder wealth leads to greater demand for D&O insurance, thus supporting the shareholder protection hypothesis.
I test seven hypotheses related to the demand of corporate risk management in general and of D&O insurance in particular. A summary of our empirical results follows:
1. If D&O insurance acts as a deep-pocket payer of last resort for shareholders and debt holders, then D&O insurance should be associated with greater shareholder and debt holder wealth. The evidence strongly supports the shareholder protection hypothesis.
2. If D&O insurance is part of the directors’ compensation package, we should expect to see a negative relationship between the amounts of D&O insurance protection provided to board members and other forms of compensation. My evidence strongly supports the compensation package hypothesis.
3. If D&O insurance is used to attract more risk adverse directors, we should expect a positive relationship between the board members’ risk aversion and the level of protection. I find no support for the risk aversion hypothesis.
4. If D&O insurance is used to reduce the cost of financial distress, then a positive relationship should exist between the level of D&O insurance coverage and the riskiness of the firm. I find weak evidence in favor of the financial distress hypothesis.
5. If D&O insurance is used as a monitoring device, then we should observe a negative relationship between the amount of D&O insurance coverage and other forms of corporate monitoring. I find weak evidence in favor of the monitoring hypothesis.
6. If D&O insurance provides a signaling mechanism for managerial quality, firms where managerial signaling is more important should purchase less coverage. I find strong support of the managerial signaling hypothesis.
7. Finally, if D&O insurance is an entrenchment device for corporate boards that do not want to assume the impact of their decisions, D&O insurance coverage and managerial entrenchment should be positively linked. The evidence concerning the entrenchment hypothesis is mixed.
4 The Journal of Financial Perspectives
Directors’ and officers’ insurance and shareholder protection
The next section of the paper presents the D&O insurance market and previous research on the topic. Section 3 presents the data and the testable hypotheses used to explain D&O insurance demand. In particular, I present the shareholder protection hypothesis, which is the foremost contribution of this paper. Section 4 presents the results. The results section is divided into three parts. The first part determines the likelihood that an agent will purchase D&O insurance. The second part finds the determinants of the policy limit and deductible amount. I conduct robustness checks in the last part of section 4. In section 5, I discuss my results and conclude.
2. Directors’ and officers’ liability insurance 2.1 The D&O insurance marketContrary to the late eighties, the D&O insurance market was very soft (i.e., high coverage, low premium) in the mid to late 1990s. The liability insurance crisis of the mid 1980s [see Winter (1991)] had reduced the industry’s capacity to provide insurance. This supply shock had a direct impact on premiums paid, which increased tenfold between 1984 and 1988, according to the standardized premium index for D&O insurance [see Larsen (2000)]. Feldhaus and Klein (2001) report that entry and exit in the professional liability insurance market is easy so that the D&O insurance market is quite competitive.
A D&O insurance policy comes to life when a manager is being sued as a representative of the corporation. The insurance company indemnifies the corporation and/or the manager only if the manager acted in good faith on behalf of the company; i.e., managers are not covered in case of gross negligence or criminal behavior. Depending on the type of D&O contract (there are more than 40 standard D&O insurance contracts), sometimes the manager will be indemnified directly, other times the corporation will be indemnified for the expenses incurred in the manager’s defense (for example, when the corporation has its own in-house legal team). As with traditional insurance contracts, D&O insurance contracts stipulate a premium to be paid, a policy limit as well as a deductible.
Most D&O insurance contracts are written on a claims-made and reported basis (CMR). CMR contracts differ from regular occurrence-based contracts in that they cover losses that are made and reported during the policy year even though such claims may have been incurred in previous years.
Occurrence-based contracts cover losses that are incurred during the policy year, no matter when the claim is reported in the future.3
So-called sticky points also characterize the D&O insurance coverage market. Typically, coverage limit is sold by layers of $1m, although the most important steps appear to be $5m. For our sample of companies, out of the 173 that purchased D&O insurance in any given year, two-thirds chose one of six policy limits: $5m, $10m, $15m, $20m, $25m and $50m.
2.2 Previous literature on D&O insuranceThe first studies on D&O insurance using public data occurred in Canada and the U.K. [see Core (1997, 2000) and O’Sullivan (1997)]. Using a sample of 222 firms whose fiscal year ended between 31 May 1994 and 31 December 1994, Core (1997) finds that the most important determinants of D&O insurance purchase are the risk of a lawsuit and the cost of financial distress. No evidence is shown that D&O insurance is in any way part of the managers’ compensation package. In a follow-up article, Core (2000) finds that the factors explaining premiums are about the same as the factors explaining the demand for D&O insurance. Core’s results are supported by O’Sullivan (1997) who concludes that in the U.K., D&O insurance coverage and managerial share ownership are corporate governance instrument substitutes. Moreover, Holderness (1990), Core (2000) and O’Sullivan (1997) suggest that D&O insurance acts as a monitoring device [see also Kim (2004), and Kaltchev (2006)].
If D&O insurance reduces the expected cost of bankruptcy and acts as a corporate governance instrument or monitoring device, one should expect stock returns to be positively correlated with D&O insurance purchases. Surprisingly, however, D&O insurance does not seem to have any impact on stock returns in the short run [see Bhagat et al. (1987), and Janjigian and Bolster (1990)].
3 For example, suppose that an incident occurs in 2001 (say the accidental pollution of a river), but is not reported until 2005 when a claim is filed. Under a CMR contract, all the financial responsibility for the loss falls upon the 2000 insurer. Under an occurrence-based insurance contract, it is the 2005 insurer that is responsible. See Doherty (1991), and Boyer and Gobert (2011) for more details regarding claims made and reported insurance contracts compared with occurrence-based contracts.

5The Journal of Financial Perspectives
Chalmers et al. (2002) study the interaction between D&O insurance coverage and initial public offering (IPO) underpricing using an original sample of firms going public with a specific investment bank. Their study, using 72 observation points, is based on earlier studies by Ibbotson (1975) and Tinic (1988) who argued that IPOs are initially underpriced as a way to prevent shareholder lawsuits when the stock falls in the long run. They find that corporations with substantial D&O insurance coverage were, on average, more likely to be sued in the future for mispricing. In other words, the greater is the D&O insurance coverage, the less underpriced is the stock at the time of the IPO [see Boyer and Stern (2013), for a counter point].
Only a few papers examine in detail the modeling of D&O insurance. Gutierrez (2003) presents a model where D&O insurance is used as a commitment device for stockholders to monitor the behavior of corporate directors. The paper proposes a model where an uninformed principal purchases insurance on behalf of an informed agent because the insurer cannot observe ex-post the true effort of the agent. As a result, D&O insurance protects shareholders against the risk that corporate directors will not have enough wealth to pay for the damages they have caused. Consequently, D&O insurance acts as a deep-pocket, last-chance payer for shareholders who suffered a loss because of managerial incompetence. Parry and Parry (1991), Barney (1992), Kremslehner (2011) and Chang and Yeh (2011) offer other theoretical rationale for the existence of D&O insurance.4
If D&O insurance acts an out-of-the-money put option for the shareholders, would it not be cheaper to hold such put options in the company’s treasury? Regulation or fear of litigation may prevent the company from doing exactly that [see for example Chacko et al. (2001)], so that corporations must find a contrived way to protect their shareholders from managerial accidents. Moreover, in the event of bankruptcy and liquidation, shareholders would not benefit from these put options since they would be seized by the firm’s creditors as part of the firm’s assets.
4 For more recent evidence on the topic of D&O insurance, see also Boyer (2005, 2008), Griffith (2006), Baker and Griffith (2007, 2010), Zou et al. (2008), Gillan and Panasian (2009), Chen and Li (2010), Fier at al. (2010), Lin et al. (2011), Rees et al. (2011), Boyer and Tennyson (2012), and Boyer and Stern (2012, 2013).
3. Hypotheses, data collection and data sourceAlthough there are many hypotheses that one can test to find the determinants of the demand for D&O insurance, the main hypothesis I want to test in this paper is the one I refer to as the shareholder protection hypothesis. In the discussion, I refer to the protection or the coverage associated with a given D&O insurance policy; more protection (or more coverage) means that the policy limit is larger or that the deductible is smaller or both.
3.1 Main hypothesis: shareholder protectionSince shareholders are those that have the most to lose because of managerial incompetence or error, the shareholder protection hypothesis claims that it is them who should value D&O insurance protection the most. In other words, the more shareholders have to lose because of the managers’ incompetence, the more protection they will purchase.
The market value of equity gives us the maximum possible loss that can befall shareholders. As the size of the possible loss increases, more protection becomes needed. To see why, consider the case of a corporation where all the board members are homeless. If the board becomes liable because of an error on their part, shareholders may not be compensated justly for their loss, as the directors have no personal wealth to be seized. D&O insurance then allows shareholders to claim back part of the wealth they lost. If the shareholder protection hypothesis is correct, we should see a positive relationship between a corporation’s market value of equity and the amount of D&O insurance protection. Because we are dealing with large dollar values, I shall use the log of the market value of equity in millions of Canadian dollars5 (LnMVE) as my measure for the shareholders’ wealth.
Another way to measure whether D&O insurance protects the firm’s providers of capital rather than its directors would be to look at the use of debt in the corporation’s financial structure. As the level of debt increases, it becomes less likely that any residual assets will be left to distribute to shareholders in the event of liquidation. Shareholders should then value a tool that compensates them in the event of liquidation due to mismanagement. I shall use the debt ratio, which is calculated as
5 All monetary figures are denominated in Canadian dollars; any amount in U.S. dollar has been converted to Canadian dollars using the exchange rate at year-end.

6 The Journal of Financial Perspectives
Directors’ and officers’ insurance and shareholder protection
the ratio of the book value of debt to the quasi-market value of assets, as my measure of debt holder wealth in the corporation:
DebtRatio Bookvalueofdebt MarketvalueofequityBookvalueofdebt= +
If shareholders use D&O insurance to protect themselves, we should see a positive relationship between D&O insurance coverage and the use of debt in the corporation.
3.2 Other hypotheses and determinantsMany other hypotheses have been developed to explain the corporate demand for risk management and insurance. I test for the most common.
3.2.1 Compensation package hypothesisCore (1997) argues that D&O insurance is part of the director’s compensation package so that directors who have better coverage should be willing to accept a smaller compensation. I, therefore, need to control for the directors’ compensation. To do so, I shall use three measures for board members’ annual compensation: cash, options and stock. According to the compensation package hypothesis, D&O insurance coverage and director compensation should be negatively correlated.
Average annual cash compensation (in thousands of dollars) received by each board member is computed as total cash compensation of the board divided by the number of board members. Similarly, the average option compensation (in thousands of dollars) is calculated as the number of options per board members multiplied by the stock volatility and the stock price at the end of the year.6 The stock variable gives me a measure of each board member’s involvement in the corporation. Similar to Tufano’s (1996) CEO’s wealth involvement in the corporation, I measure stock as the one-year variation in the
6 This option value measure is unusual, but traditional option value measures are not perfectly computable using the data available because management proxies in Canada do not provide strike prices nor expiration dates for the options granted to board members. Running the analysis using the average number of options granted or a value using a the Black–Scholes formula with a strike price equal to the stock’s year-end price and a maturity date of 10 years does not change the results. The same can be said about the use of a dummy variable that measures whether board members received stock options or not.
average board member’s wealth in shares of the corporation.7
3.2.2 Risk aversion hypothesisBecause of the prevalence of limited liability provisions and corporate indemnification plans, risk aversion can hardly be thought of as being a theoretically important factor. Risk aversion may play a role in two instances, however. First, if the company goes bankrupt the corporate indemnification plans may not have enough funds to compensate the directors for third-party lawsuits. Second, if the limited liability provision is set high enough, risk aversion may become an important determinant.
Of all the individuals who sit on the board, those that need the most convincing are the external directors [see Parry and Parry (1991)]. Officers who sit on boards, also known as inside directors, receive other forms of compensation and benefits from the corporation and as such do not require D&O insurance protection as much. Independent directors, on the other hand, request better and more complete protection to sit on boards. As a result, if the director risk aversion hypothesis is correct, I expect the number of independent directors (Independent) on a corporate board to be positively associated with a higher level of protection. I define a director to be independent if he is not an officer of the corporation, related to an insider or a former employee.
3.2.3 Financial distress/corporate insurance hypothesisIf one considers insurance as part of a corporation’s overall risk management portfolio, then the corporate insurance hypothesis is probably the one that has received the most attention in the finance literature. Size should be an important determinant of a corporation’s need for corporate insurance; larger corporations are better able to self-insure so they have less need for insurance [see Mayers and Smith (1982), and Smith and Stulz (1985)]. For example, large corporations may have an in-house litigation department that handles lawsuits. To measure the impact of size, we shall use the previously defined variable Ln(MVE).
The way in which a corporation is financed should affect the need for corporate insurance. For example, a corporation near
7 The value of the stock variable may change because there is change in the price of the stock or a change in the average number of shares owned by board members. Measuring only the ownership change does not alter the results.

7The Journal of Financial Perspectives
bankruptcy will incur large financial distress costs. Moreover, since a bankrupt firm cannot honor its promise to financially support its managers’ legal fees in the event of a lawsuit, the corporate indemnification plan becomes moot. As a result, corporate managers will require better protection to sit on boards of corporations near bankruptcy. Thus, bankruptcy risk should increase the need for D&O insurance coverage. Bankruptcy is calculated as in Core (1997) so that it measures the value of a put option on the corporation’s assets with a strike price equal to the book value of debt. Financial distress also increases when the size of the corporate debt is relatively large. Corporations that have a high debt ratio (as defined earlier as our DebtRatio variable) are more at risk of being in financial distress.
Finally, a firm’s past return may be a good indication of its financial health. As a consequence, the higher the return the more liquidity the corporation has to face a small market downturn. The need for D&O insurance should, therefore, be smaller when past returns have been high. I shall use the firm’s return on assets (RoA) as my profitability measure. I calculate RoA as the ratio of net earnings to the book value of assets.
3.2.4 Monitoring and the entrenchment hypothesesHolderness (1990), O’Sullivan (1997) and Core (2000) hypothesize that D&O insurance is a substitute for board monitoring. There are three other important ways to monitor the board: block holders, debt holders and independent directors. Although each measure is not independent of each other [see Agrawal and Knoeber (1996)] we should expect a negative relationship between them and D&O insurance coverage if the monitoring hypothesis is correct. Moreover, if D&O insurance is used to protect entrenched managers, we should again see a negative relationship between the presence of outside board monitors and D&O insurance coverage.
I shall use three measures of board monitoring devices: the presence of creditors, the presence of financial institution block holders and the presence of independent directors. In every case, I expect the impact to be negative if the monitoring hypothesis holds.
The presence of creditors is measured using the previously defined DebtRatio variable. If a D&O insurer is the corporation’s deep pocket in case of managerial incompetence, creditors may not need to monitor the health of the corporation as much.
Regarding the Blockholder variable, although one could make the argument that any block ownership may be a substitute for D&O insurance monitoring, not every block holder will have incentives to exert influence on the board. Presumably, financial institution block holders are those who are more likely to be substitute for D&O insurer monitoring. I measure Blockholder as the percentage of the shares held by financial institutions. Finally, the more independent directors on the board, the less D&O insurance monitoring is needed, so that the previously defined Independent variable should be negatively related to D&O insurance coverage.
According to Core (1997) and Chalmers et al. (2002), entrenched managers may use their power on the board to purchase more D&O insurance to extract wealth from shareholders without too much fear of reprisal. I use two main measures of entrenchment: the voting power of the CEO (CEOPower), and the wealth of insiders (InWealth) on the corporate board. In both cases, I expect a positive relationship if the entrenchment hypothesis is correct.
Because Canadian security laws allow the existence of different classes of voting shares, CEOPower is measured as the proportion of the votes in the hands of the CEO divided by the total number of votes in the corporation. InWealth is calculated as the total number of shares held by insiders who sit on the board divided by the total number of shares. I define a corporate insider as any corporate officer or employee who sits on the board in addition to the chairman of the board.
3.2.5 Signaling hypothesisThe adverse selection literature [see Rothschild and Stiglitz (1976)] predicts that good managers will signal their quality by having less insurance, although DeMarzo and Duffie (1991) and Bessembinder (1991) argue that good managers will signal their quality by hedging idiosyncratic risk more. Moreover, signaling is even more important when managerial quality is harder to assess because their tasks are complex. I shall use two measures of complexity. First, managers of growth corporations have complex investment opportunities so that they may benefit more from signaling their quality than managers in other types of corporations. As a result, growth corporations should purchase lower D&O insurance coverage. I measure Growth as the ratio of the market value of equity to its book value. A second measure of complexity is the corporation’s stock return volatility (Volatility). Managers in corporation whose stock is very volatile are more

8 The Journal of Financial Perspectives
Directors’ and officers’ insurance and shareholder protection
likely to signal their quality through lower insurance coverage. Lower coverage is thus expected when the stock is volatile. In insurance, signaling is usually done through the use of higher deductibles rather than smaller policy limit.
3.2.6 Litigation risk and other control variablesOne last determinant of D&O insurance demand is the perceived litigation risk a corporation faces. Through strategic corporate choices, a firm may increase its risk of being sued even though corporate managers have done nothing wrong. Sometimes, the environment is simply more litigious. For example, a Canadian corporation that has important activities in the United States should be faced with more litigation than a corporation whose main activities are in Canada.
As reported by Core (1997) and Clarkson and Simunic (1994), the Canadian legal system is less litigious than the American legal system. It follows that claims filed in the United States should be costlier than claims filed in Canada. Given that almost half of the D&O lawsuits originate from shareholders, I feel that the most important litigation risk that corporations face is whether they have violated some SEC rule, typically an accounting irregularity [see Eitel (2000)].8 It follows that corporations that are listed on a stock exchange in the U.S. (U.S.Listed) should have a greater policy limit and a larger deductible.
Another example, mentioned by Core (1997), is that corporations are the most likely to be sued if they engage in mergers, acquisitions and divestiture, so that increased litigation risk should be a function of large variations in the corporation’s book value of assets. I let Acquiror equal the log of the book value of assets (in millions of dollars) if the said book value has increased by more than 25% over the previous year. Divestor, on the other hand, equals the previous year’s log of the book value of assets (in millions of dollars) if the book value has decreased by more than 25% in the current year. An
8 The laws governing corporations in the U.S. allow more lawsuits than the laws governing Canadian corporations. Moreover, the jurisprudence in the U.S. is such that lawsuits are very common; this is not the case in Canada where lawsuits are not considered a normal business expense for corporations. The probability of litigation is, therefore, higher for firms that are listed in both the U.S. and Canada as opposed to firms listed in Canada only. Although it is true that sexual harassment and/or employment discrimination suits against managers fall under the D&O coverage, most lawsuits are brought by stockholders under the different security laws. The Ontario Securities Commission introduced (and effective in 2005) the notion of derivatives lawsuits into Canada [see Emerson and Clarke (2003)].
increase in the litigation risk increases the frequency and the severity of lawsuits, so that we should expect an increase in the deductible and in the policy limit.
The last variable I need to include in the analysis takes into account the length of the D&O insurance contract. It was common practice in the nineties for insurers to issue multiyear contracts with automatic reinstatement clauses. To control for these multiyear insurance contracts, I count the number of years during which the parameters of the contract (deductible and policy limit) did not change. Because it appears that no contract is ever longer than three years, the MultiYear variable may only be equal to 1, 2 or 3.
The astute reader will note that there is no mention of the convexity of the tax schedule in the present analysis, even though progressive tax systems induce corporations to smooth earnings [see Smith and Stulz (1985), and Graham and Smith (1999)]. The reason is that D&O insurance offers little tax advantages. Consequently, there is no reason why the convexity of the tax structure should have any bearing on the demand for D&O insurance. Moreover, Graham and Rogers (2002) find that corporations do not seem to alter their hedging strategy as a function of the convexity of the schedule, which reduces the strength of the general tax argument for purchasing insurance.
3.3 Summary of hypotheses and predicted impactTable 1 presents a summary of the predicted impact of each variable as a function of the hypothesis it claims to test. The + (—) sign means that the variable in the left column is expected to have a positive (negative) impact on the need to carry D&O insurance coverage. For example, for LnMVE, the financial distress hypothesis predicts that larger corporations need less insurance (thus the — sign) because they face smaller financial distress costs and are better able to self-insure. On the other hand, the shareholder protection hypothesis predicts that larger corporations will choose more protection (thus the + sign) because shareholders have more to lose.
The independent variables I use to test my hypotheses have also been used to test other hypotheses. For example, Tufano (1996) uses the managers’ stock and stock option ownership to test for their managerial risk aversion. He suggests that stock ownership increase the managers’ implicit risk aversion whereas

9The Journal of Financial Perspectives
stock option ownership decreases it. This means that, under the Aversion column in Table 1, we could put a + next to the stock variable and a — next to the option variable. Also, DeMarzo and Duffie (1991) and Bessembinder (1991) suggest that more able managers should use hedging the most because it eliminates the noise component in their decisions so that all that remains is their quality.
The choice I made in presenting the different hypotheses and the measures used to test them are subject to debate. However, since the main goal of the paper is to test whether D&O insurance protects the shareholders more than the managers, any other hypothesis test is secondary to the shareholder protection hypothesis.
3.4 Dependent variablesI use three different dependent variables. First, I use a dichotomous variable to see whether D&O insurance was purchased or not. Second, I have the policy limit that gives us the maximum possible indemnity paid by the D&O insurance policy for any single event, or for any single year. Although D&O insurance is usually sold in excess layers [see Chalmers et al.
(2002)], I do not have access to that information. Third, I have information regarding the contracts’ deductibles. This deductible gives me the amount the corporation (or the managers) must pay out-of-pocket before the insurance coverage kicks in. To reduce problems associated with the extreme measures of policy limit and deductible, I used the logarithm of the dollar figure in my analysis. In the case of deductibles, there are times where the insurance contract specifies an individual deductible, a corporate deductible, or both. For the purpose of this paper, I used the highest amount available, typically the corporate deductible.
Although there are no standard D&O insurance policy forms, they all include a policy limit and a premium paid. The non-standard aspects of the contracts relate to the exclusions and inclusions, the length of the policy and who is covered. Unfortunately, I do not have access to the specific insurance contract, but only to what is reported in the information circular.
3.5 Data sourceFinancial data was obtained from three different sources (Compustat, Stock Guide and CanCorp Financial), which allows me
Variable name Shareholder protection
Package Aversion Distress Monitor Signaling Entrench
Cash −
Option −
Stock −
Independent + −
LnMVE + −
Bankruptcy +
DebtRatio + + −
RoA −
Blockholder −
Growth −
Volatility −
CEOPower +
InWealth +
Table 1: Predicted impact of each variable on the demand for D&O insurance coverage as a function of the testable hypothesesThe variables used to test our model are listed in the first column. The different testable hypotheses are found in the other columns. The + (—) sign represents the predicted impact of the variable on the level of D&O insurance protection purchased by the corporation on behalf of its director. The term “more protection” refers to an insurance policy that has a higher policy limit and/or a lower deductible.
10 The Journal of Financial Perspectives
Directors’ and officers’ insurance and shareholder protection
to increase the size of the dataset compared to Compustat9 alone. Stock prices and total returns are drawn from the Toronto Stock Exchange (TSE) Western tapes. Information concerning managerial compensation and board composition was coded directly from each corporation’s information circular and management proxy. Since 1996 all management proxies and information circular are available on the website of SEDAR (http://www.sedar.com/). Prior to this date the information must be collected from the companies directly, or purchased from Micromedia.
Information regarding D&O insurance purchases and executive compensation of publicly traded Canadian companies listed on the Toronto Stock Exchange were collected from the annual management proxies and information circulars. Management proxies also provide information related to the firm’s block holders, board member compensation and ownership, as well as the type and number of stock held by each officer (regular or multi-voting). Basic information (whether the corporation had D&O insurance, and if so, what was the policy limit, the deductible and the premium) regarding D&O coverage must also be reported.
3.6 D&O insurance data informationThe original sample included 354 Canadian corporations drawn
9 Unfortunately information is not always the same for corporations whose financial information appears in more than one source. If that occurred, I used a lexicographic approach to the problem, trusting the Compustat entry over the other two, and the Stock Guide entry over CanCorp’s.
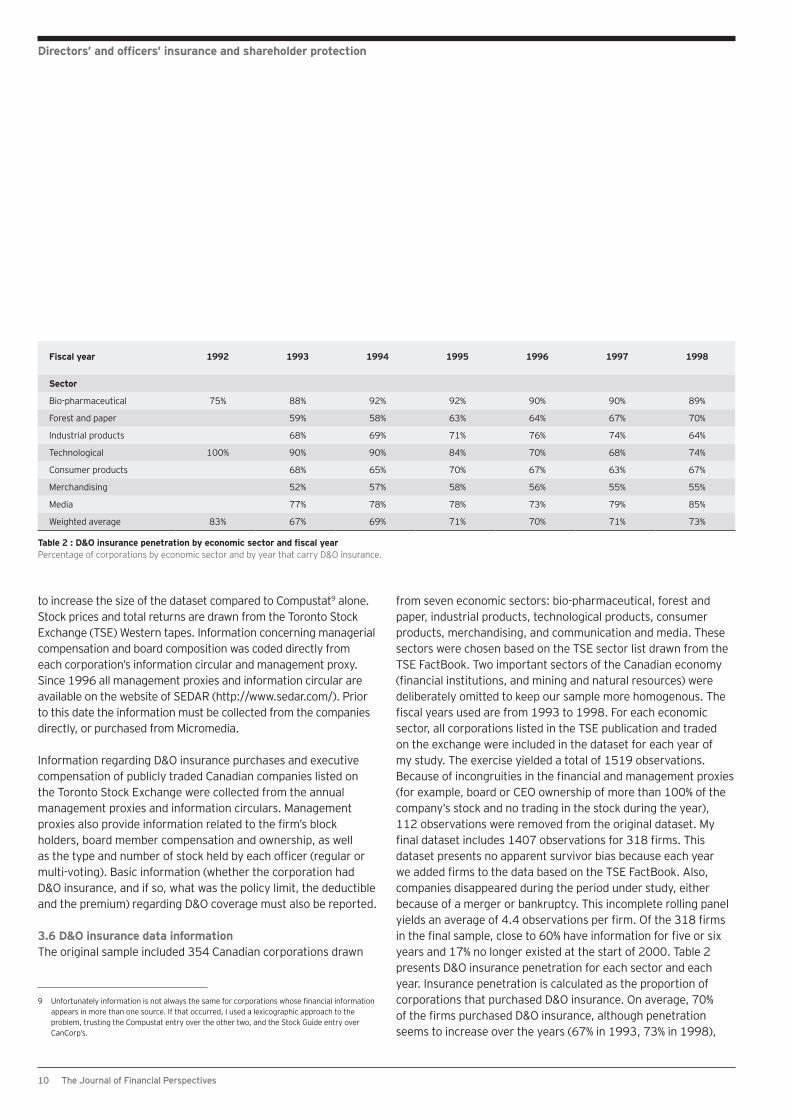
from seven economic sectors: bio-pharmaceutical, forest and paper, industrial products, technological products, consumer products, merchandising, and communication and media. These sectors were chosen based on the TSE sector list drawn from the TSE FactBook. Two important sectors of the Canadian economy (financial institutions, and mining and natural resources) were deliberately omitted to keep our sample more homogenous. The fiscal years used are from 1993 to 1998. For each economic sector, all corporations listed in the TSE publication and traded on the exchange were included in the dataset for each year of my study. The exercise yielded a total of 1519 observations. Because of incongruities in the financial and management proxies (for example, board or CEO ownership of more than 100% of the company’s stock and no trading in the stock during the year), 112 observations were removed from the original dataset. My final dataset includes 1407 observations for 318 firms. This dataset presents no apparent survivor bias because each year we added firms to the data based on the TSE FactBook. Also, companies disappeared during the period under study, either because of a merger or bankruptcy. This incomplete rolling panel yields an average of 4.4 observations per firm. Of the 318 firms in the final sample, close to 60% have information for five or six years and 17% no longer existed at the start of 2000. Table 2 presents D&O insurance penetration for each sector and each year. Insurance penetration is calculated as the proportion of corporations that purchased D&O insurance. On average, 70% of the firms purchased D&O insurance, although penetration seems to increase over the years (67% in 1993, 73% in 1998),
Fiscal year 1992 1993 1994 1995 1996 1997 1998
Sector
Bio-pharmaceutical 75% 88% 92% 92% 90% 90% 89%
Forest and paper 59% 58% 63% 64% 67% 70%
Industrial products 68% 69% 71% 76% 74% 64%
Technological 100% 90% 90% 84% 70% 68% 74%
Consumer products 68% 65% 70% 67% 63% 67%
Merchandising 52% 57% 58% 56% 55% 55%
Media 77% 78% 78% 73% 79% 85%
Weighted average 83% 67% 69% 71% 70% 71% 73%
Table 2 : D&O insurance penetration by economic sector and fiscal year Percentage of corporations by economic sector and by year that carry D&O insurance.
11The Journal of Financial Perspectives
which is slightly higher than the 63% penetration reported by Core (1997). Although Core relies on the same public information source as mine, his sample of companies is different because he includes public utility, financial and mining corporations.
Of the 1,407 firm-years, 988 report having D&O insurance. Of these, I have information about the policy limit for 985 firm-years; the other three observations are for a company whose parent provided D&O coverage. Information about the deductible amount is revealed in only 861 cases; the other 124 cases are missing. This causes an identification problem: was the deductible omitted by mistake or was it equal to zero and not mentioned as such? Three possibilities are offered to me. I can set the deductible to zero, I can eliminate the 124 observations for which no deductible is mentioned or I can set the deductible to the lowest amount in our dataset ($10,000). I opted for the latter, although the results are sensibly the same whichever approach I use.
4. Methodology and resultsAn important methodological assumption I make in the present analysis is that the insurance company and the board of directors know what the financial health of the corporation is before negotiating over the D&O insurance contract. In other words, the annual report is known before the D&O insurance contract is chosen. Moreover, given that the cost to a firm of purchasing a D&O insurance policy is very small compared to its total cash flows (an average premium of $85,000 versus assets of $1b and total debt of over $700m), I feel it is reasonable to assume that the demand for D&O insurance does not affect the firm’s financial and operational decisions. As a consequence, I shall treat all the information related to each firm’s financial status (leverage, bankruptcy risk, stock volatility, etc.) as being exogenous when determining the choice of D&O insurance coverage.
The current analysis focuses only on the demand side. The entire supply side of the D&O insurance market is untouched. The underlying logic is that the D&O insurance market is very competitive, especially during the nineties. Moreover, as Core (1997) reports, "the vast majority of firms could obtain insurance at some price, no matter how risky they were" (page 66). As a result, any firm may purchase as high a policy limit as it requires [see also Doyle (1991), and Feldhaus and Klein (2001), for more details on the competitiveness of the D&O insurance market].
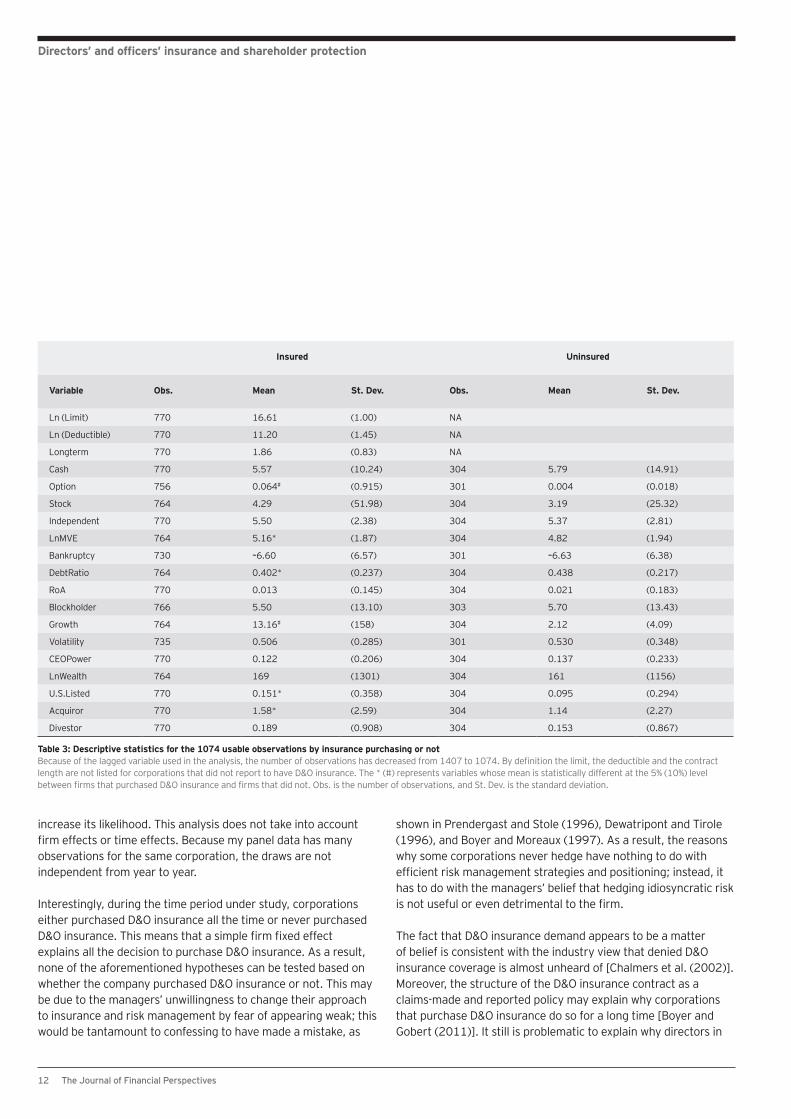
4.1 D&O purchase: comparing means and likelihood 4.1.1 Descriptive statisticsTable 3 presents the variables’ summary statistics after removing observations for which the lagged value of assets is not available. The number of observations is thus reduced from 1407 to 1074, which means that the number of firm-years where D&O insurance was purchased is reduced from 988 to 770. The mean of every variable is calculated for corporations that carried D&O insurance (first set of numbers) and for corporations that did not carry D&O insurance (second set of numbers). It appears that corporations that purchase D&O insurance are larger (LnMVE), are more likely to be listed in the U.S. (U.S.Listed) and are more likely to have engaged in a round of mergers and acquisition in the past year (Acquiror). Firms that carry D&O insurance are only marginally more likely to compensate their directors through the use of stock options. The reason may be that very few corporations distribute options to their directors: only 14% of D&O insurance purchasers and 11% of non-purchasers give stock options to their managers. Corporations that carry D&O insurance also appear to be more growth oriented, but only marginally so. Finally, corporations that carry D&O insurance have a smaller debt ratio than corporations that do not.
4.1.2 Likelihood of carrying D&O insuranceBefore exploring what explains D&O insurance policy limits and deductibles, it would be interesting to find the determinant of the purchase, or not, of the policy. Once I have determined what type of corporations purchase D&O insurance, I will then be able to study what determines the policy limit and the deductible, given that the corporation has purchased the insurance policy.
Looking back at Table 3, one could expect that size, financial structure, growth opportunities and listing on an American stock exchange could be important determinants of D&O insurance purchases. When I run a probit regression,10 using all the independent variables, only four variables appear to have any significance: Bankruptcy, DebtRatio, U.S.Listed and Acquiror. Except for the debt ratio variable that reduces the likelihood of carrying D&O insurance, the other three variables appear to
10 Table not shown. It is important to mention that this regression does not use a dummy variable for the year or for the firm.
12 The Journal of Financial Perspectives
Directors’ and officers’ insurance and shareholder protection
increase its likelihood. This analysis does not take into account firm effects or time effects. Because my panel data has many observations for the same corporation, the draws are not independent from year to year.
Interestingly, during the time period under study, corporations either purchased D&O insurance all the time or never purchased D&O insurance. This means that a simple firm fixed effect explains all the decision to purchase D&O insurance. As a result, none of the aforementioned hypotheses can be tested based on whether the company purchased D&O insurance or not. This may be due to the managers’ unwillingness to change their approach to insurance and risk management by fear of appearing weak; this would be tantamount to confessing to have made a mistake, as
shown in Prendergast and Stole (1996), Dewatripont and Tirole (1996), and Boyer and Moreaux (1997). As a result, the reasons why some corporations never hedge have nothing to do with efficient risk management strategies and positioning; instead, it has to do with the managers’ belief that hedging idiosyncratic risk is not useful or even detrimental to the firm.
The fact that D&O insurance demand appears to be a matter of belief is consistent with the industry view that denied D&O insurance coverage is almost unheard of [Chalmers et al. (2002)]. Moreover, the structure of the D&O insurance contract as a claims-made and reported policy may explain why corporations that purchase D&O insurance do so for a long time [Boyer and Gobert (2011)]. It still is problematic to explain why directors in
Insured Uninsured
Variable Obs. Mean St. Dev. Obs. Mean St. Dev.
Ln (Limit) 770 16.61 (1.00) NA
Ln (Deductible) 770 11.20 (1.45) NA
Longterm 770 1.86 (0.83) NA
Cash 770 5.57 (10.24) 304 5.79 (14.91)
Option 756 0.064# (0.915) 301 0.004 (0.018)
Stock 764 4.29 (51.98) 304 3.19 (25.32)
Independent 770 5.50 (2.38) 304 5.37 (2.81)
LnMVE 764 5.16* (1.87) 304 4.82 (1.94)
Bankruptcy 730 –6.60 (6.57) 301 –6.63 (6.38)
DebtRatio 764 0.402* (0.237) 304 0.438 (0.217)
RoA 770 0.013 (0.145) 304 0.021 (0.183)
Blockholder 766 5.50 (13.10) 303 5.70 (13.43)
Growth 764 13.16# (158) 304 2.12 (4.09)
Volatility 735 0.506 (0.285) 301 0.530 (0.348)
CEOPower 770 0.122 (0.206) 304 0.137 (0.233)
LnWealth 764 169 (1301) 304 161 (1156)
U.S.Listed 770 0.151* (0.358) 304 0.095 (0.294)
Acquiror 770 1.58* (2.59) 304 1.14 (2.27)
Divestor 770 0.189 (0.908) 304 0.153 (0.867)
Table 3: Descriptive statistics for the 1074 usable observations by insurance purchasing or notBecause of the lagged variable used in the analysis, the number of observations has decreased from 1407 to 1074. By definition the limit, the deductible and the contract length are not listed for corporations that did not report to have D&O insurance. The * (#) represents variables whose mean is statistically different at the 5% (10%) level between firms that purchased D&O insurance and firms that did not. Obs. is the number of observations, and St. Dev. is the standard deviation.

13The Journal of Financial Perspectives
corporations that do not purchase D&O insurance do not care about it.
4.2 Policy limit and deductibleThe Probit analysis suggests that a corporation’s financial health and structure, and its board’s compensation and composition have no impact on its decision to purchase D&O insurance or not. Nothing is said in those results about the D&O insurance coverage in firms that have decided to purchase some. Firm-specific conditions may have an impact on the chosen policy limit or deductible. This section of the paper deals with the demand for D&O insurance, given that it was purchased.
In studies on insurance demand and hedging, it is normally important to control for the fact that the dependent variable is truncated at zero because we do not know the policy limit choice of corporations that did not purchase any insurance. As a result, standard econometric methodology [Green (1997)] asks us to use a Tobit regression approach and the Mills’ ratio to control for those unobservable. This is the approach used in the Core (1997) study.
A Tobit regression is not warranted here, however, because the decision to purchase D&O insurance has nothing to do with any financial, corporate governance or litigation risk measure. It is rather based on whether the corporation purchased D&O insurance the previous year and on some fixed firm characteristic. Thus, not only can I discard completely from the analysis all firms that never purchased D&O insurance, but I do not even need to control for the selection bias.
Table 4 presents the results of an ordinary least square regression with fixed effect with all the independent variables. The first regression model in Table 4 explains the policy limit choice and the second the deductible choice. The regression model assumes that the deductible and the policy limit are chosen independently of each other. This may not be the case, however. Policyholders usually choose the policy limit before they negotiate the deductible. It may then be important to control for the timing in the choice variables, which I shall do in Section 4.3 of the paper. The fixed effect regression models are able to explain more than 90% of the variations in both dependent variables.
4.2.1 Policy limitIn the policy limit regression, only director cash compensation, market value of equity, debt ratio and the presence of large financial institution block holders appear to have a significant impact on the policy limit. The negative sign on cash supports the efficient compensation package hypothesis, even though the two other variables used to measure this hypothesis (option and stock) are not significant. The insignificant impact of option and stock may be due to the fact that very few corporations compensate their outside directors through stock and stock option grants. Moreover, because litigation occurs when the stock price falls precipitously, managers may feel that compensation linked to the value of the corporation is not a good substitute for D&O insurance coverage. The negative sign on cash suggests that board members consider D&O insurance as part of their overall compensation package. As a result, they are willing to sacrifice part of their cash compensation for protection against adverse negative shocks to their personal wealth in the event of a lawsuit.
With respect to the shareholder protection hypothesis, strong support is shown through the combination of the positive sign on both the DebtRatio variable and, more importantly, on the LnMVE variable. The two variables used to measure this hypothesis are significant at the 1% level in explaining the D&O insurance policy limit. Thus, when shareholders have more wealth to lose and/or when creditors are relatively more involved, corporations purchase more coverage against managerial incompetence. Because this insurance coverage benefits disproportionately the shareholders, as suggested by Romano (1991a), the shareholder protection hypothesis appears validated by the empirical analysis. Put in the context of homeowner insurance, as the value of the house (the asset at risk) increases, individuals (the shareholders and the creditors) want to protect the value in their house through an increase in insurance coverage (typically an increase in the policy limit).
It is true that the positive sign on DebtRatio lends support to both the shareholder protection and the financial distress hypotheses. The support for the latter is, however, weaker than for the former for two reasons. First and foremost, the positive sign on LnMVE contradicts the financial distress hypothesis, although it confirms the shareholder protection hypothesis. Second, no other variable used to measure the cost of financial distress (bankruptcy and RoA) is significant.

14 The Journal of Financial Perspectives
Directors’ and officers’ insurance and shareholder protection
Another hypothesis for which I only find weak support is the monitoring hypothesis that states that D&O insurance coverage was a substitute for other forms of managerial control such as the presence of creditors and of large block holders. I, therefore, expected a negative relationship between coverage and the DebtRatio and Blockholder variables. With respect to Blockholder, the monitoring hypothesis finds support, but the impact of DebtRatio on coverage is opposite to what was expected. Consequently, and similarly to the financial distress hypothesis, support for the monitoring hypothesis is not convincing because:
(i) only the Blockholder variable supports it and (ii) another measure used to test it, namely DebtRatio, has the wrong sign (and significantly so).
With respect to the risk aversion, managerial quality signaling and managerial entrenchment hypotheses, I find no significant impact on the policy limit choice. Even the variables used to control for higher litigation risk, including whether the corporation is listed in the U.S., do not seem to have an impact on the D&O insurance policy limit.
Pred. sign Policy limit Deductible
Variable Hypothesis Lim. Ded. Coefficient St. Dev. Coefficient St. Dev.
Cash (1000) Package – + –8.403** (2.660) –1.358 (5.113)
Option Package – + –0.017 (0.013) –0.030 (0.025)
Stock (1000) Package – + 0.190 (0.603) 0.064 (1.159)
Independent (%) Aversion + – 0.633 (1.210) 1.292 (2.327)
lnMVE Distress shareholder
+ + 0.108** (0.033) 0.024 (0.063)
Bankruptcy (%) Distress + – –0.003 (0.243) –0.728 (0.467)
DebtRatio Distress monitor shareholder
+ + + 0.386** (0.149) 0.388 (0.287)
RoA Distress – + –0.144 (0.131) –0.068 (0.252)
Blockholder (%) Monitor – + –0.523** (0.187) –0.251 (0.360)
Growth (%) Signaling – + 0.022 (0.072) 0.399** (0.139)
Volatility Signaling – + 0.045 (0.065) 0.240# (0.125)
CEOPower Entrenchment + – 0.046 (0.180) 0.350 (0.347)
InWealth (1000) Entrenchment + – –0.057 (0.084) –0.464** (0.161)
U.S.Listed Litigation + + 0.081 (0.058) 0.225** (0.109)
Acquiror (%) Litigation + + –0.807 (0.515) 0.312 (0.990)
Divestor (%) Litigation + + 1.428 (1.271) 0.054 (2.444)
Long term – – –0.177** (0.017) –0.048 (0.033)
Firm-fixed effect Included Included
Time-fixed effect Included Included
0.959 0.928
Table 4: The determinants of policy limit and deductible amounts ordinary least square regressions with firm and year fixed effects The dependent variables are the log of the policy limit and the log of the deductible. Ordinary least square regression using time and firm fixed effects. The hypothesis or hypotheses that each independent variable wants to test is presented in the second column. Also, the second column gives the predicted sign of each coefficient on the dependent variable; the first sign is the predicted impact on the policy limit and the second sign is the predicted impact on the deductible. The ** represents a coefficient that is significant at the 1% level, * significant at the 5% level and # at the 10% level. Some coefficients have been scaled for presentation purposes. Standard errors are in parentheses. N=696.
15The Journal of Financial Perspectives
4.2.2 DeductibleIn the deductible regression, it is interesting to see that none of the variables that had any explanation power in determining the limit have any power in determining the deductible. Rather, the four variables that have any explanatory power are the measure of growth opportunity, stock volatility, corporate insider wealth and whether the corporation is listed in the U.S. The first three variables suggest that the managerial signaling and the managerial entrenchment hypotheses are both supported by the data.
The signaling hypothesis predicted that when it is harder to assess the quality of a manager, then good managers will want to signal their quality by choosing an insurance contract that protects them less. In other words, they will choose an insurance contract with a higher deductible. In my analysis, I used the presence of growth opportunities and the volatility of market returns as instances when managers are more likely to want to signal their quality. In the regression, both the Growth and the Volatility variables are positively correlated with the deductible, just as the managerial signaling hypothesis predicted. This result is in accordance with standard adverse selection in insurance results where agents prefer to signal their quality through a higher deductible rather than a lower limit. The case for the managerial signaling hypothesis is, therefore, strong in the determination of the deductible, as it was for the shareholder protection hypothesis in the determination of the policy limit. With respect to the managerial entrenchment hypothesis, it appears that the more wealth insiders have in the corporation, the more protection the corporation purchases on their behalf through a lower deductible.
Similar to the case of the policy limit, I find no evidence that managerial risk aversion plays any role in the determination of the deductible. This may suggest that limited liability plans and corporate indemnification provisions protect directors sufficiently so that they do not need D&O insurance as much.
4.2.3 DiscussionIt is interesting to see that no hypothesis is supported by the policy limit and the deductible regressions simultaneously. This raises questions related to the possibility of model over-fitting. Another question raised by the results in Table 4 is that the motivation behind the determinants of the policy limit and of
the deductible are not the same so that different hypotheses explain different aspects of the demand for D&O insurance. To see whether I am over-fitting the model, I restrict the regression model to include only the variables that have predictive power on each dependent variable. The regression models are thus
Limit Cash LnMVE DebtRatio Blockholder Longterm d di,t i,t i,t i,t i,t i,t t i i,t= + + + + + + + h and
The regressions results are displayed in Table A1 in the Appendix. Put succinctly, all the variables used in the restricted model have an impact on the corresponding dependent variables that is the same as in Table 4. Thus, there does not appear to be any over-fitting problem associated with my main results.
The only difference between Panel A and B in Table A1 is that more observations are used in Panel B. Why is that? Note that in the restricted model, no variable is constructed using a lagged observation (i.e., Acquiror and Divestor are not used). As a result, I am able to add observations that were deleted in the regressions in Table 4. The regression results are sensibly the same; the only difference being that Volatility is no longer significant in explaining the deductible. The reduction in significance is not very large, however, since Volatility was only significant at the 10% level in Table 4.
These ordinary least squares (OLS) results do not consider the fact that, usually, policyholders choose the policy limit before the deductible so that, when the time comes to choose the deductible amount, the policy limit is known. As a consequence the OLS results for the deductible may be biased. Another possibility is that the deductible and the policy limit are chosen simultaneously. I conduct these robustness checks in the next section.
4.3 RobustnessIn this section of the paper, I test the robustness of the results in two ways. First, I control for possible endogeneity issues that arise from the choice of the policy limit and the deductible. Second, because D&O insurance limits are characterized with sticky points (see Section 2.1), the dependent variable is not continuous. Thus, an ordered Probit approach may be more appropriate.
Deductible Growth Volatility LnWealth U.S.Listed d di,t i,t i,t i,t i,t t i i,t= + + + + + + e
16 The Journal of Financial Perspectives
Directors’ and officers’ insurance and shareholder protection
4.3.1 EndogeneityEndogeneity may take on many forms. I test for two, which are presented in Tables A2 and A3 in the Appendix. First, I see whether the sequence of choice in the insurance contract has any impact on the dependent variables. Second, I test for simultaneity in the choice of each dependent variable to see whether the independent assumptions are not driving the results.
The first robustness check I conduct is to test whether the deductible is chosen after the limit during the negotiations between the corporation and the insurance broker. Because it is through a higher deductible that a policyholder can most reduce his premium, and because the policy limit is the most important part of the insurance contract, it makes intuitive sense to negotiate the policy limit first, then to negotiate the deductible. As a result, the policy limit is known when time comes to choose the deductible. The deductible regression is presented in Table A2. By adding the policy limit as a determinant of the deductible does not change the results greatly compared to those presented in Table 4.
A second source of endogeneity may be that the policy limit and the deductible are chosen simultaneously. To test for this endogeneity, I shall use a two-stage instrumental variable regression of the form Limit Cash lnMVE DebtRatio Blockholder Longterm Deductible d di,t i,t i,t i,t i,t i,t i,t t i i,t= + + + + + + ++ h\
Limit Cash lnMVE DebtRatio Blockholder Longterm Deductible d di,t i,t i,t i,t i,t i,t i,t t i i,t= + + + + + + ++ h\
and
Growth Volatility InWealth U.S.Listed d dDeductible Limiti,t i,t i,t i,t i,t t i i,ti,t= + + + + + ++ e\Growth Volatility InWealth U.S.Listed d dDeductible Limiti,t i,t i,t i,t i,t t i i,ti,t= + + + + + ++ e\
Where Limit i,t\ and Deductiblei,t\ represent the predicted value of each variable obtained from the reduced-form regressions. The reduced-form regressions are
Limit X X d di,t i,tLimit
i,tDeduct
t i i,tDeduct= + + +, e^ h
and
Deductible X X d di,t i,tLimit
i,tDeduct
t i i,tDeduct= + + +, e^ h
For notation, I let Xk be the matrix of independent variables that explains each dependent variable, dt is the year dummy variable and di is the firm dummy variable. X Xi,t
Limiti,tDeduct,^ h is the union of
the independent variables.
The results from the structural form regressions are presented in Table A3 (the results from the reduced-form regressions are not shown). As we see, all variables remain significant and are of the anticipated sign, including the predicted dependent variables. The results are sensibly the same as those obtained in Table A1 when we ran a restricted OLS regression using firm- and time-fixed effects.
As in Panel A of Table A1, no variable used in Panel A of Table A3 relies on the use of a lagged observation. As a result, I am able to add some observations back to regression. The two-stage regression results from the restricted model using all available observations are presented in Panel B of Table A3. Overall, the regression results are basically the same as those presented in Panel B of Table A1, but with some variables having more explanatory power and others having less. I can, therefore, be reasonably certain that the endogeneity problem is not severe since the shareholder protection hypothesis is still supported even after controlling for potential endogeneity problems.
4.3.2 ProbitAs mentioned earlier, the D&O insurance market is characterized by sticky points. As a result, the policy limit choice does not seem to follow a continuous distribution. In fact, six policy limit levels account for two-thirds of all D&O insurance policy sold in 1998: $5m, $10m, $15m, $20m, $25m and $50m. Other years have similar sticky points. It is then appropriate to take into account these jumps using an ordered Probit approach. The results from the ordered Probit are presented in Table 5. The results are sensibly the same as those presented in the main body of the paper. The most important differences appear not in the determinants of the policy limit, but in the determinants of the deductible. In this Probit analysis, the risk of bankruptcy appears to reduce the size of the deductible in accordance with the financial distress hypothesis. At the same time, however, the debt ratio increases the deductible, thus invalidating the financial distress hypothesis. It is, therefore, not clear what conclusion to draw from these results. Similarly, the managerial entrenchment hypothesis is
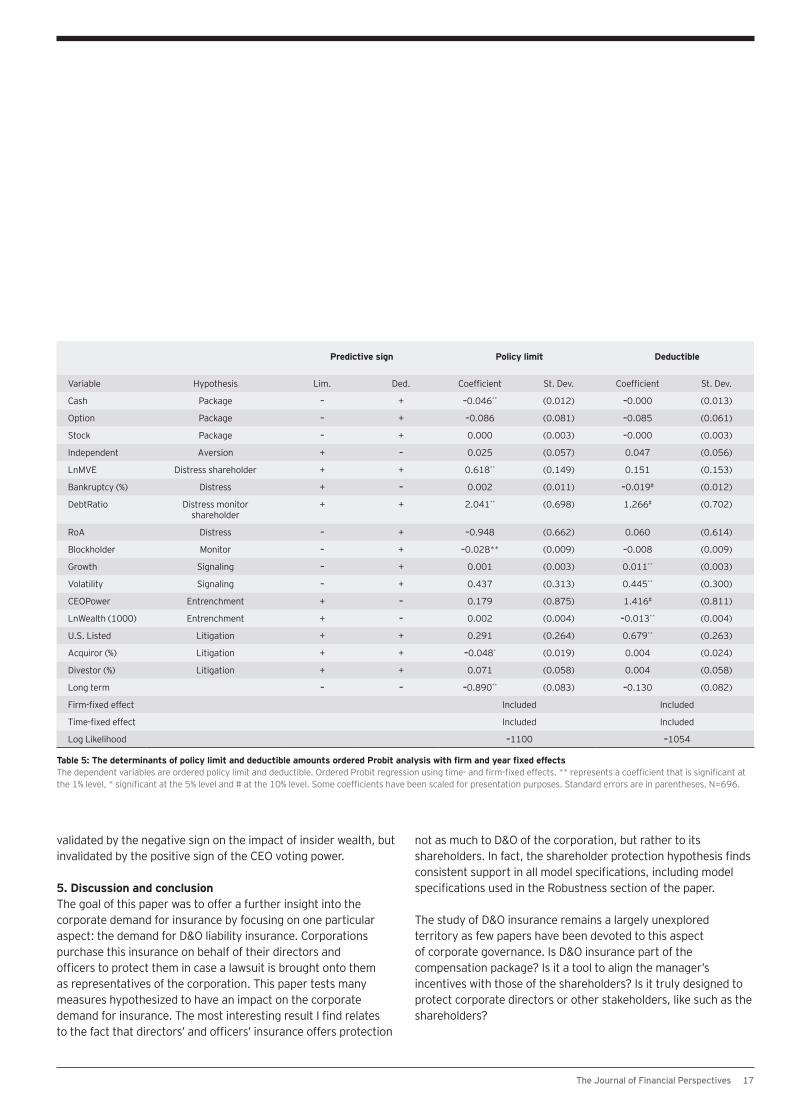
17The Journal of Financial Perspectives
validated by the negative sign on the impact of insider wealth, but invalidated by the positive sign of the CEO voting power.
5. Discussion and conclusionThe goal of this paper was to offer a further insight into the corporate demand for insurance by focusing on one particular aspect: the demand for D&O liability insurance. Corporations purchase this insurance on behalf of their directors and officers to protect them in case a lawsuit is brought onto them as representatives of the corporation. This paper tests many measures hypothesized to have an impact on the corporate demand for insurance. The most interesting result I find relates to the fact that directors’ and officers’ insurance offers protection
not as much to D&O of the corporation, but rather to its shareholders. In fact, the shareholder protection hypothesis finds consistent support in all model specifications, including model specifications used in the Robustness section of the paper.
The study of D&O insurance remains a largely unexplored territory as few papers have been devoted to this aspect of corporate governance. Is D&O insurance part of the compensation package? Is it a tool to align the manager’s incentives with those of the shareholders? Is it truly designed to protect corporate directors or other stakeholders, like such as the shareholders?
Predictive sign Policy limit Deductible
Variable Hypothesis Lim. Ded. Coefficient St. Dev. Coefficient St. Dev.
Cash Package – + –0.046** (0.012) –0.000 (0.013)
Option Package – + –0.086 (0.081) –0.085 (0.061)
Stock Package – + 0.000 (0.003) –0.000 (0.003)
Independent Aversion + – 0.025 (0.057) 0.047 (0.056)
LnMVE Distress shareholder + + 0.618** (0.149) 0.151 (0.153)
Bankruptcy (%) Distress + – 0.002 (0.011) –0.019# (0.012)
DebtRatio Distress monitor shareholder
+ + 2.041** (0.698) 1.266# (0.702)
RoA Distress – + –0.948 (0.662) 0.060 (0.614)
Blockholder Monitor – + –0.028** (0.009) –0.008 (0.009)
Growth Signaling – + 0.001 (0.003) 0.011** (0.003)
Volatility Signaling – + 0.437 (0.313) 0.445** (0.300)
CEOPower Entrenchment + – 0.179 (0.875) 1.416# (0.811)
LnWealth (1000) Entrenchment + – 0.002 (0.004) –0.013** (0.004)
U.S. Listed Litigation + + 0.291 (0.264) 0.679** (0.263)
Acquiror (%) Litigation + + –0.048* (0.019) 0.004 (0.024)
Divestor (%) Litigation + + 0.071 (0.058) 0.004 (0.058)
Long term – – –0.890** (0.083) –0.130 (0.082)
Firm-fixed effect Included Included
Time-fixed effect Included Included
Log Likelihood –1100 –1054
Table 5: The determinants of policy limit and deductible amounts ordered Probit analysis with firm and year fixed effectsThe dependent variables are ordered policy limit and deductible. Ordered Probit regression using time- and firm-fixed effects. ** represents a coefficient that is significant at the 1% level, * significant at the 5% level and # at the 10% level. Some coefficients have been scaled for presentation purposes. Standard errors are in parentheses. N=696.

18 The Journal of Financial Perspectives
Directors’ and officers’ insurance and shareholder protection
Because the shareholders’ wealth and the reliance on debt as a source of capital appear to be positively linked to the demand for D&O insurance, I conclude that the evidence supports the view that D&O insurance is used by shareholders to protect their own wealth in case of managerial incompetence. Whereas the traditional literature on risk management predicts that larger corporations should purchase relatively less insurance because they face lower bankruptcy costs and are better able to spread risk over its different operations, I find that the more shareholders have at risk, the larger is the insurance protection.
Two other results are surprising by their absence in the sense that risk aversion and financial distress do not appear to find any support. In case of risk aversion, given that D&O insurance is generally said to attract better risk-averse directors unto the corporation’s board, two possible reasons explain why risk aversion does not appear to play any role. First, it is possible that the variables I use are not good proxies for managerial risk aversion. A second reason is that D&O insurance is not used to reduce the risk-averse directors’ risk exposure since better mechanisms are available to reduce it. One such mechanism is the use of limited liability plans for corporate boards. By adopting an LLP, a corporation tells potential directors that their personal wealth is not too much at risk in the event of a lawsuit brought unto them as representatives of the corporation. The LLPs typically state that outside directors cannot lose more than some relatively small amount in the event of a lawsuit. As a result, LLPs are better designed to alleviate the fears of outside directors than a D&O insurance. In case of financial distress, of all the measures I use, only the debt ratio had an impact that supported the hypothesis.
ReferencesAgrawal, A., and C. R. Knoeber, 1996, “Firm performance and mechanisms to control agency problems between managers and shareholders,” Journal of Financial and Quantitative Analysis 31, 377–397Baker, T., and S. J. Griffith, 2007, “Predicting corporate governance risk: Evidence from the Directors’ and Officers’ liability insurance market,” University of Chicago Law Review 74, 1–57Baker, T., and S. J. Griffith, 2010, Ensuring corporate misconduct. The University of Chicago PressBarney Jr., L. D., 1992, “The purchase of insurance by a risk-neutral firm for a risk-averse agent: an extension,” Journal of Risk and Insurance 59, 655–659Bauer, R., R. Braun, F. Moers, 2008, “Sued or glued: how to compensate the CEO,” Unpublished Working Paper, SSRNBecht, M., P. Bolton, A. Roell, 2003, “Corporate governance and control,” in Constantinides, G., M. Harris, and R. Stulz (Eds.), Handbook of economics of finance, Elsevier, AmsterdamBessembinder, H., 1991, “Forward contracts and firm value: investment incentive and contracting effects,” Journal of Financial and Quantitative Analysis 26, 519–532Bhagat, S., J. A. Brickley, and J. L. Coles, 1987, “Managerial indemnification and liability insurance: the effect on shareholder wealth,” Journal of Risk and Insurance 54, 721–736Boyer, M. M., and M. Moreaux, 1997, “Capacity commitment versus flexibility,” Journal of Economics and Management Strategy 6, 347–376Boyer, M. M., 2005, “Assessing the demand for Directors’ and Officers’ insurance using public information,” Journal of Forensic Accounting 6, 389–410Boyer, M. M., 2008, “Three insights from the Canadian D&O insurance market: inertia, information and insiders,” Connecticut Insurance Law Journal 14, 75–106Boyer, M. M., and K. Gobert, 2001, “Professional liability insurance contracts: claims-made versus occurrence policies,” Insurance and Risk Management 79(3), 251–278Boyer, M. M., and L. H. Stern, 2012, “Is corporate governance risk valued? Evidence from Directors’ and Officers’ Insurance,” Journal of Corporate Finance 18, 349–372Boyer, M. M., and L. H. Stern, 2013, “D&O Insurance and IPO performance: what can we learn from insurers?” CIRANO working paperBoyer, M. M., and S. Tennyson, 2012, “Directors’ and Officers’ liability insurance, corporate risk and risk taking: panel data evidence on the role of Directors’ and Officers’ liability insurance,” Risk Theory Society, TallahasseeBradley, M., and C. Schipani, 1989, “The relevance of duty of care standard in corporate governance,” Iowa Law Review 75, 1–74Brook, Y., and R. K. S. Rao, 1994, “Shareholder wealth effects of directors’ liability limitation provisions,” Journal of Financial and Quantitative Analysis 29, 481–497Chacko, G., P. Tufano, and G. Verter, 2001, “Cephalon, Inc. Taking risk management theory seriously,” Journal of Financial Economics 60, 449–48Chalmers, J. M. R., L. Y. Dann, and J. Harford, 2002, “Managerial opportunism? Evidence from Directors’ and Officers’ insurance purchases,” Journal of Finance 57, 609–639Chang, S.-C., and J. Yeh, 2011, “Show me the information: board independence and D&O insurance,” Chinese University of Hong Kong working paper, 2011 ARIA meeting, San DiegoChen, T.-J., and S.-H. Li, 2010, “Directors’ & officers’ insurance, corporate governance and firm performance,” International Journal of Disclosure and Governance 7, 244–261Clarkson, P., and D. Simunic, 1994, “The association between audit quality, retained ownership and firm-specific risk in United States vs. Canadian IPO markets,” Journal of Accounting and Economics 17, 207–228Core, J. E., 1997, “On the corporate demand for Directors’ and Officers’ insurance,” Journal of Risk and Insurance 64, 63–87

19The Journal of Financial Perspectives
Core, J. E., 2000, “The Directors’ and Officers’ insurance premium: an outside assessment of the quality of corporate governance,” Journal of Law, Economics and Organization 16, 449–477DeMarzo, P., and D. Duffie, 1991, “Corporate financial hedging with proprietary information,” Journal of Economic Theory 53, 261–286Dewatripont, M., and J. Tirole, 1996, “Biased principals as a discipline device,” Japan and the World Economy 8, 195–206Doherty, N. A., 1991, “The design of insurance contracts when liability rules are unstable,” Journal of Risk and Insurance 58, 227–246Doyle, C. S., 1991, “Bargaining on the D&O coverage,” The Corporate Board Special Report, July/August, 13–17Eitel, N. R., 2000, “Now you have it, now you don’t: Directors’ and Officers’ insurance after a corporate bankruptcy,” Loyola Law Review 46, 585–617Emerson, H. G., and G. A. Clarke, 2003, “Bill 198 and Ontario’s Securities Act: giving investors and the OSC added muscle,” Fasken Martineau DuMoulin LLP Publication, 3rd Annual Directors’ Governance Summit, NovemberFeldhaus, W. R., and R. W. Klein, 2001, “Professional liability in the New Economy,” Working paper RR01–3, Center for Risk Management and Insurance Research, Georgia State UniversityFier, S., J. Gable, K. A. McCullough, and N. Mansfield, 2010, “The Directors and Officers insurance marketplace: an empirical examination of supply and demand in uncertain times,” WRIEC 2010 meeting, SingaporeGillan, S., and C. Panasian, 2009, “Reassessing what matters in corporate governance: evidence from the market for Directors’ and Officers’ liability insurance,” FMA 2009 meeting, RenoGraham, J. R., and D. A. Rogers, 2002, “Do firm hedge in response to tax incentives?” Journal of Finance 57, 815–839Graham, J. R., and C. W. Smith, 1999, “Tax incentives to hedge,” Journal of Finance 54, 2241–2262Griffith, S. J., 2006, “Uncovering a gatekeeper: why the SEC should mandate disclosure of de¬tails concerning Directors’ and Officers’ liability insurance policies,” University of Pennsylvania Law Review 154, 1147–1208Gutierrez, M., 2003, “An economic analysis of corporate Directors’ fiduciary duties,” Rand Journal of Economics 34, 516–535Gutierrez, M., 2000, “A contractual approach to the regulation of corporate Directors’ fiduciary duties,” Working Paper 0013 Universidad Carlos III de MadridHanks, J. J., 1988, “Evaluating recent State legislation on Director and Officer liability limitation and indemnification,” Business Lawyer 43, 1207–1254Hartmann, C. J., and P. G. Rogers, 1991, “The influence of Smith v. Van Gorkom on Director’s and Officer’s liability,” Journal of Risk and Insurance 58, 525–535Heys, B. A., and M. L. Berenblut, 2012, “Trends in Canadian securities class actions (2011 update): pace of filings grows, pace of settlements slows,” NERA Economic Consulting PublicationHolderness, C. G., 1990, “Liability insurers as corporate monitors,” International Review of Law and Economics 10, 115–129Janjigian, V., and P. J. Bolster, 1990, “The elimination of Director liability and stockholder returns: an empirical investigation,” Journal of Financial Research 13, 53–60Kaltchev, G. D., 2006, “Dynamic panel models with Directors’ and Officers’ liability insurance data,” in Baltagi, B. H., (Ed.), Panel data econometrics, 351–360Kim, I., 2004, “The role of Directors’ and Officers’ insurance in financial reporting and class action securities litigation,” Mimeo, Duke UniversityKremslehner, R., 2011, “Job market for Directors: the role of limited liability provisions and Directors’ and Officers’ insurance in optimal contracting,” WU — University of Vienna working paper, 2011 ARIA meeting, San DiegoLa Porta, R., F. Lopez-de-Silanes, A. Shleifer and R. Vishny, 1998, “Law and finance,” Journal of Political Economy 106, 1113–1155
La Porta, R., F. Lopez-de-Silanes, A. Shleifer and R. Vishny, 2000, “Investor protection and corporate governance,” Journal of Financial Economics 58, 3–27LaCroix, K. M., 2012, “Canadian securities class action lawsuit filings hit record in 2011,” The D&O Diary, Larsen, M., 2000, “1999 survey confirms competition in the D&O insurance marketplace,” www.irmi.com/expert/articLin, C., M. S. Officer, and H. Zou, 2011, Directors’ and Officers’ liability insurance and acquisition outcomes,” Journal of Financial Economics 102, 507–525O’Sullivan, N., 1997, “Insuring the agents: the role of Directors’ and Officers’ insurance in corporate governance,” Journal of Risk and Insurance 64, 545–556Parry, M. E., and A. E. Parry, 1991, “The purchase of insurance by a risk-neutral firm for a risk-averse agent,” Journal of Risk and Insurance 58, 30–46Prendergast, C., and L. Stole, 1996, “Impetuous youngsters and jaded old-timers: acquiring a rep¬utation for learning,” Journal of Political Economy 104, 1105–1134Rees, R., D. Radulescu, and P. Egger, 2011, “Corporate governance and managerial incentives: evi¬dence from the market for D&O Insurance,” Working paper, ETH ZurichRomano, R., 1991a, “Corporate governance in the aftermath of the insurance crisis,” in Schuck, P. H., (ed.) Tort law and the public interest: competition, innovation, and consumer welfare, W. W. Norton, New YorkRomano, R., 1991b, “The shareholder suit: litigation without foundation?” The Journal of Law, Economics and Organization 7, 55–87Rothschild, M., and J. Stiglitz, 1976, “Equilibrium in competitive insurance markets: an essay on the economics of imperfect information,” Quarterly Journal of Economics 90, 629–649Shleifer, A., and R. W. Vishny, 1997, “A survey of corporate governance,” Journal of Finance 52, 737–783Smith, C. W., and R. M. Stulz, 1985, “The determinants of firms’ hedging policies,” Journal of Financial and Quantitative Analysis 19, 127–140Tufano, P., 1996, “Who manages risk? An empirical examination of risk management practices in”the gold mining industry,” Journal of Finance 51, 1097-1137Winter R. A., 1991, “The liability insurance market,” Journal of Economic Perspectives 5, 115–136Zou, H., S. Wong, C. Shum, J. Xiong, and J. Yan, 2008, “Controlling-minority shareholder incentive conflicts and directors’ and officers’ liability insurance: evidence from China,” Journal of Banking & Finance 32, 2636–2645

20 The Journal of Financial Perspectives
Directors’ and officers’ insurance and shareholder protection
Panel A: Deletion of lagged observations
Predictive sign Policy limit Deductible
Variable Hypothesis Limit Ded. Coefficient St. Dev. Coefficient St. Dev.
Cash (1000) Package – –7.252** (0.012)
LnMVE Distress shareholder + 0.077** (0.081)
DebtRatio Distress monitor shareholder + 0.377** (0.003)
Blockholder (%) Monitor – –0.671** (0.057)
Growth (%) Signaling + (0.149) 0.314** (0.115)
Volatility Signaling + (0.11) 0.181# (0.105)
InWealth (1000) Entrenchment – –0.375** (0.129)
U.S.Listed Litigation + 0.231* (0.104)
Long term – –0.186** (0.017)
Firm and time effects Included Included
Goodness of fit Number of observations
0.954 733
0.925 704
Panel B: Inclusion of lagged observations
Predictive sign Policy limit Deductible
Variable Hypothesis Limit Ded. Coefficient St. Dev. Coefficient St. Dev.
Cash (1000) Package – –5.661** (2.237)
LnMVE Distress shareholder + 0.075** (0.028)
DebtRatio Distress monitor shareholder + 0.439** (0.141)
Blockholder (%) Monitor – –0.562** (0.167)
Growth (%) Signaling + 0.096** (0.105)
Volatility Signaling + 0.146 (0.093)
LnWealth (1000) Entrenchment – –0.33** (0.109)
U.S.Listed Litigation + 0.356* (0.100)
Long term – –0.170** (0.018)
Firm and time effects Included Included
Goodness of fit Number of observations
0.936 884
0.911 843
Table A1: The determinants of policy limit and deductible amounts restricted model OLS regression with firm and year fixed effectsThe dependent variables are the log of the policy limit and the log of the deductible. OLS regression for limit and deductible using time and firm fixed effects. Number of determinants restricted. The hypothesis or the hypotheses that each independent variable tests is presented in the second column. Also, the second column gives the predicted sign of each coefficient on the dependent variables. The ** represents a coefficient that is significant at the 1% level, * significant at the 5% level and # at the 10% level. Some coefficients have been scaled for presentation purposes. Standard errors are in parentheses.
Appendix

21The Journal of Financial Perspectives
Predicted sign Deductible
Variable Hypothesis Coefficient St. Dev.
Cash (1000) Package + –0.154 (1.158)
Option Package + –0.028 (0.025)
Stock (1000) Package + 0.037 (1.158)
Independent (%) Aversion – 1.204 (2.324)
LnMVE Distress shareholder + 0.008 (0.063)
Bankruptcy (%) Distress – –0.728 (0.467)
DebtRatio Distress monitor shareholder + 0.333 (0.288)
RoA Distress + –0.047 (0.252)
Blockholder (%) Monitor + –0.176 (0.362)
Growth (%) Signaling + 0.396** (0.138)
Volatility Signaling + 0.234# (0.125)
CEOPower Entrenchment – 0.344 (0.346)
LnWealth (1000) Entrenchment – –0.456** (0.161)
U.S.Listed Litigation + 0.214# (0.109)
Acquiror (%) Litigation + 0.428 (0.991)
Divestor (%) Litigation + –0.335 (2.443)
Long term – –0.022 (0.036)
Limit 0.143 (0.089)
Firm-fixed Effect Included
Time-fixed Effect Included
Goodness of fit 0.928
Table A2: The determinants of policy limit and deductible amounts OLS regressions using firm and year fixed effects (deductible chosen after limit)The dependent variable is the log of the deductible. Sequential model where the insured knows the policy limit when he chooses the deductible. OLS regression using time and firm fixed effects. Only the deductible regression is presented since the limit regression is the same as in Table 4. The ** represents a coefficient that is significant at the 1% level, * significant at the 5% level and # at the 10% level. Some coefficients have been scaled for presentation purposes. Standard errors are in parentheses. N=696.
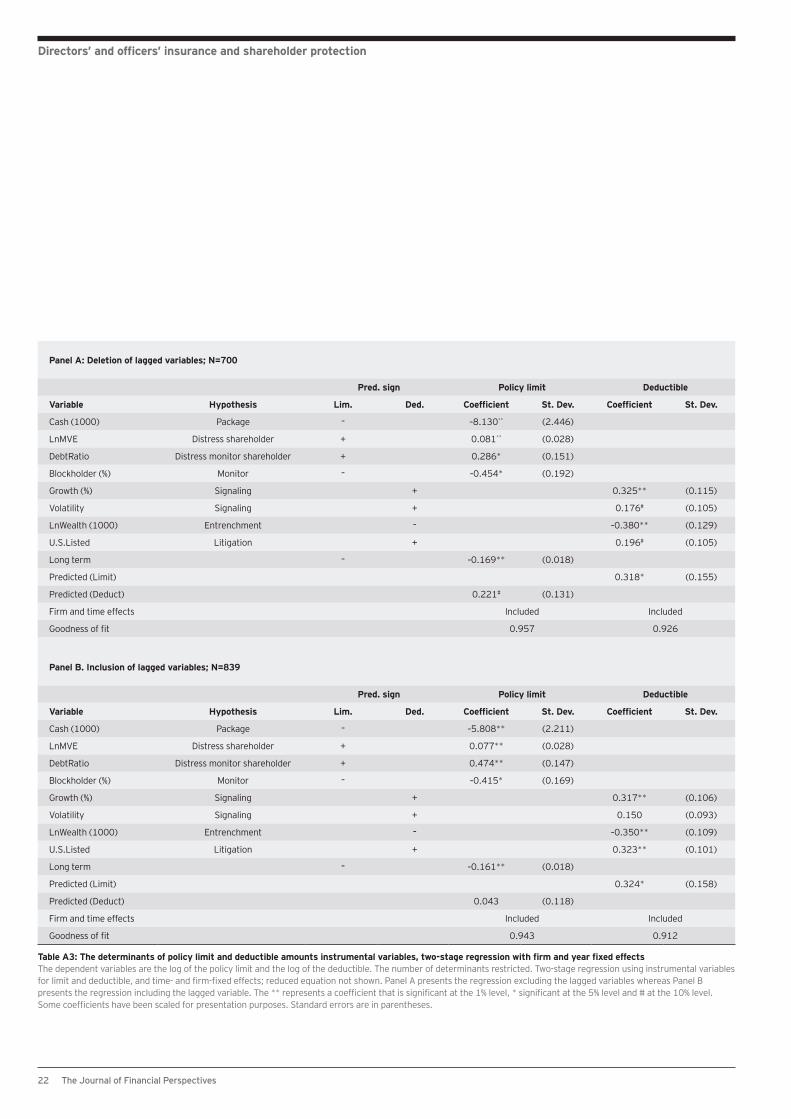
22 The Journal of Financial Perspectives
Directors’ and officers’ insurance and shareholder protection
Panel A: Deletion of lagged variables; N=700
Pred. sign Policy limit Deductible
Variable Hypothesis Lim. Ded. Coefficient St. Dev. Coefficient St. Dev.
Cash (1000) Package – –8.130** (2.446)
LnMVE Distress shareholder + 0.081** (0.028)
DebtRatio Distress monitor shareholder + 0.286* (0.151)
Blockholder (%) Monitor – –0.454* (0.192)
Growth (%) Signaling + 0.325** (0.115)
Volatility Signaling + 0.176# (0.105)
LnWealth (1000) Entrenchment – –0.380** (0.129)
U.S.Listed Litigation + 0.196# (0.105)
Long term – –0.169** (0.018)
Predicted (Limit) 0.318* (0.155)
Predicted (Deduct) 0.221# (0.131)
Firm and time effects Included Included
Goodness of fit 0.957 0.926
Panel B. Inclusion of lagged variables; N=839
Pred. sign Policy limit Deductible
Variable Hypothesis Lim. Ded. Coefficient St. Dev. Coefficient St. Dev.
Cash (1000) Package – –5.808** (2.211)
LnMVE Distress shareholder + 0.077** (0.028)
DebtRatio Distress monitor shareholder + 0.474** (0.147)
Blockholder (%) Monitor – –0.415* (0.169)
Growth (%) Signaling + 0.317** (0.106)
Volatility Signaling + 0.150 (0.093)
LnWealth (1000) Entrenchment – –0.350** (0.109)
U.S.Listed Litigation + 0.323** (0.101)
Long term – –0.161** (0.018)
Predicted (Limit) 0.324* (0.158)
Predicted (Deduct) 0.043 (0.118)
Firm and time effects Included Included
Goodness of fit 0.943 0.912
Table A3: The determinants of policy limit and deductible amounts instrumental variables, two-stage regression with firm and year fixed effectsThe dependent variables are the log of the policy limit and the log of the deductible. The number of determinants restricted. Two-stage regression using instrumental variables for limit and deductible, and time- and firm-fixed effects; reduced equation not shown. Panel A presents the regression excluding the lagged variables whereas Panel B presents the regression including the lagged variable. The ** represents a coefficient that is significant at the 1% level, * significant at the 5% level and # at the 10% level. Some coefficients have been scaled for presentation purposes. Standard errors are in parentheses.

,
EY | Assurance | Tax | Transactions | Advisory
About EYEY is a global leader in assurance, tax, transaction and advisory services. The insights and quality services we deliver help build trust and confidence in the capital markets and in economies the world over. We develop outstanding leaders who team to deliver on our promises to all of our stakeholders. In so doing, we play a critical role in building a better working world for our people, for our clients and for our communities.
EY refers to the global organization, and may refer to one or more, of the member firms of Ernst & Young Global Limited, each of which is a separate legal entity. Ernst & Young Global Limited, a UK company limited by guarantee, does not provide services to clients. For more information about our organization, please visit ey.com.
© 2014 EYGM Limited. All Rights Reserved.
EYG No. CQ0106
In line with EY’s commitment to minimize its impact on the environment, this document has been printed on paper with a high recycled content.
This material has been prepared for general informational purposes only and is not intended to be relied upon as accounting, tax, or other professional advice. Please refer to your advisors for specific advice.
ey.com
The articles, information and reports (the articles) contained within The Journal are generic and represent the views and opinions of their authors. The articles produced by authors external to EY do not necessarily represent the views or opinions of EYGM Limited nor any other member of the global EY organization. The articles produced by EY contain general commentary and do not contain tailored specific advice and should not be regarded as comprehensive or sufficient for making decisions, nor should be used in place of professional advice. Accordingly, neither EYGM Limited nor any other member of the global EY organization accepts responsibility for loss arising from any action taken or not taken by those receiving The Journal.
Accredited by the American Economic Association
ISSN 2049-8640


