Introduction Since most studies (including this one) have found a weak statistical relationship between total returns for securitized and unsecuritized real estate equities, the purpose of this study is to extend the comparison to an examination of their underlying fundamental components: dividends, investment values and dividend yields. While dividends and dividend yields have been explicitly part of the REIT pricing calculus for some time, relatively few studies have focused upon the “dividends” paid by NCREIF properties. In addition, this study emphasizes the long-term behavior of the fundamental components as a crucial initial step in understanding the relationship between securitized and unsecuritized real estate equities. Unfortunately, the relationship between these fundamental components, as they relate to securitized and unsecuritized returns, is generally weak from a statistical standpoint and many of the distributions presented in this study display significant non-normal tendencies. Even when quarterly lags of up to two years are examined, these securitized and unsecuritized series also tend to be weakly THE JOURNAL OF REAL ESTATE RESEARCH 1 381 Joseph L. Pagliari, Jr.* James R. Webb.** A Fundamental Examination of Securitized and Unsecuritized Real Estate *Citadel Realty, Inc., 2700 River Road, Suite 106, Des Plaines, Illinois 60018. **Department of Finance, and the Real Estate Research Center, James J. Nance College of Business, Cleveland State University, Cleveland, Ohio 44115. Date Revised—August 1995; Accepted—November 1995. un-Abstract. Most studies (including this one) have found a weak statistical relationship between total returns for securitized and unsecuritized real estate equities. Some studies argue that REIT shares behave more like the stock market, than real estate. In an attempt to focus this discussion, this study examines the fundamental underlying return-generating components: dividends, investment values and dividend yields using NAREIT and NCREIF data from 1978 through 1994. While dividends have been part of the REIT pricing calculus for some time, relatively few studies have focused upon the “dividends” paid by the NCREIF properties. The short-run relationships between these fundamental components are weak and many of their distributions display significant non-normal tendencies. Even when quarterly lags of up to two years are examined, these distributions also tend to be weakly correlated with one another. Of the three fundamental components, the long-run path of prices exhibited the strongest relationship. Interestingly, the volatility of the NCREIF dividend series is approximately 150% of the NAREIT volatility, while the volatility of the NCREIF asset values is roughly 25% of the NAREIT volatility. This is contradictory: in a simplified setting, greater dividend volatility should be accompanied by greater price volatility, not less, as observed here. Nevertheless, such comparisons suffer due to the incompatibility of the data sources and, accordingly, this study should be viewed as a preliminary examination of securitized and unsecuritized real estate returns.
Transcript
Introduction
Since most studies (including this one) have found a weak statistical relationshipbetween total returns for securitized and unsecuritized real estate equities, the purpose ofthis study is to extend the comparison to an examination of their underlying fundamentalcomponents: dividends, investment values and dividend yields. While dividends anddividend yields have been explicitly part of the REIT pricing calculus for some time,relatively few studies have focused upon the “dividends” paid by NCREIF properties. Inaddition, this study emphasizes the long-term behavior of the fundamental componentsas a crucial initial step in understanding the relationship between securitized andunsecuritized real estate equities. Unfortunately, the relationship between thesefundamental components, as they relate to securitized and unsecuritized returns, isgenerally weak from a statistical standpoint and many of the distributions presented inthis study display significant non-normal tendencies. Even when quarterly lags of up totwo years are examined, these securitized and unsecuritized series also tend to be weakly
THE JOURNAL OF REAL ESTATE RESEARCH 1
381
Joseph L. Pagliari, Jr.*James R. Webb.**
A Fundamental Examination ofSecuritized and UnsecuritizedReal Estate
*Citadel Realty, Inc., 2700 River Road, Suite 106, Des Plaines, Illinois 60018.**Department of Finance, and the Real Estate Research Center, James J. Nance College of Business, ClevelandState University, Cleveland, Ohio 44115.Date Revised—August 1995; Accepted—November 1995.
un-Abstract. Most studies (including this one) have found a weak statistical relationshipbetween total returns for securitized and unsecuritized real estate equities. Some studiesargue that REIT shares behave more like the stock market, than real estate. In an attemptto focus this discussion, this study examines the fundamental underlying return-generatingcomponents: dividends, investment values and dividend yields using NAREIT and NCREIFdata from 1978 through 1994. While dividends have been part of the REIT pricing calculusfor some time, relatively few studies have focused upon the “dividends” paid by theNCREIF properties. The short-run relationships between these fundamental componentsare weak and many of their distributions display significant non-normal tendencies. Evenwhen quarterly lags of up to two years are examined, these distributions also tend to beweakly correlated with one another. Of the three fundamental components, the long-runpath of prices exhibited the strongest relationship. Interestingly, the volatility of theNCREIF dividend series is approximately 150% of the NAREIT volatility, while thevolatility of the NCREIF asset values is roughly 25% of the NAREIT volatility. This iscontradictory: in a simplified setting, greater dividend volatility should be accompanied bygreater price volatility, not less, as observed here. Nevertheless, such comparisons sufferdue to the incompatibility of the data sources and, accordingly, this study should be viewedas a preliminary examination of securitized and unsecuritized real estate returns.
correlated with one another. Of the three fundamental components, the path of prices forsecuritized and unsecuritized real estate equities exhibited the strongest long-termrelationship. In turn, this might suggest the weak relationships for explaining totalreturns may be more attributable to the volatility of dividends and/or changes in dividendyields. Interestingly, the volatility of the (unleveraged) NCREIF dividend series isapproximately 150% of the NAREIT volatility, whereas the volatility of the NCREIFasset values is but roughly 25% of the NAREIT volatility. These results are contradictory:in a simplified setting, the greater dividend volatility should be accompanied by greaterasset/price volatility, not less, as observed. These results also raise issues about whetherREIT dividends are “managed” while NCREIF dividends are unmanaged. These resultsmight also suggest some adaptation of the appraisal smoothing issues raised in otherresearch. However, such comparisons suffer due to the incompatibility of the datasources. Consequently, this study should be viewed as a preliminary analysis of thesimilarities and differences between securitized and unsecuritized real estate investments.
The balance of this study is organized as follows. The next section reviews previousresearch applicable to the comparison of securitized and unsecuritized real estate. Thethird section describes the data sources to be used in this study, as well as thesimilarities and differences between them. The fourth section describes the meth-odology and theoretical underpinnings by which the two data sources are comparedand analyzed. The fifth section presents the results of the comparisons and the analyses.The sixth section concludes with a summary of the findings and suggestions for futureresearch.
Literature Review
Much of the previous literature has focused upon the relationship(s) between publiclytraded equity REITs and the larger stock market forces for publicly traded equities. Forexample, Chan et al. (1990), using a multifactor arbitrage pricing model over the 1973–87time period, found that four factors (unexpected inflation, changes in the risk and termstructure of interest rates, and the percentage change in the discount on closed-end stockfunds) consistently drive equity REIT returns. The impact of these variables isapproximately 60% of that for common stocks. Equity REITs offered neither a superiorrisk-adjusted return nor a hedge against unexpected inflation. Earlier, Titman and Warga(1986) had also applied CAPM and APT models to equity and mortgage REITs over the1973–1983 time period. Because REIT returns were so volatile, they found that largeamounts of abnormal performance were not statistically different from zero.
Other studies have analyzed interest-rate sensitivity, capital structure and other stock-market like effects. For example, Chen and Tzang (1988) examined the interest-ratesensitivity of REITs finding different results over two subperiods and differentsensitivities between mortgage and equity REITs. The issue of capital structure is aninteresting one. Because REITs are exempt from corporate taxation (subject tocompliance with the U.S. Tax Code), they begin to approximate the frictionless capitalmarkets utilized by Modigliani and Miller (1958) who assert that there is no advantage todebt financing. Howe and Shilling (1988) examined the market’s reaction toannouncements between 1970 and 1985 of new security offerings by REITs. They founda positive stock price reaction to debt offerings by REITs and a negative reaction toequity offerings. These findings support “signalling” as an explanation for this behavior.
382 THE JOURNAL OF REAL ESTATE RESEARCH
VOLUME 10, NUMBER 4, 1995
Maris and Elayan (1990) examined capital structure for debt and equity REITs, findingthat despite the lack of tax incentives many REITs are highly leveraged. Two non-taxfactors might encourage the use of indebtedness: agency theory (i.e., an optimum capitalstructure which is the same for otherwise similar firms) and leverage clientele effects (i.e.,investors in high tax brackets prefer unleveraged firms while those in low (or zero) taxbrackets prefer leveraged firms). Colwell and Park (1990) found that the “January effect”also exists for REITs (as well as common stocks) and that the effect declines withincreasing market capitalization.
Liu et al. (1990), using the NCREIF data, found that the commercial real estate marketis segmented from the stock market. Indirect barriers such as the cost, quality andamount of information seem to be the major sources of this segmentation, since theyfound that equity REITs and the stock market are integrated (i.e., not segmented).However, these conclusions were unclear when another proxy, American Council of LifeInsurance Companies’ data, for unsecuritized real estate was used. Liu and Mei (1992)examined the predictability of equity REIT returns and their co-movement with otherassets. They found, using a multi-factor model with time-varying risk premiums, thatexpected excess returns are more predictable for equity REITs than for bonds and small-cap and value-weighted stocks. They also found that equity REIT returns move moreclosely with small-cap stocks than with large-cap stocks.
Myer and Webb (1993) examined the return properties of equity REITs, commonstocks and commercial real estate. They found that, in a distributional and time-seriessense, equity REITs appear to be more like common stocks. Intertemporally, REITreturns are, however, much more strongly related to unsecuritized real estate. It is thislatter finding (i.e., the long-run relationship between securitized and unsecuritized realestate) which this study explores in a more fundamental way. Interestingly, Corgel et al.(1995), in their near encyclopedic review of the REIT literature, do not cite any paperexpressly dealing with the detailed analysis of REIT fundamentals.
Given that returns from equity REITs seemingly represent some part general stockmarket effect and some part unsecuritized real estate, some researchers have suggestedhedging a REIT index with either the S&P 500 (see Giliberto, 1993) or a small-cap index(see Kerson, 1994) as a means of capturing the “pure” real estate play within a publiclytraded framework. Obviously, the success of such a strategy rests in part on thefundamental relationship between securitized and unsecuritized real estate equities.
The Data
This study uses the NAREIT Equity Index (without the healthcare sector) as a proxyfor securitized real estate. The equity index comprises those real estate investment trusts(REITs) that predominantly invest in the equity position of real property – asdistinguished from mortgage REITs (which invest predominantly in commercialmortgages) or hybrid REITs (which invest in both equities and mortgages). In theory,these equity REITs are directly comparable to unsecuritized real estate. However, asnoted subsequently, there are many practical limitations in this comparison. This studyuses the combined NCREIF Property Index as a proxy for unsecuritized real estate. Thecombined index represents the sum of the (widely quoted) unleveraged NCREIFProperty Index and the (less widely quoted) index of leveraged properties reported toNCREIF stripped of their mortgage indebtedness. Gyourko (1992) indicated that the
SECURITIZED AND UNSECURITIZED REAL ESTATE 383
leveraged properties tend to be larger, more heavily weighted toward retail, and moreheavily weighted in the East than its unleveraged counterpart. For purposes of this study,both series begin at the start of 1978 and conclude with the end of 1994. The NAREITseries, however, extends back through 1972. Glascock and Hughes (1995), in a review ofNAREIT-identified trusts over the 1972–1991 time period, found only twelve firms thathave data over the entire period.
The 1993 volume of new equity REIT issues (both initial and secondary) exceeded thevolume of the previous ten years combined. The 1994 volume equalled approximately75% of 1993’s volume. See Frank (1994). The increased volume of REIT activity hasbenefitted the more recent research activities due to wider market coverage, a greaterarray of REIT operating philosophies, more stringent financial reporting, narrowing ofbid/ask spreads, etc. However, it should also be noted that it will take several years beforethe impact of this increased volume will significantly manifest itself in the return series.Accordingly, researchers, analysts and investors would be well served to cautiously viewempirical studies, including this one, utilizing this evolving database.
At the end of 1994, the NAREIT equity index had a market valuation of $35.6 billionwhile the NCREIF index stood at $41.0 billion. Exhibit 1 shows the changing market mixof these indices over the 1978–1994 time period. As can be seen, the NCREIF index hasconsistently comprised a greater share of the real estate investment market, averagingmore than three times the size of the NAREIT index. However, this dominance hasdramatically narrowed since 1992.
The two indices also vary in other important ways. First, the mix of property typescomprising the indices is different. Exhibits 2 and 3 compare the mix of property types byindex as of the fourth quarter of 1994. The NAREIT index is overweighted, relative tothe NCREIF index, in healthcare and apartment properties and underweighted in officeproperties (note that NAREIT includes the R&D/office sector in the office sector whileNCREIF reports it separately). Because the healthcare sector is not present in theNCREIF index, this study uses the NAREIT equity index without healthcare as a morerepresentative comparison to unsecuritized real estate – as proxied by the NCREIFindex. Due to recent stock issuances, the NAREIT index has recently added considerablymore apartment and retail properties. Second, the indices also vary considerably by theirgeographic weightings. In a comparison of the twenty-five largest equity REITs to anestimate of the national stock of real estate investments, Holden and Redding (1993)found that REITs were substantially overweighted in the smaller markets (e.g.,Richmond, El Paso, Charleston, etc.) and substantially underweighted in the largermarkets (e.g., Los Angeles, New York, Chicago, etc.). Third, the equity interests of theproperties in the NAREIT series are leveraged with mortgage indebtedness while those inthe NCREIF series are unleveraged. Fourth, the NAREIT series is reported afterinvestment advisory/reporting fees and costs while the NCREIF series is reported beforesuch fees.
Any rigorous comparison between securitized and unsecuritized real estate equitiesmust make adjustment for the differences in the NAREIT and NCREIF indices. Severalinvestment banks have begun to report equity REIT performance by property type andgeographic weightings, thereby mitigating or eliminating (depending on how far back intime the data series is available and the interests of the analyst) the first two problemsnoted above. Should the historical data be available, the second problem (differentgeographic weightings), in conjunction with the first (different property weightings),
384 THE JOURNAL OF REAL ESTATE RESEARCH
VOLUME 10, NUMBER 4, 1995
SEC
UR
ITIZ
ED
AN
D U
NSE
CU
RIT
IZE
D R
EA
L E
STA
TE
385
Exhibit 1
NAREIT Equity (without Healthcare) Index v. NCREIF Index Values
Relative Market Mix and Combined Asset Values for the Period 1978:1 through 1994:4
386 THE JOURNAL OF REAL ESTATE RESEARCH
VOLUME 10, NUMBER 4, 1995
Exhibit 2
Mix of Property Types for NAREIT Equity Index as of December 31, 1994
Exhibit 3
Mix of Property Types for NCREIF Index as of December 1994
might be resolved by sorting the NAREIT database according to a geographic andproperty-type scheme identical to that used to sort the NCREIF database.1 This stillleaves the third and fourth problems unresolved.
The third problem (leveraged v. unleveraged returns) may prove to be the mostproblematic. Initial adjustments must not only consider the degree of leverage, but mustalso distinguish between fixed- and floating-rate debt. These two types of indebtednesswill exhibit opposite behavior on returns, which can be summarized as:
A Changing Interest-Rate Environmentand Its Impact on Equity REIT’s
Return Components
Type ofInterest Rate Income Appreciation
Fixed Neutral VolatileFloating Volatile Neutral
In a changing interest-rate environment, the value of fixed-rate indebtedness shouldmove inversely with the direction of the interest-rate change. Consequently, the value ofthe leveraged equity position (i.e., the appreciation return) should reflect the volatility ofthe interest-rate market, ceteris paribus.2 Conversely, the income component of returnshould be unaffected by the changing interest-rate environment as the debt serviceremains constant (over the life of the loans(s)). The effects of floating-rate debt areopposite those of fixed-rate debt. In a changing interest-rate environment, the marketvalue of the indebtedness should remain unchanged. Consequently, the value of theleveraged equity position should be unaffected by the volatility of the interest-ratemarket. Conversely, the income component of the return should be effected by thechanging interest-rate environment, as the interest expense periodically rolls over to thenew floating rate. Moreover, some evidence suggests that the marketplace values REITsutilizing floating-rate debt at a discount from otherwise similar REITs. See Litt et al.(1994) and Vinocur (1992).
In addition to the distinction between floating- and fixed-rate debt, othercharacteristics of the indebtedness should be captured. For example, as the term tomaturity shortens for the fixed-rate debt, the pricing characteristics begin to roughlyemulate the characteristics of the floating-rate debt. Conversely, as the time between“rollover” periods lengthens for the floating-rate debt, its pricing characteristics begin toroughly emulate the characteristics of the fixed-rate debt. Other examples would includeadjustment for “collars” on floating-rate debt, contingent (or participating) interest, etc.Since all of these terms, rates and other considerations are changing over time, it isunlikely that a complete “deleveraging” of the NAREIT equity series is amenable tosome simple adjustment – as in Fisher et al. (1994).
If the investment advisory fees/reporting and costs related to the NAREIT series wereconstant over time, the fourth problem (fees v. no fees) could be easily rectified – simplyadd back a constant percentage and/or amount to the NAREIT series so as to make itdirectly comparable to the NCREIF series. However, these fees and costs (as measured byamounts and/or percentages) change over time and are complicated as the industrymoves from externally advised REITs to those that are internally advised. Additionally,
SECURITIZED AND UNSECURITIZED REAL ESTATE 387
the existence of so-called “Up REITs” (see Frank, 1993) and the multiplicity of agencyproblems/conflicts of interest (see Sagalyn, 1994) might also contribute to the intract-ability of identifying fees and costs.
If all these problems were resolved, then securitized and unsecuritized real estate equitycould be compared directly. Some of these comparisons would include: auction- v.appraisal-based valuations, the impact of fractional v. controlling interests, marketefficiency, the “correct” pricing of leveraged investments, the “management” premium,etc. However, the primary role of this study is to examine the long-term convergence/divergence of securitized and unsecuritized real estate equities with regard to dividends,investment values and dividend yields.
Methodology
In order to make the securitized/unsecuritized comparison, it is assumed that $100 isinvested in each data series at the beginning of 1978. In addition to examining quarterlyreturns, quarterly dividends and investment values as of the end of each quarter throughthe end of 1994 are reconstructed.
This reconstruction is fairly simple for the NAREIT series, as dividends, investmentvalues (or prices) and dividend yields are separately reported in the REIT Sourcebooksince the beginning of 1972 on a monthly and quarterly basis. It is relatively straight-forward to convert these data series to a 1978 start date. Assuming a $100 investment atthe beginning of 1978, the quarterly dividend yield can be used to calculate the dividendamount paid at the end of the first quarter and the quarterly appreciation return can beused to compute the investment value as of the end of the first quarter. This procedure isrepeated through all subsequent quarters in order to determine the dollar amounts fordividend and investment values.
For the NCREIF series, the procedure is a bit more complex. The generally reportedNCREIF Property Index discloses income and appreciation returns. The income return,however, is based upon net operating income and, therefore, is not a measure ofdividends. As a special data request, NCREIF provides a more detailed report that listsnet operating income, capital improvements, partial sales and beginning and ending assetvalues. From this information, a “dividend” series can be approximated by subtractingcapital improvements from net operating income.3 Because properties are constantlyadded to and subtracted from the database, it is necessary to create a quarterly dividendand appreciation return series that conforms to that used by NAREIT.4 Theseconforming returns utilizing the NCREIF data series are computed as follows:
BASE (1)
BASE (2)
BASE (3) R
MV MV PS NOI CIMVTotal t
t t t t t
t,
( ),= − + + −−
−
1
1
R
MV MV PSMVApp t
t t t
t,
( ),= − +−
−
1
1
R
NOI CIMVDiv t
t t
t, ,= −
−1
388 THE JOURNAL OF REAL ESTATE RESEARCH
VOLUME 10, NUMBER 4, 1995
where:
RDiv,t = dividend return during period t,RApp,t = appreciation return during period t,
RTotal,t = total return during period t,NOIt = net operating income in period t,
CIt = capital improvements in period t,MVt–1 = market value at beginning of period t,
MVt = market value at end of period t, andPSt = partial sales during period t.
These quarterly returns are then used to create a return series stated in dollar amountsfor an initial investment of $100 that more closely conforms to that utilized for theNAREIT series. In turn, the relationship between market values and dividend amountscan be identified through the dividend yield (yt):
BASE (4)
Assuming partial sales (PSt) equal to zero,5 equation (4) can be used to restate equation(3) as follows:
BASE (5)
Consequently, total return in the tth quarter (RTotal,t) is extremely sensitive and inverselyrelated to changes in the dividend yield. This can be determined by taking the partialderivative of equation (5) with regard to the current dividend yield:
BASE (6)
As shown in equation (6), quarterly total returns are inversely effected by changes inthe dividend yield. Furthermore, the impact of “squaring” the denominator (yt), where0<yt <1, has the impact of substantially impacting quarterly total returns. However,when shifts in the dividend yields occur over longer periods of time, the impact of suchshifts on total returns declines markedly. For ease of discussion, shifts in dividend yieldscan be defined as:
BASE (7)
The impact of shifting dividend yields on total returns declines as the holding period(n) lengthens as shown in Exhibit 4.
To better convey the concept of the impact of shifting dividend yields, Exhibit 4 hasbeen calibrated in years rather than quarters. The shorter time period (i.e., quarters)would have caused the scaling of the vertical axis to widen dramatically. In any event,
∇ = +y
yt n
t
.
∂∂R
yy
y
DivDiv
Total t
t
t
t
t
t
, .= − ⋅−
−
12
1
R
yy
DivDiv
yTotal tt
t
t
tt, ( ) .= ⋅ ⋅ − −−
−
1
1
1 1
y
DivMVt
t
t
= .
SECURITIZED AND UNSECURITIZED REAL ESTATE 389
390T
HE
JOU
RN
AL
OF
RE
AL
EST
AT
E R
ESE
AR
CH
VO
LU
ME
10, NU
MB
ER
4, 1995
Exhibit 4
Total Annual Return Based upon Various Dividend Yield Shifts and Holding Periods
Exhibit 4 clearly demonstrates that in the short run total returns are highly dependentupon shifts in the dividend yield. While in the long run, total returns converge to the“fundamentals” of return as shown in equation (8).
BASE (8)
where
k = total return over the holding period, andg = the (constant) growth in dividends over the holding period.
Equation (8) is a simple reformulation of the Dividend Discount Model (see Gordonand Shapiro, 1956) given as:
BASE (9)
where, for purposes of tractability, it is assumed that dividends grow in perpetuity atsome constant rate. As Exhibit 4 shows, if the asset is bought and sold at the samedividend yield (i.e., Ñ=1.00) then the holding period is irrelevant: total return equals theinitial dividend yield plus growth (i.e., equation (8)). If however, the beginning andending dividend yield differ (i.e., Ñ≠1.00) then the holding period is relevant: total returnis increasingly impacted by shifts in the dividend yield as the holding period shortens.
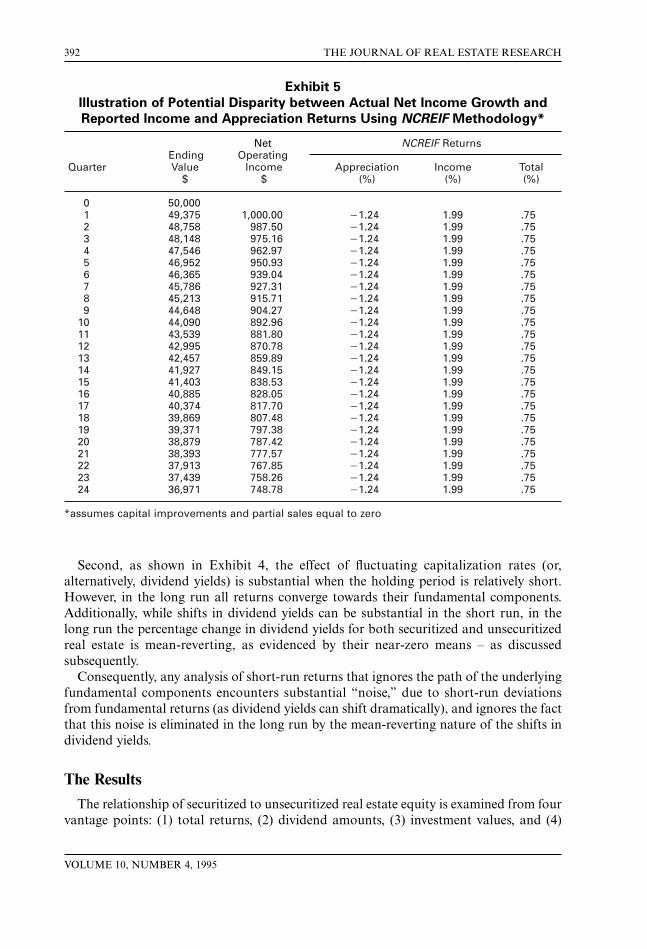
The following two issues illustrate the importance of examining the fundamental returncomponents individually. First, the nature of the traditionally reported income andappreciation (quarterly) returns can lull the unwitting analyst into a false sense of stabilitywith regard to that series’ income stream. Consider the following hypothetical (andpurposefully extreme) example: Assume that a $50 million building is valued at the endof each quarter by capitalizing next quarter’s (annualized) net operating income at 8%,that net operating income declines at the rate of 5% per annum or 1.25% per quarter, andthat (for purposes of simplicity) partial sales and capital improvements are zero. Then theNCREIF methodology6 would generate the returns shown in Exhibit 5.
Notice that the NCREIF reported quarterly income return is approximately 2.0%every quarter, even though net income is declining at the rate of 1.25% per quarter! Thisresults because the NCREIF methodology constantly revises the denominator to reflectdrifting asset values. Because of the constant capitalization rate used in this example, thefundamental approach asserted in this study would view (on an annualized basis) this assimply a restatement of equation (8):
BASE (8a)
3.0% = 8.0% 25.0% . (8b)
Notice that both approaches result in annual returns of 3.0% (or a quarterly return of.75%). It is simply that the fundamental approach leads to a much clearer view of theindividual return components.
k
DivMV
g= +1
0
,
MV
Div
k
Div gk g
tt
t
0
1
0
1
1=+
= +−
=
∞
∑ ( )
( ),
k
DivMV
g g= + +0
0
1( ) ,
SECURITIZED AND UNSECURITIZED REAL ESTATE 391
Second, as shown in Exhibit 4, the effect of fluctuating capitalization rates (or,alternatively, dividend yields) is substantial when the holding period is relatively short.However, in the long run all returns converge towards their fundamental components.Additionally, while shifts in dividend yields can be substantial in the short run, in thelong run the percentage change in dividend yields for both securitized and unsecuritizedreal estate is mean-reverting, as evidenced by their near-zero means – as discussedsubsequently.
Consequently, any analysis of short-run returns that ignores the path of the underlyingfundamental components encounters substantial “noise,” due to short-run deviationsfrom fundamental returns (as dividend yields can shift dramatically), and ignores the factthat this noise is eliminated in the long run by the mean-reverting nature of the shifts individend yields.
The Results
The relationship of securitized to unsecuritized real estate equity is examined from fourvantage points: (1) total returns, (2) dividend amounts, (3) investment values, and (4)
392 THE JOURNAL OF REAL ESTATE RESEARCH
VOLUME 10, NUMBER 4, 1995
Exhibit 5
Illustration of Potential Disparity between Actual Net Income Growth and
Reported Income and Appreciation Returns Using NCREIF Methodology*
Net NCREIF ReturnsEnding Operating
Quarter Value Income Appreciation Income Total$ $ (%) (%) (%)
*assumes capital improvements and partial sales equal to zero
dividend yields. Additionally, the discussion of dividend amounts also involves anextension to NCREIF’s net operating income series.
Total Returns
Exhibit 6 presents a comparison of total quarterly returns for the respective databases.The greater volatility of the NAREIT series is readily apparent. A scatterplot comparisonof total securitized (NAREIT) and unsecuritized (NCREIF) real estate quarterly returnsis shown in Exhibit 7.
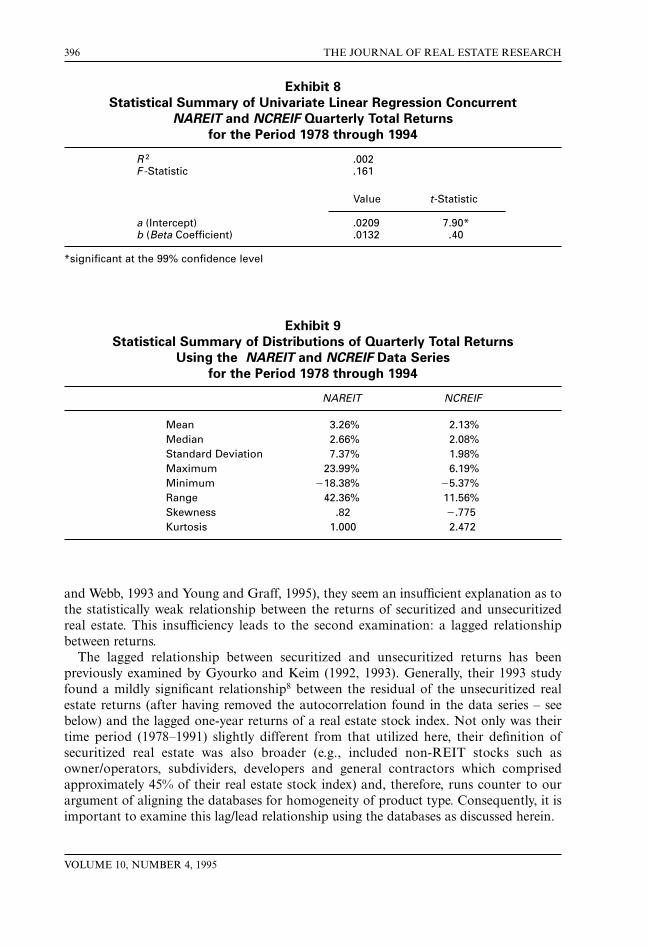
In addition to the graphing of concurrent returns, Exhibit 7 also shows a fitted linearregression line (the straight, dashed line) along with confidence intervals bounded at 95%(the two curved, dashed lines). From visual inspection, the relationship between the twodata series appears weak. This appearance is supported by a review of the statistics involv-ing the following univariate regression equation used to fit the straight line in Exhibit 7:
yt = a + b xt + e , (10)
where:
yt = quarterly return on NCREIF index in quarter t,a = constant (intercept) value,b = parameter modifying xt,
xt = quarterly return on NAREIT index in quartert, ande = error term.
The significant statistical values of this equation are summarized in Exhibit 8.This weak statistical relationship between concurrent returns essentially reaffirms the
research discussed in the Literature Review. Before exploring more fundamental ways inwhich the data series might be more similar, two other analyses should be explored. First,the shape of the underlying distributions should be examined. And second, variouslagged relationships should be explored. Each might illuminate the weak statisticalrelationship between concurrent securitized and unsecuritized returns. That the samegroup (more or less) of underlying assets (i.e., real property) should have such widelydissimilar return patterns begs the question: does “packaging” (i.e., same group of assets,one in a securitized format and the other in an unsecuritized format) make such asubstantive difference that the two return series are, statistically speaking, independent(or, nearly so) of one another?
If the shapes of the underlying distributions are non-normal, then this may impact theefficacy of the regression-based analysis discussed above. Summary statistics7 for therespective returns series over the period beginning with the first quarter of 1978 andending with the fourth quarter of 1994 are as shown in Exhibit 9. As compared to theNCREIF series, the NAREIT series has historically exhibited greater returns (see meansand medians) and greater risk (see standard deviations and ranges). With regard to thequestion of the normality of the graphs, the measures of skewness and kurtosis indicatethat the distributions are not normal. Moreover, given the leveraged nature of theNAREIT series, it would be expected that this return series is non-normal. See Pagliariand Sanders (1995). While these results are also consistent with earlier research (see Myer
SECURITIZED AND UNSECURITIZED REAL ESTATE 393
394T
HE
JOU
RN
AL
OF
RE
AL
EST
AT
E R
ESE
AR
CH
VO
LU
ME
10, NU
MB
ER
4, 1995
Exhibit 6
Total Quarterly Returns for the Period from 1978:1 through 1994:4
NAREIT Equity Index (without Healthcare) v. NCREIF Property Index
SEC
UR
ITIZ
ED
AN
D U
NSE
CU
RIT
IZE
D R
EA
L E
STA
TE
395
Exhibit 7
Scatterplot of Quarterly Total Returns
NAREIT v. NCREIF for the Period 1978:1 through 1994:4 with a Fitted Linear Regression
and 95% Confidence Interval
and Webb, 1993 and Young and Graff, 1995), they seem an insufficient explanation as tothe statistically weak relationship between the returns of securitized and unsecuritizedreal estate. This insufficiency leads to the second examination: a lagged relationshipbetween returns.
The lagged relationship between securitized and unsecuritized returns has beenpreviously examined by Gyourko and Keim (1992, 1993). Generally, their 1993 studyfound a mildly significant relationship8 between the residual of the unsecuritized realestate returns (after having removed the autocorrelation found in the data series – seebelow) and the lagged one-year returns of a real estate stock index. Not only was theirtime period (1978–1991) slightly different from that utilized here, their definition ofsecuritized real estate was also broader (e.g., included non-REIT stocks such asowner/operators, subdividers, developers and general contractors which comprisedapproximately 45% of their real estate stock index) and, therefore, runs counter to ourargument of aligning the databases for homogeneity of product type. Consequently, it isimportant to examine this lag/lead relationship using the databases as discussed herein.
396 THE JOURNAL OF REAL ESTATE RESEARCH
VOLUME 10, NUMBER 4, 1995
Exhibit 8
Statistical Summary of Univariate Linear Regression Concurrent
NAREIT and NCREIF Quarterly Total Returns
for the Period 1978 through 1994
R 2 .002F -Statistic .161
Value t-Statistic
a (Intercept) .0209 7.90*b (Beta Coefficient) .0132 .40
*significant at the 99% confidence level
Exhibit 9
Statistical Summary of Distributions of Quarterly Total Returns
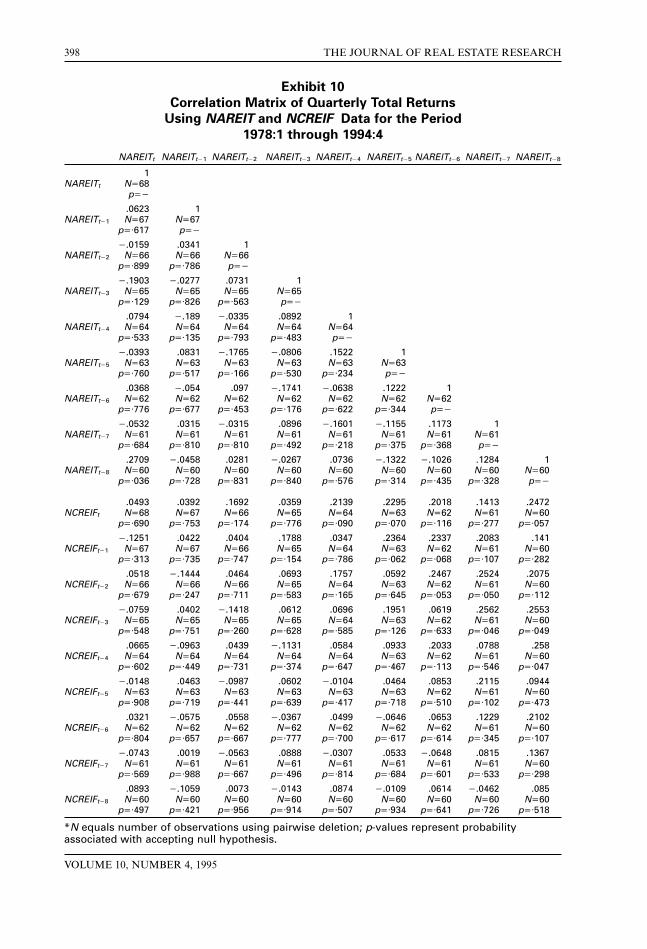
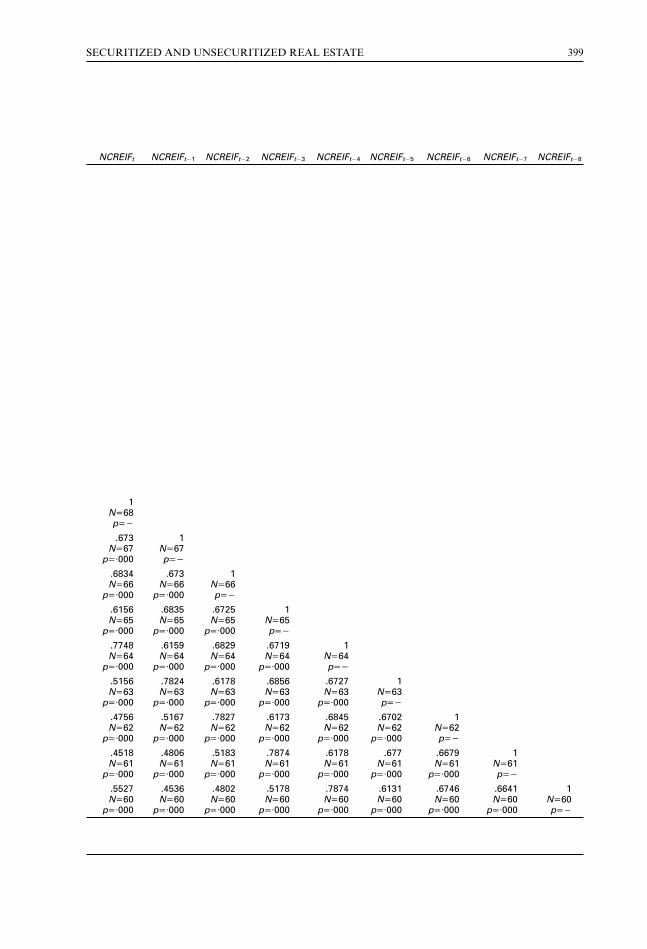
The correlation of the databases, lagged up to eight quarters, is examined in Exhibit 10.The number of observations (N) declines as the length of the lags increases. The r-valuesrepresent the probability associated with accepting the null hypothesis (i.e., thecorrelation coefficients are statistically indistinguishable from zero). Alternatively, oneminus the r-values represents the confidence level associated with rejecting the nullhypothesis.
The upper left quadrant of Exhibit 10 examines the autocorrelation of the NAREITseries by identifying the correlation between current NAREIT returns (t) and thoselagged one through eight quarters (noted as t21 and t28, respectively). The auto-correlation of quarterly NAREIT total returns can be observed by inspecting the firstcolumn of the upper left quadrant. Interestingly, the most significant autocorrelationappears with the previous two year’s returns (i.e., t28) – significant at the 90% confidencelevel. However, all other lagged relationships for the NAREIT series are weak. None ofthe lagged returns are significant at the 95% confidence level.9
Quite the opposite pattern occurs when examining the NCREIF series. See the lowerright quadrant of Exhibit 10. As Geltner (1989, 1993) and Ross and Zisler (1991) havenoted previously, there is substantial autocorrelation in this return series. See the firstcolumn of the lower right quadrant. All of these lagged returns are significant at the 99%confidence level.10
The lower left quadrant examines the lagged relationships between the NAREIT andNCREIF series. The columns indicate the relationship between the current NAREIT(quarterly total) return and the leading, current and lagging NCREIF returns.Examining the first column of the lower left quadrant indicates a very weak relationshipbetween the current NAREIT return and the current (t) and lagged (t2n) NCREIFreturns. None of these relationships are significant even at a 70% confidence level.Meanwhile, the rows indicate the relationship between the current NCREIF return andthe leading, current and lagging NAREIT returns. Examining the top row of the lowerleft quadrant indicates a persistent negative relationship between current NCREIFreturns and the current (t) and lagged (t2n) NAREIT returns. Interestingly, thisrelationship is statistically strongest when the NAREIT returns are also lagged two years(t28) and is statistically significant at a 90% confidence level. However, statisticallysignificant (at a 90% confidence level) lags can also be found at the fourth and fifthquarters.
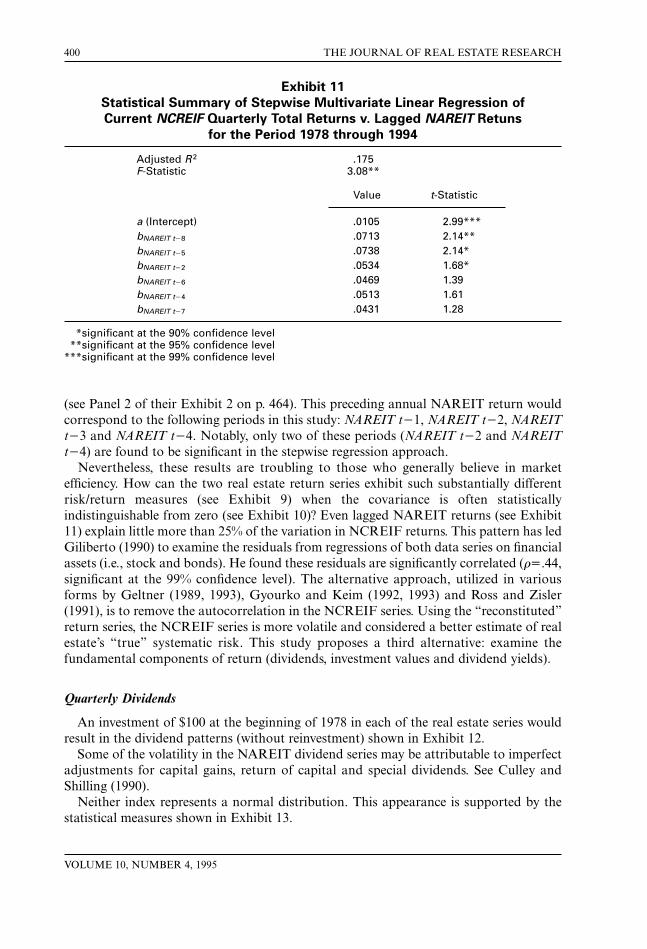
The relationship between current NCREIF (t) quarterly returns and current/laggedNAREIT returns (t2n) can be further examined by using step-wise regression (wheremissing data are pairwise deleted). For the time period studied, the results of such anapproach are shown in Exhibit 11.
The ordering of the independent variables noted above also represents theirincremental contribution (from highest to lowest) to the equation’s explanatory power.As suggested earlier, NAREIT returns lagged two years (i.e., NAREIT t28) is the mostsignificant independent variable – both with regard to the size of its coefficient and t-statistic – in explaining the variability of current NCREIF returns. The intercept ispositive and all of the independent variables have positive beta coefficients, whichsuggests a positive relationship between securitized and unsecuritized returns. Over the1978–1990 time period, Gyourko and Keim (1992) found a significant relationshipbetween current NCREIF returns and lagged one-year (i.e., the preceding annual)NAREIT returns with a dummy-variable adjustment for fourth-quarter “seasonality”
SECURITIZED AND UNSECURITIZED REAL ESTATE 397
398 THE JOURNAL OF REAL ESTATE RESEARCH
VOLUME 10, NUMBER 4, 1995
Exhibit 10
Correlation Matrix of Quarterly Total Returns
Using NAREIT and NCREIF Data for the Period
1978:1 through 1994:4
*N equals number of observations using pairwise deletion; p-values represent probabilityassociated with accepting null hypothesis.
(see Panel 2 of their Exhibit 2 on p. 464). This preceding annual NAREIT return wouldcorrespond to the following periods in this study: NAREIT t21, NAREIT t22, NAREITt23 and NAREIT t24. Notably, only two of these periods (NAREIT t22 and NAREITt24) are found to be significant in the stepwise regression approach.
Nevertheless, these results are troubling to those who generally believe in marketefficiency. How can the two real estate return series exhibit such substantially differentrisk/return measures (see Exhibit 9) when the covariance is often statisticallyindistinguishable from zero (see Exhibit 10)? Even lagged NAREIT returns (see Exhibit11) explain little more than 25% of the variation in NCREIF returns. This pattern has ledGiliberto (1990) to examine the residuals from regressions of both data series on financialassets (i.e., stock and bonds). He found these residuals are significantly correlated (r5.44,significant at the 99% confidence level). The alternative approach, utilized in variousforms by Geltner (1989, 1993), Gyourko and Keim (1992, 1993) and Ross and Zisler(1991), is to remove the autocorrelation in the NCREIF series. Using the “reconstituted”return series, the NCREIF series is more volatile and considered a better estimate of realestate’s “true” systematic risk. This study proposes a third alternative: examine thefundamental components of return (dividends, investment values and dividend yields).
Quarterly Dividends
An investment of $100 at the beginning of 1978 in each of the real estate series wouldresult in the dividend patterns (without reinvestment) shown in Exhibit 12.
Some of the volatility in the NAREIT dividend series may be attributable to imperfectadjustments for capital gains, return of capital and special dividends. See Culley andShilling (1990).
Neither index represents a normal distribution. This appearance is supported by thestatistical measures shown in Exhibit 13.
400 THE JOURNAL OF REAL ESTATE RESEARCH
VOLUME 10, NUMBER 4, 1995
Exhibit 11
Statistical Summary of Stepwise Multivariate Linear Regression of
Current NCREIF Quarterly Total Returns v. Lagged NAREIT Retuns
*significant at the 90% confidence level**significant at the 95% confidence level
***significant at the 99% confidence level
SEC
UR
ITIZ
ED
AN
D U
NSE
CU
RIT
IZE
D R
EA
L E
STA
TE
401
Exhibit 12
Quarterly Dividends for the Period from 1978:1 through 1994:4
NAREIT Equity Index (without Healthcare) v. NCREIF Property Index
Clearly, both series are non-normal. Interestingly, the NCREIF series has a higheraverage percentage change in quarterly dividends, a wider standard deviation and range,and greater skewness and kurtosis than its NAREIT counterpart. All of which is curious,given the unleveraged nature of the NCREIF series. Perhaps, quarterly dividend figuresare too volatile and preclude drawing any meaningful conclusions. Certainly mostinvestors forecast more than one quarter’s worth of dividends when making an invest-ment decision. Accordingly, the following section examines four-quarter rolling dividendsin an attempt to overcome the volatile quarterly growth in dividends.
Rolling Four-Quarter Dividends
The rolling four-quarter dividends represent the simple summation of quarterlydividend payments over a given one-year interval. Quite naturally, the four-quartersummation of dividends has a smoothing effect as shown in Exhibit 14.
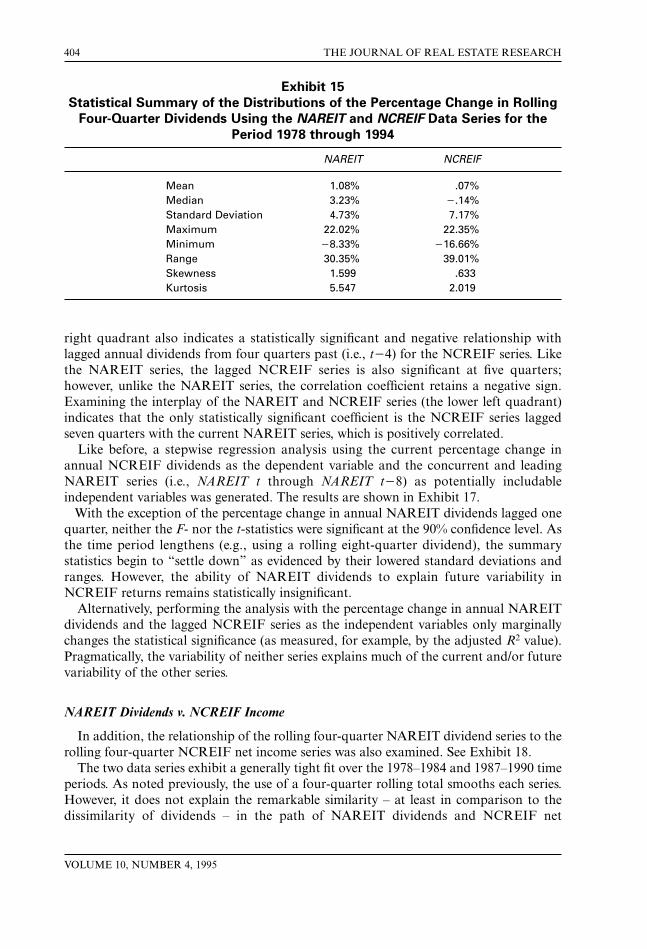
The summary statistics of the percentage change in rolling four-quarter dividends isshown in Exhibit 15. In the case of annual dividends, the leveraged NAREIT seriesexperienced a higher average growth rate than did the NCREIF series – the oppositeresult from the case of quarterly dividends. (However, the substantially higher volatilityand non-normality of the quarterly NCREIF returns makes the mean of its distributionmisleading.) Notwithstanding the fact that this time period had large influxes of newconstruction and large declines in rental rates and property values, it is discouraging thatthe mean growth (or percentage change) in annual NCREIF dividends is virtuallyindistinguishable from zero. This is all the more troubling given that these dividend seriesare expressed in nominal (v. real) terms.
Exhibit 16 presents a correlation matrix of the lagged percentage changes in annualdividends. Given that three of the four observations in any four-quarter interval are alsocommon to the observations in adjoining periods, these numbers should be viewedcautiously. Nevertheless, examining the upper left quadrant of Exhibit 16 indicatesstatistically significant (using a 90% confidence interval) relationships with the two-, four-and five-quarter lags. However, these correlation coefficients have opposite signs: thefour-quarter lag is negative while the two- and five-quarter lags are positive. The lower
402 THE JOURNAL OF REAL ESTATE RESEARCH
VOLUME 10, NUMBER 4, 1995
Exhibit 13
Statistical Summary of the Distributions of the Percentage Change in
Quarterly Dividend Amounts Using the NAREIT and NCREIF Data Series for
Annual Dividends for the Period from 1978:1 through 1994:4
NAREIT Equity Index (without Healthcare) v. NCREIF Property Index
right quadrant also indicates a statistically significant and negative relationship withlagged annual dividends from four quarters past (i.e., t24) for the NCREIF series. Likethe NAREIT series, the lagged NCREIF series is also significant at five quarters;however, unlike the NAREIT series, the correlation coefficient retains a negative sign.Examining the interplay of the NAREIT and NCREIF series (the lower left quadrant)indicates that the only statistically significant coefficient is the NCREIF series laggedseven quarters with the current NAREIT series, which is positively correlated.
Like before, a stepwise regression analysis using the current percentage change inannual NCREIF dividends as the dependent variable and the concurrent and leadingNAREIT series (i.e., NAREIT t through NAREIT t28) as potentially includableindependent variables was generated. The results are shown in Exhibit 17.
With the exception of the percentage change in annual NAREIT dividends lagged onequarter, neither the F- nor the t-statistics were significant at the 90% confidence level. Asthe time period lengthens (e.g., using a rolling eight-quarter dividend), the summarystatistics begin to “settle down” as evidenced by their lowered standard deviations andranges. However, the ability of NAREIT dividends to explain future variability inNCREIF returns remains statistically insignificant.
Alternatively, performing the analysis with the percentage change in annual NAREITdividends and the lagged NCREIF series as the independent variables only marginallychanges the statistical significance (as measured, for example, by the adjusted R2 value).Pragmatically, the variability of neither series explains much of the current and/or futurevariability of the other series.
NAREIT Dividends v. NCREIF Income
In addition, the relationship of the rolling four-quarter NAREIT dividend series to therolling four-quarter NCREIF net income series was also examined. See Exhibit 18.
The two data series exhibit a generally tight fit over the 1978–1984 and 1987–1990 timeperiods. As noted previously, the use of a four-quarter rolling total smooths each series.However, it does not explain the remarkable similarity – at least in comparison to thedissimilarity of dividends – in the path of NAREIT dividends and NCREIF net
404 THE JOURNAL OF REAL ESTATE RESEARCH
VOLUME 10, NUMBER 4, 1995
Exhibit 15
Statistical Summary of the Distributions of the Percentage Change in Rolling
Four-Quarter Dividends Using the NAREIT and NCREIF Data Series for the
operating income. In some sense, senior REIT executives “manage” dividends. That is,they declare dividends based on a variety of factors, which include: compliance with U.S.Tax Code provisions, acquisitions/dispositions, capital improvements, debt restructuring,“signalling” effects to investors, etc. The NAREIT Index reports dividends, but not netincome (earnings or funds from operations). If dividends are the primary focus ofinvestors and analysts, senior REIT executives might smooth dividends in an effort tostabilize the pricing of REIT shares. However, the recent commotion about a NAREIT-proposed change in the way FFO (funds from operations) is to be reported (see Litt andHarris, 1994; Martin, 1995), suggests that reported earnings are also a substantialconcern to senior management.
Conversely, NCREIF reports income and not dividends. Moreover, the NCREIFdividend series created in this study is relatively unmanaged in the sense that advisory-firm executives make decisions about the timing of capital improvements and (generally)not about Tax Code compliance, new acquisitions, debt restructuring, etc. Consequently,if the dividend series is unmanaged, a volatile dividend pay-out ratio might be observedfor the NCREIF series. Exhibit 19 tracks the dividend pay-out ratio (i.e., the ratio ofdividends to net operating income) on the right vertical axis and net operating incomeand dividend amounts on the left vertical axis. As this exhibit illustrates, the NCREIFseries shows substantially more volatility (and less growth) in its dividend series than doesits income series. In turn, this suggests the possibility that NCREIF advisors (and theplan sponsors to the extent they retain discretion over capital improvement expenditures)are less concerned about “managing” the dividend series.
Investment Values
An investment of $100 at the beginning of 1978 in each real estate series would resultin the pattern of investment values (without reinvestment) shown in Exhibit 20.
For the NAREIT series, investment values represent the path of aggregate equity REITstock prices (i.e., real estate asset values less mortgage indebtedness and plus/minus any“management premium”) as traded on an exchange. For the NCREIF series, investmentvalues represent the path of appraised asset values. The former represents a fractional/minority interest in a securitized portfolio of leveraged real estate, while the latterrepresents a controlling interest in an unsecuritized, unleveraged fixed asset. Conse-quently, it is entirely possible that there is considerable short-run divergence between thetwo series. In the long run, convergence between the two would be expected however.Exhibit 20 seems to strongly support this view.
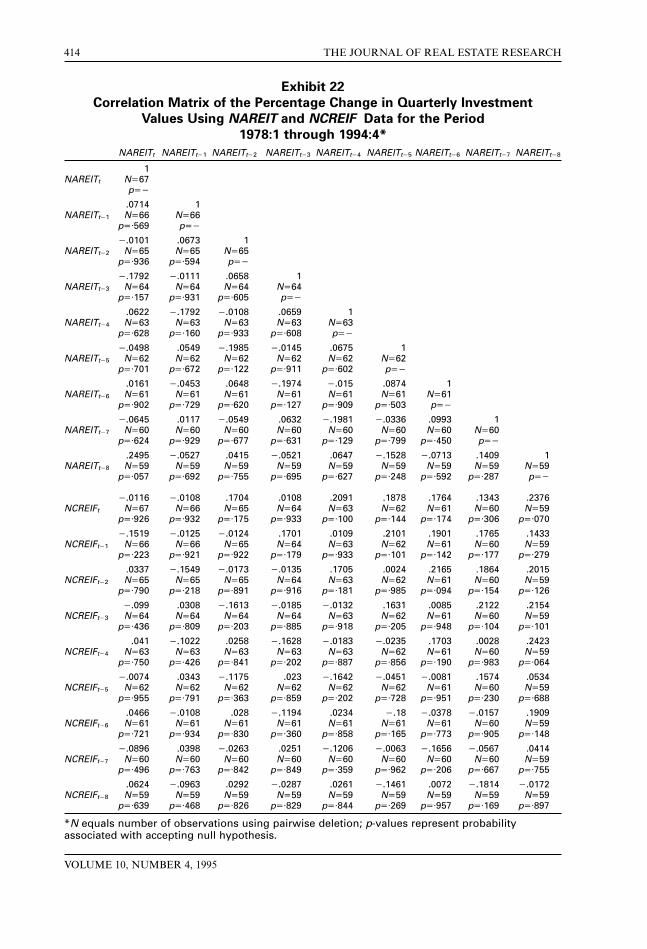
Nevertheless, conventional statistical analysis indicates a weak relationship betweenconcurrent investment values. Again, whether the underlying distributions are normallyshaped and whether certain lagged relationships are more effective in explaining therelationship between the two “packages” is analyzed. Exhibit 21 examines thedistributions of the percentage change in quarterly investment values for the securitizedand unsecuritized real estate data series. Interestingly, the NAREIT series exhibits greaternormality (as measured by kurtosis) than does the NCREIF series. This is somewhatsurprising given the leveraged nature of the NAREIT series.
As compared to dividends where the NCREIF series was considerably more volatilethan the NAREIT series, the situation is reversed when investment values are considered.With regard to the percentage change in investment values, the NAREIT series is
SECURITIZED AND UNSECURITIZED REAL ESTATE 405
406 THE JOURNAL OF REAL ESTATE RESEARCH
VOLUME 10, NUMBER 4, 1995
Exhibit 16
Correlation Matrix of the Percentage Change in Annual Dividends
Using NAREIT and NCREIF Data for the Period
1978:1 through 1994:4*
*N equals number of observations using pairwise deletion; p-values represent probabilityassociated with accepting null hypothesis.
approximately four times as volatile as the NCREIF series when standard deviations andranges are compared. Additionally, the NCREIF series is fat tailed.
Exhibit 22 examines the statistical relationship between the lagged percentage changesin quarterly investment values. Examining the upper left quadrant of Exhibit 22indicates a generally low level of autocorrelation for the percentage change in NAREITinvestment values. Only NAREIT investment values lagged at eight quarters (i.e., REITt28) are significant at a 90% confidence level. All others are, statistically speaking,indistinguishable from zero. Examining the lower right quadrant indicates high levels ofautocorrelation for the percentage change in NCREIF investment values. These highlevels of autocorrelation are the concerns voiced by Geltner (1989, 1993), Gyourko andKeim (1992, 1993) and Ross and Fisher (1991) with regard to appraisal smoothing.Examining the lower left quadrant (which represents the leading, current and laggedrelationships for the NAREIT and NCREIF series) indicates that the strongestcorrelations again seem to be NAREIT values leading NCREIF values. Statisticallysignificant, positive correlations are observed when NAREIT values lead NCREIFvalues by four and eight quarters.
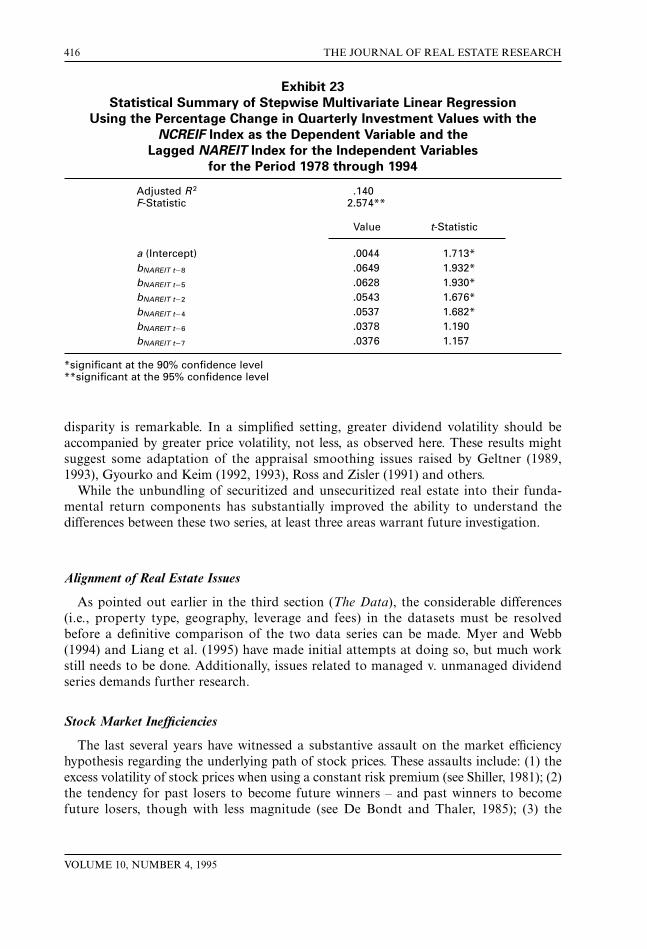
When these lagged relationships are further investigated via stepwise regressionanalysis, with NCREIF t as the dependent variable and NCREIF t through NAREIT t28as potentially includable independent variables, the results are as shown in Exhibit 23.While all of the beta (slope) coefficients are positive and the first four are statisticallysignificant (at the 90% confidence level), the low adjusted R2 suggests substantialuncertainty in the estimates of the current percentage change in NCREIF asset values asforecasted by earlier changes in NAREIT investment values.
Dividend Yields
As noted earlier, short-run returns are very sensitive to changes in the dividend yield.12
As Exhibit 4 suggests, it is not changing prices, per se, which distort fundamental returns.In fact, constant dividend yields (or, capitalization rates) imply that prices change at thesame rate as dividends (or, net operating income). When the growth rates for prices anddividends (or, net operating income) differ is when dividend yields (or, capitalization
408 THE JOURNAL OF REAL ESTATE RESEARCH
VOLUME 10, NUMBER 4, 1995
Exhibit 17
Statistical Summary of Stepwise Multivariate Linear Regression
Using the Current Percentage Change in Rolling Four-Quarter Dividends
with the NCREIF Index as the Dependent Variable and the
Lagged NAREIT Index for the Independent Variables
for the Period 1978 through 1994
Adjusted R2 .0235F-Statistic 1.661
Value t-Statistic
a (Intercept) .006 .616bNAREIT t21 .358 1.674*bNAREIT t26 2.237 21.138
*significant at the 90% confidence level
SEC
UR
ITIZ
ED
AN
D U
NSE
CU
RIT
IZE
D R
EA
L E
STA
TE
409
Exhibit 18
Annual Dividends for the NAREIT Equity Index (without Healthcare) v. Income for the NCREIF Property Index
for the Period from 1978:1 through 1994:4
410T
HE
JOU
RN
AL
OF
RE
AL
EST
AT
E R
ESE
AR
CH
VO
LU
ME
10, NU
MB
ER
4, 1995
Exhibit 19
NCREIF Property Index Annual Net Operating Income, Dividend Amounts and Pay-Out Ratios,
Based upon Initial $100 Investment for the Period from 1978:1 through 1994:4
SEC
UR
ITIZ
ED
AN
D U
NSE
CU
RIT
IZE
D R
EA
L E
STA
TE
411
Exhibit 20
Annual Quarterly Investment Values for the Period from 1978:1 through 1994:4
NAREIT Equity Index (without Healthcare) v. NCREIF Property Index
rates) change. In the aggregate,13 changing dividend yields represent the manifestation ofchanging investor sentiment with regard to risk premiums, expected inflation, lease rates,etc. It is the short-run changes in investor sentiment (more commonly referred to as time-varying risk premiums and cash flow expectations) which can lead to substantialvolatility in the quarterly total returns. Consequently, it is extremely important to assessthe relationship of changing dividend yields between securitized and unsecuritized realestate equities.
In an attempt to gauge the correlation between NAREIT and NCREIF dividendyields, this study examines rolling four-quarter dividend yields – computed on a trailing-dividends basis.14 In this study’s earlier analysis of quarterly dividends, they were foundto be quite volatile and only loosely correlated. The use of the longer period (i.e., fourquarters) here is an attempt to dampen this volatility. Not only is there a substantialquarter-to-quarter volatility in the underlying dividend streams, investors areundoubtedly using periods longer than one quarter to value the asset’s future dividendstream. Consequently, Exhibit 24 illustrates the rolling four-quarter dividend yields forboth indices.
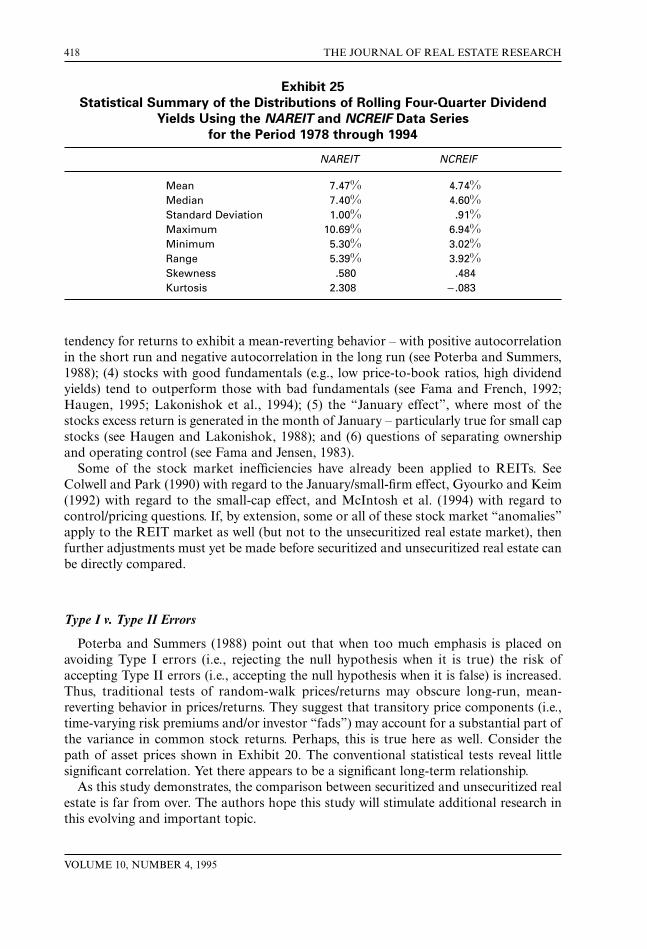
As before, the use of rolling four quarters dampens the volatility of the observations.Nevertheless, the divergence and convergence between the two series is obvious andremarkable. It is apparent that the relationship of dividend yields between securitized andunsecuritized real estate is weak. Again, the securitized/unsecuritized relationship iscounterintuitive. Notwithstanding the significant number of caveats mentioned earlier,why should dividend yields for the same group of real estate assets (coarsely defined)move inversely with one another? A statistical summary of these two distributions isprovided in Exhibit 25.
The disparity in average dividend yields (roughly 270 basis points) is remarkable, giventhat the standard deviations of the respective distributions are nearly identical and thatasset appreciation, over the long run, has been quite consistent for the respective indices(see the means and medians of Exhibit 21). Also interesting is the mean-reverting natureof dividend yields which is suggested by the near-zero mean for each distributionaccompanied by a substantial deviation and range. For the NAREIT series, the meanpercentage change in annual dividend yields was .20% with a standard deviation of
412 THE JOURNAL OF REAL ESTATE RESEARCH
VOLUME 10, NUMBER 4, 1995
Exhibit 21
Statistical Summary of the Distributions of Percentage Change in Quarterly
Investment Values Using the NAREIT and NCREIF Data Series for the Period
7.68%; for the NCREIF series, the mean percentage change was 2.06% with a standarddeviation of 7.67%. Their mean-reverting nature reinforces the importance of examiningthe fundamental sources of returns when examining/projecting long-run returns.
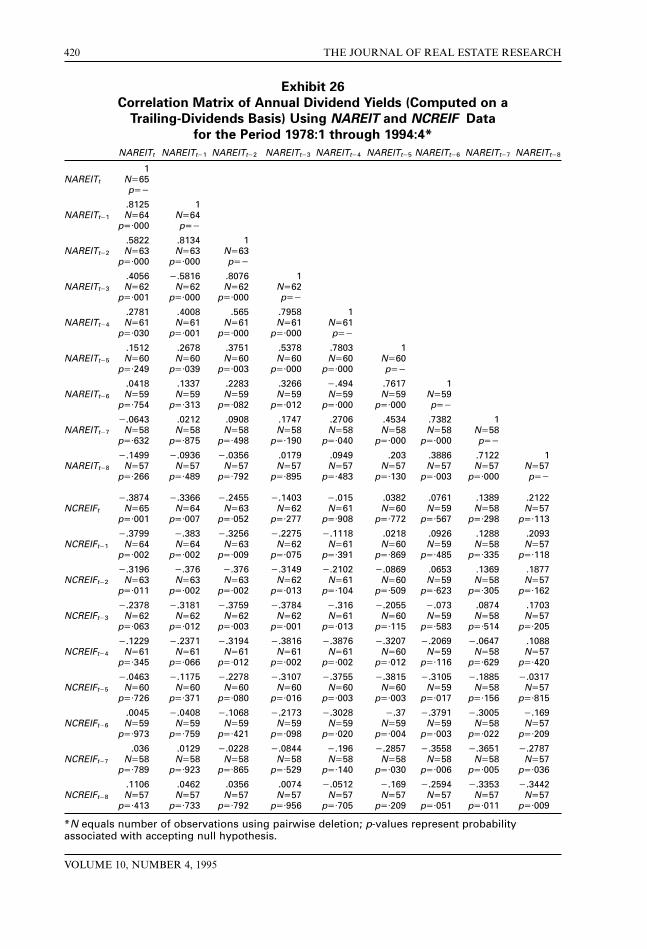
Exhibit 26 examines the spectrum of leading/concurrent/lagged relationships for thequarterly dividend yields. The upper left quadrant of Exhibit 26 indicates that the currentNAREIT dividend yields are significantly (at least at a 95% confidence level) andpositively correlated with lagged NAREIT dividend yields of the past four quarters (i.e.,NAREIT t21 through NAREIT t24). The lower right quadrant indicates that currentNCREIF dividend yields are significantly (at the 95% confidence level) correlated withlagged NCREIF dividend yields of the past six quarters. The lower left quadrantindicates (via its first row) that the current NCREIF dividend yields are significantly (ata 95% confidence level) and inversely correlated with current NAREIT dividend yields, aswell as those for the past two quarters. Conversely, current NAREIT dividend yields aresignificantly and inversely correlated with lagged NCREIF dividend yields of the pastthree quarters.
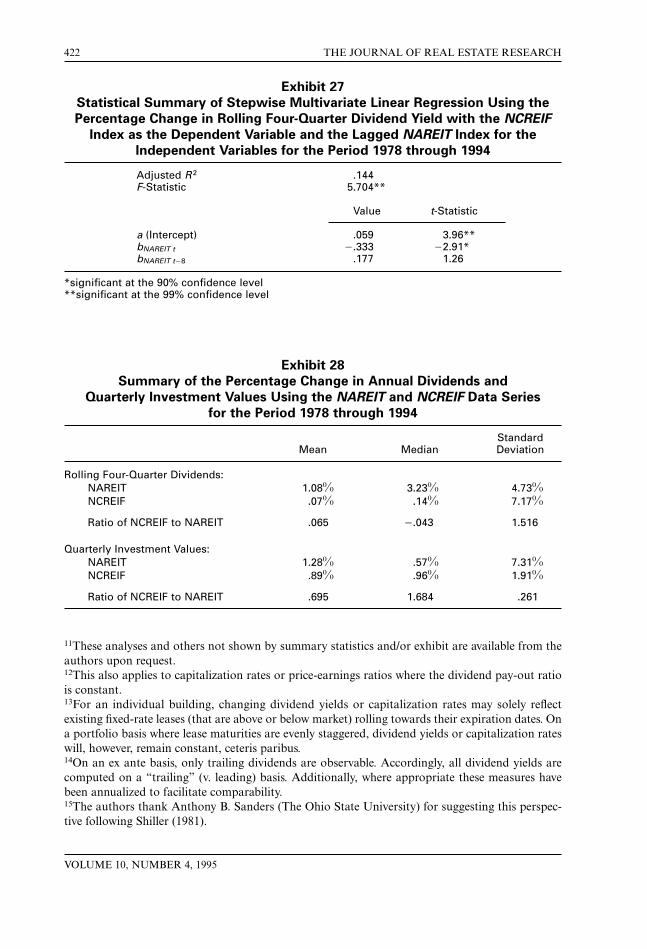
This univariate approach presented in Exhibit 26 was expanded to a multivariateapproach via a stepwise regression with the current NCREIF dividend yields as thedependent variable and the range of current lagged NAREIT dividend yields asincludable independent variables. A summary of this multivariate regression is presentedin Exhibit 27. Concurrent changes in NAREIT dividends are negatively related, withstatistical significance, to current percentage changes in NCREIF dividend yields and thelone significant lagged relationship is found to be positively related. However, the overallexplanatory power of the equation is relatively low – as measured by the adjusted R2
value. Additionally, similar results are obtained if the percentage change in dividendyields is analyzed.
Conclusions and Recommendations
As with previous research, a weak statistical relationship between total returns forsecuritized and unsecuritized real estate has been found. In an attempt to resolve thisenigma, total returns have been unbundled into their fundamental components:dividends, investment values and changes in dividend yields. The short-run relationshipsbetween these fundamental components of the securitized and unsecuritized returns aregenerally weak from a statistical standpoint. Many of the distributions presented in thisstudy display significant non-normal tendencies. Even when lags of up to two years areexamined, these distributions also tend to be weakly correlated with one another. Of thethree fundamental components, the long-run path of prices for securitized andunsecuritized real estate exhibited the strongest relationship (see Exhibit 20). In turn, thissuggests that the weak relationships for explaining total returns may be more attributableto the volatility of dividends (see Exhibit 14) and/or changes in dividend yields. Exhibit28 highlights the relative volatility of dividends and prices for the securitized andunsecuritized series.
The third and sixth rows of Exhibit 28 compute the ratio of the NCREIF statistic tothat of the NAREIT statistic. In comparing the standard deviation of the percentagechange in quarterly investment values, NCREIF volatility is roughly one-fourth of theNAREIT volatility. Yet, in comparing the standard deviation of the percentage change inannual dividends, NCREIF volatility is roughly 150% of the NAREIT volatility.15 This
SECURITIZED AND UNSECURITIZED REAL ESTATE 413
414 THE JOURNAL OF REAL ESTATE RESEARCH
VOLUME 10, NUMBER 4, 1995
Exhibit 22
Correlation Matrix of the Percentage Change in Quarterly Investment
Values Using NAREIT and NCREIF Data for the Period
1978:1 through 1994:4*
*N equals number of observations using pairwise deletion; p-values represent probabilityassociated with accepting null hypothesis.
disparity is remarkable. In a simplified setting, greater dividend volatility should beaccompanied by greater price volatility, not less, as observed here. These results mightsuggest some adaptation of the appraisal smoothing issues raised by Geltner (1989,1993), Gyourko and Keim (1992, 1993), Ross and Zisler (1991) and others.
While the unbundling of securitized and unsecuritized real estate into their funda-mental return components has substantially improved the ability to understand thedifferences between these two series, at least three areas warrant future investigation.
Alignment of Real Estate Issues
As pointed out earlier in the third section (The Data), the considerable differences(i.e., property type, geography, leverage and fees) in the datasets must be resolvedbefore a definitive comparison of the two data series can be made. Myer and Webb(1994) and Liang et al. (1995) have made initial attempts at doing so, but much workstill needs to be done. Additionally, issues related to managed v. unmanaged dividendseries demands further research.
Stock Market Inefficiencies
The last several years have witnessed a substantive assault on the market efficiencyhypothesis regarding the underlying path of stock prices. These assaults include: (1) theexcess volatility of stock prices when using a constant risk premium (see Shiller, 1981); (2)the tendency for past losers to become future winners – and past winners to becomefuture losers, though with less magnitude (see De Bondt and Thaler, 1985); (3) the
416 THE JOURNAL OF REAL ESTATE RESEARCH
VOLUME 10, NUMBER 4, 1995
Exhibit 23
Statistical Summary of Stepwise Multivariate Linear Regression
Using the Percentage Change in Quarterly Investment Values with the
*significant at the 90% confidence level**significant at the 95% confidence level
SEC
UR
ITIZ
ED
AN
D U
NSE
CU
RIT
IZE
D R
EA
L E
STA
TE
417
Exhibit 24
Annual Dividend Yields for the Period from 1978:1 through 1994:4
NAREIT Equity Index (without Healthcare) v. NCREIF Property Index
tendency for returns to exhibit a mean-reverting behavior – with positive autocorrelationin the short run and negative autocorrelation in the long run (see Poterba and Summers,1988); (4) stocks with good fundamentals (e.g., low price-to-book ratios, high dividendyields) tend to outperform those with bad fundamentals (see Fama and French, 1992;Haugen, 1995; Lakonishok et al., 1994); (5) the “January effect”, where most of thestocks excess return is generated in the month of January – particularly true for small capstocks (see Haugen and Lakonishok, 1988); and (6) questions of separating ownershipand operating control (see Fama and Jensen, 1983).
Some of the stock market inefficiencies have already been applied to REITs. SeeColwell and Park (1990) with regard to the January/small-firm effect, Gyourko and Keim(1992) with regard to the small-cap effect, and McIntosh et al. (1994) with regard tocontrol/pricing questions. If, by extension, some or all of these stock market “anomalies”apply to the REIT market as well (but not to the unsecuritized real estate market), thenfurther adjustments must yet be made before securitized and unsecuritized real estate canbe directly compared.
Type I v. Type II Errors
Poterba and Summers (1988) point out that when too much emphasis is placed onavoiding Type I errors (i.e., rejecting the null hypothesis when it is true) the risk ofaccepting Type II errors (i.e., accepting the null hypothesis when it is false) is increased.Thus, traditional tests of random-walk prices/returns may obscure long-run, mean-reverting behavior in prices/returns. They suggest that transitory price components (i.e.,time-varying risk premiums and/or investor “fads”) may account for a substantial part ofthe variance in common stock returns. Perhaps, this is true here as well. Consider thepath of asset prices shown in Exhibit 20. The conventional statistical tests reveal littlesignificant correlation. Yet there appears to be a significant long-term relationship.
As this study demonstrates, the comparison between securitized and unsecuritized realestate is far from over. The authors hope this study will stimulate additional research inthis evolving and important topic.
418 THE JOURNAL OF REAL ESTATE RESEARCH
VOLUME 10, NUMBER 4, 1995
Exhibit 25
Statistical Summary of the Distributions of Rolling Four-Quarter Dividend
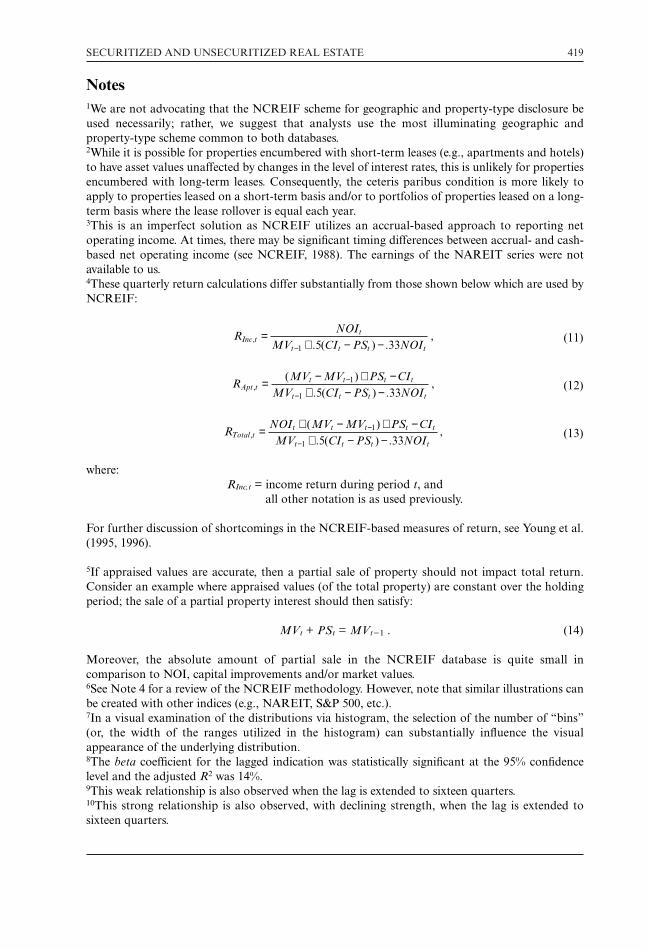
Notes1We are not advocating that the NCREIF scheme for geographic and property-type disclosure beused necessarily; rather, we suggest that analysts use the most illuminating geographic andproperty-type scheme common to both databases.2While it is possible for properties encumbered with short-term leases (e.g., apartments and hotels)to have asset values unaffected by changes in the level of interest rates, this is unlikely for propertiesencumbered with long-term leases. Consequently, the ceteris paribus condition is more likely toapply to properties leased on a short-term basis and/or to portfolios of properties leased on a long-term basis where the lease rollover is equal each year.3This is an imperfect solution as NCREIF utilizes an accrual-based approach to reporting netoperating income. At times, there may be significant timing differences between accrual- and cash-based net operating income (see NCREIF, 1988). The earnings of the NAREIT series were notavailable to us.4These quarterly return calculations differ substantially from those shown below which are used byNCREIF:
BASE (11)
BASE (12)
BASE (13)
where:RInc,t = income return during period t, and
all other notation is as used previously.
For further discussion of shortcomings in the NCREIF-based measures of return, see Young et al.(1995, 1996).
5If appraised values are accurate, then a partial sale of property should not impact total return.Consider an example where appraised values (of the total property) are constant over the holdingperiod; the sale of a partial property interest should then satisfy:
MVt + PSt = MVt21 . (14)
Moreover, the absolute amount of partial sale in the NCREIF database is quite small incomparison to NOI, capital improvements and/or market values.6See Note 4 for a review of the NCREIF methodology. However, note that similar illustrations canbe created with other indices (e.g., NAREIT, S&P 500, etc.).7In a visual examination of the distributions via histogram, the selection of the number of “bins”(or, the width of the ranges utilized in the histogram) can substantially influence the visualappearance of the underlying distribution.8The beta coefficient for the lagged indication was statistically significant at the 95% confidencelevel and the adjusted R2 was 14%.9This weak relationship is also observed when the lag is extended to sixteen quarters.10This strong relationship is also observed, with declining strength, when the lag is extended tosixteen quarters.
R
NOI MV MV PS CIMV CI PS NOI
Total tt t t t t
t t t t,
( ). ( ) .
,= + − + −+ − −
−
−
1
1 5 33
R
MV MV PS CIMV CI PS NOI
Apt tt t t t
t t t t,
( ). ( ) .
,= − + −+ − −
−
−
1
1 5 33
R
NOIMV CI PS NOI
Inc tt
t t t t,
. ( ) .,=
+ − −−1 5 33
SECURITIZED AND UNSECURITIZED REAL ESTATE 419
420 THE JOURNAL OF REAL ESTATE RESEARCH
VOLUME 10, NUMBER 4, 1995
Exhibit 26
Correlation Matrix of Annual Dividend Yields (Computed on a
Trailing-Dividends Basis) Using NAREIT and NCREIF Data
for the Period 1978:1 through 1994:4*
*N equals number of observations using pairwise deletion; p-values represent probabilityassociated with accepting null hypothesis.
11These analyses and others not shown by summary statistics and/or exhibit are available from theauthors upon request.12This also applies to capitalization rates or price-earnings ratios where the dividend pay-out ratiois constant.13For an individual building, changing dividend yields or capitalization rates may solely reflectexisting fixed-rate leases (that are above or below market) rolling towards their expiration dates. Ona portfolio basis where lease maturities are evenly staggered, dividend yields or capitalization rateswill, however, remain constant, ceteris paribus.14On an ex ante basis, only trailing dividends are observable. Accordingly, all dividend yields arecomputed on a “trailing” (v. leading) basis. Additionally, where appropriate these measures havebeen annualized to facilitate comparability.15The authors thank Anthony B. Sanders (The Ohio State University) for suggesting this perspec-tive following Shiller (1981).
422 THE JOURNAL OF REAL ESTATE RESEARCH
VOLUME 10, NUMBER 4, 1995
Exhibit 27
Statistical Summary of Stepwise Multivariate Linear Regression Using the
Percentage Change in Rolling Four-Quarter Dividend Yield with the NCREIF
Index as the Dependent Variable and the Lagged NAREIT Index for the
Independent Variables for the Period 1978 through 1994
Adjusted R2 .144F-Statistic 5.704**
Value t-Statistic
a (Intercept) .059 3.96**bNAREIT t 2.333 22.91*bNAREIT t28 .177 1.26
*significant at the 90% confidence level**significant at the 99% confidence level
Exhibit 28
Summary of the Percentage Change in Annual Dividends and
Quarterly Investment Values Using the NAREIT and NCREIF Data Series
for the Period 1978 through 1994
StandardMean Median Deviation
Rolling Four-Quarter Dividends:NAREIT 1.08% 3.23% 4.73%NCREIF .07% .14% 7.17%
ReferencesChan, K. C., P. H. Hendershott and A. B. Sanders, Risk and Return on Real Estate: Evidence from
Equity REITs, AREUEA Journal, Winter 1990, 431–52.Chen, K. C. and D. D. Tzang, Interest-Rate Sensitivity of Real Estate Investment Trusts, Journal of
Real Estate Research, Fall 1988, 13–22.Colwell, P. F. and H. Y. Park, Seasonality and Size Effects, The Case of Real Estate-Related
Investments, Journal of Real Estate Finance and Economics, September 1990, 251–59.Corgel, J. B., W. McIntosh and S. H. Ott, Real Estate Investment Trusts: A Review of the Financial
Economics Literature, Journal of Real Estate Literature, January 1995, 13–43.Culley, S. A. and J. D. Shilling, REIT Dividend Rates and Their Implications for Valuing Income-
Producing Real Estate, Appraisal Journal, July 1990, 386–94.De Bondt, W. F. M. and R. H. Thaler, Does the Stock Market Overreact?, Journal of Finance, July
1985, 793–808.Fama, E. F. and K. R. French, The Cross Section of Expected Stock Returns, Journal of Finance,
June 1992, 427–65.Fama, E. F. and M. C. Jensen, Separation of Ownership and Control, Journal of Law and
Economics, June 1983, 301–25.Fisher, J. D., D. M. Geltner and R. B. Webb, Value Indices of Commercial Real Estate: A
Comparison of Index Construction Methods, Journal of Real Estate Finance and Economics,September 1994, 137–64.
Frank, R. A., Active First Half Brings 1994 Underwriting to New-Record Level, Alex. Brown &Sons Incorporated, December 9, 1994.
———, The UPREIT: Keys to the Real Estate Kingdom? Alex. Brown & Sons Incorporated,March 31, 1993.
Gatzlaff, D. H. and D. Tirtiroglu, Real Estate Market Efficiency: Issues and Evidence, Journal ofReal Estate Literature, July 1995, 157–89.
Geltner, D., Estimating Market Values from Appraised Values without Assuming an EfficientMarket, Journal of Real Estate Research, Summer 1993, 325–45.
———, Estimating Real Estate’s Systematic Risk from Aggregate Level Appraisal-Based Returns,AREUEA Journal, Winter 1989, 463–81.
Giliberto, S. M., Equity Real Estate Investment Trusts and Real Estate Returns, Journal of RealEstate Research, Summer 1990, 259–63.
———, Measuring Real Estate Returns: The Hedged REIT Index, Journal of PortfolioManagement, Spring 1993, 94–99.
Glascock, J. L. and W. T. Hughes, Jr., NAREIT Identified Exchange Listed REITs and TheirPerformance Characteristics, Journal of Real Estate Literature, January 1995, 63–83.
Gordon, M. J. and E. Shapiro, Capital Equipment Analysis: The Required Rate of Profit,Management Science, October 1956, 102–10.
Gyourko, J. E., Statement on the NCREIF Leveraged Property Report, Presentation to theNCREIF Meetings, May 1992.
——— and D. B. Keim, What Does the Stock Market Tell Us About Real Estate Returns?, Journalof the American Real Estate and Urban Economics Association, Fall 1992, 457–85.
———, Risk and Return in Real Estate: Evidence from a Real Estate Stock Index, FinancialAnalysts Journal, September–October 1993, 39–46.
Haugen, R. A., The New Finance: The Case Against Efficient Markets, Englewood Cliffs, N.J.:Prentice Hall, 1995.
——— and J. Lakonishok, The Incredible January Effect, Homewood, Ill.: Dow-Jones-Irwin, 1988.Holden, M. P. and K. G. Redding, The Geographic Distribution of Properties Owned by Real
Estate Investment Trusts, The RREEF Funds – Research, September 1993.
SECURITIZED AND UNSECURITIZED REAL ESTATE 423
Howe, J. S. and J. D. Shilling, Capital Structure Theory and REIT Security Offerings, Journal ofFinance, September 1988, 983–93.
Kerson, J. S., Trading in Fundamental Real Estate Risk with Market-Hedged Equity Indexes,Bankers Trust Research – Derivatives Focus, September 1, 1994.
Khoo, T., D. Hartzell and M. Hoesli, An Investigation of the Change in Real Estate InvestmentTrust Betas, Journal of the American Real Estate and Urban Economics Association, Summer1993, 107–30.
Lakonishok, J., A. Shleifer and R. W. Vishny, Contrarian Investment, Extrapolation and Risk,Journal of Finance, December 1994, 1541–78.
Liang, Y., A Chatrath and W. McIntosh, Apartment REITs and Apartment Real Estate, January1995, Working paper.
Litt, J., D. J. Kostin and B. T. Hatfield, Equity is King and Variable Rate Debt is a REIT’s Achilles’Heel, Salomon Brothers, July 7, 1994.
Litt, J. and T. S. Harris, Understanding REIT Accounting and Disclosure Will Affect RelativeValuations, Salomon Brothers, December 1, 1994.
Liu, C. H., D. J. Hartzell, T. W. Greig and T. V. Grissom, The Integration of the Real Estate Marketand the Stock Market, Some Preliminary Evidence, Journal of Real Estate Finance andEconomics, September 1990, 261–82.
Liu, C. H. and J. Mei, The Predictability of Returns on Equity REITs and Their Co-Movementwith Other Assets, Journal of Real Estate Finance and Economics, September 1992, 401–18.
McIntosh, W., R. Rogers, C. F. Sirmans and Y. Liang, Stock Prices and Management Changes: TheCase of REITs, Journal of the American Real Estate and Urban Economics Association, Fall 1994,515–26.
Maris, B. A. and F. A. Elayan, Capital Structure and the Cost of Capital for Untaxed Firms: TheCase of REITs, AREUEA Journal, Spring 1990, 22–39.
Martin, E. J., Truth or Consequences, Institutional Investor, February 1995, 113–16.Martin, J. D. and D. O. Cook, A Comparison of the Recent Performance of Publicly Traded Real
Estate Portfolios and Common Stock, AREUEA Journal, Summer 1991, 184–97.Modigliani, F. and M. H. Miller, The Cost of Capital, Corporation Finance, and the Theory of
Investment, American Economic Review, June 1958, 261–97.Myer, F. C. N. and J. R. Webb, Retail Stocks, Retail REITs and Retail Real Estate, Journal of Real
Estate Research, Winter 1994, 65–84.———, Return Properties on Equity REITs, Common Stocks and Commercial Real Estate: A
Comparison, Journal of Real Estate Research, Winter 1993.The National Council of Real Estate Investment Fiduciaries, Current Value Reporting by Real
Estate Fiduciary Managers, in Real Estate Accounting and Taxation, Fall 1988.Pagliari, J. L., Jr. and A. B. Sanders, Option Pricing Models Applied to Asset, Mortgage and
Equity Investments: A Real Estate Practitioner’s Overview, working paper, 1995.Poterba, J. M. and L. H. Summers, Mean Reversion in Stock Prices: Evidence and Implications,
Journal of Financial Economics, October 1988, 27–59.Ross, S. A. and R. C. Zisler, Risk and Return in Real Estate, Journal of Real Estate Finance and
Economics, June 1991, 175–90.Sagalyn, L. B., Agency Problems in the Structure of REITs, working paper, September 1994.Shiller, R. J., Do Stock Prices Move Too Much to be Justified by Subsequent Changes in
Dividends?, American Economic Review, June 1981, 421–36.Shiller, R. J., The Use of Volatility Measures in Assessing Market Efficiency, Journal of Finance,
May 1981, 291–304.Titman, S. and A. Warga, Risk and the Performance of Real Estate Investment Trusts: A Multiple
Index Approach, AREUEA Journal, Fall 1986, 414–31.
424 THE JOURNAL OF REAL ESTATE RESEARCH
VOLUME 10, NUMBER 4, 1995
Vinocur, B., Floating-Rate Debt May Make High-Yield REITs Investor Traps, Barrons, November1992, 9, 51.
Wang, K., J. Erickson and G. W. Gau, Dividend Policies and Dividend Announcement Effects forReal Estate Investment Trusts, Journal of the American Real Estate and Urban EconomicsAssociation, Summer 1993, 185–201.
Young, M. S. and R. Graff, Real Estate Is Not Normal: A Fresh Look at Real Estate ReturnDistributions, Journal of Real Estate Finance and Economics, May 1995, 225–59.
Young, M. S., D. M. Geltner, W. McIntosh and D. M. Poutasse, Defining Commercial PropertyIncome and Appreciation Returns for Comparability to Stock Market-Based Measures, RealEstate Finance, Summer 1995, 19–30.
———, Understanding Equity Real Estate Performance: Insights fom the NCREIF PropertyIndex, Real Estate Review, Winter 1996, 4–16.
SECURITIZED AND UNSECURITIZED REAL ESTATE 425
426 THE JOURNAL OF REAL ESTATE RESEARCH
VOLUME 10, NUMBER 4, 1995
LINES FOR PATCHING IN
Total Annual Return
Holding Period (Years)
.90 Shift
.95 Shift1.00 Shift1.05 Shift1.10 Shift
NCREIF Property Index
Quarterly Dividends Based upon Initial $100 Investment
Annual Dividends Based upon Initial $100 Investment
Quarterly Investment Values Based upon Initial $100 Investment
Annual Dividend Yields Computed on Trailing-Dividends Basis