18
The micro-geography of UK demographic change 1991-2001 Paul Norman School of Geography, University of Leeds Understanding Population Trends and Processes
| Date post: | 17-Dec-2015 |
| Category: |
Documents |
| Upload: | jonah-craig |
| View: | 222 times |
| Download: | 0 times |

The micro-geography of UK demographic change 1991-2001
Paul NormanSchool of Geography, University of Leeds
Understanding Population Trends and Processes
ESRC RES-163-25-0012 for 2005-07 @ 40%

Main aim
Quantify and map changes in population size and social characteristics which occurred in UK’s small geographical areas between the 1991 and 2001 Censuses
Small area geography of reporting: wards & equivalents
Population change
• Which demographic components account for change? Balance between natural change & migration change
Area characteristics change
• Are areas becoming more or less deprived over time? Which area attributes change & why?

The micro-geography of UK demographic change 1991-2001
Population change
• Data preparation & number crunching: mostly completed
• Analysis: yet to be carried out
Area characteristics change
• Data preparation & number crunching: partly completed
LGA presentation
• Background
• Data problems & solutions
• Preliminary results
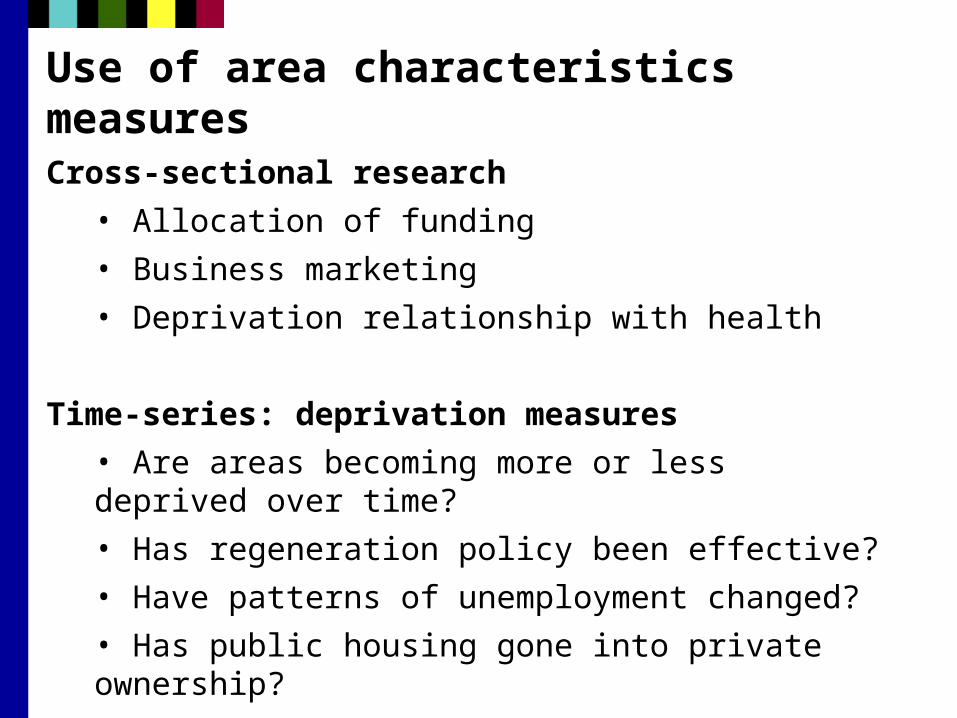
Use of area characteristics measures Cross-sectional research
• Allocation of funding
• Business marketing
• Deprivation relationship with health
Time-series: deprivation measures
• Are areas becoming more or less deprived over time?
• Has regeneration policy been effective?
• Have patterns of unemployment changed?
• Has public housing gone into private ownership?
• Has health improved in areas now less deprived?

Background: Classification of areasUse of multiple input variables to produce a summary measure of an area’s characteristics
• Charles Booth, late 19th Century • Human Ecologists, Chicago 1920s• Social Area Analysis• Factor Analysis / Principal Components Analysis• Deprivation Indexes • Geodemographics
Location Demographic Household Employment Education Health
Area 1
Area 2
Area 3
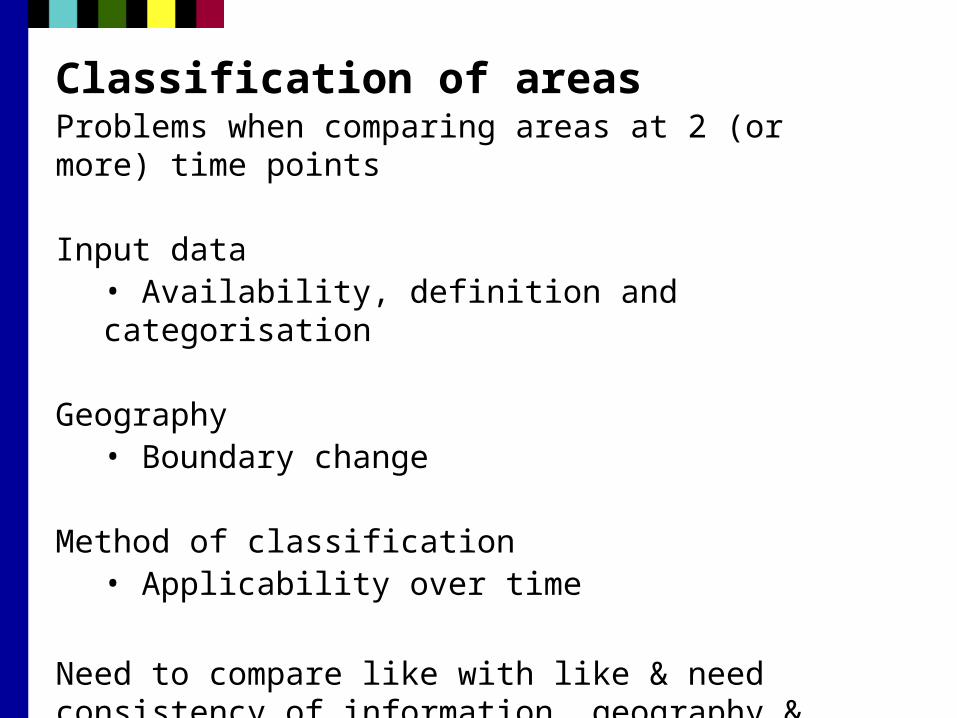
Classification of areasProblems when comparing areas at 2 (or more) time points
Input data• Availability, definition and categorisation
Geography• Boundary change
Method of classification• Applicability over time
Need to compare like with like & need consistency of information, geography & methodOtherwise comparisons invalid
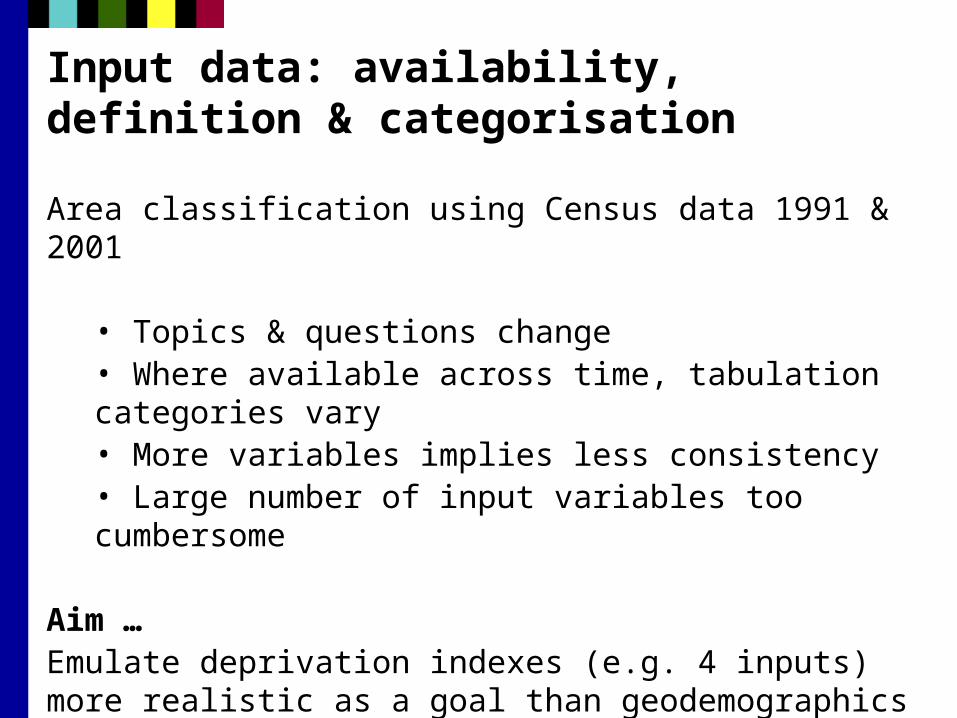
Input data: availability, definition & categorisation
Area classification using Census data 1991 & 2001
• Topics & questions change• Where available across time, tabulation categories vary• More variables implies less consistency• Large number of input variables too cumbersome
Aim …Emulate deprivation indexes (e.g. 4 inputs) more realistic as a goal than geodemographics (e.g. 41 variables in ONS 2001 OA classification by Dan Vickers)

Input data
Indexes widely used since 1980s
Townsend index Carstairs index• Unemployment • Male unemployment• Household overcrowding • Household overcrowding• No access to car • No access to car• Non-home ownership • Low social class
Townsend variables stable & comparable over timeCarstairs
• Male unemployment too narrow• Low social class misses/misclassifies people

Geography: small area boundary change
Ward boundaries change to maintain sub-district equality in elector to councillor ratios
Census data: smallest areas Enumeration Districts in 1991 a different geography to 2001 Output Areas
Data collected & released for 1991 small areas cannot directly be compared with 2001 data
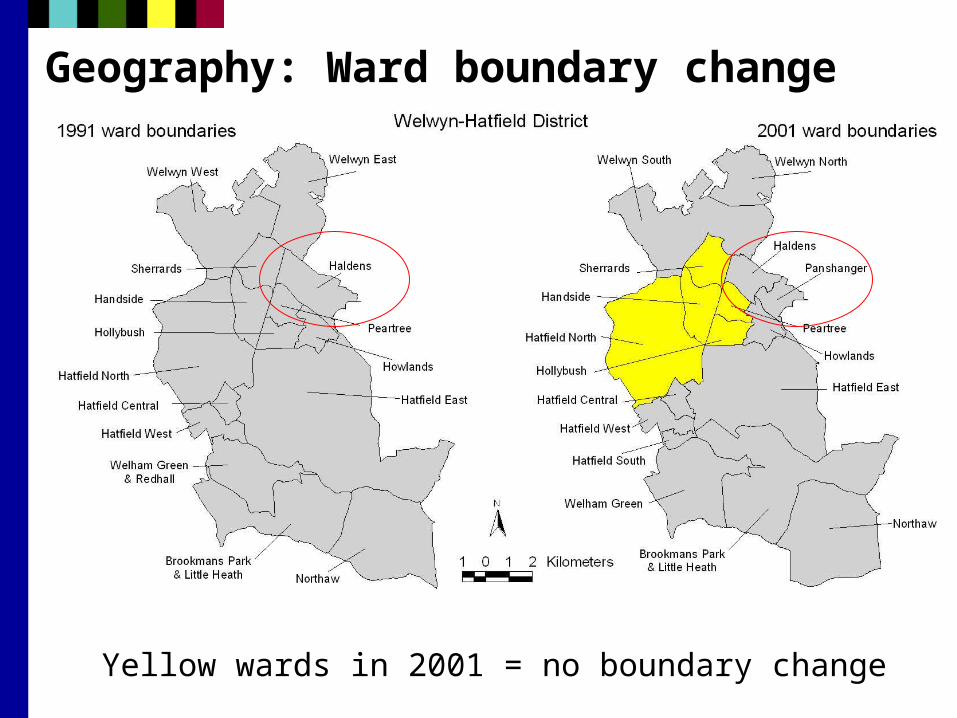
Geography: Ward boundary change
Yellow wards in 2001 = no boundary change
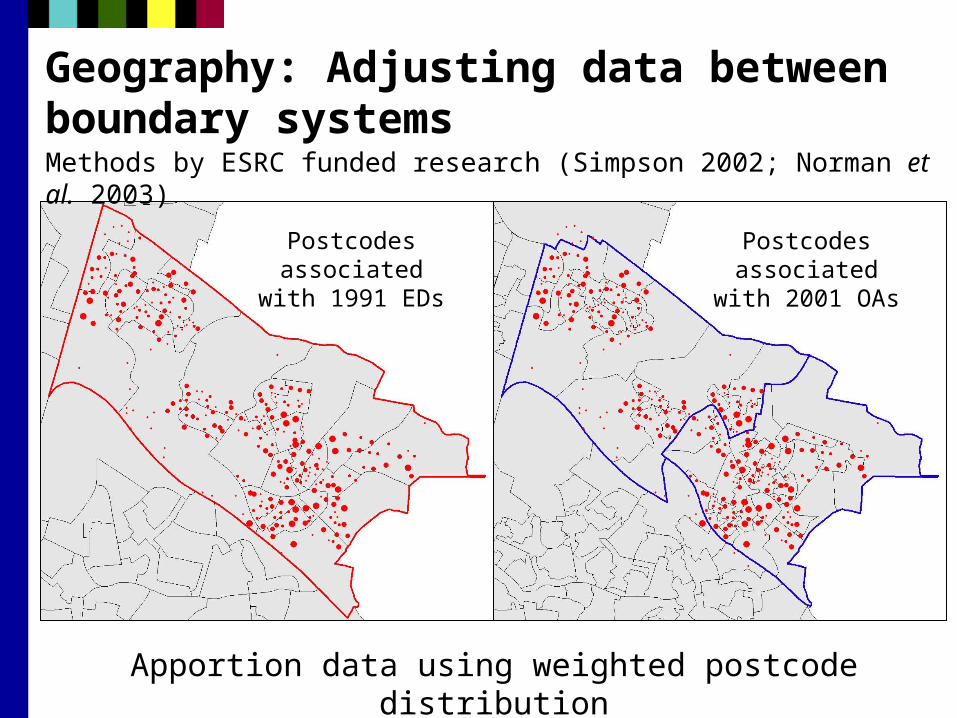
Geography: Adjusting data between boundary systemsMethods by ESRC funded research (Simpson 2002; Norman et al. 2003)
Postcodes associated with
1991 EDs
Postcodes associated with
2001 OAs
Apportion data using weighted postcode distribution

Method of area classification
Geodemographic cluster algorithms may be usable at two or more time-points to classify areas (more work needed)
Are deprivation index methods usable across time?• Input variables reveal each area’s situation relative to national level• In 1991, is unemployment for area 1 more or less than England & Wales as a whole?
Decide on national comparison level• 1991, 2001 or an average
Deprivation 1991 & 2001
Townsend index• Unemployment• Household overcrowding• No access to car• Non-home ownership
Data for 1991 EDs converted to 2001 OAs to capture sub-ward distributions, then aggregate to wardsCalculate 1991 and 2001 indexesComparison relative to 2001 levels
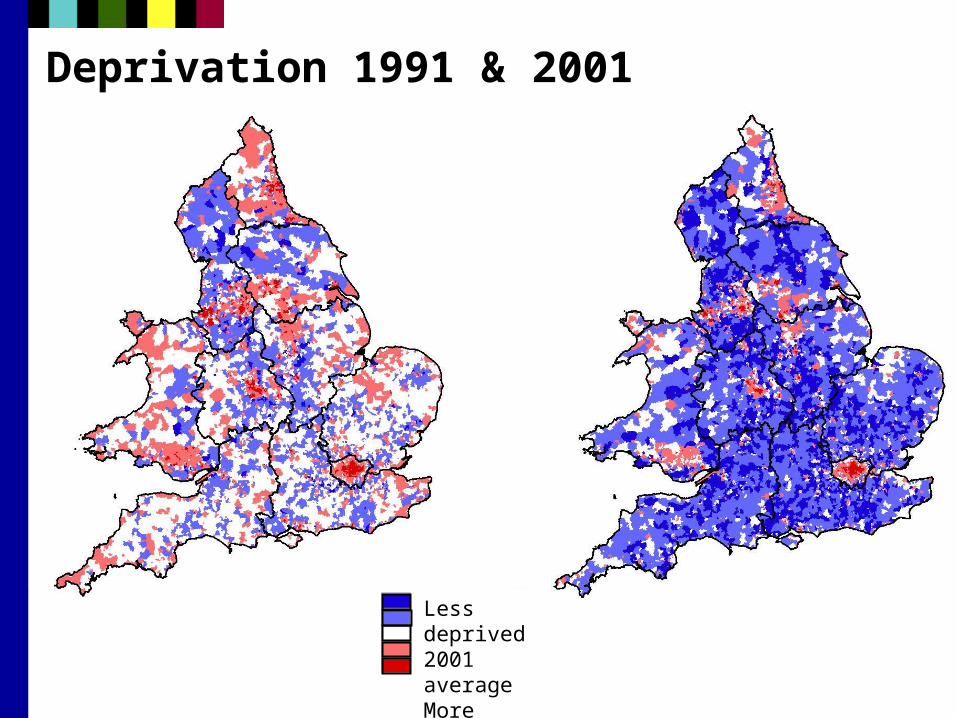
Deprivation 1991 & 2001
Less deprived2001 averageMore deprived

Deprivation 1991 & 2001

Why has deprivation changed 1991-2001?Change at national level
• Unemployment 9% to 5%• Household overcrowding 2% to 1.5%• No access to car 27% to 22%• Non-home ownership 30% to 28%
Local variations: yet to investigate
Employment sector changesTenure changesRegeneration schemes
• Database?

Effect of changing deprivationLimiting long-term illness 1991 & 2001
1991
2001
Is increasing deprivation over time associated with worse health?

The micro-geography of UK demographic change 1991-2001
Ongoing work …
Population change
• Which demographic components account for change? Balance between natural change & migration change
Area characteristics change
• Are areas becoming more or less deprived over time? Which area attributes change & why?
Analysis for both to be done
Area characteristics data preparation for Scotland and Northern Ireland


