This is the first in a series of reports on the demographic and political dynamics under way in 10 “bat- tleground” states, deemed to be crucial in deciding the 2008 election. As part of the Metropolitan Policy Program’s Blueprint for American Prosperity, this series will provide an electoral component to the initiative’s analysis of and prescriptions for bolstering the health and vitality of America’s metropolitan areas, the engines of the U.S economy. This report focuses on Pennsylvania. Among its specific findings are: These trends could have their strongest impact in the fast-growing Allentown region, which may move solidly into the Demo- cratic column in 2008 and beyond, following the trajectory of the Philadelphia suburbs. The even-faster-growing Harrisburg region remains a GOP firewall, but the same trends could make that region more closely contested in 2008. A. Pennsylvania is becoming a demographic “bridge” between Midwestern states like Ohio and other North- eastern states like New Jersey, as its new growth is tied to urban coastal regions. While often classed as a so-called “Rust Belt” state, its eastern and south central regions are increasingly becoming part of the nation’s Northeast Corri- dor, with new growth and demographic profiles that warrant attention in upcoming elections. B. Eligible voter populations indicate a state in transition, where minorities, especially Hispanics, and white college graduates are increasingly important, but where white working class voters continue to play a central role. While white working class voters continue to decline as a share of voters and are less likely to work in manufacturing and goods production, they are still a critical segment of voters, includ- ing in the fast-growing Harrisburg and Allentown regions where their absolute numbers are actually increasing. C. Recent Democratic victories in Pennsylvania have fea- tured strong support from groups like minorities, single women, and the young but have also benefited from rela- tively strong support among the white working class, especially among its upwardly mobile segment that has some college education. Compared to 1988, both the latter group and white college graduates have increased their sup- port for Democrats. And both groups have increased their share of voters over the time period. D. Political shifts in Pennsylvania since 1988 have seen the growing eastern part of the state swing toward the Democrats, producing four straight presidential victories for that party. The swing has been sharpest in the Philadel- phia suburbs, but has also been strong in the Allentown region and even affected the pro-Republican Harrisburg region. Countering this swing, the declining western part of the state has been moving toward the GOP. E. Key trends and groups to watch in 2008 include the white working class, especially whites with some college, who, unlike the rest of this group, are growing; white col- lege graduates; and Hispanics, who have been driving the growth of the minority vote. BROOKINGS POLICY BRIEF | April 2008 The Political Geography of Pennsylvania: Not Another Rust Belt State By William H. Frey and Ruy Teixeira
Transcript
This is the first in a series of reports on the demographic and political dynamics under way in 10 “bat-
tleground” states, deemed to be crucial in deciding the 2008 election. As part of the Metropolitan
Policy Program’s Blueprint for American Prosperity, this series will provide an electoral component
to the initiative’s analysis of and prescriptions for bolstering the health and vitality of America’s metropolitan areas, the
engines of the U.S economy. This report focuses on Pennsylvania. Among its specific findings are:
These trends could have their strongest impact in the fast-growing Allentown region, which may move solidly into the Demo-
cratic column in 2008 and beyond, following the trajectory of the Philadelphia suburbs. The even-faster-growing Harrisburg
region remains a GOP firewall, but the same trends could make that region more closely contested in 2008.
A. Pennsylvania is becoming a demographic “bridge”
between Midwestern states like Ohio and other North-
eastern states like New Jersey, as its new growth is tied
to urban coastal regions. While often classed as a so-called
“Rust Belt” state, its eastern and south central regions are
increasingly becoming part of the nation’s Northeast Corri-
dor, with new growth and demographic profiles that warrant
attention in upcoming elections.
B. Eligible voter populations indicate a state in transition,
where minorities, especially Hispanics, and white college
graduates are increasingly important, but where white
working class voters continue to play a central role. While
white working class voters continue to decline as a share of
voters and are less likely to work in manufacturing and goods
production, they are still a critical segment of voters, includ-
ing in the fast-growing Harrisburg and Allentown regions
where their absolute numbers are actually increasing.
C. Recent Democratic victories in Pennsylvania have fea-
tured strong support from groups like minorities, single
women, and the young but have also benefited from rela-
tively strong support among the white working class,
especially among its upwardly mobile segment that has
some college education. Compared to 1988, both the latter
group and white college graduates have increased their sup-
port for Democrats. And both groups have increased their
share of voters over the time period.
D. Political shifts in Pennsylvania since 1988 have seen
the growing eastern part of the state swing toward the
Democrats, producing four straight presidential victories
for that party. The swing has been sharpest in the Philadel-
phia suburbs, but has also been strong in the Allentown
region and even affected the pro-Republican Harrisburg
region. Countering this swing, the declining western part of
the state has been moving toward the GOP.
E. Key trends and groups to watch in 2008 include the
white working class, especially whites with some college,
who, unlike the rest of this group, are growing; white col-
lege graduates; and Hispanics, who have been driving the
growth of the minority vote.
BROOKINGS POLICY BRIEF | April 2008
The Political Geography of Pennsylvania:Not Another Rust Belt State
By William H. Frey and Ruy Teixeira
Introduction
This report on the political demography and geography of Pennsylvania is the firstin a series of reports on 10 key “purple” states in the 2008 election. Purple states are states where
the current balance of political forces does not decisively favor one party or the other, as it does in the
solid red (Republican) and blue (Democratic) states. But demographic and geographic trends are con-
stantly testing the balance in these purple states and may nudge them not just toward a particular party
in this election but toward one party decisively over the longer term.
This report provides a guide to the trends that are currently testing and reshaping Pennsylvania’s bal-
ance of forces, determining how this purple state will lean in 2008 and whether it will actually remain
a toss-up in years to come.
As presidential politics go, Pennsylvania is certainly a purple state, but in the slow-growing mode. As dis-
tinct from purple states like Florida, Arizona, and Colorado, the Keystone State has seen tepid growth
in recent decades, linked in large part to the decline of its once-proud steel and other heavy industries.
Yet when it comes to political demographics, Pennsylvania has become less stagnant than in the
recent past, with strong growth in college graduates and skilled service industries and increased diver-
sity due to a burgeoning Hispanic population. It defies simple labels like “Rust Belt state” or the now
famous description by political strategist James Carville: “Philadelphia and Pittsburgh with Alabama
in the middle”
This categorization, always simplistic, was more applicable to the Pennsylvania of the 1990s than
today’s Pennsylvania. In fact, given the sharp growth and political transitions occurring in the eastern
part of the state, the political future of the state may be determined as much by trends in the grow-
ing Allentown region than by any of the parts of Carville’s troika.
Data and Regional Definitions
The demographic, polling and voting statistics presented in this report are the latest
available from authoritative sources. The demographic profiles of U.S. states and Pennsylvania regions
are drawn from the U.S. Decennial Censuses through 2000, U.S. Census Bureau population estimates
for states, and counties though July 2007, and from the Public Use Micro Sample of the Census
Bureau’s 2006 American Community Survey. Polling data are drawn from 1988 CBS/New York Times
Pennsylvania exit poll and the 2004 and 2006 National Election Pool Pennsylvania exit polls. Additional
data on the demographics of actual voters are drawn from the 1988 and 2004 Current Population Sur-
vey’s November Voter Supplements. Presidential and Congressional election data are drawn from
official county-level election returns for Pennsylvania.
2 BROOKINGS | April 2008
Regional DefinitionsOur analysis of eligible voters and
election results in the remaining
sections of this report will focus
on seven regions, depicted in
Map 1, which are strategic in terms
of their recent demographic shifts
and voting trends.1 In so doing, we
also take cognizance of key met-
ropolitan, city and suburban areas
within the state.
Philadelphia — Philadelphia
County (coterminous with city of
Philadelphia)
Philadelphia Suburbs — Delaware,
Chester, Montgomery, and Bucks
counties in the suburban portion
of the Philadelphia metropolitan
area
The first two regions separate the city and suburbs of the Philadelphia-Camden-Wilmington metro-
politan area (Pennsylvania portion). This reflects the size of the city itself, very different growth
patterns for the city (4.2 percent decline since 2000) and suburbs (4.3 percent increase) and sharply
different city and suburb demographics which have translated into long standing differences in voting
patterns.
Allentown-Scranton-Reading includes the Allentown-Bethlehem-Easton metropolitan area (Pennsyl-
vania portion), Scranton/Wilkes-Barre metro; Reading metro, Pike County (part of the New
York-Northern Jersey- Long Island metro) and the nearby counties of Monroe, Wayne, Susquehanna,
Columbia, and Schuylkill
The Allentown and Scranton metro areas are Pennsylvania’s third and fourth largest and share cultural
affinities and recent political shifts. They differ nonetheless in growth patterns. Like much of eastern
Pennsylvania, the Allentown metropolitan region, known as the Lehigh Valley, shows substantial growth
since 2000 (8 percent), while the Scranton region, registers a loss (-1.8 percent). The Reading metro-
politan area shows healthy growth (7 percent) and the counties adjacent to the New Jersey and
northeast New York border—Monroe, Pike, and Wayne—are among the fastest growing in the state. The
region is a primarily metropolitan region with 86 percent of its population lying inside metropolitan areas.
1. Mercer County, PA is an outer county in the Youngstown-Warren-Boardman, OH-PAMetropolitan Statistical Area.2. Pike County, PA is an outer county in the New York-Northern New Jersey-Long Island, NY-NJ-PAMetropolitan Statistical Area.
Counties
Metropolitan Areas
Regions
Map 1. Pennsylvania Metropolitan Areas and Regions
1. Mercer County, PA is an outer county in the Youngstown-Warren-Boardman, OH-PA Metropolitan Statistical Area. 2.Pike County, PA is an outer county in the New York-Northern New Jersey-Long Island, NY-NJ-PA Metropolitan Statis-tical Area.
4 BROOKINGS | April 2008
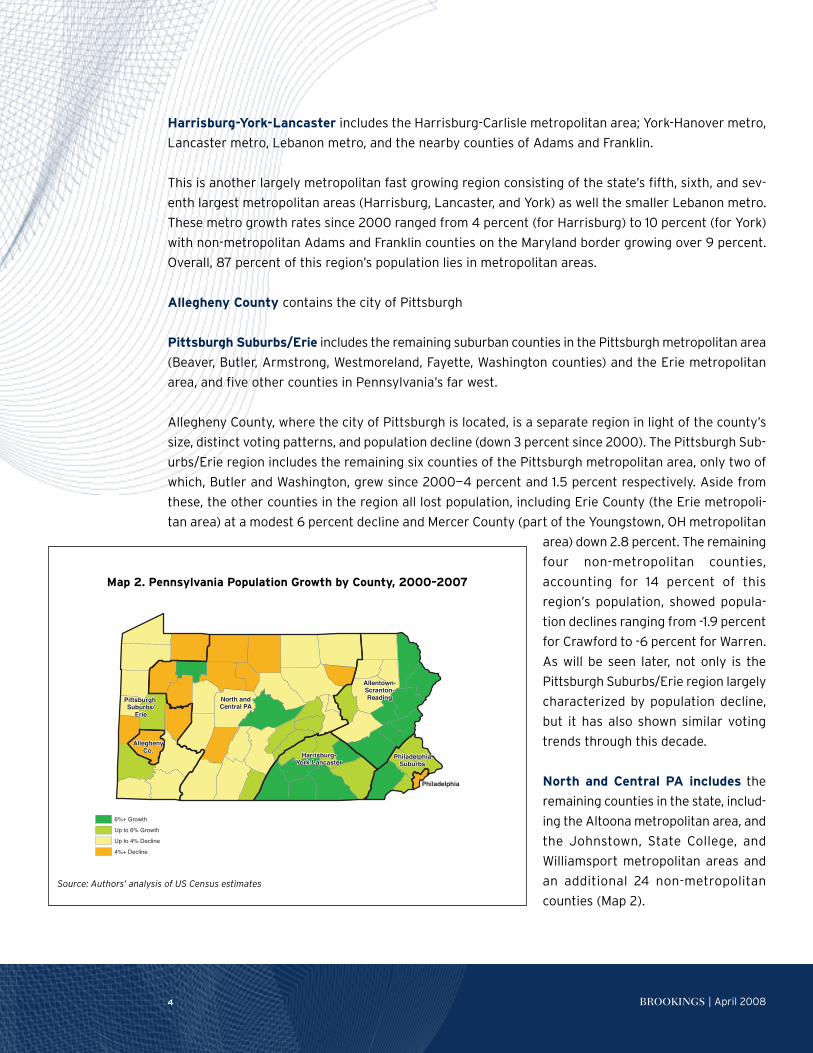
Harrisburg-York-Lancaster includes the Harrisburg-Carlisle metropolitan area; York-Hanover metro,
Lancaster metro, Lebanon metro, and the nearby counties of Adams and Franklin.
This is another largely metropolitan fast growing region consisting of the state’s fifth, sixth, and sev-
enth largest metropolitan areas (Harrisburg, Lancaster, and York) as well the smaller Lebanon metro.
These metro growth rates since 2000 ranged from 4 percent (for Harrisburg) to 10 percent (for York)
with non-metropolitan Adams and Franklin counties on the Maryland border growing over 9 percent.
Overall, 87 percent of this region’s population lies in metropolitan areas.
Allegheny County contains the city of Pittsburgh
Pittsburgh Suburbs/Erie includes the remaining suburban counties in the Pittsburgh metropolitan area
(Beaver, Butler, Armstrong, Westmoreland, Fayette, Washington counties) and the Erie metropolitan
area, and five other counties in Pennsylvania’s far west.
Allegheny County, where the city of Pittsburgh is located, is a separate region in light of the county’s
size, distinct voting patterns, and population decline (down 3 percent since 2000). The Pittsburgh Sub-
urbs/Erie region includes the remaining six counties of the Pittsburgh metropolitan area, only two of
which, Butler and Washington, grew since 2000—4 percent and 1.5 percent respectively. Aside from
these, the other counties in the region all lost population, including Erie County (the Erie metropoli-
tan area) at a modest 6 percent decline and Mercer County (part of the Youngstown, OH metropolitan
area) down 2.8 percent. The remaining
four non-metropolitan counties,
accounting for 14 percent of this
region’s population, showed popula-
tion declines ranging from -1.9 percent
for Crawford to -6 percent for Warren.
As will be seen later, not only is the
Pittsburgh Suburbs/Erie region largely
characterized by population decline,
but it has also shown similar voting
trends through this decade.
North and Central PA includes the
remaining counties in the state, includ-
ing the Altoona metropolitan area, and
the Johnstown, State College, and
Williamsport metropolitan areas and
an additional 24 non-metropolitan
counties (Map 2).
North andCentral PA
PittsburghSuburbs/Erie
AlleghenyCo. Harrisburg-
York-Lancaster
Allentown-Scranton-Reading
PhiladelphiaSuburbs
Philadelphia
6%+ Growth
Up to 6% Growth
Up to 4% Decline
4%+ Decline
Pennsylvania Population Growth by County, 2000-07
Source: Author's analysis of US Census estimates
Map 2. Pennsylvania Population Growth by County, 2000–2007
Source: Authors’ analysis of US Census estimates
Compared with the other regions, North and Central PA is far less metropolitan in character, with 65
percent of its population residing in non-metropolitan counties and the remaining 35 percent living in
the four small metros of Johnstown, Altoona, State College, and Williamsport, each with populations
between 100,000 and 150,000. This portion of the state can be characterized by population decline,
which is exhibited by three metros and 18 of its non-metropolitan counties. One distinct departure from
this pattern is the State College metro area, home of Penn State University, which grew by 6 percent
since 2000. Modest growth is also present in four non-metropolitan counties to its east. And little For-
est County in the northwest part of this region grew from 4,900 to 6,900 people so far this decade.
As our voting analysis shows, however, this part of Pennsylvania has shown consistent voting patterns
in recent elections.
Findings
A. Pennsylvania is becoming a demographic “bridge” between Midwesternstates like Ohio and other Northeastern states like New Jersey, as its newgrowth is tied to urban coastal regions.It is fair to say that Pennsylvania has struggled and survived through a few rough decades. A state with
a proud industrial past, it ranked third in population size, after New York and California, as late as 1970.
Yet its subsequent deindustrialization led to a growth rate of less than 1 percent over the next 20 years
when two other states surpassed it in population size. By 2000, it ranked sixth on that score. And
its clout in the all important Electoral College was reduced from as many as 32 votes in 1960 to just
21 today.
Yet, Pennsylvania’s growth picked up modestly though the 1990s though there was a continued decline
in manufacturing jobs.2 Since 2000, the state’s growth has been a bit over 1 percent. At the same time,
several metropolitan areas and counties in its eastern and south central regions registered some of
the fastest growth rates in the nation’s Northeast region.
New domestic migration trends are also encouraging. Over the 1990s, Pennsylvania lost a net of
276,000 migrants to other states, the nation’s sixth largest migration loss. Yet thus far this decade, it
lost only 37, 000 migrants compared with neighboring Ohio which lost 294,000.3
A Demographic BridgeIn many respects , Pennsylvania represents a demographic “bridge” between stagnating Midwest
states like Ohio and neighboring states like New Jersey and Maryland—states that are more diverse both
economically and demographically.
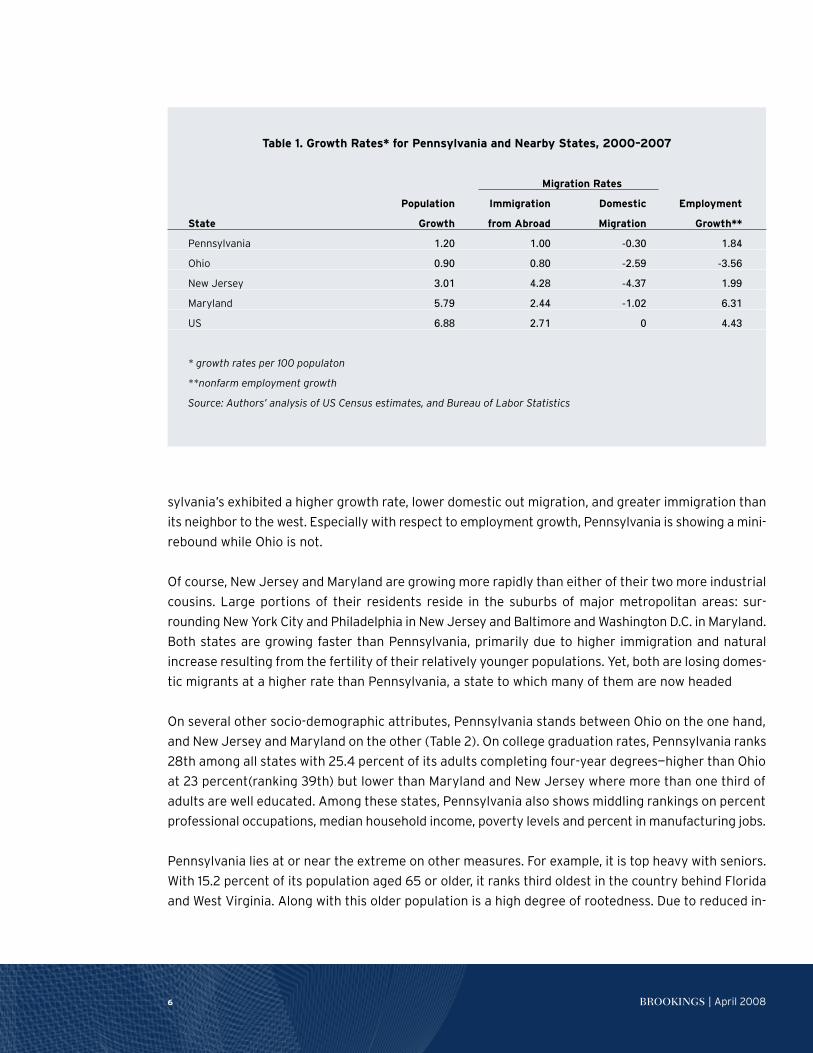
Table 1 compares Pennsylvania with neighboring states, New Jersey, Maryland, and Ohio. While many
observers tend to group Pennsylvania with Ohio, a so-called “Rust Belt” state, so far this decade, Penn-
5BLUEPRINT FOR AMERICAN PROSPERITY
sylvania’s exhibited a higher growth rate, lower domestic out migration, and greater immigration than
its neighbor to the west. Especially with respect to employment growth, Pennsylvania is showing a mini-
rebound while Ohio is not.
Of course, New Jersey and Maryland are growing more rapidly than either of their two more industrial
cousins. Large portions of their residents reside in the suburbs of major metropolitan areas: sur-
rounding New York City and Philadelphia in New Jersey and Baltimore and Washington D.C. in Maryland.
Both states are growing faster than Pennsylvania, primarily due to higher immigration and natural
increase resulting from the fertility of their relatively younger populations. Yet, both are losing domes-
tic migrants at a higher rate than Pennsylvania, a state to which many of them are now headed
On several other socio-demographic attributes, Pennsylvania stands between Ohio on the one hand,
and New Jersey and Maryland on the other (Table 2). On college graduation rates, Pennsylvania ranks
28th among all states with 25.4 percent of its adults completing four-year degrees—higher than Ohio
at 23 percent(ranking 39th) but lower than Maryland and New Jersey where more than one third of
adults are well educated. Among these states, Pennsylvania also shows middling rankings on percent
professional occupations, median household income, poverty levels and percent in manufacturing jobs.
Pennsylvania lies at or near the extreme on other measures. For example, it is top heavy with seniors.
With 15.2 percent of its population aged 65 or older, it ranks third oldest in the country behind Florida
and West Virginia. Along with this older population is a high degree of rootedness. Due to reduced in-
6 BROOKINGS | April 2008
Table 1. Growth Rates* for Pennsylvania and Nearby States, 2000–2007
Migration Rates
Population Immigration Domestic Employment
State Growth from Abroad Migration Growth**
Pennsylvania 1.20 1.00 -0.30 1.84
Ohio 0.90 0.80 -2.59 -3.56
New Jersey 3.01 4.28 -4.37 1.99
Maryland 5.79 2.44 -1.02 6.31
US 6.88 2.71 0 4.43
* growth rates per 100 populaton
**nonfarm employment growth
Source: Authors’ analysis of US Census estimates, and Bureau of Labor Statistics
migration for several decades, four out of five Pennsylvanians were born in the state, compared with
one out of two in Maryland, one in five in Nevada.
Also significant for Pennsylvania is its largely white population. Like many northern and Midwestern
states, Pennsylvania has not until recently participated in the new immigration surge, and its primary
minority population consists of blacks in its major cities. However, there are signs that this is chang-
ing. Between 1990 and 2006, Pennsylvania’s largely Puerto Rican Hispanic population increased by 125
percent, a pattern likely to continue.
7BLUEPRINT FOR AMERICAN PROSPERITY
Table 2. Demographic and Economic Indicators for US, Pennsylvania, and Nearby States, 2006
Indicator US Pennsylvania Ohio New Jersey Maryland
State Rank
Demographic Indicators
% White 66.2 82.0 82.8 62.3 58.3
State Rank 19 16 39 46
% Age 65+ 12.4 15.2 13.3 12.9 11.6
State Rank 3 15 23 41
% Born in Same State 67.4 79.6 77.9 65.6 54.4
State Rank 4 5 26 39
Economic Indicators
% College Grads* 27.0 25.4 23.0 33.4 35.1
State Rank 28 39 6 3
%Professionals** 20.2 21.0 19.3 22.6 25.7
State Rank 16 28 8 2
% Manufacturing** 11.6 13.4 17.0 9.7 5.4
State Rank 17 4 34 44
Median HH Income 48,451 46,259 44,532 64,470 65,144
State Rank 26 33 2 1
% Persons in Poverty 13.3 12.1 13.3 8.7 7.8
State Rank 30 21 48 51
* growth rates per 100 populaton
**nonfarm employment growth
Source: Authors’ analysis of US Census estimates, and Bureau of Labor Statistics
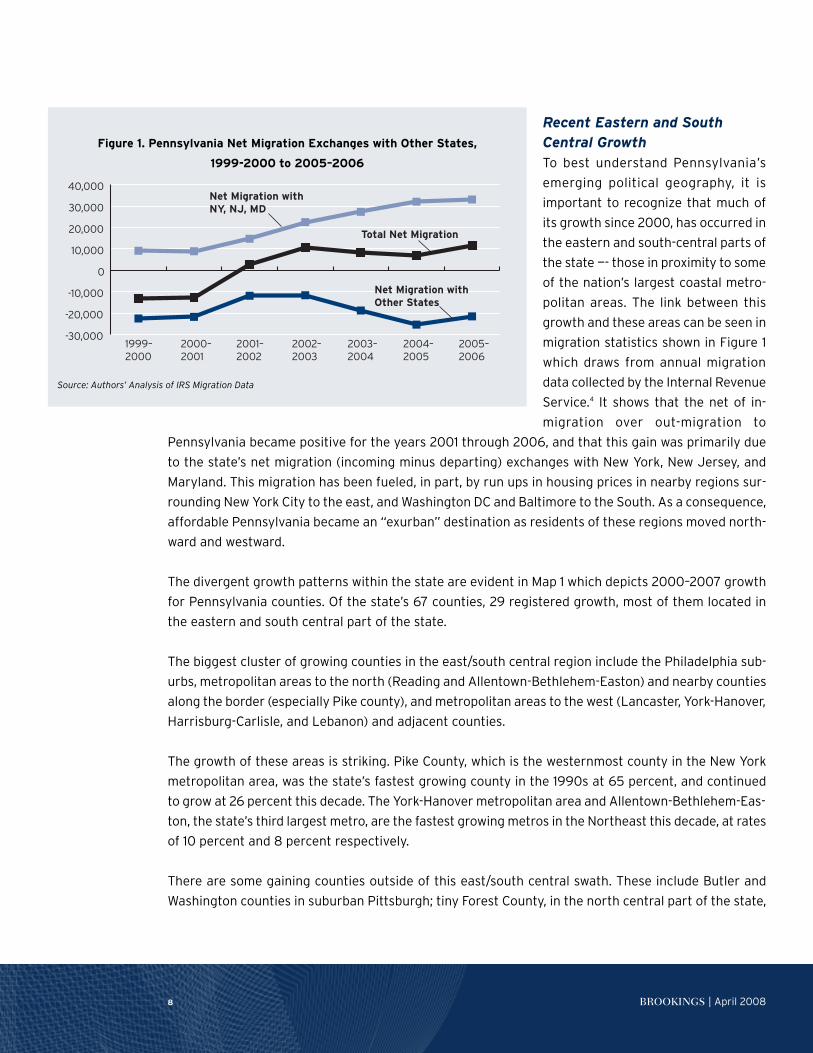
Recent Eastern and South Central GrowthTo best understand Pennsylvania’s
emerging political geography, it is
important to recognize that much of
its growth since 2000, has occurred in
the eastern and south-central parts of
the state —- those in proximity to some
of the nation’s largest coastal metro-
politan areas. The link between this
growth and these areas can be seen in
migration statistics shown in Figure 1
which draws from annual migration
data collected by the Internal Revenue
Service.4 It shows that the net of in-
migration over out-migration to
Pennsylvania became positive for the years 2001 through 2006, and that this gain was primarily due
to the state’s net migration (incoming minus departing) exchanges with New York, New Jersey, and
Maryland. This migration has been fueled, in part, by run ups in housing prices in nearby regions sur-
rounding New York City to the east, and Washington DC and Baltimore to the South. As a consequence,
affordable Pennsylvania became an “exurban” destination as residents of these regions moved north-
ward and westward.
The divergent growth patterns within the state are evident in Map 1 which depicts 2000–2007 growth
for Pennsylvania counties. Of the state’s 67 counties, 29 registered growth, most of them located in
the eastern and south central part of the state.
The biggest cluster of growing counties in the east/south central region include the Philadelphia sub-
urbs, metropolitan areas to the north (Reading and Allentown-Bethlehem-Easton) and nearby counties
along the border (especially Pike county), and metropolitan areas to the west (Lancaster, York-Hanover,
Harrisburg-Carlisle, and Lebanon) and adjacent counties.
The growth of these areas is striking. Pike County, which is the westernmost county in the New York
metropolitan area, was the state’s fastest growing county in the 1990s at 65 percent, and continued
to grow at 26 percent this decade. The York-Hanover metropolitan area and Allentown-Bethlehem-Eas-
ton, the state’s third largest metro, are the fastest growing metros in the Northeast this decade, at rates
of 10 percent and 8 percent respectively.
There are some gaining counties outside of this east/south central swath. These include Butler and
Washington counties in suburban Pittsburgh; tiny Forest County, in the north central part of the state,
8 BROOKINGS | April 2008
-30,000
-20,000
-10,000
0
10,000
20,000
30,000
40,000
Net Migration withOther States
Net Migration withNY, NJ, MD
Total Net Migration
2005–2006
2004–2005
2003–2004
2002–2003
2001–2002
2000–2001
1999–2000
-30000
-20000
-10000
0
10000
20000
30000
40000Net Migration with Other States
Net Migration with NY, NJ, MD
Total Net Migration
2005-62004-52003-42002-32001-22000-11999-2000
Figure 1. Pennsylvania Net Migration Exchanges with Other States,
1999-2000 to 2005–2006
Source: Authors’ Analysis of IRS Migration Data
and centrally located Centre County, home of
the State College metro area and Penn State
University.
Yet, any assessment of recent political demo-
graphic change in Pennsylvania must
emphasize the growing “Northeast Corridor”
part of the state which is producing gains in its
eastern and south central regions. This stands
in contrast with most of the western part of the
state which, with exceptions like the State
College metropolitan area, continues to expe-
rience out migration and population decline.
Regions in this AnalysisOf the seven regions, the three growing
regions are the Philadelphia suburbs,
Allentown-Scranton-Reading, and Harrisburg-
York-Lancaster. Together they comprise 49
percent of the state’s population, but are
responsible for 100 percent of its growth (Fig-
ures 2 and 3). They range in growth from 4 to
7 percent this decade whereas the other four
regions showed declines ranging of 1.5 percent
for the Pittsburgh suburbs-Erie and North and
Central PA to greater than 4 percent for
Philadelphia and Allegheny County
The three growing regions also are beginning
to increase their racial diversity in a state that
does not have very much. They accounted for
75 percent of the state’s Hispanic growth this
decade. And Hispanics contributed one third of the total growth in these areas in this decade. While
Hispanics comprise only 4.2 percent of the state’s population, they comprise 14 percent of the popu-
lation in Lehigh County, where the city of Allentown is located, and 10 percent in Berks County where
the city of Reading is located.
Each of the four non-growing regions of the state lost white and black populations since the beginning
of this decade. The small contributions to growth made by Hispanics, Asians and other races in these
areas have helped reduce their overall population declines.
Figure 2. Share of 2007 Population in Pennsylvania Regions
Source: Authors’ analysis of US Census Estimates
-6.0
-4.0
-2.0
0.0
2.0
4.0
6.0
8.0
North and Central PA.Pittsburgh Suburbs-ErieAllegheny Co.Harrisburg-York-LancasterAllentown-Scranton-ReadingPhiladelphia suburbsPhiladelphia
-6.0
-4.0
-2.0
0.0
2.0
4.0
6.0
8.0
North andCentral PA.
PittsburghSuburbs-
Erie
AlleghenyCo.
Harrisburg-York-
Lancaster
Allentown-Scranton-Reading
PhiladelphiaSuburbs
Philadelphia
-1.5-1.5
-4.7
6.65.3
4.3
-4.2
Figure 3. 2000–2007 Population Growth in Pennsylvania Regions
Source: Authors’ analysis of US Census Estimates
In sum, Pennsylvania’s growth engines—Philadelphia’s suburbs and the largely metropolitan regions to
their north and west—stand in sharp contrast with the still stagnating central and western parts of the
state. The shifting demographics in the former areas are affecting their eligible voting populations in
ways that are discussed below.
B. Eligible voter populations indicate a state in transition, where minorities,especially Hispanics, and white college graduates are increasingly important,but where white working class voters continue to play a central role.More relevant to the 2008 election are the demographics of the eligible voter populations in different
parts of the Pennsylvania Eligible voters are Pennsylvanians that are both age eligible (18+) and U.S.
citizens. The data presented here are drawn from the 2006 American Community Survey which is the
most reliable recent data source for the geographic areas covered.
We first focus on four key demographic segments defined by race, age, and education that are of high
political interest this campaign season: minorities, white college graduates aged 18–64, white working
class (non-college graduates) aged 18–64 and white seniors (65 and over). The latter two groups are
declining but still large and important parts of the Pennsylvania electorate, while the former two
groups are growing and increasingly important parts of that electorate.
For Pennsylvania as a whole, almost half (49 percent) of the electorate is white working class of work-
ing age, 18 percent are white seniors, another 18 percent are white college graduates of working age and
10 BROOKINGS | April 2008
0%
10%
20%
30%
40%
50%
60%
70%
80%
90%
100% White Working AgeNon College
White Working AgeCollege Grad
White 65+
Minorities
North andCentral PA.
PittsburghSuburbs-Erie
AlleghenyCo.
Harrisburg-York-
Lancaster
Allentown-Scranton-Reading
PhiladelphiaSuburbs
Philadelphia
6258
425655
41
22
1316
23
171629
11
2120
20182017
10
4514
91013
55
0%
10%
20%
30%
40%
50%
60%
70%
80%
90%
100%White Working Age Non College
White Working Age College Grad
White 65+
Minorities
North and Central PA.Pittsburgh Suburbs-ErieAllegheny Co.Harrisburg-York-LancasterAllentown-Scranton-ReadingPhiladelphia suburbsPhiladelphia
Figure 4. Eligible Voters by Key Demographic Segments, 2006
Source: Authors’ analysis of 2006 American Community Survey
14 percent are minorities. However, there is great variation across the state in the size of these key seg-
ments in 2006, as well as in how their numbers have changed since 2000 (See Figures 4 and 5).
White working class voters make up the largest share of the electorate in the Pittsburgh suburbs/Erie
(58 percent) and the North/Central (62 percent) parts of the state. But it is interesting to note that two
of the three growth regions of Pennsylvania, the Allentown and Harrisburg areas, also have high pro-
portions of these voters (55 and 56 percent, respectively). The lowest percentage of white working
class/working age voters is in Philadelphia, with just 24 percent.
When it comes to changes in white working class voters, only the Allentown and Harrisburg areas show
gains since 2000. Every other region shows declines since 2000, ranging from a modest drop in the
Philadelphia suburbs, to substantial declines in the city of Philadelphia and Allegheny counties.
The largest shares of white seniors—20 percent or more of the electorate—are found in the three west-
ern and central Pennsylvania regions along with the rapidly growing Allentown-Scranton-Reading
region. Slightly smaller shares are found in the growing Harrisburg and Philadelphia suburbs regions,
and a far smaller share in the city of Philadelphia. It is significant that only the Harrisburg region is
showing a noticeable gain in white seniors, perhaps reflecting an influx of retirees.
White working age college grads, in contrast, are gaining in all seven regions, but show the largest gains
in the Philadelphia suburbs, where they also comprise a substantial share (29 percent) of the electorate.
Large gains are also evident in the Pittsburgh suburbs/Erie region as well as the Allentown-Scranton-
1 1BLUEPRINT FOR AMERICAN PROSPERITY
-60000
-40000
-20000
0
20000
40000
60000
80000White Working Age Non College
White Working Age College Grad
White 65+
Minorities
North and Central Pa.Pittsburgh Suburbs-ErieAllegheny Co.Harrisburg-York-LancasterAllentown-Scranton-ReadingPhiladelphia SurburbsPhiladelphia
-60,000
-40,000
-20,000
0
20,000
40,000
60,000
80,000 White Working AgeNon College
White Working AgeCollege Grad
White 65+
Minorities
North andCentral Pa.
PittsburghSuburbs-Erie
AlleghenyCo.
Harrisburg-York-
Lancaster
Allentown-Scranton-Reading
PhiladelphiaSuburbs
Philadelphia
Figure 5. 2000-2006 Change in Eligible Voters for Key Demographic Segments
Source: Authors’ analysis of 2000 US Decennial Census and 2006 American Community Survey
Reading and Harrisburg regions. Allegheny County, which already has a large share of this group, also
shows gains. In fact, it is only the city of Philadelphia, where white college grad workers hold a small
share (11 percent) of the electorate, that this group’s gains since 2000 are minimal.
The final key segment, which is gaining in all regions, is minority voters, defined as eligible voters who
are Hispanic, Black, Asian and races other than white. (Table 3 shows the race-ethnic composition of
eligible voters in each region)
While the city of Philadelphia has the largest minority electorate share (55 percent) of all regions, it
also shows the smallest numeric increase in this group since 2000. The greatest minority increases
are in the three fastest growing regions of the state—the Philadelphia suburbs and the Allentown-Scran-
ton-Reading and Harrisburg areas. In these three regions, minorities account for 52 percent, 58 percent
and 32 percent of total gains in eligible voters since 2000. These gains were dominated by blacks and
Asians in the Philadelphia suburbs, Hispanics in the Allentown-Scranton-Reading region, and blacks and
Hispanics in the Harrisburg region.
Allegheny County’s electorate has a higher share of minorities (14 percent) than any of these three
regions, but has shown only modest gains since 2000. The remaining western and central regions are
more than 95 percent white.
These data indicate that the state’s three fast growing regions are distinct in the nature of their gains.
The Philadelphia suburbs, already an upscale region, are attracting primarily white college educated
12 BROOKINGS | April 2008
Table 3. Eligible Voters by Race-Ethnic Categories for Regions of State
Share in Race-Ethnic Group
Region White* Black* Asian* Other* Hispanic
State Total 85.8 9.2 1.5 0.7 2.8
Philadelphia 44.6 43.2 3.5 1.3 7.4
Philadelphia suburbs 86.7 8.0 2.8 0.7 1.8
Allentown-Scranton-Reading 90.5 3.1 0.8 0.6 5.0
Harrisburg-York-Lancaster 90.5 4.4 1.2 0.7 3.2
Allegheny Co. 85.5 11.3 1.3 0.9 0.9
Pittsburgh Suburbs-Erie 95.1 3.1 0.3 0.7 0.8
North and Central PA. 95.8 2.3 0.6 0.5 0.8
Source: Authors’ analysis of US Census 2006 American Community Survey
* non Hispanic members of race group
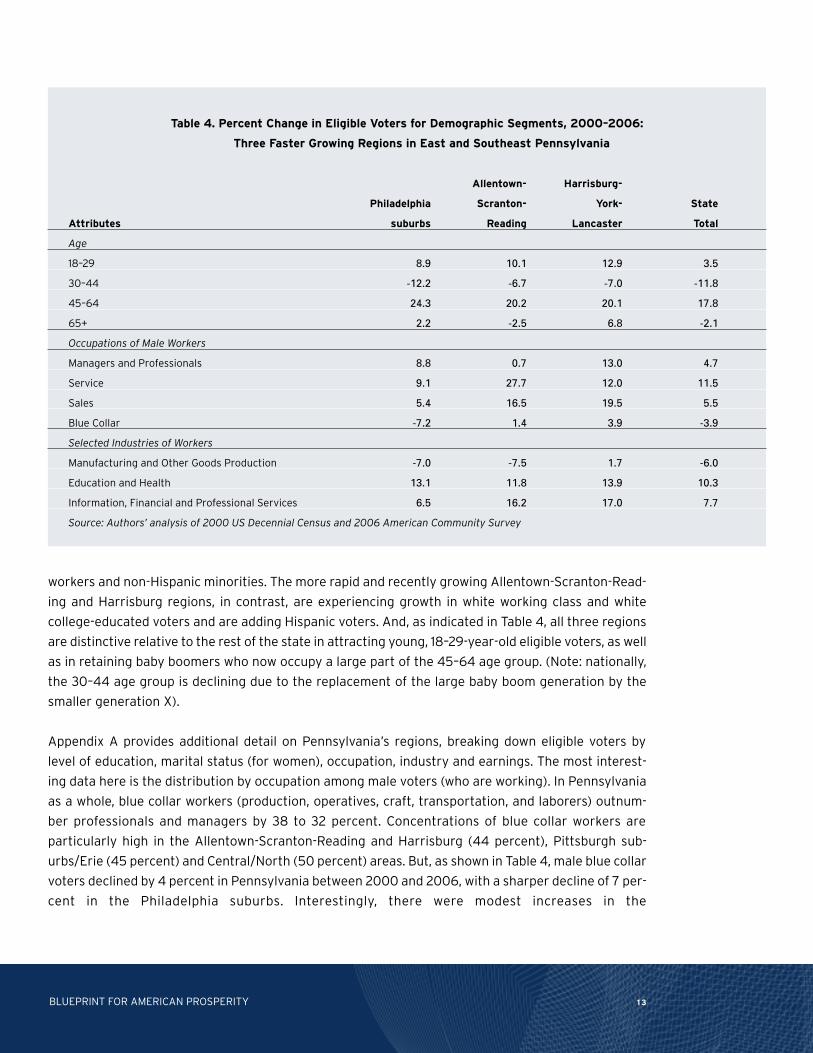
workers and non-Hispanic minorities. The more rapid and recently growing Allentown-Scranton-Read-
ing and Harrisburg regions, in contrast, are experiencing growth in white working class and white
college-educated voters and are adding Hispanic voters. And, as indicated in Table 4, all three regions
are distinctive relative to the rest of the state in attracting young, 18–29-year-old eligible voters, as well
as in retaining baby boomers who now occupy a large part of the 45–64 age group. (Note: nationally,
the 30–44 age group is declining due to the replacement of the large baby boom generation by the
smaller generation X).
Appendix A provides additional detail on Pennsylvania’s regions, breaking down eligible voters by
level of education, marital status (for women), occupation, industry and earnings. The most interest-
ing data here is the distribution by occupation among male voters (who are working). In Pennsylvania
as a whole, blue collar workers (production, operatives, craft, transportation, and laborers) outnum-
ber professionals and managers by 38 to 32 percent. Concentrations of blue collar workers are
particularly high in the Allentown-Scranton-Reading and Harrisburg (44 percent), Pittsburgh sub-
urbs/Erie (45 percent) and Central/North (50 percent) areas. But, as shown in Table 4, male blue collar
voters declined by 4 percent in Pennsylvania between 2000 and 2006, with a sharper decline of 7 per-
cent in the Philadelphia suburbs. Interestingly, there were modest increases in the
13BLUEPRINT FOR AMERICAN PROSPERITY
Table 4. Percent Change in Eligible Voters for Demographic Segments, 2000–2006:
Three Faster Growing Regions in East and Southeast Pennsylvania
Allentown- Harrisburg-
Philadelphia Scranton- York- State
Attributes suburbs Reading Lancaster Total
Age
18–29 8.9 10.1 12.9 3.5
30–44 -12.2 -6.7 -7.0 -11.8
45–64 24.3 20.2 20.1 17.8
65+ 2.2 -2.5 6.8 -2.1
Occupations of Male Workers
Managers and Professionals 8.8 0.7 13.0 4.7
Service 9.1 27.7 12.0 11.5
Sales 5.4 16.5 19.5 5.5
Blue Collar -7.2 1.4 3.9 -3.9
Selected Industries of Workers
Manufacturing and Other Goods Production -7.0 -7.5 1.7 -6.0
Education and Health 13.1 11.8 13.9 10.3
Information, Financial and Professional Services 6.5 16.2 17.0 7.7
Source: Authors’ analysis of 2000 US Decennial Census and 2006 American Community Survey
Allentown-Scranton-Reading and Harrisburg regions. However, in both regions, these modest increases
were dwarfed by strong growth in male voters who have sales or service jobs.
Professionals and managers show a different pattern. They are most heavily concentrated in Pittsburgh
(38 percent) and, especially, the Philadelphia suburbs (43 percent). The Philadelphia suburbs also had
faster than average growth in this group between 2000 and 2006, as did the Harrisburg area. The Allen-
town-Scranton-Reading region, however, had weaker than average growth.
The data on distribution by industry of Pennsylvania’s working voters underscore how much the state
has changed. Currently, there is a slightly larger proportion of these voters in education and health serv-
ices alone (24 percent) than in manufacturing, mining, construction and all other goods production (22
percent). By region, manufacturing and goods production is currently strongest in the Allentown-Scran-
ton-Reading and Harrisburg, Pittsburgh suburbs/Erie and Central/North regions—the same regions that
have the highest concentrations of blue collar workers. But even in these areas, workers in manufacturing
and goods production are significantly outnumbered by workers in education/health and informa-
tion/financial/professional services. Pittsburgh and the Philadelphia suburbs have the lowest
concentrations of manufacturing and goods production and have the highest proportions of working vot-
ers in education/health and information/financial/professional services (53 and 50 percent, respectively).
As Table 4 shows, voters in manufacturing and goods production have continued to decline across Penn-
sylvania between 2000 and 2006, with the Philadelphia suburbs and the Allentown-Scranton-Reading
region registering faster than average declines; the Harrisburg region in contrast registered a very slight
increase. But all three of the fast-growing regions showed strong growth in education and health serv-
ices and the Allentown-Scranton-Reading and Harrisburg regions showed double the statewide average
in growth in information-financial-professional services. These changes in the occupations and indus-
tries of Pennsylvania’s voters, especially in the fast-growing regions, indicate that stereotypes of these
voters, especially of white working class voters toiling in manufacturing, should be discarded.
C. Recent Democratic victories in Pennsylvania have featured strong supportfrom groups like minorities, single women and the young, but have also bene-fited from relatively strong support among the white working class, especiallyamong its upwardly mobile segment that has some college education. So far we have documented the basic demographic and geographic shifts that are reshaping Penn-
sylvania and sketched a brief portrait of Pennsylvania’s electorate. Now we turn to how Pennsylvanians
have been voting in recent elections which, as we shall see, is intimately bound up with these changes.
The results and analysis not only illuminate how Pennsylvania arrived at its current political coloration
but provide some hints about how Pennsylvania’s politics might change in the future as demographic
and geographic shifts continue.
14 BROOKINGS | April 2008
Table 5 displays some basic exit poll data from the 2004 Presidential election and 2006 Senate elec-
tion in Pennsylvania. In 2004, Pennsylvania voted Democratic in the Presidential election for the fourth
straight time since 1992, albeit by a narrow 51-48 margin. The basic building blocks of Kerry’s victory
can be discerned from the data in the table. He received 45 percent of the white vote but was able to
make up his nine point deficit there by carrying 84 percent of the black vote and 72 percent of the His-
panic vote. He narrowly lost men by three points, but carried women by eight points; the same gender
gap can be seen when comparing white men and white women, which he lost by 15 and three points,
respectively. And Kerry split married women almost evenly but carried single women by 20 points.
By education, Kerry did particularly well among high school dropouts, but also carried postgraduates
and, interestingly, those with some college. In fact, he did a little better among those with some col-
lege than among postgraduates–quite different from the national pattern. Kerry also did exceptionally
well among young (18-29 year old) Pennsylvanians, carrying them by an impressive 21 points, far bet-
ter than he did among 30-39 year olds and seniors, the other two age groups he carried. The exit poll
also indicates he received overwhelming support in cities of 50,000 or more, while losing heavily in
rural areas. In the suburbs, however, he lost to Bush by five points.
In the 2006 Senate election, Democrat Bob Casey beat incumbent Republican Rick Santorum by 59-
41, a significantly larger margin than Kerry achieved in 2004. Reflecting this, Casey’s coalition was much
more broadly based than Kerry’s. He carried white voters by 10 points and even carried white men by
six points. He also carried married women by 16 points and voters at all levels of education. He did par-
ticularly well among voters with a postgraduate education, receiving 70 percent of their votes.
Like Kerry in 2004, he also received overwhelming support from young voters, carrying them by 36
points. But he also carried every other age group. And unlike Kerry, he did carry the suburbs (by 14
points), adding the support of these voters to his big margins in urban areas.
Digging a little deeper into the exit poll data, it’s instructive to focus on the white working class vote—
the subject of much debate and discussion in the 2008 election season. In 2004, Pennsylvania white
working class voters (defined here as whites without a four year college degree) supported Bush over
Kerry by 10 points. This compares to a Kerry deficit of 23 points nationally among these voters. So Kerry
actually did quite a bit better among white working class voters in Pennsylvania than he did nationally.
Moreover, Kerry only ran a slight deficit among whites with some college—the upwardly mobile portion
of the white working class, more likely to have white collar or skilled blue collar jobs—losing them by just
three points. This compares to a 25 point thumping Kerry received among these voters nationwide.
Interestingly, Democrats’ relatively strong performance among working class whites does not provide
much explanatory power for understanding the differences in outcome between 2004 and 1988, the
last time the Republicans carried the state. According to the 1988 and 2004 exit polls, Democrats ran
15BLUEPRINT FOR AMERICAN PROSPERITY
16 BROOKINGS | April 2008
Table 5. Voting by Selected Demographic Groups, 2004 and 2006
2004 President 2006 Senate
Group Democrat Republican Dem-Rep Democrat Republican Dem-Rep
White 45 54 -9 55 45 10
Black 84 16 68 90 10 80
Hispanic 72 28 44 77 23 54
Men 48 51 -3 57 43 14
Women 54 46 8 61 39 22
White Men 42 57 -15 53 47 6
White Women 48 51 -3 58 42 16
Single Women 60 40 20 69 31 38
Married Women 49 50 -1 58 42 16
HS Dropout 57 43 14 68 32 36
HS Graduate 49 51 -2 52 48 4
Some College 54 46 9 60 40 20
College Grad 46 53 -7 54 46 8
Postgraduate 52 48 4 70 30 40
18–29 60 39 21 68 32 36
30–39 53 46 7 60 40 20
40–49 46 53 -7 57 43 14
50–64 46 54 -8 59 41 18
65+ 52 48 4 56 44 12
City over 500,000 81 19 62 85 15 70
City 50,000–500,000 72 28 44 97 3 94
Suburbs 47 52 -5 57 43 14
City 10,000–50,000 52 48 4 53 47 6
Rural 27 73 -46 45 55 -10
Source: Authors’ analysis of 2004 and 2006 Pennsylvania exit polls
roughly the same among this group in both elections. But the other side of the demographic divide—
the white college-educated—does help explain this change. White college-educated voters increased
their margin of support for the Democrats by seven points across the two elections. Moreover, accord-
ing to Census voter supplement data, white college-educated voters increased their share of voters
across the two elections by 16 points, while the share of white working class voters declined by 17 points.
An intriguing wrinkle in the stability of white working support across the two elections is the differ-
ence between whites with some college and whites with a high school diploma or less. The latter reduced
their support for the Democrats by 10 points, while the former increased their support by 16 points.
The net was stability but clearly the less and more-skilled segments of the white working class in Penn-
sylvania are moving in different directions. And it is the more-skilled segment that is increasing its share
of voters (up 10 points since the 1988 election).
The exit polls also suggest that the overall stability of the white working class vote masks different
regional trends over time. Here we have to use the exit poll regions which are: Philadelphia; Philadel-
phia suburbs; Northeast (roughly equivalent to our Allentown-Scranton-Reading region); Central and
Northern Tier (roughly equivalent to combining our Harrisburg-Lancaster-York and Central/Northern
regions); and Pittsburgh Area and West (roughly equivalent to combining our Pittsburgh and Pittsburgh
suburbs-Erie areas). These data show white working support for the Democrats increasing in Philadel-
phia, the Philadelphia suburbs and the Northeast (Allentown area) while declining in the
Central/Northern Tier and Pittsburgh Area/West.
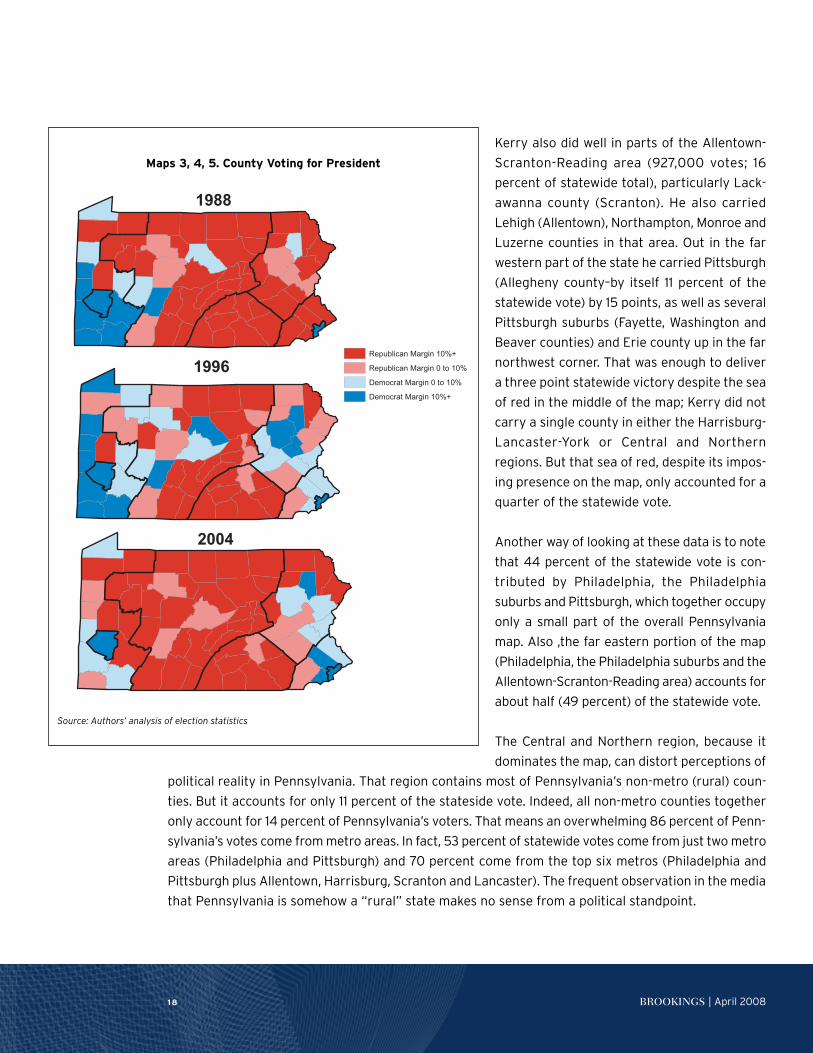
D. Political shifts in Pennsylvania since 1988 have seen the growing easternpart of the state swing toward the Democrats, producing four straight presiden-tial victories for that party. How did these patterns of support play out geographically? Maps 3, 4, and 5 provide this information
for 2004, 1996 and 1988 by color-coding each county by its margin for the victorious presidential can-
didate (deep blue for a Democratic victory of 10 points or more, light blue for a Democratic victory of
under 10 points, deep red for a Republican victory of 10 points or more, light red for a Republican vic-
tory of under 10 points). In addition, our seven regions are shown on each map by heavy black lines.
Looking at the 2004 map, it is striking how much of the map is colored red. How did Kerry put together
a victorious coalition when so few counties are colored blue? The answer lies in the distribution of vot-
ers. Philadelphia, which is just one county on the map, and a small one, had 674,000 voters–that’s 12
percent of the statewide total–and they went for Kerry by 61 points (see Table 6). Then right next to
Philadelphia on the lower far right of the map are the four counties of the Philadelphia suburbs. These
counties cast 1,234,000 votes (21 percent of the statewide total) and went for Kerry by seven points.
Between Philadelphia and its suburbs, that’s a third of the statewide vote fairly to very strong for Kerry.
17BLUEPRINT FOR AMERICAN PROSPERITY
Kerry also did well in parts of the Allentown-
Scranton-Reading area (927,000 votes; 16
percent of statewide total), particularly Lack-
awanna county (Scranton). He also carried
Lehigh (Allentown), Northampton, Monroe and
Luzerne counties in that area. Out in the far
western part of the state he carried Pittsburgh
(Allegheny county–by itself 11 percent of the
statewide vote) by 15 points, as well as several
Pittsburgh suburbs (Fayette, Washington and
Beaver counties) and Erie county up in the far
northwest corner. That was enough to deliver
a three point statewide victory despite the sea
of red in the middle of the map; Kerry did not
carry a single county in either the Harrisburg-
Lancaster-York or Central and Northern
regions. But that sea of red, despite its impos-
ing presence on the map, only accounted for a
quarter of the statewide vote.
Another way of looking at these data is to note
that 44 percent of the statewide vote is con-
tributed by Philadelphia, the Philadelphia
suburbs and Pittsburgh, which together occupy
only a small part of the overall Pennsylvania
map. Also ,the far eastern portion of the map
(Philadelphia, the Philadelphia suburbs and the
Allentown-Scranton-Reading area) accounts for
about half (49 percent) of the statewide vote.
The Central and Northern region, because it
dominates the map, can distort perceptions of
political reality in Pennsylvania. That region contains most of Pennsylvania’s non-metro (rural) coun-
ties. But it accounts for only 11 percent of the stateside vote. Indeed, all non-metro counties together
only account for 14 percent of Pennsylvania’s voters. That means an overwhelming 86 percent of Penn-
sylvania’s votes come from metro areas. In fact, 53 percent of statewide votes come from just two metro
areas (Philadelphia and Pittsburgh) and 70 percent come from the top six metros (Philadelphia and
Pittsburgh plus Allentown, Harrisburg, Scranton and Lancaster). The frequent observation in the media
that Pennsylvania is somehow a “rural” state makes no sense from a political standpoint.
18 BROOKINGS | April 2008
County Voting for President
1988
1996
2004
Republican Margin 10%+
Republican Margin 0 to 10%
Democrat Margin 0 to 10%
Democrat Margin 10%+
Source: Author's analysis of election statistics
Maps 3, 4, 5. County Voting for President
Source: Authors’ analysis of election statistics
Turning to the 1988 map–the last time a Republican presidential candidate carried the state–the key
differences are dominance by the Republicans in the Philadelphia suburbs, stronger performance in
the Allentown-Scranton-Reading area (Dukakis only carried Lackawanna county in that region), but
weaker performance in the Pittsburgh suburbs-Erie area (Democrats carried six counties in that region
by 10 points or more in that year, compared to none in 2004). That netted out to a two point Republi-
can victory in 1988.
In Bill Clinton’s second victory (by nine points) in Pennsylvania in 1996, the key shifts from 1988 were
the ending of Republican dominance of the Philadelphia suburbs and much stronger performance in the
Allentown-Scranton-Reading area. The comparison of this map to the 2004 map is instructive. Though
Kerry’s margin was less than Clinton’s (three vs. nine points), he retained Democratic dominance of the
Philadelphia suburbs plus much of the improved performance in the Allentown-Scranton-Reading area.
But, interestingly, the map indicates a marked deterioration of Democratic performance in the Pittsburgh
suburbs-Erie region; in fact, Kerry did more poorly than Dukakis did when he lost the state in 1988.
The fact that Democratic performance could deteriorate in the west, relative to 1988, but, through
improved performance in the east, still carry the state in 2004 underscores where voting power now
resides in Pennsylvania. It is in the east, the part of Pennsylvania that is actually growing, not the west,
where population is declining, nor certainly the center, which didn’t have very many voters to begin
with and is also now declining.
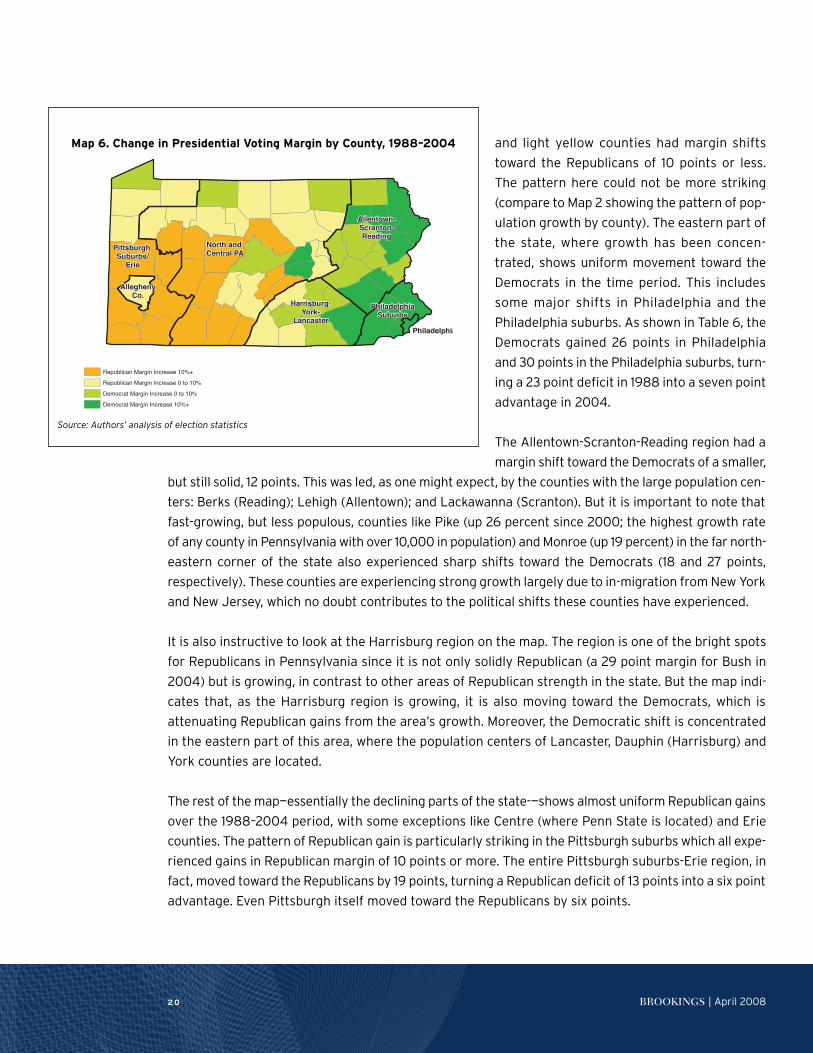
Map 6 provides a visual representation of where political shifts took place from 1988, the last Repub-
lican Presidential statewide victory, to 2004. Counties that are dark green had margin shifts toward
the Democrats of 10 points or more, light green counties had margin shifts toward the Democrats of
10 points or less, dark yellow counties had margin shifts toward the Republicans of 10 points or more
19BLUEPRINT FOR AMERICAN PROSPERITY
Table 6. Voting Results from Past Elections: Democratic Margins for Regions of the State
Democratic Margins:
Region 1988 President 1996 President 2004 President 2006 Congress 2006 Senate
Philadelphia 35 61 61 66 68
Philadelphia suburbs -23 5 7 9 20
Allentown-Scranton-Reading -13 5 -1 18 16
Harrisburg-York-Lancaster -33 -18 -29 -17 -10
Allegheny Co. 21 15 15 34 30
Pittsburgh Suburbs-Erie 13 10 -6 -2 12
North and Central PA. -15 -6 -24 -8 -2
Source: Authors’ analysis of election returns
and light yellow counties had margin shifts
toward the Republicans of 10 points or less.
The pattern here could not be more striking
(compare to Map 2 showing the pattern of pop-
ulation growth by county). The eastern part of
the state, where growth has been concen-
trated, shows uniform movement toward the
Democrats in the time period. This includes
some major shifts in Philadelphia and the
Philadelphia suburbs. As shown in Table 6, the
Democrats gained 26 points in Philadelphia
and 30 points in the Philadelphia suburbs, turn-
ing a 23 point deficit in 1988 into a seven point
advantage in 2004.
The Allentown-Scranton-Reading region had a
margin shift toward the Democrats of a smaller,
but still solid, 12 points. This was led, as one might expect, by the counties with the large population cen-
ters: Berks (Reading); Lehigh (Allentown); and Lackawanna (Scranton). But it is important to note that
fast-growing, but less populous, counties like Pike (up 26 percent since 2000; the highest growth rate
of any county in Pennsylvania with over 10,000 in population) and Monroe (up 19 percent) in the far north-
eastern corner of the state also experienced sharp shifts toward the Democrats (18 and 27 points,
respectively). These counties are experiencing strong growth largely due to in-migration from New York
and New Jersey, which no doubt contributes to the political shifts these counties have experienced.
It is also instructive to look at the Harrisburg region on the map. The region is one of the bright spots
for Republicans in Pennsylvania since it is not only solidly Republican (a 29 point margin for Bush in
2004) but is growing, in contrast to other areas of Republican strength in the state. But the map indi-
cates that, as the Harrisburg region is growing, it is also moving toward the Democrats, which is
attenuating Republican gains from the area’s growth. Moreover, the Democratic shift is concentrated
in the eastern part of this area, where the population centers of Lancaster, Dauphin (Harrisburg) and
York counties are located.
The rest of the map—essentially the declining parts of the state-—shows almost uniform Republican gains
over the 1988–2004 period, with some exceptions like Centre (where Penn State is located) and Erie
counties. The pattern of Republican gain is particularly striking in the Pittsburgh suburbs which all expe-
rienced gains in Republican margin of 10 points or more. The entire Pittsburgh suburbs-Erie region, in
fact, moved toward the Republicans by 19 points, turning a Republican deficit of 13 points into a six point
advantage. Even Pittsburgh itself moved toward the Republicans by six points.
20 BROOKINGS | April 2008
AlleghenyCo.
PhiladelphiaSuburbs
Harrisburg-York-
Lancaster
North andCentral PA
Allentown-Scranton-Reading
Philadelphia
PittsburghSuburbs/Erie
Republican Margin Increase 10%+
Republican Margin Increase 0 to 10%
Democrat Margin Increase 0 to 10%
Democrat Margin Increase 10%+
Change in Presidential Voting Margin by County, 1988-2004
Source: Author's analysis of election statistics
Map 6. Change in Presidential Voting Margin by County, 1988–2004
Source: Authors’ analysis of election statistics
E. Key trends and groups to watch in 2008 include the white working class, theincreasing number of whites with some college, white college graduates, andHispanics, who have been driving the growth of the minority vote. The shifts discussed above have allowed the Democrats to win four straight Presidential elections in
Pennsylvania. But just barely: in the last two elections the Democrats’ average margin for the Democ-
rats has been just 3 points. Whether the Democrats keep their victory streak alive—and perhaps expand
their margin—or the Republicans stage a comeback will depend greatly on the demographic groups and
trends we have reviewed in this report.
Here are some things to watch out for in the 2008 election.
First, will the white working class maintain its level of support for the GOP? If it does not and moves
toward the Democrats, this could tilt the state from its current purple status to solid blue. Indeed, given
current demographic trends, which are steadily reducing the ranks of white working class voters, the
GOP needs to not just maintain, but increase, its support among these voters to have a reasonable
chance of carrying the state in 2008.
Particularly relevant to the white working class vote is the vote of whites with some college, the
upwardly mobile portion of the white working class. These voters have been moving toward the Democ-
rats, even as their ranks have been increasing (in contrast to the rest of the white working class). If
that trend continues in 2008, the GOP’s hold on the white working class could weaken decisively.
Second, will white college-educated voters, who are steadily increasing their share of the electorate,
continue their movement toward the Democrats? If so, that would make a Democratic victory in 2008
likely and a GOP victory very difficult to engineer.
Third, will minorities, particularly Hispanics whose share of voters is rapidly growing (albeit from a small
base) turn out for the Democrats? Given their very high levels of support for the Democrats in the 2004
and 2006 elections, the greater their turnout, the better for the Democrats. Ditto for single women
and young voters, who have also been recording very high support levels for the Democrats.
In terms of regions, the fast-growing Allentown-Scranton-Reading area, where every county has trended
Democratic since 1988, is perhaps the key one to watch. The white working class—a group that in this
region is trending Democratic—is actually adding voters (see Figure 5), white college-educated voters
are growing rapidly and minority voters (primarily Hispanics) are burgeoning. Within this region, the
key segment to watch is the Allentown metropolitan area, third-largest in the state and primary driver
of the region’s growth, both overall and among Hispanics. Also worth watching is the far northeast cor-
ner of the region where very fast-growing Pike and Monroe counties, which have been trending
Democratic, are located. Current trends, if they continue unabated, could push this whole region
21BLUEPRINT FOR AMERICAN PROSPERITY
solidly into the blue column in 2008 and beyond, following the trajectory of the Philadelphia suburbs,
which have already arrived there. Such a development could also tip the statewide balance decisively
toward the Democrats, threatening Pennsylvania’s current purple (albeit leaning blue) status.
Running a close second, the even-faster-growing Harrisburg-York-Lancaster region will also be criti-
cal. Similar to the Allentown-Scranton-Reading region, this region is adding white working class voters
(in larger numbers) and white college-educated and minority, primarily Hispanic, voters (in smaller num-
bers). While the region has remained solidly Republican, there has been a trend toward the Democrats
since 1988, possibly linked to the increasing numbers of minority and white college-educated voters.
This trend, as shown on Map 6, is in the eastern part of the region and is particularly strong in the Lan-
caster metro. But it also includes the very fast growing York-Hanover metro, as well as the Lebanon
metro and the populous parts of the Harrisburg-Carlisle metro (Dauphin and Cumberland counties).
The GOP needs to stop this trend and, ideally, move it back in the other direction to have a reasonable
chance of carrying the state in 2008 and beyond. Conversely, if the pro-Democratic trend continues
and the parties become more closely-matched within the region, the Republicans’ ability to win
statewide races would be severely compromised.
The Philadelphia suburbs merit continued attention due to continued growth driven by increases in
white college graduates and minorities. This region has trended the most sharply toward the Democ-
rats since 1988, a trend which may well continue in 2008 given these demographic changes. Out west,
in Allegheny County and the declining Pittsburgh suburbs-Erie region (which nevertheless shows
strong growth among white college graduates), the trend has been toward the GOP since 1988. Watch
to see if the reddening trend continues in this election, which, given opposing trends in the eastern
part of the state, is vital to the GOP’s chances. But if these western regions—especially their white work-
ing class voters—start moving back in the Democratic direction, it could be a signal that Pennsylvania
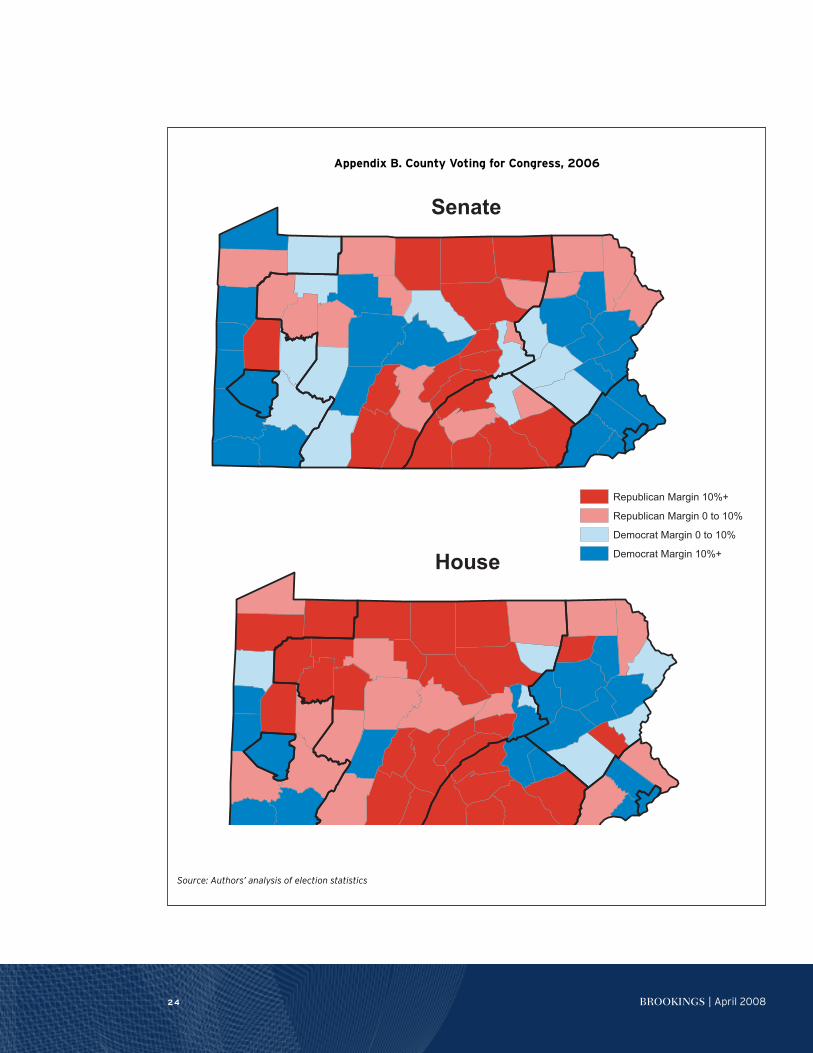
is changing its political colors from purple to blue (see Appendix B Maps, which show the pattern of
support by county in the 2006 Senate election and the 2006 House elections, for a sense of what recent
midterm party strongholds in Pennsylvania look like).
Conclusion
What happens in Pennsylvania—will it become more Democratic, remain closely-divided, or even go Republican for the first time in five elections?—will depend on the
complex interaction of the trends enumerated above. What has made Pennsylvania purple in recent
elections is the way opposing trends have tended to balance one another out without a decisive advan-
tage for either party. But that could be changing. In the 2008 election, we’ll find out whether one set
of trends is finally starting to overwhelm the other.
22 BROOKINGS | April 2008
23BLUEPRINT FOR AMERICAN PROSPERITY
Appendix A. Eligible Voters in Key Segments for Regions
Allentown- Harrisburg- Pittsburgh
Philadelphia Scranton- York- Allegheny Suburbs- North and
Attributes Philadelphia suburbs Reading Lancaster Co. Erie Central PA
Education
Total 100 100 100 100 100 100 100
LTHS 22 9 15 16 10 13 15
HSGrad 38 29 41 40 33 43 46
SomeColl 22 25 25 23 27 25 24
CollGrad 19 36 19 21 30 19 16
Gender/Marital Status
Total 100 100 100 100 100 100 100
Married Women 15 27 27 28 24 27 27
Unmarried Women 40 24 25 23 29 25 23
All Men 45 48 48 48 47 48 49
Earnings
Total 100 100 100 100 100 100 100
$<15,000 22 18 23 21 23 27 29
$15-34,000 36 24 36 35 33 35 39
$35-49,000 19 18 18 21 18 17 16
$50-74,000 15 19 14 15 15 14 11
$75,000+ 8 21 8 9 12 7 5
Male Occupations;
Total 100 100 100 100 100 100 100
Managers and Professionals 29 43 26 30 38 27 25
Service 20 9 13 9 14 13 11
Sales 20 20 18 17 20 16 14
Blue Collar 31 27 44 44 28 45 50
Industry of Worker
Total 100 100 100 100 100 100 100
Manufacturing and Other Goods Production 12 19 24 26 13 25 27
Trade 13 15 16 16 14 15 16
Education and Health 27 24 22 20 28 24 25
Information, Financial and Professional Services 21 26 17 16 25 15 11
Other Services 27 17 21 22 21 21 21
Source: Authors’ analysis of 2006 American Community Survey
24 BROOKINGS | April 2008
County Voting for Congress, 2006
Senate
House
Republican Margin 10%+
Republican Margin 0 to 10%
Democrat Margin 0 to 10%
Democrat Margin 10%+
Source: Author's analysis of election statistics
Appendix B. County Voting for Congress, 2006
Source: Authors’ analysis of election statistics
Endnotes
1. The seven regions are discussed in terms of the following metropolitan area and county components:
1. Philadelphia City—Philadelphia Co. (coincident with Philadelphia City)
2. Philadelphia Suburbs—Delaware, Chester, Montgomery and Bucks Cos. (suburban counties of Pennsylvania portion
of the Philadelphia-Camden Wilmington –PA-NJ-DE-MD metropolitan area)
3. Allentown-Scranton-Reading—Lehigh, Northampton and Carbon Cos (Pennsylvania portion of the Allentown-Beth-
lehem-Easton, PA-NJ metropolitan area), Luzerne, Lackawanna and Wyoming Cos (Scranton-Wilkes-Barre metropolitan
area), Berks Co. (Reading metropolitan area), Pike Co. ( Pennsylvania part of New York-Northern New Jersey-Long Island
NY-NJ-PA metropolitan area), Monroe Co., Wayne Co. Susquehanna Co, Schuylkill Co, Columbia Co.
4. Harrisburg-York-Lancaster—Dauphin, Perry, and Cumberland counties (Harrisburg-Carlisle metropolitan area), York