The structure of joint leisure trips: analyzing two-person leisure trips of Dutch students Dick Ettema ⇑ , Danielle Zwartbol Faculty of Geosciences, Utrecht University, PO Box 80115, 3508 TC Utrecht, The Netherlands article info Keywords: Social network links Social-recreational travel Spatial context Students abstract This paper investigates the spatial structure of students’ leisure trips and to what extent locational char- acteristics of social network partners influence decisions about their joint leisure activities and travel. To this end a survey was held among university students asking them about details of their last leisure trip made with a friend. Cluster analysis suggests that four typical leisure trip patterns can be derived. Three clusters seem to be determined by the residential locations of ego and alter. Depending on the residential distance between ego and alter, leisure trip distances are either short for ego and alter (if residential dis- tance is very short), somewhat longer for both (if residential distance is slightly longer) or long for at least one partner (if residential distance is large). A fourth cluster includes cases with long leisure trips for both partners, independent of residential distance, representing cases where specific destinations are visited. A more detailed analysis of travel distance suggests that travel distance depends on size of the residential municipality, residential distance and objective and perceived quality of leisure facilities such as cafés, bars and restaurants. Overall, our study provides support for the idea that leisure trip decisions should be understood on the level of social network ties (i.e. ego and alter) rather than based on individual char- acteristics only. Also, it provides support for the idea that a focus on single ties, rather than on the struc- ture of social networks as a whole, increases our insight in leisure trip decision making.Keywords: Social network links, Social-recreational travel, Spatial context, Students Ó 2013 Elsevier Ltd. All rights reserved. 1. Introduction Over the past decade, the transportation literature has wit- nessed an increased interest in the relationship between social and recreational (SR) activities and travel. In transportation sci- ence, the increased interest stems from the awareness that the in- crease in car mobility over the past decades, which has led to adverse effects such as congestion, pollution and CO 2 emissions, is caused to a considerable extent by an increase in travel for SR purposes (Schad et al., 2009; Axhausen, 2008). In the Netherlands, for instance, the travel related with leisure activities (excluding holidays) made up 44% of the total distance travelled in passenger transport in 2005 (Harms, 2008). Much (48%) of this leisure-related travel is undertaken for social activities, i.e. to meet and spend time with friends, relatives and others. Ohnmacht et al. (2009) report similar figures for Switzerland. In the Netherlands, the distance travelled for leisure purposes has increased by one third in the per- iod 1985–2003 (Harms, 2008). As this growth was similar to the overall increase in travel, leisure’s share in total travel remained rather stable. Stauffacher et al. (2005) describe similar trends for Germany. In contrast to their importance to mobility development, social and recreational trips have received less attention in the literature than for instance commute and shopping trips. Four decades ago Wheeler and Stutz (1971, page 376) already noted that ‘‘consider- ing the depth of the research on social interaction, it is surprising that there are few studies of social travel within metropolitan areas’’ and this statement has considerable purchase even today, although there is a small literature on leisure travel which we will review below. Various aspects of such activities and trips have been examined, including time spent on leisure pursuits (e.g. Ren and Kwan, 2009), the associated travel time (e.g. Cools et al., 2010) and the transport mode used to access leisure activities (e.g. Limtanakool et al., 2006). Yet, the aspect that has been investigated most frequently is the frequency of engagement in leisure. Descriptive information about the frequency with which people engage in various leisure activities has been provided for a representative sample of the Swiss population by Stauffacher et al. (2005), for samples from Germany and Sweden by Schlich et al. (2004), for a German sample by Tarigan and Kitamura (2009), and for a Dutch sample by Sharm- een and Ettema (2010). Although the studies cannot be compared easily, they all indicate that meeting friends, going out to restau- rants and bars, visiting theatres and cinemas, active sports and club meetings are important types of leisure activities. Further, various 0966-6923/$ - see front matter Ó 2013 Elsevier Ltd. All rights reserved. http://dx.doi.org/10.1016/j.jtrangeo.2013.05.006 ⇑ Corresponding author. Tel.: +31 302532918. E-mail address: [email protected](D. Ettema). Journal of Transport Geography 31 (2013) 216–225 Contents lists available at SciVerse ScienceDirect Journal of Transport Geography journal homepage: www.elsevier.com/locate/jtrangeo
Transcript
Journal of Transport Geography 31 (2013) 216–225
Contents lists available at SciVerse ScienceDirect
Journal of Transport Geography
journal homepage: www.elsevier .com/locate / j t rangeo
The structure of joint leisure trips: analyzing two-person leisure tripsof Dutch students
0966-6923/$ - see front matter � 2013 Elsevier Ltd. All rights reserved.http://dx.doi.org/10.1016/j.jtrangeo.2013.05.006
This paper investigates the spatial structure of students’ leisure trips and to what extent locational char-acteristics of social network partners influence decisions about their joint leisure activities and travel. Tothis end a survey was held among university students asking them about details of their last leisure tripmade with a friend. Cluster analysis suggests that four typical leisure trip patterns can be derived. Threeclusters seem to be determined by the residential locations of ego and alter. Depending on the residentialdistance between ego and alter, leisure trip distances are either short for ego and alter (if residential dis-tance is very short), somewhat longer for both (if residential distance is slightly longer) or long for at leastone partner (if residential distance is large). A fourth cluster includes cases with long leisure trips for bothpartners, independent of residential distance, representing cases where specific destinations are visited. Amore detailed analysis of travel distance suggests that travel distance depends on size of the residentialmunicipality, residential distance and objective and perceived quality of leisure facilities such as cafés,bars and restaurants. Overall, our study provides support for the idea that leisure trip decisions shouldbe understood on the level of social network ties (i.e. ego and alter) rather than based on individual char-acteristics only. Also, it provides support for the idea that a focus on single ties, rather than on the struc-ture of social networks as a whole, increases our insight in leisure trip decision making.Keywords: Socialnetwork links, Social-recreational travel, Spatial context, Students
� 2013 Elsevier Ltd. All rights reserved.
1. Introduction
Over the past decade, the transportation literature has wit-nessed an increased interest in the relationship between socialand recreational (SR) activities and travel. In transportation sci-ence, the increased interest stems from the awareness that the in-crease in car mobility over the past decades, which has led toadverse effects such as congestion, pollution and CO2 emissions,is caused to a considerable extent by an increase in travel for SRpurposes (Schad et al., 2009; Axhausen, 2008). In the Netherlands,for instance, the travel related with leisure activities (excludingholidays) made up 44% of the total distance travelled in passengertransport in 2005 (Harms, 2008). Much (48%) of this leisure-relatedtravel is undertaken for social activities, i.e. to meet and spend timewith friends, relatives and others. Ohnmacht et al. (2009) reportsimilar figures for Switzerland. In the Netherlands, the distancetravelled for leisure purposes has increased by one third in the per-iod 1985–2003 (Harms, 2008). As this growth was similar to theoverall increase in travel, leisure’s share in total travel remainedrather stable. Stauffacher et al. (2005) describe similar trends forGermany.
In contrast to their importance to mobility development, socialand recreational trips have received less attention in the literaturethan for instance commute and shopping trips. Four decades agoWheeler and Stutz (1971, page 376) already noted that ‘‘consider-ing the depth of the research on social interaction, it is surprisingthat there are few studies of social travel within metropolitanareas’’ and this statement has considerable purchase even today,although there is a small literature on leisure travel which we willreview below.
Various aspects of such activities and trips have been examined,including time spent on leisure pursuits (e.g. Ren and Kwan, 2009),the associated travel time (e.g. Cools et al., 2010) and the transportmode used to access leisure activities (e.g. Limtanakool et al.,2006). Yet, the aspect that has been investigated most frequentlyis the frequency of engagement in leisure. Descriptive informationabout the frequency with which people engage in various leisureactivities has been provided for a representative sample of theSwiss population by Stauffacher et al. (2005), for samples fromGermany and Sweden by Schlich et al. (2004), for a German sampleby Tarigan and Kitamura (2009), and for a Dutch sample by Sharm-een and Ettema (2010). Although the studies cannot be comparedeasily, they all indicate that meeting friends, going out to restau-rants and bars, visiting theatres and cinemas, active sports and clubmeetings are important types of leisure activities. Further, various
D. Ettema, D. Zwartbol / Journal of Transport Geography 31 (2013) 216–225 217
scholars have examined the factors influencing the frequency ofengaging in leisure activity and travel (Bhat and Lockwood, 2004;Scheiner, 2006; Sener et al., 2008; Farber and Páez, 2009; Tariganand Kitamura, 2009). All report that sociodemographic and life-cy-cle factors have a significant impact on individuals’ propensity toengage in leisure activities and travel. Other factors that are foundto influence leisure consumption are spatial setting (Bhat andLockwood, 2004; Sener et al., 2008), seasonal effects (Bhat andLockwood, 2004; Sener et al., 2008; Kemperman et al., 2000) andvehicle ownership (Scheiner, 2006; Tarigan and Kitamura, 2009;Farber and Páez, 2009).
The spatial variability in leisure travel has also attracted consid-erable attention and is known to be much larger than for commut-ing and shopping trips (Stauffacher et al., 2005; Schlich et al., 2004;Tarigan and Kitamura, 2009). In a study observing individuals’ tra-vel behaviour for six consecutive weeks, Schlich et al. (2004) showthat participants keep visiting new locations for leisure activitiesthroughout the study period. Although for most participants someeight locations accounted for about 80% of the leisure destinationsvisited, Schlich and colleagues demonstrated that location choicein leisure travel is more irregular and idiosyncratic than for otherkinds of travel.
In short, the literature has delivered important insights in vari-ous aspects of leisure trips. The approach that is typically taken,however, is to analyze leisure trips as made by a single decisionmaker. Sharmeen and Ettema (2010), however, report that some80% of SR trips are made in company of others, and that in abouthalf of the cases, this concerns someone from outside the house-hold. It is emphasized that such trips are fundamentally differentfrom trips made alone or with household members, since the activ-ity partners come from different locations and different house-holds, which will influence the decision making process. Thus,the socio-demographic and locational characteristics of the other,as well as their lifestyle preferences and tastes, may influence deci-sions regarding the leisure trip. Insight into the influence of char-acteristics and preferences of leisure partners on their jointleisure activities and travel is however very limited, both in termsof descriptive knowledge and in terms of the underlying processes.Yet, this insight is very relevant given that a considerable share ofleisure travel and overall travel consists of joint leisure trips madewith non-household members. This relevance is even more prom-inent with the advance of agent-based models that aim at predict-ing travel based on social networks and the interactions withinsuch networks.
Therefore, this paper aims at increasing the insight into thestructure of joint leisure trips, based on a data set collectedamongst Dutch students in 2011. While it is recognized that jointleisure trips often include three or more parties, our study is lim-ited to two friends making a joint leisure trip. Focusing on this spe-cific case allows us to gain first insights into the decision makingmechanisms of joint trips made by members from different house-holds. On a descriptive level, we will describe typical patterns ofjoint leisure trips in terms of travel distances, residential locationsand travel modes. To increase the insight into travel consider-ations, we use multivariate statistics to investigate the impact oflocational characteristics and personal characteristics on locationchoice decisions.
The paper is structured as follows. In Section 2, we summarizeexisting empirical and theoretical studies related to social interac-tions and travel and position our work in the context of this liter-ature. Section 3 describes the data collection procedure. Section 4gives the empirical results, which include descriptive statistics ofstudents’ joint leisure trips, a classification of joint leisure tripsand an ordered logit model to understand the effect of spatial con-text on trip distance. Section 5 draws some general conclusionsand addresses avenues for further research.
2. Joint decisions about social–recreational travel
While studies that address the detailed interaction betweenpartners involved in joint leisure activities is largely lacking, theawareness that one’s relationships with friends/family influenceone’s travel has steadily increased over the past decade. This hasinvoked a series of studies focusing on the relationship betweenthe composition and structure of social networks and frequencyof social or recreational trips. The main assumption underlyingthese studies is that social networks (SNs) play a role in controlover and information about resources and influence cooperationand competition which facilitate or constrain certain opportunitiesand behaviours. Social activities, defined as joint recreational orsupport activities, stem from the propensity of different partiesto provide or consume companionship or support, which may beinfluenced by person, tie or network characteristics. Although itis recognized (Carrasco and Miller, 2006) that actors in social net-works may include various entities, such as nations, organisations,groups and individuals, the social networks in the context of traveland activities, are usually defined as consisting of friends and fam-ily members, elicited by name generator techniques. These couldbe named ‘informal’ SN, as opposed to ‘formal’ SN such as clubsand associations (Kwak and Campbell, 2010).
In this stream of research, Carrasco and Miller, (2006) foundthat engagement in social activities (e.g. hosting visitors and goingto a bar/restaurant), controlled for socio-demographic characteris-tics, was dependent on the composition of a person’s social net-work such as the number of family members, friends, andnetwork members from social organisations. Also geographical as-pects of the social network appeared to matter, to the extent thatincreased distance to social network members reduced frequencyof engagement in social activities. In a later study, Carrasco andMiller (2009) found that apart from characteristics of the networkas a whole (such as density, number of isolates and centrality),characteristics of the alter (age, gender, alter’s position in his/herego-network) and the tie (similarity, distance, frequency of ICT-interaction) also influenced the probability of engaging in socialactivities. In an early study, Ginsberg (1975) found that if morefriends lived in the same neighbourhood, one is more likely toundertake leisure activities with friends rather than with thespouse. Although this relationship is mediated by gender, educa-tion and cultural background, it suggests that the social networkof friends and family constitutes a resource for undertaking leisureactivities which normally require company.
Other scholars have focussed in a more general way on thesize and composition of the social network and the frequencyof face-to-face contact between network members. Tillema andDijst (2007) found that the frequency of face-to-face contact cor-related negatively with distance to the other network membersand increased with the number of persons in the social network,the share of relatives in the social network, use of Internet andSMS and car availability. Mok et al. (2007) also found that fre-quency of face-to-face contact between social network membersdepends on geographical distance, and also on the type (kin,friends) and intensity (intimate, non-intimate) of the tie. Regard-ing the travel implications of face-to-face contacts between net-work members, Silvis et al. (2006) found that the length of socialtrips is positively related to the number of people in the socialnetwork, proportion and number of non-immediate kin, andthe average age of the social network ties. The number of socialtrips correlated positively with social network size, householdsize and income.
In short, the literature on social and recreational travel has ad-dressed various aspects of SR trip making such as trip frequency,travel mode, travel time and location choice. In addition, it isrecognized that a large part of SR trips is made together with
218 D. Ettema, D. Zwartbol / Journal of Transport Geography 31 (2013) 216–225
non-household members such as friends and (external) familymembers, implying that both the taxonomy and the spatial struc-ture of the social network influence SR trip making. An issue thathas received, to the authors’ knowledge, very limited attention todate is how the social network influences SR trip making on the le-vel of individual links and individual trips. That is, how do two ormore friends decide about location type, duration and travel modeof a joint activity, given their residential (or other base) locations,travel options and leisure preferences.
In a theoretical paper, Ettema and Schwanen (2012) advocate arelational approach to analyzing SR trips, implying that decisionsregarding joint leisure trips should be understood in the contextof the locations (residential) of participants in the trip and thecharacteristics and preferences of the participants. With respectto trip generation, they emphasize (based on literature on socialrelationships and friendships) the role of preferences and skills oftrip/activity participants for activity generation, but also less tangi-ble aspects such as identity formation and confirmation and affec-tive and emotional bonds between people. From a longitudinalperspective, also the history of the relationship as well as reciproc-ity considerations may play a role in the generation of joint SRtrips.
With respect to location choice of joint SR trips, Ettema andSchwanen (2012) note that time-geographic mechanisms (Häger-strand, 1970) impact location choice in a straightforward way. Inparticular, given the base locations of people involved in a jointSR activity, time-geography can be used to find feasible locationswhere the joint activity may take place, given time constraintsand travel options of the participants (see Neutens et al., 2010).However, Ettema and Schwanen (2012) argue that location choiceis only to a limited extent based on distance minimization consid-erations. More important are functional characteristics of locations(affordances), such as opportunities offered by places to participatein sports, have a drink, see a play, and do shopping. Such affor-dances should match the preferences and requirements of the SRactivity partners. In addition, they emphasize the relevance ofthe atmosphere of places, related to the geographical concept of‘place’. This entails affective responses to very specific constella-tions of people and artefacts in specific places, but also the sym-bolic meaning of places (and the objects in these places) thatmay serve to confirm one’s identity or membership of a social orlifestyle related group. Thus, to properly understand locationchoice in joint SR trips, it is important not only to focus on acces-sibility related attributes but also include functional and atmo-sphere related characteristics of places.
To conclude, there is limited insight into the process of trip gen-eration, location choice and mode choice in joint SR trips. Whiletheoretical notions pertaining to this process have been identified,empirical studies are largely lacking. This paper therefore aims toincrease the insight into the decision making in joint SR trips bypresenting the results of analyses of data of joint SR trips by Dutchstudents. First, we aim to get insight into the structure of joint tripsby applying descriptive techniques. In addition, we aim to explorethe implications of personal and place characteristics related to SRactivity participants for location choice by investigating the effectof these factors on trip distance.
3. Data
3.1. Data collection
Data were collected among Dutch students from universitiesand higher vocational education organisations in the cities of Utr-echt (316,000 inhabitants) and Rotterdam (617,000 inhabitants). Itis recognized that students are not representative of the general
Dutch population and represent only a part of the total populationin their age cohort. On the other hand, in cities like Utrecht andRotterdam, university and higher vocational students make up5.4–11.0% of the population and are relatively heavy users of publictransport facilities and cycling infrastructure. In addition, ourstudy is exploratory in nature, and aims to explore variations inthe spatial structure of trips and mechanisms in location choice.However, one should be careful to transfer these findings directlyto other population segments.
Since the aim of the paper is to explore joint trip making on thelevel of individual trips and the involved company, data have beencollected about the most recent SR trip that was made with a friendto a leisure location (i.e. not the friend’s home) and the relationshipto this friend. Since we are interested in the role of residential loca-tions and their characteristics for joint SR trip decisions, respon-dents were instructed to report about the most recent SR tripstarting from home for both the respondent and his/her friend.The limitation to two person trips was chosen to obtain a maxi-mum degree of uniformity in terms of decision making process(e.g., a trip with a group of five is likely to have much differentdynamics in the decision making process than a two person trip).The focus on the most recent trip (instead of the most commontrip) was chosen to obtain variation with respect to types of trips(e.g. dining vs. sports) and characteristics of partners (e.g. dailyvs. incidental meetings).
The questionnaire included questions regarding the followingitems:
(a) Characteristics of the respondent (called ego hereafter), suchas age, gender, level of the study followed, city of study, res-idential location, housing situation (living with parents orliving independently), driving license holdership and caravailability;
(b) Characteristics of the company of the last SR trip (called alterhereafter), including the same characteristics as for the ego;
(c) Characteristics of the last joint SR trip, such as location, tra-vel mode (of ego and alter), type of SR activity and durationof SR activity. Travel mode was defined as the mode withwhich the longest distance was travelled, implying that wedo not focus on access and egress trips of public transportand may lose detail on occasional complex trips. Activitiesin the home location of ego or alter were not regarded asjoint SR activities, since in that case the ego or alter doesnot travel, reducing the activity to an individually madesocial visit, whereas in this study the emphasis is on jointactivity and trip coordination.
(d) Characteristics of the relationship between ego and alter,such as frequency of meeting each other face-to-face, modeof interaction in general (face-to-face, email, phone).
(e) Functional characteristics of the ego’s residential location. Tothis end, we included questions regarding ego’s perceptionsof the presence and quality of facilities in his/her residentialmunicipality. Respondents were asked whether any of thefollowing facilities (café, restaurant, discotheque, cinema,sports facility, swimming pool) was available in his/her res-idential municipality and asked to rate the quality of thisfacility (if present) on a 1–10 scale.
Data were collected among students in Utrecht and Rotterdam.These cities were selected since they differ considerably in struc-ture. Compared to Rotterdam, students account for a larger partof the population in Utrecht. In addition, Utrecht is more compactcity, which might influence SR trip making decisions.
To collect data, students were approached in selected classes ofuniversities and institutions for higher vocational study in Utrechtand Rotterdam. These classes were chosen such as to maximize
University cityUtrecht 49.1 28.8Rotterdam 50.9 25.2% With drivers license 66.9 71.8
Car accessibilityAlways access to car 20.2 26.7Has to coordinate with other household members 40.5 36.1No access to car 39.3 37.2
D. Ettema, D. Zwartbol / Journal of Transport Geography 31 (2013) 216–225 219
variation in year of study and in type of study (technical, social,language, law, etc.). Students from universities and institutionsfor higher education and students in Utrecht and Rotterdam weresampled in equal shares. Data were collected in March and April2011. In total, 162 usable questionnaires were returned.
To allow for analyses of travel distance, the residential locationsof ego and alter and the leisure location were used to calculate net-work distances using Google Maps. It is noted that the precision ofthe location descriptions differed. The ego’s home location was re-corded accurately as their 4-digit zipcode. The 4-digit zip-code hasan area of between 1.1 and 8.1 km2. However, the home location ofthe alter was logically recorded less accurately. 14.3% recorded thefriends’ zipcode, 21.7% mentioned the street and municipality and64.0% mentioned the neighbourhood and municipality. The leisurelocation was described by the zip-code by 2.5%, by the street andmunicipality by 42.0%, by the name of the facility (e.g. the nameof a bar, club or sports facility) by 25.3% and by neighbourhoodby 30.2%. In case of street or facility name, the 4-digit zipcodecan be derived accurately. However, in case of a neighbourhooddescription, the neighbourhood center was manually determinedto derive the zip-code. The variety in spatial detail did not allowus to calculate an exact travel distance in all cases. Therefore, dis-tance classes (0–2.5 km, 2.5–5 km, 5–10 km, 10–20 km, 20–40 km,>40 km) were used, which made it possible to assign distance clas-ses to pairs of locations with sufficient reliability.
3.2. Sample characteristics
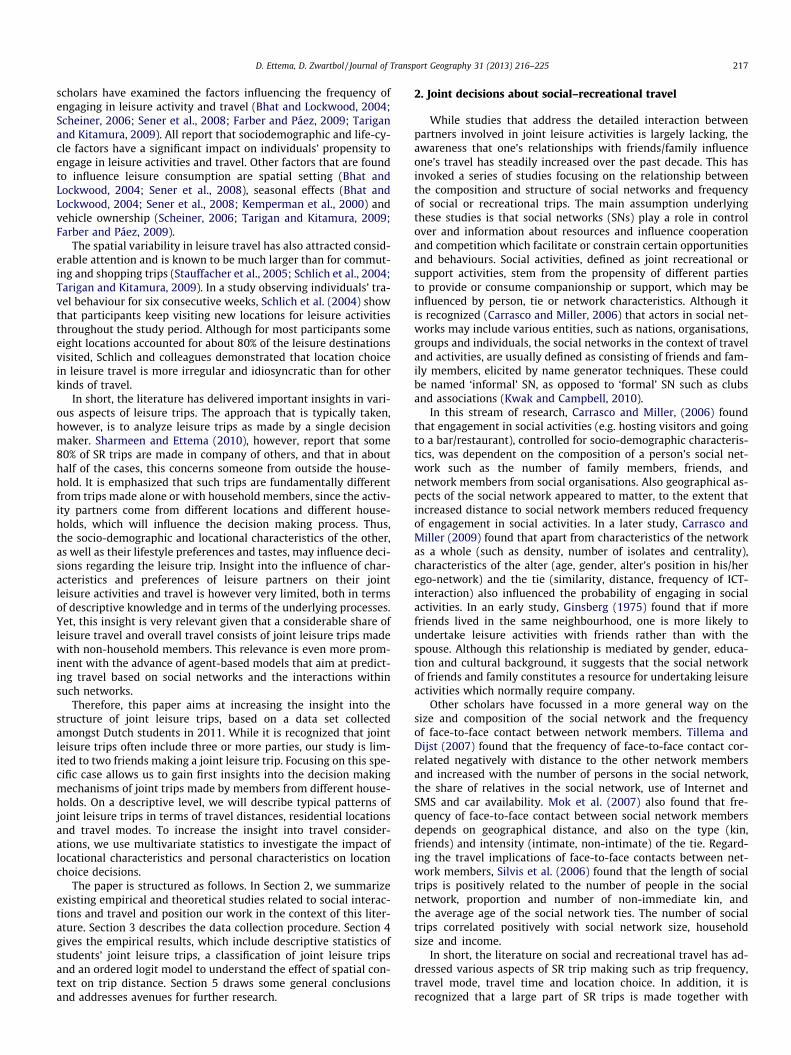
Table 1 summarizes characteristics of egos and alters. The re-sults suggest that the age of egos ranges from 16 to 30 years andfrom 16 to 35 years for alters. The majority however, is between18 and 24 years old (90.8% of egos and 85.1% of alters). The major-ity of the egos and alters is female (61.3% and 65.0% respectively).Since the share of female students is 59.0% in Utrecht and 51.5% inRotterdam this indicates a biased representation. With respect tohousehold situation, 55.8% of the egos and 51.9% of the alters livewith their parents. This implies that about half also live indepen-dently. In the Netherlands, this often implies living in or near tothe city where one studies and is thought to be associated with adifferent lifestyle (more outgoing and fun seeking) which mightaffect leisure travel choices. With respect to the size of the
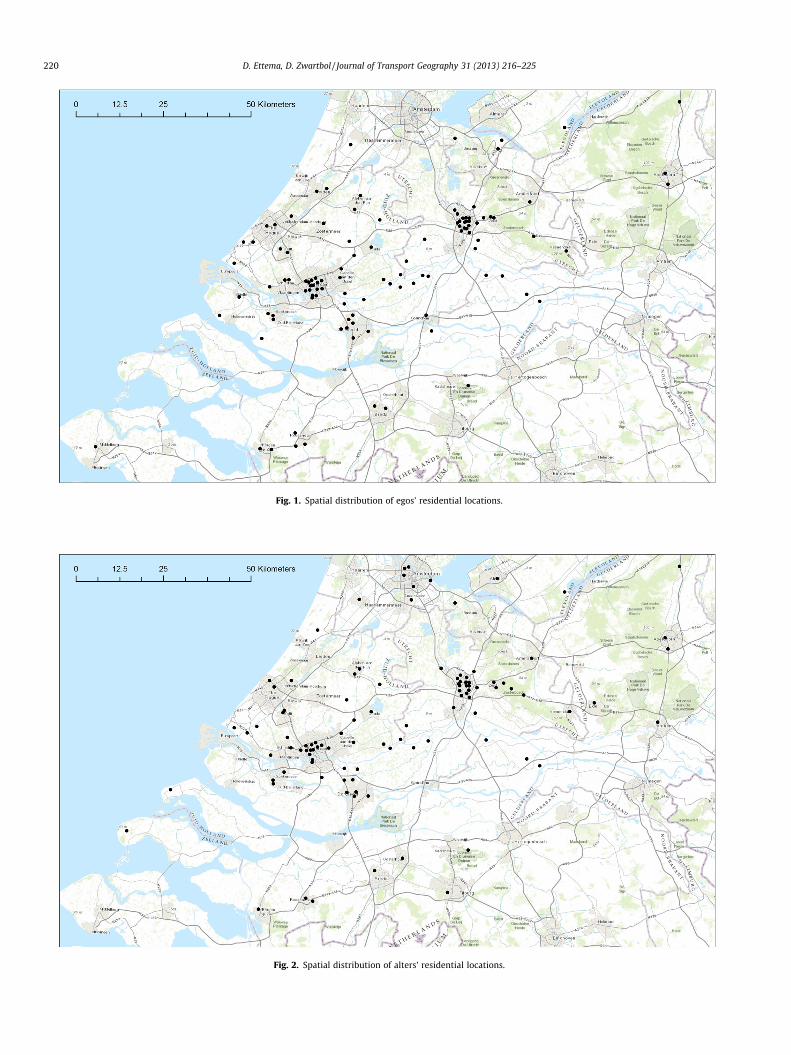
municipality, 34.4% of the egos and 39.9% of the alters lives in alarge city (>200,000 inh.). 40.5% of the egos and 34.4% of the alterslive in smaller towns (<50,000 inh.). Taken together, this suggeststhat many students do not live in the city where they study. Itshould be noted, though, that also students who live indepen-dently, may not be able to live in their city of study due to scarcityof housing and settle in adjacent municipalities. The spatial distri-bution of egos and alters is displayed in Figs. 1 and 2. The figuresshow a concentration in the cities of Utrecht and Rotterdam, butalso many living in smaller cities or peripheral areas. The egosshow an almost even split between higher vocational studies anduniversity studies (51.5% vs. 48.5%). Among the alters these studieseach account for 33.7% of the sample, suggesting that students notnecessarily socialize with other university or higher vocational stu-dents but also with people following other types of education orworking. Also with respect to the city of study, the egos are splitevenly between Utrecht and Rotterdam (49.1% vs. 50.9%). For al-ters, this is 28.8% and 25.2% respectively. This implies that studentsfrom Utrecht/Rotterdam do not only socialize with people havingother occupations, but also with students from institutions in othercities. The majority of both egos and alters owns a driving license(66.9% and 71.8%), although only a minority (20.2% and 26.7%) al-ways has access to a car. Many (40.5% and 36.1%) have to coordi-nate use of the car, for instance when living in a household withone car but multiple drivers.
Since leisure trips (as studied in this paper) are made in couples,it makes sense not only to analyze ego and alter characteristics, butalso how these are distributed within couples. In this respect, thevast majority of leisure trips are made with a person of the samesex (80.9%). 41.9% of the couples both live with their parents and34.6% both live independently, implying that 76.5% have the samehousehold situation. Also in terms of residential municipality size,the majority of couples shares similar characteristics. 28.5% bothlive in a small town, 15.8% both live in a medium size town and28.5% both live in a large city. Taken together, 72.8% of the coupleslive in municipalities of about the same size. In addition, 51.5% livein the same municipality and 62.6% live less than 10 km away fromeach other. Obviously, these outcomes are related to the relation-ship between spatial location and social network formation, imply-ing that people living in a shorter distance have more chance tomeet and establish a social relationship (Tillema and Dijst, 2007).Less congruency is observed in terms of educational level. Abouthalf of the couples follow the same type of education (25.6% bothacademic, 27.2% both higher vocational). Finally, it is noted thatthe couples in our sample interact with a high frequency. 90.2%has contact more than once per week. This reflects the importantrole of peers in early adulthood, before other types of social rela-tions (partner, colleagues) become more prominent.
4. Results
4.1. The structure of students joint SR trips
Having discussed the characteristics of egos, alters and couples,this section describes the characteristics of leisure trips, related to(selected) ego, alter and couple characteristics. With respect to themore specific purpose of the leisure trip, it is found that visitingrestaurants (20.4%), bars (40.1%), cinemas (19.1%) and disco-theques (12.3%) are the dominant activities during a leisure trip.These activities were precoded in the questionnaire. These precod-ed activities covered 95.7% of the joint SR activities. 7 respondentsindicated other activities, such as outside activities (3), club activ-ities (2), shopping (1) or a visit to a third party (1). Although nominimum duration of the joint SR activity was required, theduration of the joint activity is mostly rather long. 91.1% of the
Fig. 1. Spatial distribution of egos’ residential locations.
Fig. 2. Spatial distribution of alters’ residential locations.
220 D. Ettema, D. Zwartbol / Journal of Transport Geography 31 (2013) 216–225
Fig. 3. Spatial distribution of joint social–recreational activity locations.
Table 2The relationship between trip distance of ego and alter and residential distance.
Trip distance alter
<5 km 5–20 km >20 km
Trip distance ego<5 km 69 (80.2%) 2 (10.0%) 15 (31.2%)5–20 km 5 (5.8%) 12 (60.0%) 2 (4.2%)>20 km 12 (14.0%) 6 (30.0%) 31 (64.6%)
Distance between partners
<5 km 5–20 km >20 km
Trip distance ego<5 km 72 (70.6%) 3 (25.0%) 11 (27.5%)5–20 km 10 (9.8%) 7 (58.3%) 2 (5.0%)>20 km 20 (19.6%) 2 (16.7%) 27 (67.5%)
Shortest trip distance<5 km 71 (69.6%) 6 (50.0%) 9 (22.5%)5–20 km 10 (9.8%) 4 (33.3%) 6 (15.0%)>20 km 21 (20.6%) 2 (16.7%) 25 (62.5%)
D. Ettema, D. Zwartbol / Journal of Transport Geography 31 (2013) 216–225 221
activities take more than 2 h, 31.6% takes even more than 4 h. Only1.6% takes less than 1 h. Activity duration is not related to travelduration. Chi-square tests of the relation between travel distanceclass (either of ego or alter) and activity duration class appearednot to be significant (p = 0.99 and p = 0.67 respectively).
With respect to travel modes used, it appears that cycling(37.4% of egos and 38.0% of alters), bus/tram (20.2% and 19.6%)and car (22.1% and 22.7%) are the dominant travel modes. It is alsonoted that in 82.8% of the cases, ego and alter use the same travelmode. This is logical given that the partners usually have similartravel distance (see later). In addition, they usually share the samehousehold type (with implications for car accessibility) and munic-ipality size (with implications for access to public transport). Also,using the same travel mode may be related to actually travelling
together for whole or part of the trip. However, this was not re-corded in the current data set.
The majority of joint leisure trips are made over a short dis-tance. 55.8% of the trips by egos and by alters is shorter than5 km. However, 31.8% of ego trips and 31.2% of alter trips are morethan 20 km, suggesting that there is considerable heterogeneitywith respect to trip lengths. These figures are mirrored in the spa-tial distribution of SR activity locations (Fig. 3). SR activities areheavily concentrated in the cities of Utrecht and Rotterdam. Com-bining this with the more scattered distributions of residentiallocations (Figs. 1 and 2) results in the travel distance distributedoutlined before. Table 2 also suggests a positive relationship be-tween egos’ and alters’ travel distance, which is highly significantaccording to a Chi-square test (p < 0.001). The fact that many(51.5%) live in the same municipality and live close to each otheris a logical explanation for the distribution displayed in the table.To further explore the relationship, Table 2 displays two additionalrelationships:
1. between the residential distance of ego and alter and the traveldistance of the ego;
2. between residential distance of ego and alter and the shortestdistance travelled by either ego or alter (thus, if the ego travels5 km and the alter travels 10 km, the shortest distance is 5 km).
This table suggests that with increasing residential distance, thetravel distance for the ego increases. A potential explanation wouldbe that at least one partner has to travel farther if the leisure activ-ity takes place close to the residence of the other party, which mayapply to the ego. However, also the shortest distance travelled (byego or alter) increases with increasing residential distance(p < 0.001, according to a Chi-square test), suggesting that overall,a larger residential distance leads to a geographically wider rangeof destinations considered. To appreciate this finding, it is noted
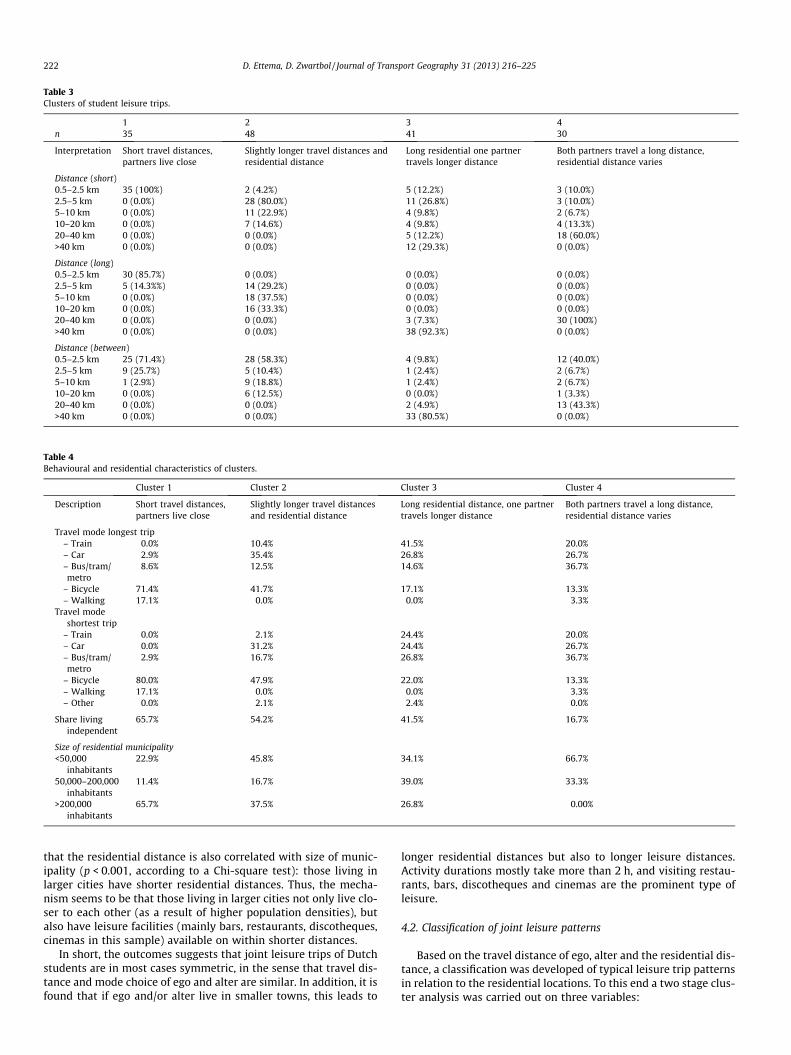
Table 3Clusters of student leisure trips.
1 2 3 4n 35 48 41 30
Interpretation Short travel distances,partners live close
222 D. Ettema, D. Zwartbol / Journal of Transport Geography 31 (2013) 216–225
that the residential distance is also correlated with size of munic-ipality (p < 0.001, according to a Chi-square test): those living inlarger cities have shorter residential distances. Thus, the mecha-nism seems to be that those living in larger cities not only live clo-ser to each other (as a result of higher population densities), butalso have leisure facilities (mainly bars, restaurants, discotheques,cinemas in this sample) available on within shorter distances.
In short, the outcomes suggests that joint leisure trips of Dutchstudents are in most cases symmetric, in the sense that travel dis-tance and mode choice of ego and alter are similar. In addition, it isfound that if ego and/or alter live in smaller towns, this leads to
longer residential distances but also to longer leisure distances.Activity durations mostly take more than 2 h, and visiting restau-rants, bars, discotheques and cinemas are the prominent type ofleisure.
4.2. Classification of joint leisure patterns
Based on the travel distance of ego, alter and the residential dis-tance, a classification was developed of typical leisure trip patternsin relation to the residential locations. To this end a two stage clus-ter analysis was carried out on three variables:
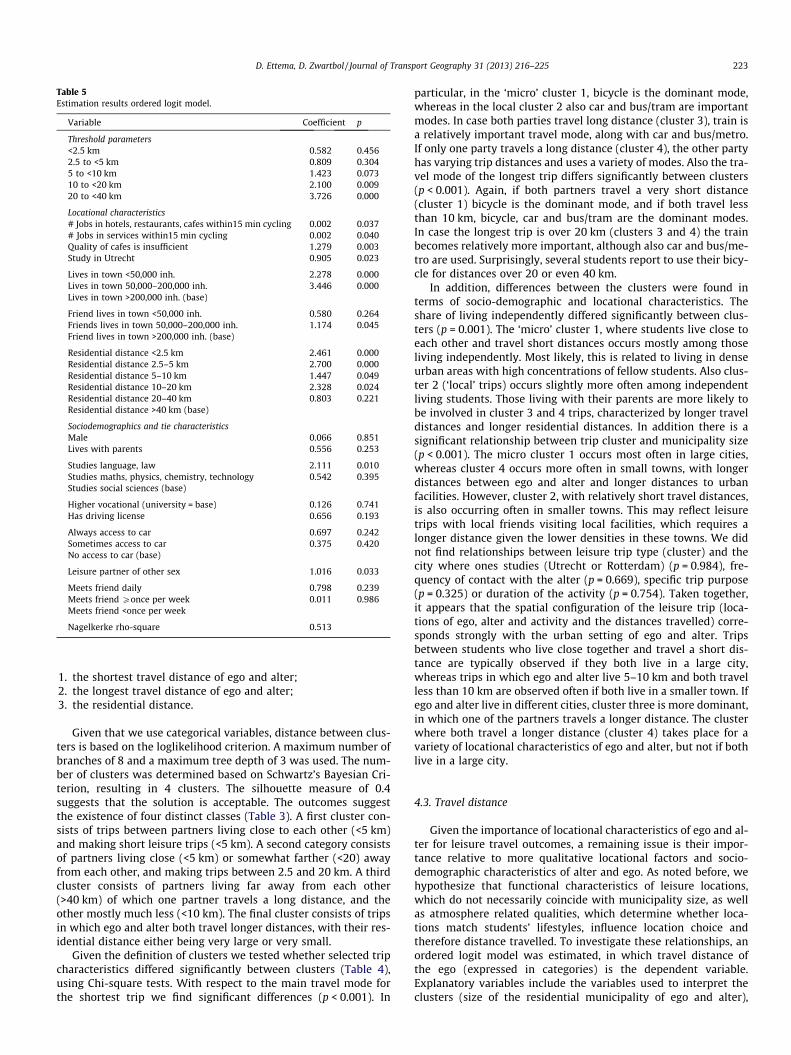
Table 5Estimation results ordered logit model.
Variable Coefficient p
Threshold parameters<2.5 km �0.582 0.4562.5 to <5 km 0.809 0.3045 to <10 km 1.423 0.07310 to <20 km 2.100 0.00920 to <40 km 3.726 0.000
Locational characteristics# Jobs in hotels, restaurants, cafes within15 min cycling �0.002 0.037# Jobs in services within15 min cycling 0.002 0.040Quality of cafes is insufficient 1.279 0.003Study in Utrecht �0.905 0.023
Lives in town <50,000 inh. 2.278 0.000Lives in town 50,000–200,000 inh. 3.446 0.000Lives in town >200,000 inh. (base)
Friend lives in town <50,000 inh. �0.580 0.264Friends lives in town 50,000–200,000 inh. �1.174 0.045Friend lives in town >200,000 inh. (base)
Residential distance <2.5 km �2.461 0.000Residential distance 2.5–5 km �2.700 0.000Residential distance 5–10 km �1.447 0.049Residential distance 10–20 km �2.328 0.024Residential distance 20–40 km �0.803 0.221Residential distance >40 km (base)
Sociodemographics and tie characteristicsMale 0.066 0.851Lives with parents �0.556 0.253
Studies language, law 2.111 0.010Studies maths, physics, chemistry, technology 0.542 0.395Studies social sciences (base)
Always access to car 0.697 0.242Sometimes access to car 0.375 0.420No access to car (base)
Leisure partner of other sex 1.016 0.033
Meets friend daily 0.798 0.239Meets friend Ponce per week 0.011 0.986Meets friend <once per week
Nagelkerke rho-square 0.513
D. Ettema, D. Zwartbol / Journal of Transport Geography 31 (2013) 216–225 223
1. the shortest travel distance of ego and alter;2. the longest travel distance of ego and alter;3. the residential distance.
Given that we use categorical variables, distance between clus-ters is based on the loglikelihood criterion. A maximum number ofbranches of 8 and a maximum tree depth of 3 was used. The num-ber of clusters was determined based on Schwartz’s Bayesian Cri-terion, resulting in 4 clusters. The silhouette measure of 0.4suggests that the solution is acceptable. The outcomes suggestthe existence of four distinct classes (Table 3). A first cluster con-sists of trips between partners living close to each other (<5 km)and making short leisure trips (<5 km). A second category consistsof partners living close (<5 km) or somewhat farther (<20) awayfrom each other, and making trips between 2.5 and 20 km. A thirdcluster consists of partners living far away from each other(>40 km) of which one partner travels a long distance, and theother mostly much less (<10 km). The final cluster consists of tripsin which ego and alter both travel longer distances, with their res-idential distance either being very large or very small.
Given the definition of clusters we tested whether selected tripcharacteristics differed significantly between clusters (Table 4),using Chi-square tests. With respect to the main travel mode forthe shortest trip we find significant differences (p < 0.001). In
particular, in the ‘micro’ cluster 1, bicycle is the dominant mode,whereas in the local cluster 2 also car and bus/tram are importantmodes. In case both parties travel long distance (cluster 3), train isa relatively important travel mode, along with car and bus/metro.If only one party travels a long distance (cluster 4), the other partyhas varying trip distances and uses a variety of modes. Also the tra-vel mode of the longest trip differs significantly between clusters(p < 0.001). Again, if both partners travel a very short distance(cluster 1) bicycle is the dominant mode, and if both travel lessthan 10 km, bicycle, car and bus/tram are the dominant modes.In case the longest trip is over 20 km (clusters 3 and 4) the trainbecomes relatively more important, although also car and bus/me-tro are used. Surprisingly, several students report to use their bicy-cle for distances over 20 or even 40 km.
In addition, differences between the clusters were found interms of socio-demographic and locational characteristics. Theshare of living independently differed significantly between clus-ters (p = 0.001). The ‘micro’ cluster 1, where students live close toeach other and travel short distances occurs mostly among thoseliving independently. Most likely, this is related to living in denseurban areas with high concentrations of fellow students. Also clus-ter 2 (‘local’ trips) occurs slightly more often among independentliving students. Those living with their parents are more likely tobe involved in cluster 3 and 4 trips, characterized by longer traveldistances and longer residential distances. In addition there is asignificant relationship between trip cluster and municipality size(p < 0.001). The micro cluster 1 occurs most often in large cities,whereas cluster 4 occurs more often in small towns, with longerdistances between ego and alter and longer distances to urbanfacilities. However, cluster 2, with relatively short travel distances,is also occurring often in smaller towns. This may reflect leisuretrips with local friends visiting local facilities, which requires alonger distance given the lower densities in these towns. We didnot find relationships between leisure trip type (cluster) and thecity where ones studies (Utrecht or Rotterdam) (p = 0.984), fre-quency of contact with the alter (p = 0.669), specific trip purpose(p = 0.325) or duration of the activity (p = 0.754). Taken together,it appears that the spatial configuration of the leisure trip (loca-tions of ego, alter and activity and the distances travelled) corre-sponds strongly with the urban setting of ego and alter. Tripsbetween students who live close together and travel a short dis-tance are typically observed if they both live in a large city,whereas trips in which ego and alter live 5–10 km and both travelless than 10 km are observed often if both live in a smaller town. Ifego and alter live in different cities, cluster three is more dominant,in which one of the partners travels a longer distance. The clusterwhere both travel a longer distance (cluster 4) takes place for avariety of locational characteristics of ego and alter, but not if bothlive in a large city.
4.3. Travel distance
Given the importance of locational characteristics of ego and al-ter for leisure travel outcomes, a remaining issue is their impor-tance relative to more qualitative locational factors and socio-demographic characteristics of alter and ego. As noted before, wehypothesize that functional characteristics of leisure locations,which do not necessarily coincide with municipality size, as wellas atmosphere related qualities, which determine whether loca-tions match students’ lifestyles, influence location choice andtherefore distance travelled. To investigate these relationships, anordered logit model was estimated, in which travel distance ofthe ego (expressed in categories) is the dependent variable.Explanatory variables include the variables used to interpret theclusters (size of the residential municipality of ego and alter),
224 D. Ettema, D. Zwartbol / Journal of Transport Geography 31 (2013) 216–225
socio-demographics of the ego, social tie relationships and per-ceived and objective indicators of the quality of leisure places.
Qualitative characteristics (see Ettema and Schwanen, 2012)may refer to the perception of availability and quality of facilities,as well as objective, more detailed measures of availability of ser-vices. With respect to the perceived quality of facilities, we askedrespondents to grade the presence and quality of a series of facili-ties (café, restaurant, discotheque, cinema, sports facility, swim-ming pool) on a 1–10 scale, which were tested for explanatorypower in the model. In addition, two objective measures wereused: the number of jobs in hotels/restaurants/cafes and the num-ber of jobs in services that can be accessed within 15 min by bicy-cle. We use the latter as a proxy for the availability of leisurefacilities.
The estimation results (Table 5) confirm the role of residentiallocation for leisure trip decisions: the trip distance of those livingin medium or small size towns is larger than of those living in largecities. In addition, trip distance increases with residential distance,as discussed before. Thus, a larger residential distance leads to theconsideration of more remote locations, including locations closeto the alter’s place. In addition, it is found that travel distance ofthe ego diminishes if the alter lives in a smaller (medium size)town. Most likely, if the alter lives in a smaller town, this is asso-ciated with lower availability of options for joint leisure (bars, res-taurants, cinemas), making the alter’s town a less favourabledestination to visit by the ego. However, apart from municipalitysize and residential distance, also more qualitative locational char-acteristics play a role. First, students studying in Utrecht travelshorter distances than students studying in Rotterdam. Since wecontrol for other locational characteristics, this is likely an effectof spatial structure. The city of Utrecht has a higher populationdensity than Rotterdam (3279 inh./km2 vs. 2850 inh./km2) whichcould lead to shorter distances in general. However, given thatthe same share of students studying in Utrecht and Rotterdam liveoutside their university town, this may also be related to the loca-tion of residential areas relative to Utrecht and Rotterdam (the cit-ies used most frequently for leisure activities). In addition, thefacilities of the residential municipality play a role in destinationchoice and the resulting travel distance. Distance decreases if moreemployment in cafes/bars/restaurants (a proxy for presence ofbars) is present within 15 min of travel. Also, if quality of thecafes/bars/restaurants is rated as satisfactory, travel distance isless. This suggests that both presence and quality of these facilitiesin the municipality lead to more local leisure activities and less tra-vel. However, presence of jobs in services leads to longer travel dis-tances. Apparently, services represented in this indicator (banks,post office, library) do not play a role in students’ leisure participa-tion and are located in other places than the leisure facilities usedby students.
In general, if a leisure trip is made to visit a bar/restaurant/café,travel distance will be less, since these facilities are more local,whereas facilities such as discotheques, cinemas, swimming poolsor sports facilities require more travel. Finally, it is found that, con-trolled for locational characteristics, students living independentlymake longer leisure trips as compared to those living with theirparents. Thus, students living independently may be more outgo-ing and inclined to spend more time travelling to leisure locations.
Apart from locational characteristics, several socio-demo-graphic and tie relationships influence travel distance. We find thatstudents in law, literature, etc. make longer leisure trips and thatsame-sex leisure trips tend to take place over shorter distances.No difference was found between males and females. In addition,some variables that might theoretically affect travel distance arenot found to do so for this sample. Owning a driving license andhaving access to a car do not influence trip distance, althoughabout 20% of the trips is made by car. Thus apparently, car is not
used to make longer trips than the combined options of walking,cycling and public transport. Also, frequency of contact is not re-lated to travel distance, although one might expect that if oneinteracts less frequently with someone, one is prepared to investmore travel in the joint activity.
5. Conclusion
This paper has investigated the spatial structure of students’ lei-sure trips and to what extent locational characteristics of socialnetwork partners influence decisions about their joint leisureactivities and travel. Descriptive analyses of our sample reveal thatstudents’ joint leisure trips are mostly made to visit bars, restau-rants, cinemas or discotheques. These activities usually last formore than 2 h and often involve short travel distances. Main travelmodes used include cycling, car and bus/tram. In many cases egoand alter use the same travel mode and have about the same traveldistance. Cluster analysis suggests that four typical leisure trip pat-terns can be derived. Three clusters seem to be determined by theresidential locations of ego and alter. Depending on the residentialdistance between ego and alter, leisure trip distances are eithershort for ego and alter (if residential distance is very short), some-what longer for both (if residential distance is slightly longer) orlong for at least one partner (if residential distance is large). Afourth cluster includes cases with long leisure trips for both part-ners, independent of residential distance, representing cases wherespecific destinations are visited. A more detailed analysis of traveldistance suggests that travel distance depends on size of the resi-dential municipality, residential distance and objective and per-ceived quality of leisure facilities such as cafés, bars andrestaurants. Overall, our study provides support for the idea thatleisure trip decisions should be understood on the level of socialnetwork ties (i.e. ego and alter) rather than based on individualcharacteristics only. Also, it provides support for the idea that a fo-cus on single ties, rather than on the structure of social networks asa whole, increases our insight in leisure trip decision making. Wefeel that the outcome of this and follow up studies could feed ef-forts in developing forecasting models of leisure travel based onsocial networks. In particular, reliable simulations of the spatialstructure of social networks, combined with the mechanismsfound in this paper could lead to more realistic prediction of jointleisure trips.
Although we feel that our results contribute to insight in jointleisure trip making, we recognize that this study can be extendedin a number of ways. First, it is noted that we used a very specificsample (students in higher education). It is recognized that thisgroup differs from other population segments in important ways.First, their time use patterns and corresponding time constraintswith respect to leisure differ from more time constrained groups,such as the working population, with potential implications for lei-sure trip decisions. On the other hand, their access to transporta-tion by car will be more limited. More importantly, the socialnetwork structure of students is likely to differ significantly fromthat of other groups. Social networks may be more local and basedin the residential area as compared to e.g. professionals who havemoved to other places for work and still maintain links with formerfellow students. On the other hand, students living independentlymay maintain networks in both their study town and home town.Further study is needed into the social network structures of differ-ent population segments in order to increase the understanding injoint leisure trip making.
Another limitation of this study is that we have focused on lei-sure trips made by two persons only, whereas travel parties mayalso consist of more individuals. Although Neutens et al. (2010)have looked into options for multi party leisure trips in a norma-
D. Ettema, D. Zwartbol / Journal of Transport Geography 31 (2013) 216–225 225
tive time-geographic framework, descriptive and modeling effortsof such trips are still lacking and require additional research.
References
Axhausen, K.W., 2008. Social networks, mobility biographies, and travel: surveychallenges. Environment and Planning B: Planning and Design 35, 981–996.
Bhat, C.R., Lockwood, A., 2004. On distinguishing between physically active andphysically passive episodes and between travel and activity episodes: ananalysis of weekend recreational participation in the San Francisco Bay area.Transportation Research Part A: Policy and Practice 38, 573–592.
Carrasco, J.-A., Miller, E.J., 2006. Exploring the propensity to perform socialactivities: a social network approach. Transportation 33, 463–480.
Carrasco, J.-A., Miller, E.J., 2009. The social dimension in action: a multilevel,personal networks model of social activity frequency between individuals.Transportation Research Part A: Policy and Practice 43, 90–104.
Cools, M., Moons, E., Wets, G., 2010. Assessing the impact of public holidays ontravel time expenditure: differentiation by trip motive. Transportation ResearchRecord: Journal of the Transportation Research Board 2157, 29–37.
Ettema, D., Schwanen, T., 2012. A relational approach to analysing leisure travel.Journal of Transport Geography 24, 173–181.
Farber, S., Páez, A., 2009. My car, my friends, and me: a preliminary analysis ofautomobility and social activity participation. Journal of Transport Geography17, 216–225.
Ginsberg, Y., 1975. Joint leisure activities and social networks in two neighborhoodsin Tel Aviv. Journal of Marriage and the Family 37, 668–676.
Hägerstrand, T., 1970. What about people in regional science? Papers in RegionalScience 24, 7–21.
Consumer choice of theme parks: a conjoint choice model of seasonality effectsand variety seeking behaviour. Leisure Sciences 22, 1–18.
Kwak, N., Campbell, S., 2010. Mobile communication and social capital: an analysisof geographically differentiated usage patterns. New Media and Society 12,435–451.
Limtanakool, N., Dijst, M., Schwanen, T., 2006. The influence of socioeconomiccharacteristics, land use and travel time considerations on mode choice for
medium- and longer-distance trips. Journal of Transport Geography 14, 327–341.
Mok, D., Wellman, B., Basu, R., 2007. Did distance matter before the Internet?Interpersonal contact and support in the 1970s. Social Networks 29, 430–461.
Neutens, T., Schwanen, T., Miller, H., 2010. Dealing with preferences, privileges andtiming in opportunities for joint activity participation. Geographical Analysis42, 245–266.
Ohnmacht, T., Götz, K., Schad, H., 2009. Leisure mobility styles in Swissconurbations: construction and empirical analysis. Transportation 36, 243–265.
Ren, F., Kwan, M.-P., 2009. The impact of the Internet on human activity–travelpatterns: analysis of gender differences using multi-group structural equationmodels. Journal of Transport Geography 17, 440–450.
Schad, H., Ohnmacht, T., Götz, K., 2009. Leisure mobility styles in Swissconurbations: construction and empirical analysis. Transportation 36, 243–265.
Scheiner, J., 2006. Does the car make elderly people happy and mobile? Settlementstructures, car availability and leisure mobility of the elderly. European Journalof Transport and Infrastructure Research 6, 151–172.
Schlich, R., Schönfelder, S., Hanson, S., Axhausen, K.W., 2004. Structures of leisuretravel: temporal and spatial variability. Transport Reviews 34, 219–237.
Sener, I.N., Copperman, R.B., Pendyala, R.M., Bhat, C.R., 2008. An analysis ofchildren’s leisure activity engagement: examining the day of week, location,physical activity level, and fixity dimensions. Transportation 35, 673–696.
Sharmeen, F., Ettema, D., 2010. Whom to Hang Out With and Where? Analysis ofthe Influence of Spatial Setting on the Choice of Activity Company. PaperPresented at the 12th WCTR Conference, 11–15 July, 2010, Lisbon, Portugal.
Silvis, J., Niemeier, D., D’Souza, R., 2006. Social Networks and Travel Behavior:Report from an Integrated Travel Diary. Paper Presented in the 11thInternational Conference on Travel Behaviour Research, Kyoto, Japan.
Stauffacher, M., Schlich, R., Axhausen, K.W., Scholz, R.W., 2005. The Diversity ofTravel Behaviour: Motives and Social Interactions in Leisure Time Activities.<http://e-collection.ethbib.ethz.ch/eserv/eth:28934/eth-28934-01.pdf>(accessed 07.10.10).
Tarigan, A.M., Kitamura, R., 2009. Week-to-week leisure trip frequency and itsvariability. Transportation Research Record 2135, 43–51.
Tillema, T., Dijst, M., 2007. Electronic and Face-to-Face Communication inMaintaining Social Relationships. Paper Presented in Workshop Frontiers inTransportation 2007, Amsterdam.
Wheeler, J.O., Stutz, F.P., 1971. Spatial dimensions of urban social travel. Annals ofthe Association of American Geographers 61, 371–386.