The Third International Conference on Innovation in High Performance Sailing Yachts, Lorient, France - 129 - 26 TH – 28 TH June, 2013 DELAYED DETACHED EDDY SIMULATION OF SAILING YACHT SAILS IM Viola, Yacht and Superyacht Research Group, School of Marine Science and Technology, Newcastle University, UK, (corresponding author) [email protected]S Bartesaghi, Mechanical Department, Politecnico di Milano, Italy. T Van-Renterghem, Yacht and Superyacht Research Group, School of Marine Science and Technology, Newcastle University, UK. R Ponzini, CINECA, SuperComputing Applications and Innovation Department (SCAI), Italy. Wind tunnel experiments on a 1:15 th model-scale AC33-class yacht were modelled with Reynolds- average Navier-Stokes simulations (RANS) and Delayed Detached Eddy Simulations (DDES). Numerical simulations were performed with two different grids, where the node distance was halved from the coarser to the finer grid, and with three different time steps, where the smallest one was 1/4 th of the largest one. High-grid-resolution DDES allowed drawing the topology of the turbulent structures in the sail wake and discovering new flow features, which were hardly detectable with low- grid-resolution DDES and, particularly, with RANS. It was found that the span-wise twist of the spinnaker leads to a mid-span helicoidal vortex, which has a horizontal axis almost parallel to the apparent wind and rotates in the same direction of the tip vortex generated from the head of the sail. Vortical span-wise tubes are released from the trailing edges of the mainsail and the spinnaker and, while convecting downstream, these structures roll around the tip and mid-span vortices of the spinnaker. Vortical tubes are also detached intermittently from the sails’ feet and these break down into smaller and smaller structures while convecting downstream. 1 INTRODUCTION Sailing yacht sails are efficient aerodynamic fins, which operate at low Reynolds numbers (Re). In particular, full- scale sails operates at Re of the order of 10 (based on the aerodynamic sail chords) but sails are commonly tested and optimised at Re of the order of 10 ହ using model-scale wind tunnel tests. Traditionally, low-Re aerodynamics ( ൎ 10 ସ െ 10 ହ ሻ has received somewhat less attention than high-speed aerodynamics ( 10 ሻ, though today there is an unmet need for fluid-dynamic efficiency in emerging applications where fins operate at low Re, such as autonomous underwater vehicles, micro aerial vehicles and small renewable energy converters. These applications could benefit from the research on sail aerodynamics and, particularly, on the analysis of some characteristic flow features of highly cambered twisted sails leading to good aerodynamic performance. On conventional thick airfoils at high Re the laminar-to- turbulent transition occurs near the leading edge. Therefore, the boundary layer is mostly turbulent allowing large entraining momentum from the outer layer and making it able to tolerate adverse pressure gradients due to the airfoil curvature. Conversely, on the suction side of airfoils at Re between roughly 5 ∙ 10 ସ and 3 ∙ 10 [1], a laminar boundary layer develops from the leading edge until separation occurs due to the adverse pressure gradient; then the unstable separated shear layer triggers the laminar-to-turbulent transition and reattachment occurs, leading to the ‘laminar separation bubble’ and to a turbulent boundary layer downstream the bubble. At low Re, the performance of conventional thick airfoils designed for high Re is poor and thinner airfoils may allow much higher maximum lift and lift/drag ratio than thick airfoils [2,3]. Sails are very thin airfoils and the flow separates at the leading edge due to the sharpness of the edge, leading to a high suction peak [4] (Figure 1). The laminar-to-turbulent transition occurs in the separated shear layer, leading to reattachment and then to the development of a turbulent boundary layer. Further downstream along the chord, the sail curvature leads to a second suction peak. Highly cambered sails show significant trailing edge separation due to the adverse pressure gradient correlated with the sail curvature, but allow a very high driving force. The sharp leading edge and the second suction peak due to the sail curvature are typical of sails and unusual on airfoils. Figure 1 shows the typical flow and pressure fields when the complementary angle between the true wind velocity and the boat velocity is larger than 90°, leading the boat to experience a wind coming between roughly 45° and 90° from her bow. In these conditions, modern sailing yachts use a highly cambered foresail, namely the spinnaker, and flatter and smaller aft sail, namely the mainsail. Spinnaker (foresail) and mainsail (aftsail) can be compared with the two superimposed wings used by biplanes. The chord and span of the fins of an aircraft and a yacht are of the same order of magnitude but the thickness and the Re of yacht fins are more than one order of magnitude smaller than those of aircrafts. Differently from aircraft wings, sails are significantly twisted and cambered both chord-wise and span-wise. For instance, the spinnaker analysed in this paper has an aspect ratio (span/mean-chord) of 1.8 ሺ2326mm/ 1297mmሻ, a span-wise twist angle (horizontal angle between the lowest and highest chords) of more than 17°,
Transcript
The Third International Conference on Innovation in High Performance Sailing Yachts, Lorient, France
- 129 -
26TH
– 28TH
June, 2013
DELAYED DETACHED EDDY SIMULATION OF SAILING YACHT SAILS IM Viola, Yacht and Superyacht Research Group, School of Marine Science and Technology, Newcastle University, UK, (corresponding author) [email protected] S Bartesaghi, Mechanical Department, Politecnico di Milano, Italy. T Van-Renterghem, Yacht and Superyacht Research Group, School of Marine Science and Technology, Newcastle University, UK. R Ponzini, CINECA, SuperComputing Applications and Innovation Department (SCAI), Italy.
Wind tunnel experiments on a 1:15th model-scale AC33-class yacht were modelled with Reynolds-average Navier-Stokes simulations (RANS) and Delayed Detached Eddy Simulations (DDES). Numerical simulations were performed with two different grids, where the node distance was halved from the coarser to the finer grid, and with three different time steps, where the smallest one was 1/4th of the largest one. High-grid-resolution DDES allowed drawing the topology of the turbulent structures in the sail wake and discovering new flow features, which were hardly detectable with low-grid-resolution DDES and, particularly, with RANS. It was found that the span-wise twist of the spinnaker leads to a mid-span helicoidal vortex, which has a horizontal axis almost parallel to the apparent wind and rotates in the same direction of the tip vortex generated from the head of the sail. Vortical span-wise tubes are released from the trailing edges of the mainsail and the spinnaker and, while convecting downstream, these structures roll around the tip and mid-span vortices of the spinnaker. Vortical tubes are also detached intermittently from the sails’ feet and these break down into smaller and smaller structures while convecting downstream.
1 INTRODUCTION Sailing yacht sails are efficient aerodynamic fins, which operate at low Reynolds numbers (Re). In particular, full-scale sails operates at Re of the order of 10 (based on the aerodynamic sail chords) but sails are commonly tested and optimised at Re of the order of 10 using model-scale wind tunnel tests. Traditionally, low-Re aerodynamics ( 10 10 has received somewhat less attention than high-speed aerodynamics ( 10 , though today there is an unmet need for fluid-dynamic efficiency in emerging applications where fins operate at low Re, such as autonomous underwater vehicles, micro aerial vehicles and small renewable energy converters. These applications could benefit from the research on sail aerodynamics and, particularly, on the analysis of some characteristic flow features of highly cambered twisted sails leading to good aerodynamic performance. On conventional thick airfoils at high Re the laminar-to-turbulent transition occurs near the leading edge. Therefore, the boundary layer is mostly turbulent allowing large entraining momentum from the outer layer and making it able to tolerate adverse pressure gradients due to the airfoil curvature. Conversely, on the suction side of airfoils at Re between roughly 5 ∙ 10 and 3 ∙ 10 [1], a laminar boundary layer develops from the leading edge until separation occurs due to the adverse pressure gradient; then the unstable separated shear layer triggers the laminar-to-turbulent transition and reattachment occurs, leading to the ‘laminar separation bubble’ and to a turbulent boundary layer downstream the bubble. At low Re, the performance of conventional thick airfoils designed for high Re is poor and thinner airfoils may
allow much higher maximum lift and lift/drag ratio than thick airfoils [2,3]. Sails are very thin airfoils and the flow separates at the leading edge due to the sharpness of the edge, leading to a high suction peak [4] (Figure 1). The laminar-to-turbulent transition occurs in the separated shear layer, leading to reattachment and then to the development of a turbulent boundary layer. Further downstream along the chord, the sail curvature leads to a second suction peak. Highly cambered sails show significant trailing edge separation due to the adverse pressure gradient correlated with the sail curvature, but allow a very high driving force. The sharp leading edge and the second suction peak due to the sail curvature are typical of sails and unusual on airfoils. Figure 1 shows the typical flow and pressure fields when the complementary angle between the true wind velocity and the boat velocity is larger than 90°, leading the boat to experience a wind coming between roughly 45° and 90° from her bow. In these conditions, modern sailing yachts use a highly cambered foresail, namely the spinnaker, and flatter and smaller aft sail, namely the mainsail. Spinnaker (foresail) and mainsail (aftsail) can be compared with the two superimposed wings used by biplanes. The chord and span of the fins of an aircraft and a yacht are of the same order of magnitude but the thickness and the Re of yacht fins are more than one order of magnitude smaller than those of aircrafts. Differently from aircraft wings, sails are significantly twisted and cambered both chord-wise and span-wise. For instance, the spinnaker analysed in this paper has an aspect ratio (span/mean-chord) of 1.8 2326mm/1297mm , a span-wise twist angle (horizontal angle between the lowest and highest chords) of more than 17°,
TThe Third In
a chord-wiswise cambmoderates tof the onsethe apparenvectorial divelocity, atowards theThe bi-camgeometry o
Figure 1: Ty
Figure 2: Tsailing yach The studyexperimentare very co
S
A-4
-3
-2
-1
Cp 0
+1
Leadbub
P
WIND�
nternational
se camber of ber of the increase ot flow experient wind. In ifference betw
and it increase stern of the mbered (chorf the sails lead
ypical flow an
Twist of the aht
y of sails’ally or numeomplicated fo
Spinnaker
Asymmetric Spinn
M
Leadinbubble
ding edgeble
Trailing edge separa on
Pressure coeffic
l Conferenc
f of the of the spa
of angle of attaenced by a safact, the app
ween the true ses and rotatboat with the
rd-wise and ds to a charact
nd pressure di
apparent wind
’ wake caerically. Full
or wake meas
naker
ast Mainsail
ng edgee
cient
e on Innova
chord, and a an. The sail ack due to the
ailing yacht, nparent wind
wind and thetes from thee height (Figuspan-wise) twteristic wake.
mulations. Poeffects, whicNavier-StokeRe and the c
ical Simulatist be modelleels. ReynoldANS) have bels [18] and, rical and expeh the growth f grid cells incry three yearsd cells of thee [19] used aten years latere order 107. Ray [15] comp
RANS to thoood numericalns of the sails ections, whereas under-pred
own by the first publish
performed DES). Howevas [22] stated
of an ACC-p, though no [23] presentedtails were provIn the presenwith both RAsteps, are pres
ructured as fotal tests are inodelling the ils of the equ
grids and thd to run the ess the numf forces and ption, the genesimulations is
g Yachts, Lo
e, 2013
However, forcsured in full scasured atmospeasurement acsted in wind kness/chord ra
However, PIVin wind tunn
nd only unpud. Flow visualnfortunately ththe very highstudy sail w
otential flow ch are dominaes solvers mucomplex 3D ions (DNS) ed with turbulds-averaged een performed
since then erimental force
of computaticreased by abors: Hedges et e order 103, tha number of gr Viola [20] usRichards and Lpared pressur
ose measured il-experimentabut larger dif
e the suctiondicted by CFD
authors, thehed investig
with Dever, it must d that DES w-V5-class yacresults were
d few resultsvided to verifynt paper, the w
ANS and DESsented.
ollows: in the Mntroduced andexperiments
uations solvedhe time steps
simulations. merical uncerpressures is alseral flow fields presented, an
orient, Fran
ces [5-9] ancale, though t
pheric boundaccuracy. Modtunnels, whe
atio can be usV and LDnels due to tublished smolisation is easihin models a
h hydrodynamwakes is usin
codes cannant in the wa
ust be used. Tgeometry maunfeasible an
lence models Navier-Stok
d since 1996 othe agreeme
es has increasional resourceout one order al. [18] used
hree years latgrid cells of tsed a number Lasher [21] anre distributioin wind tunne
al agreement offerences on t
n peak near tD.
present papgation on saetached Edd
be noted thwas used in tcht for the 32
presented; ans achieved wify the validity wind tunnel te, using differe
Method sectiod the numeric
are described, the bounda
tested, and tThe procedu
rtainty in tso presented.
d computed wind details of t
nce
nd the ary del ere ed
DV the ke ier are
mic ng
not ake he
ake nd or
kes on ent ed es. of
d a ter the of nd
ons els. on the the
per ail dy hat the 2nd nd ith of
est ent
on, cal ed, ary the ure the In ith the
TThe Third In
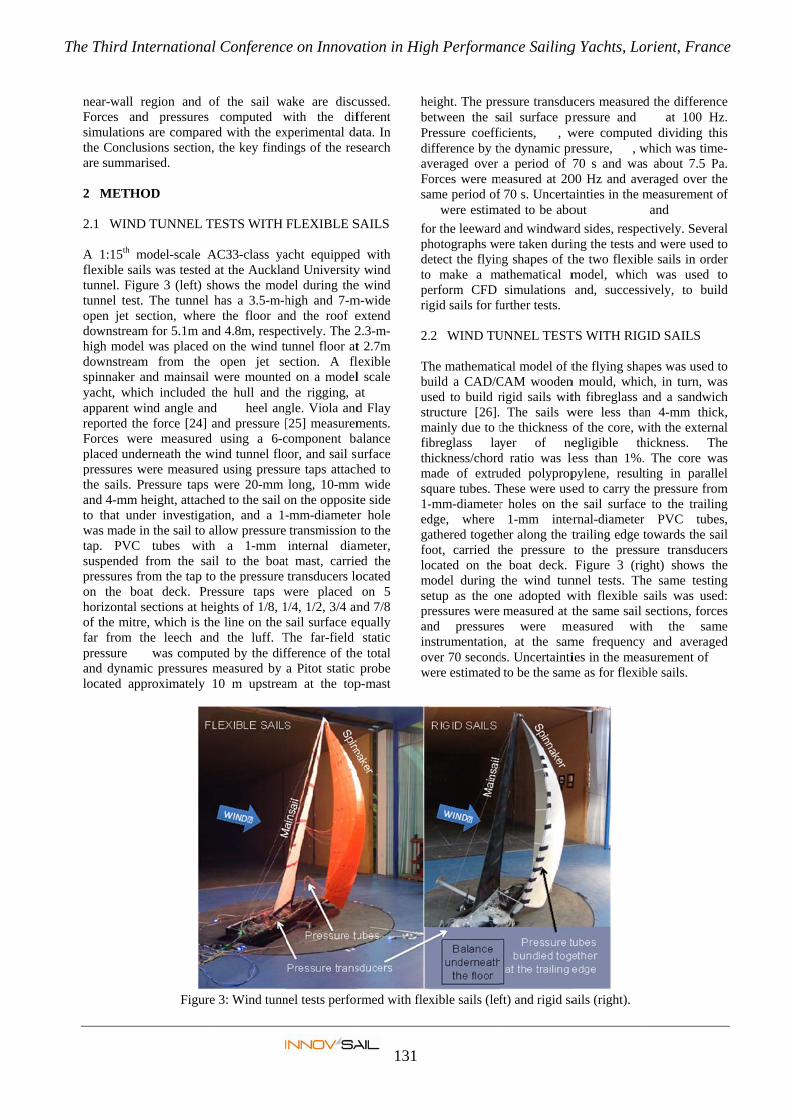
near-wall rForces andsimulationsthe Conclusare summar 2 METHO 2.1 WIND A 1:15th mflexible sailtunnel. Figutunnel test.open jet sedownstreamhigh modeldownstreamspinnaker ayacht, whicapparent wreported theForces werplaced undepressures wthe sails. Pand 4-mm hto that undwas made intap. PVC suspended pressures fron the bohorizontal sof the mitrefar from tpressure and dynamlocated app
nternational
region and od pressures s are comparesions section, rised.
OD
D TUNNEL TE
model-scale Als was tested ure 3 (left) sh The tunnel hection, wherem for 5.1m anl was placed om from the and mainsail wch included tind angle ande force [24] are measured erneath the w
were measuredPressure taps wheight, attacheder investigatn the sail to a
tubes withfrom the sai
rom the tap tooat deck. Presections at heie, which is ththe leech and
was computmic pressures m
proximately 1
Figure
l Conferenc
of the sail wcomputed w
ed with the ex the key findi
ESTS WITH
AC33-class yaat the Aucklahows the modhas a 3.5-m-h
e the floor and 4.8m, respeon the wind tu
open jet sewere mountedthe hull and td heel angand pressure [
using a 6-cwind tunnel flod using pressuwere 20-mm ed to the sail oion, and a 1-
allow pressureh a 1-mm il to the boato the pressure essure taps wights of 1/8, 1e line on the d the luff. Tted by the difmeasured by 10 m upstrea
e 3: Wind tunn
e on Innova
ake are discuwith the difxperimental daings of the res
FLEXIBLE S
acht equippedand Universitydel during thehigh and 7-mnd the roof eectively. The 2unnel floor atection. A fld on a modelthe rigging, agle. Viola and[25] measuremcomponent baoor, and sail suure taps attachlong, 10-mm
on the opposit-mm-diametertransmission internal diamt mast, carrietransducers lo
were placed 1/4, 1/2, 3/4 ansail surface eq
The far-field fference of thea Pitot static
am at the top
nel tests perfor
ation in Hig
131
ussed. fferent ata. In search
SAILS
d with y wind e wind
m-wide extend 2.3-m-t 2.7m lexible l scale at d Flay ments. alance urface hed to
eight. The preetween the saressure coeffiifference by thveraged over orces were mame period of
were estima
or the leewardhotographs weetect the flyino make a merform CFD gid sails for fu
.2 WIND TU
he mathematiuild a CAD/Csed to build rtructure [26].
mainly due to tbreglass lay
hickness/chordmade of extruquare tubes. T-mm-diameterdge, where athered togethoot, carried tocated on the
model during etup as the oressures were nd pressuresnstrumentationver 70 second
were estimated
xible sails (lef
ance Sailing
28TH
June
essure transduail surface pricients, , whe dynamic pra period of 7
measured at 20f 70 s. Uncertaated to be abo
d and windwarere taken duri
ng shapes of thathematical msimulations
urther tests.
UNNEL TEST
cal model of tCAM woodenrigid sails wit
The sails wthe thickness oyer of ned ratio was leuded polypropThese were user holes on the
1-mm inteher along the tthe pressure e boat deck. the wind tunne adopted wmeasured at t
s were mn, at the samds. Uncertainti
to be the sam
ft) and rigid sa
g Yachts, Lo
e, 2013
ucers measureressure and
were computeressure, , w70 s and wa
00 Hz and avainties in the mout
rd sides, respeing the tests anthe two flexibmodel, whichand, success
TS WITH RIG
the flying shan mould, whicth fibreglass awere less thaof the core, wegligible thess than 1%.pylene, resulted to carry th
he sail surfaceernal-diametertrailing edge to the pressuFigure 3 (ri
nnel tests. Thwith flexible the same sail
measured witme frequencyies in the mea
me as for flexib
ails (right).
orient, Fran
d the differen at 100 H
ed dividing thwhich was tims about 7.5 Peraged over tmeasurement and
ectively. Severnd were used le sails in ordh was used sively, to bui
GID SAILS
apes was used ch, in turn, wand a sandwi
an 4-mm thicwith the externhickness. T. The core wting in parall
he pressure froe to the trailinr PVC tubetowards the sure transduceght) shows t
he same testinsails was usesections, forcth the sam
y and averagasurement of ble sails.
nce
nce Hz. his
me-Pa. the of
ral to
der to
ild
to was
ch ck, nal he
was lel
om ng es, ail ers the ng ed: ces me ged
The Third International Conference on Innovation in High Performance Sailing Yachts, Lorient, France
132
26TH
– 28TH
June, 2013
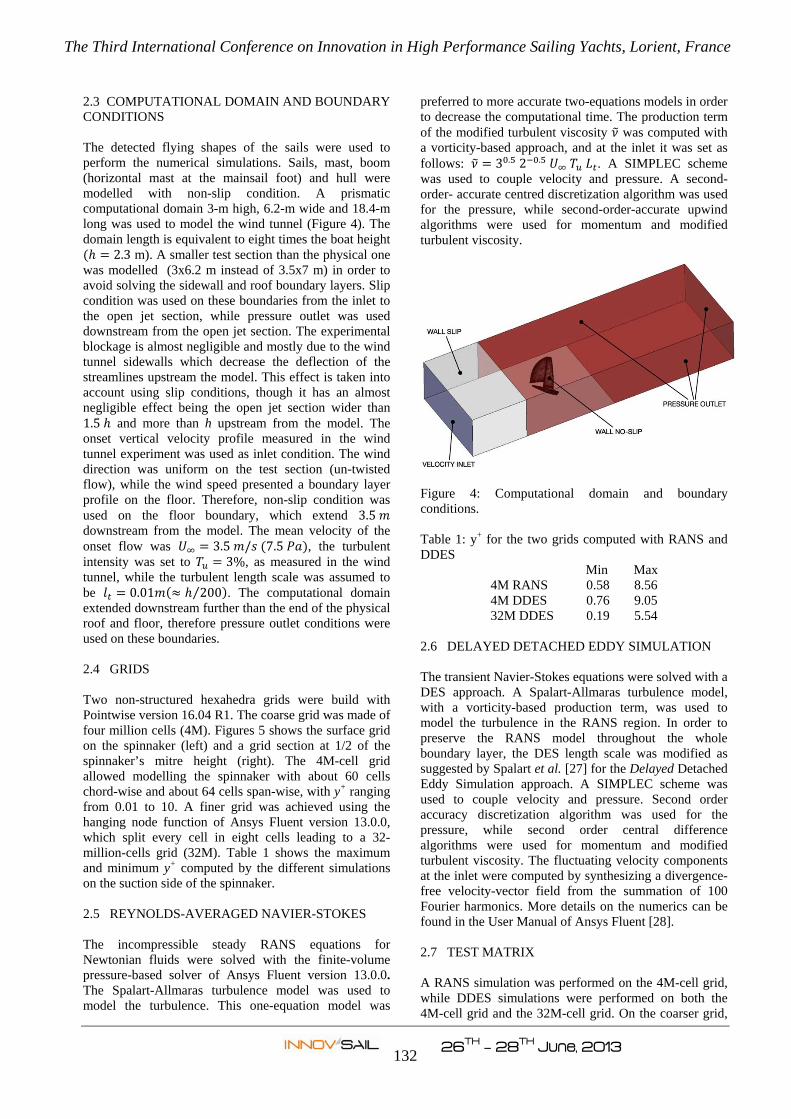
2.3 COMPUTATIONAL DOMAIN AND BOUNDARY CONDITIONS The detected flying shapes of the sails were used to perform the numerical simulations. Sails, mast, boom (horizontal mast at the mainsail foot) and hull were modelled with non-slip condition. A prismatic computational domain 3-m high, 6.2-m wide and 18.4-m long was used to model the wind tunnel (Figure 4). The domain length is equivalent to eight times the boat height
2.3 m). A smaller test section than the physical one was modelled (3x6.2 m instead of 3.5x7 m) in order to avoid solving the sidewall and roof boundary layers. Slip condition was used on these boundaries from the inlet to the open jet section, while pressure outlet was used downstream from the open jet section. The experimental blockage is almost negligible and mostly due to the wind tunnel sidewalls which decrease the deflection of the streamlines upstream the model. This effect is taken into account using slip conditions, though it has an almost negligible effect being the open jet section wider than 1.5 and more than h upstream from the model. The onset vertical velocity profile measured in the wind tunnel experiment was used as inlet condition. The wind direction was uniform on the test section (un-twisted flow), while the wind speed presented a boundary layer profile on the floor. Therefore, non-slip condition was used on the floor boundary, which extend 3.5 downstream from the model. The mean velocity of the onset flow was 3.5 / 7.5 , the turbulent intensity was set to 3%, as measured in the wind tunnel, while the turbulent length scale was assumed to be 0.01 200⁄ . The computational domain extended downstream further than the end of the physical roof and floor, therefore pressure outlet conditions were used on these boundaries. 2.4 GRIDS Two non-structured hexahedra grids were build with Pointwise version 16.04 R1. The coarse grid was made of four million cells (4M). Figures 5 shows the surface grid on the spinnaker (left) and a grid section at 1/2 of the spinnaker’s mitre height (right). The 4M-cell grid allowed modelling the spinnaker with about 60 cells chord-wise and about 64 cells span-wise, with y+ ranging from 0.01 to 10. A finer grid was achieved using the hanging node function of Ansys Fluent version 13.0.0, which split every cell in eight cells leading to a 32-million-cells grid (32M). Table 1 shows the maximum and minimum y+ computed by the different simulations on the suction side of the spinnaker. 2.5 REYNOLDS-AVERAGED NAVIER-STOKES The incompressible steady RANS equations for Newtonian fluids were solved with the finite-volume pressure-based solver of Ansys Fluent version 13.0.0. The Spalart-Allmaras turbulence model was used to model the turbulence. This one-equation model was
preferred to more accurate two-equations models in order to decrease the computational time. The production term of the modified turbulent viscosity was computed with a vorticity-based approach, and at the inlet it was set as follows: 3 . 2 . . A SIMPLEC scheme was used to couple velocity and pressure. A second-order- accurate centred discretization algorithm was used for the pressure, while second-order-accurate upwind algorithms were used for momentum and modified turbulent viscosity.
Figure 4: Computational domain and boundary conditions. Table 1: y+ for the two grids computed with RANS and DDES
Min Max 4M RANS 0.58 8.56 4M DDES 0.76 9.05 32M DDES 0.19 5.54
2.6 DELAYED DETACHED EDDY SIMULATION The transient Navier-Stokes equations were solved with a DES approach. A Spalart-Allmaras turbulence model, with a vorticity-based production term, was used to model the turbulence in the RANS region. In order to preserve the RANS model throughout the whole boundary layer, the DES length scale was modified as suggested by Spalart et al. [27] for the Delayed Detached Eddy Simulation approach. A SIMPLEC scheme was used to couple velocity and pressure. Second order accuracy discretization algorithm was used for the pressure, while second order central difference algorithms were used for momentum and modified turbulent viscosity. The fluctuating velocity components at the inlet were computed by synthesizing a divergence-free velocity-vector field from the summation of 100 Fourier harmonics. More details on the numerics can be found in the User Manual of Ansys Fluent [28]. 2.7 TEST MATRIX A RANS simulation was performed on the 4M-cell grid, while DDES simulations were performed on both the 4M-cell grid and the 32M-cell grid. On the coarser grid,
The Third International Conference on Innovation in High Performance Sailing Yachts, Lorient, France
133
26TH
– 28TH
June, 2013
three different time steps were tested, 0.001 s, 0.002 s and 0.0005 s, in order to estimate the uncertainty due to the time discretisation, while the maximum number of iterations per time step was kept constant to 20, allowing convergence at each time step. All these time steps allowed Courant numbers in the sails’ wake lower than one. For instance, with a time step of 0.001 s and the 4M-cells grid, the Courant number ranged from 10 to 10 . On the 32M-cell grid, only the intermediate time step (0.001 s) was used with 20 iterations per time step. Table 2 summarises the numerical simulations performed. All the numerical simulations ran until convergence was achieved for the aerodynamic forces. In particular, lift, drag and heeling moment were monitored. Forces, pressure and velocity fields computed with DDES were averaged over a period of 10 s. For example, Figure 6 (left) shows the convergence of the drag coefficient of the two sails (hull and rigging excluded) for the DDES simulations performed with high grid resolution. Table 2: Test matrix of the numerical simulations Space Time Method discretisation discretisation
RANS 4M-cell grid Steady DDES 4M-cell grid 0.0005 s DDES 4M-cell grid 0.0010 s DDES 4M-cell grid 0.0020 s DDES 32M-cell grid 0.0010 s 2.8 HARDWARE All simulations were performed in double precision on a 64-bit Hewlett-Packard Linux cluster made of 336 nodes HP 2x220 2xIntel Exa-cores 3.166 GHz — 24Gb RAM per node interconnected with Infiniband QDR and a node HP DL980 8 CPU Intel E5420 — 512 GB RAM for post-processing and results visualization. In order to take advantage of the High Performance Computing system, a preliminary scalability test using the smallest grid was performed. According to the scalability results the calculations on the different grid sizes have been performed using up to 256 computational cores. 2.9 VERIFICATION Different time and grid resolutions allowed estimating the numerical uncertainty for forces and pressures with DDES. This estimate is only approximate; in fact DDES
does not necessarily show asymptotic convergence with increasing resolution [29]. The uncertainty at 95% confidence level was computed following the guidelines of Viola et al. [30]. For example, the uncertainty due to the time step for the
CD were estimated using Equations (1):
1.51
0.00050.002
where and are the maximum and the minimum CD, respectively, between those computed with time steps 0.0005 s, 0.001 s and 0.002 s. The uncertainty due to the grid for the CD were
estimated using Equations (2):
1.51 √4
√32
where and are the maximum and the minimum CD, respectively, between those computed with the 4M-cells grid and the 32M-cells grid, respectively. The convergence uncertainty was estimated as two times the standard deviation of the time history of each quantity ∅. For instance, Figure 6 (right) shows the mean (dotted line) and the uncertainty (error bar) of the drag coefficient: ∅ . The convergence uncertainties for CD and CL were 0.016 and 0.010 ,
respectively. The numerical uncertainty was then computed as the L2-norm of the uncertainties due to the time step and due to the grid, plus the convergence uncertainty, which is not under the square root because it is not independent from the other two uncertainties (Equation 3):
∅ ∅ ∅ ∅ 3
The resulting uncertainties for the aerodynamic forces were 0.11 and 0.096 ; while the largest numerical uncertainty for the pressure coefficient was 1.6.
TThe Third In
Figure 5: Si
Figure 6: C 3. RESUL The DES astructures tapproach soidentificatioeffect on tsections, firflow field, reattaches discuss the then discusforces andRANS, DE
nternational
ide view of th
Convergence o
LTS
approach allothat have nevo far. The keyon of these strthe sails’ merstly we provthen we showalong the spdifferent flow
ss similaritied the pressurS and measur
l Conferenc
he spinnaker’s
f for the D
owed the idever been solvy findings of tructures, and tean pressuresvide an overvw where the pinnaker surfw structures ins and differere distributionred experimen
e on Innova
grid and plan
DDES 32M sim
ntification ofved with a Rthis research athe analysis o. In the next
view of the gflow separate
face, and then the sail wakences betweens computed
ntally.
ation in Hig
134
n view on a se
mulation (left)
f flow RANS are the of their t sub-
general es and en we ke. We en the d with
3. Ficoartacaprdedumsp Thsp
gh Performa
26TH
– 2
ction at the sp
) and example
.1 GENERA
igure 7 showomputed withre coloured byandem wings ambered thanressure differelta pressures ue to the favo
mainsail experipinnaker.
he flow is attpinnaker near
ance Sailing
28TH
June
pinnaker’s mid
e of convergen
L FLOW FIE
s the general h RANS usingy flow velocitwhere the spthe mainsail
rence across ton the spinna
ourable upwasiences the un
ached on the the leading e
g Yachts, Lo
e, 2013
d height.
nce uncertaint
ELD
flow field arg the 4M-cellty. The two spinnaker is lal. The grey sthe sail surfaaker than on tsh of the mai
nfavourable do
leeward (suctedge, while n
orient, Fran
y (right)
round the yacl grid. Pathlinails behave liarger and moscale shows tace. The largthe mainsail ainsail, while townwash of t
tion) side of tnear the trailin
nce
cht nes ke
ore the ger are the the
the ng
The Third International Conference on Innovation in High Performance Sailing Yachts, Lorient, France
135
26TH
– 28TH
June, 2013
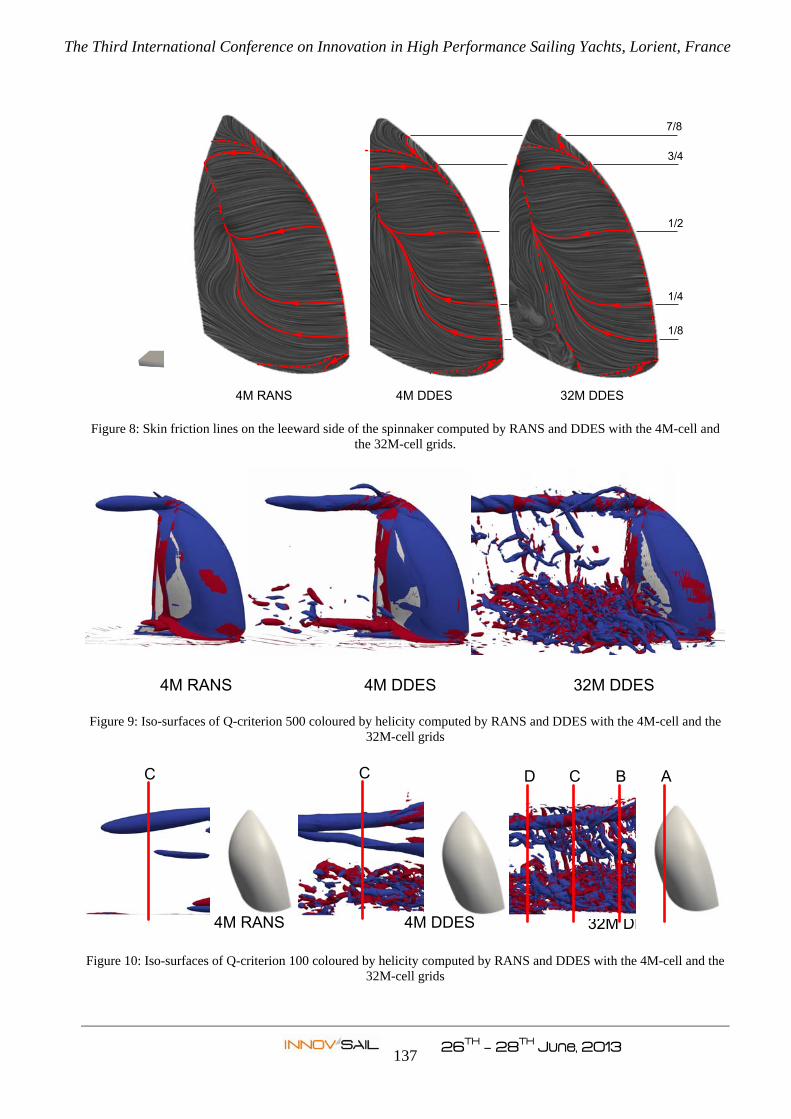
edge separation occurs. Streamlines from the leading edge converge towards two vortical structures: the tip vortex at the head of the sails and a parallel vortex at mid-span height. As far as is known by the present authors, this mid-span vortex, which will be discussed in sub-sections, has never been identified before. It is due to the span-wise camber, which leads to convergence of streamlines toward mid-span. Most of the separated flow, downstream of the trailing edge separation, is convected into this vortex. On the windward (pressure) side, the flow is attached and the streamlines, which are not showed in Figure 7, are slightly deflected upwards. This is due to the trailing edge being somewhat higher than the leading edge. In fact, the lower corner of the trailing edge, namely the clew (Figure 5), is higher than the lower corner of the leading edge, namely the tack. Only those streamlines which are near the sail foot are attracted by the suction on the leeward side and are thus deflected downward convecting into the separated flow region downstream the sail foot. 3.2 NEAR-WALL REGION Figure 8 shows skin friction lines on the leeward surface of the spinnaker computed with the 4M-cells-grid RANS (left), the 4M-cells-grid DDES (centre), and the 32M-cells-grid DDES (right). Results for the two DDES simulations are achieved with a time step of 0.001 s and we showed the instantaneous solution at 30 s. Mean skin friction lines for DDES were not computed within the timeframe of this research project. Representative skin friction lines, highlighted with a solid red line, show that the flow is mainly attached in the region near the leading edge, while trailing edge separation occurs (dash-dotted line) somewhere on the second half of the chord. As a reference, several fractions of the spinnaker mitre (the line equidistant from the leading and trailing edge) are showed on the right-end side of Figure 8. Between ½ and ¾ of the mitre, the flow is mostly horizontal before trailing edge separation occurs. Conversely, below ½ of the mitre, the attached boundary layer is deflected upwards. In the separated region downstream of the trailing edge separation, the flow from the lower region moves upwards and converges towards the trailing edge separation line (dash-dotted line) between ½ and ¾ of the mitre. It is interesting to note that the flow field near the spinnaker’s clew is computed differently with low and high-grid resolution. Only DDES with high grid resolution predicts a clear trailing-edge separation from ¾ of the mitre to the sail foot, while RANS and DDES computed with low grid resolution do not show a continuous trailing-edge separation line. Near the sail foot, the flow from the leading edge is deflected downwards due to the low pressure associated with the highly curved streamlines coming from the windward side and rolling over the sail foot.
Near the leading edge, a laminar-separation bubble occurs. In sail aerodynamics the separation is associated with the sharp leading edge and it is continuous along all the leading edge from the head to the foot. In conventional wings, such as those used in aeronautics, the laminar separation bubble occurs only in the middle of the wing and not near the root and the tip. For this reason it is called laminar-separation “bubble”. Therefore, in sail aerodynamics, it may be more appropriate to use laminar-separation “tube”. The laminar-separation tube (LST) is smaller near the sail foot and becomes progressively larger towards the sail’s head. The flow within the LST has a strong vertical component, as observed also by Viola et al [15], transferring kinetic energy from the lower sections to the tip vortex. The 32M-DDES results are in very good agreement with the visual observations performed in the wind tunnel with rigid sails. In particular, the position of separation and reattachment lines were qualitatively confirmed using a stick with a wool tail. However, the vertical flow component of the flow in the region around mid-chord at 1/8 of the mitre height seemed over predicted. 3.3 WAKE Figure 9 shows iso-surfaces of Q-criterion [31] equal to 500. The higher the Q-criterion, the more the flow rotation dominates the strain and the shear of the flow, therefore it can be interpreted as an index of the coherency of the flow structure. Iso-surfaces are coloured by the sign of the helicity, red being positive and blue negative. Helicity is computed with reference to the right-handed (positive) Cartesian coordinate system, where the x, y, z axes are the longitudinal, transverse and vertical axes of the wind tunnel, positive towards the inlet, towards leeward and upwards, respectively. On the left in Figure 9 the results for the 4M-cell grid solved with a RANS approach are presented. The leeward side of the spinnaker is mostly covered by an iso-surface with negative helicity. The negative helicity is due to the negative span-wise vorticity of the boundary layer. Near the trailing edge, separation occurs leading to less coherent flow structures and lower values of the Q-criterion. The tip vortex from the spinnaker’s head is the larger visible flow structure. It convects along an axis which is almost aligned with the wind direction. A similar vortex develops from the spinnaker’s clew (lower corner of the trailing edge), and rotates in the opposite direction than the head vortex. Interestingly, the mid-span vortex is not visible, meaning that its coherency is weaker than those of the visualised structures. In the centre of Figure 9, the same grid is solved with a DDES approach. Despite the low grid resolution (4M-cells), LES allows solving these flow structures with a much greater extent than RANS. In particular, we found that the tip vortex generated from the head of the
The Third International Conference on Innovation in High Performance Sailing Yachts, Lorient, France
136
26TH
– 28TH
June, 2013
mainsail rolls around the spinnaker’s tip vortex. Also, small flow structures, which become more visible with the 32M-cells-grid DDES (right in Figure 9), appear near the sail foot. These are chord-wise-stretched vortices generated from the spinnaker’s foot and convected downstream intermittently, breaking down into smaller and smaller structures. Span-wise-stretched vortices are generated from the trailing edge with a significantly lower frequency than those from the sail foot. The few periods computed with the simulations did not allowed an accurate measurement of these frequencies. Decreasing the Q-criterion from 500 to 100, it is possible to see that these vortices do not break down as quickly as those from the foot but, conversely, are stretched between the tip vortex and the mid-span vortex. Figure 10 shows the same comparison between different simulations as Figure 9 but with a different prospective view and decreasing the Q-criterion to 100. In order to allow the spinnaker to be visible, the iso-surface of Q-criterion is hidden in a near-wall region. While the mid-span vortex is hardly visible for the RANS simulation, it appears clearly in the two DDES simulations. In particular, with low grid resolution (centre in Figure 10), the mid-span vortex is showed by a continuous vortical tube while its complicated structure is revealed using higher grid resolution. Figure 11 shows four views of the Q-criterion iso-surfaces computed with the 32M-cells-grid DDES. In the four different views, only the flow structures upstream of
section A, B, C and D (Figure 10), respectively, are shown. This sequence allows the visualisation of the correlation between the various flow structures in the sail wake. The vertically stretched trailing edge vortex rolls around the tip and the mid-span vortices, which both have horizontal axes and rotate clock-wise. Therefore, the trailing edge vortex, which is a tube parallel to the trailing edge when detached form the sail, assumes an ‘S’ shape while convecting downstream. The ‘S’ shape is schematically showed with a solid yellow line in Figure 12 (right), while dotted lines show the two axes of the tip and mid-span vortices. The weaker trailing edge vortex of the mainsail also rolls around the tip and mid-span vortices, but due to its windward position with respect to the mid-span vortex, it is broken down into two vortices schematically showed by two white solid lines in Figure 12 (right). Figure 12 shows the differences between 4M-RANS, 4M-DDES and 32M-DDES in modelling the evolution of the spinnaker and mainsail trailing edge vortices. In particular, the same view as Figure 11(C) is used in Figure 12. The axes of the tip and mid-span vortices computed with high grid resolution are superimposed for comparison on the low grid-resolution RANS and DES, revealing that the lower grid resolution leads also to different directions of the axes. Videos of the simulations, which are available on the webpage of the first author [www.ignazioviola.com], show that the directions of these axes are stationary but different for the two DDES simulations.
Figure 7: Pathlines computed with RANS on the 4M-cell grid.
High Δp
Low Δp
High Vel
Low Vel
The Third International Conference on Innovation in High Performance Sailing Yachts, Lorient, France
137
26TH
– 28TH
June, 2013
Figure 8: Skin friction lines on the leeward side of the spinnaker computed by RANS and DDES with the 4M-cell and the 32M-cell grids.
Figure 9: Iso-surfaces of Q-criterion 500 coloured by helicity computed by RANS and DDES with the 4M-cell and the 32M-cell grids
Figure 10: Iso-surfaces of Q-criterion 100 coloured by helicity computed by RANS and DDES with the 4M-cell and the 32M-cell grids
7/8
3/4
1/2
1/4
1/8
4M RANS 4M DDES 32M DDES
4M RANS 4M DDES 32M DDES
4M DDES 32M DDES
BCD ACC
4M RANS
The Third International Conference on Innovation in High Performance Sailing Yachts, Lorient, France
138
26TH
– 28TH
June, 2013
Figure 11: Iso-surfaces of Q-criterion 100 coloured by helicity computed by DDES with the 32M-cell grid viewed from four different positions downstream the yacht model.
Figure 12: Iso-surfaces of Q-criterion 100 coloured by helicity computed by RANS and DDES with the 4M-cell and the 32M-cell grids viewed from position ‘C’.
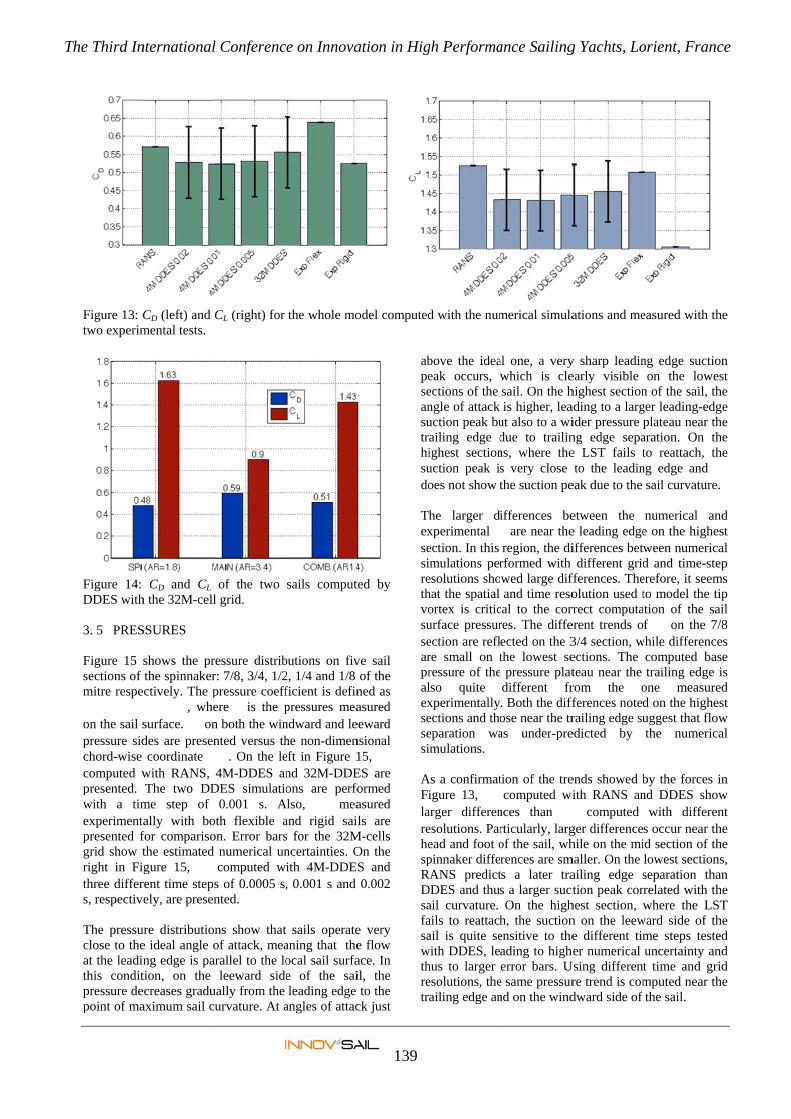
3.4 FORCES The forces measured with the two experiments showed significant differences and the numerical results of the different simulations are mostly in between the experimental ranges. Figure 13 show the drag and lift coefficients (CD and CL, respectively) experimentally measured and numerically computed. Coefficients are defined as the total aerodynamic force acting on the sails, rigging and hull, divided by the far field dynamic pressure and the sail surface. The experimental CD ranges between 0.52 for the rigid sails to 0.64 for the flexible sails, while the CD computed with the different DDES simulations ranges between 0.52 and 0.56. Similarly, experimental CL ranges between 1.31 for rigid sails to 1.51 for flexible sails, while CL computed with the different DDES simulations ranges between 1.43 and 1.46. CD and CL computed with RANS show the maximum differences with the experimental data. In particular, while CD is between the maximum and minimum experimental CD, while CL is 1% higher than the largest experimental CL (flexible sails). CD and CL
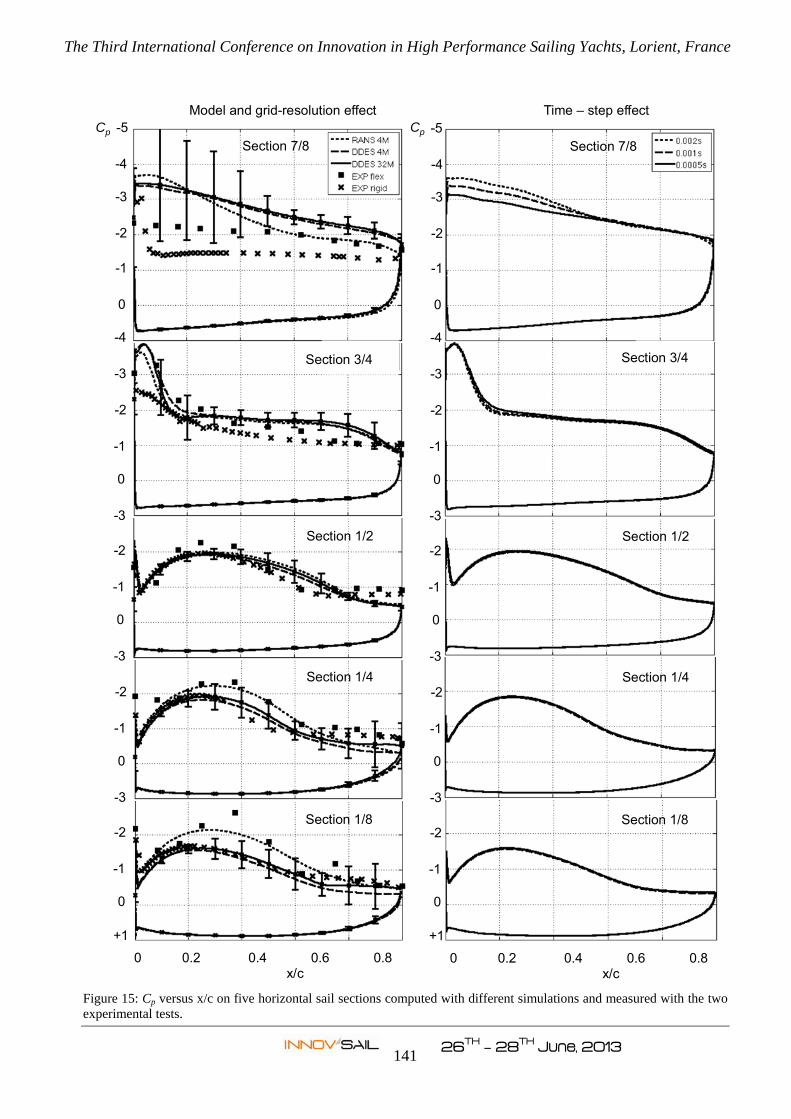
computed with DDES are lower than those computed with RANS, though their trends are to increase with the time and the space resolution. However, different resolutions lead to small differences. In particular, differences are smaller than 1% and 3% for CD and CL, respectively. Interestingly, RANS and DDES with the same grid resolution show larger differences than two DDES simulations where the grid resolution is doubled. Figure 14 shows the breakdown of the aerodynamic coefficients for the spinnaker, the mainsail and the two sails combined but without hull and rigging. For the three cases, the coefficients were computed using only the sail area of the spinnaker, mainsail and the two sails together, respectively. These broken-down coefficients, which are achieved with difficulty with experimental tests, show that the spinnaker is significantly more efficient than the mainsail, having higher CL and lower CD, despite its aspect ratio is about half the one of the mainsail. This is largely due to the upwash and downwash experienced by spinnaker and mainsail, respectively.
A B C D
32M DDES 32M DDES 32M DDES 32M DDES
C C C
4M DDES 32M DDES 4M RANS
TThe Third In
Figure 13: Ctwo experim
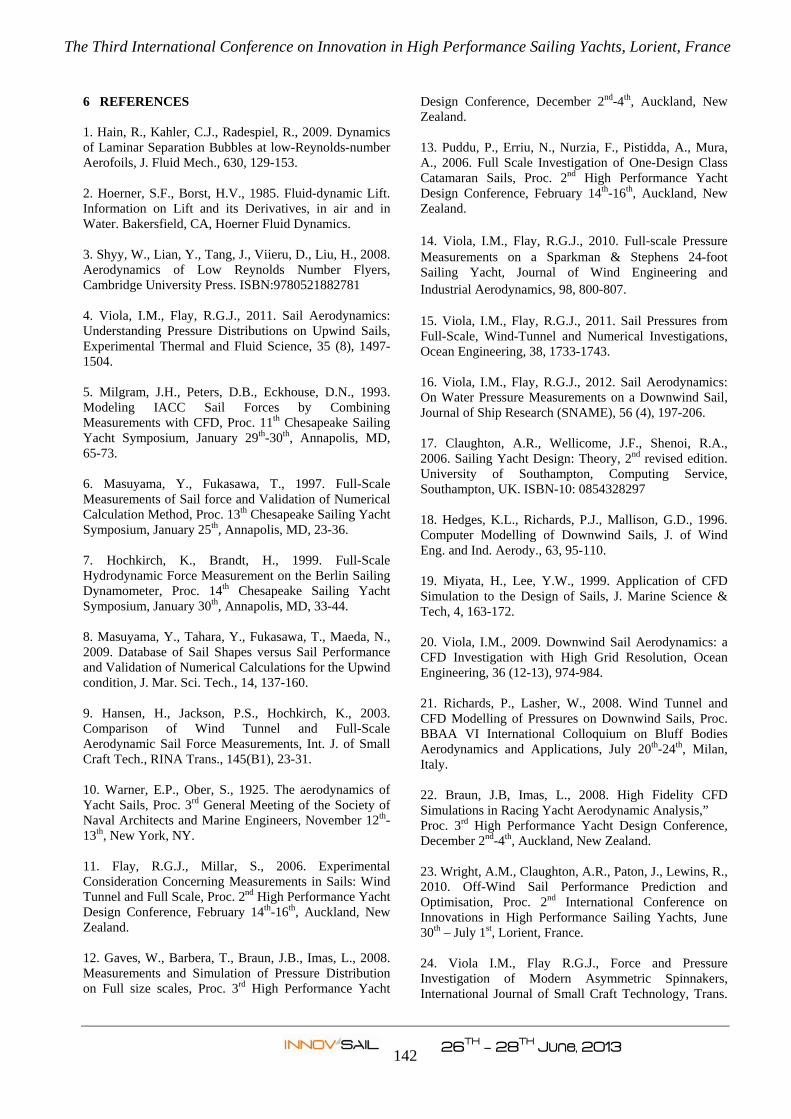
Figure 14: DDES with 3. 5 PRES Figure 15 sections of mitre respe
on the sail spressure sidchord-wise computed wpresented. with a timexperimentpresented fgrid show tright in Fithree differs, respectiv The pressuclose to theat the leadinthis conditpressure depoint of ma
nternational
CD (left) and mental tests.
CD and CL h the 32M-cell
SSURES
shows the prthe spinnaker
ectively. The p, whe
surface. ondes are presencoordinate
with RANS, The two DD
me step of ally with bofor comparisothe estimated gure 15,
rent time stepsely, are presen
ure distributioe ideal angle ong edge is pation, on the ecreases graduaximum sail c
l Conferenc
CL (right) for
of the two l grid.
ressure distribr: 7/8, 3/4, 1/2pressure coeffere is the pn both the winnted versus th
. On the le4M-DDES an
DES simulatio0.001 s. A
oth flexible aon. Error bars
numerical uncomputed w
s of 0.0005 s,nted.
ns show thatof attack, mea
arallel to the loleeward side
ually from the urvature. At a
e on Innova
the whole mo
sails comput
butions on fiv2, 1/4 and 1/8 ficient is definpressures meandward and lehe non-dimeneft in Figure 1nd 32M-DDEons are perfo
Also, meaand rigid sails for the 32Mncertainties. Oith 4M-DDES, 0.001 s and
sails operateaning that theocal sail surfae of the saileading edge
bove the ideaeak occurs, wections of the ngle of attack uction peak buailing edge dighest sectionuction peak isoes not show t
he larger dixperimental ection. In this imulations peresolutions shohat the spatial ortex is criticurface pressurection are reflre small on tressure of thelso quite xperimentallyections and thoeparation waimulations.
As a confirmatigure 13,
arger differenesolutions. Paread and foot opinnaker diffe
RANS predictDDES and thuail curvature. ails to reattachail is quite se
with DDES, lehus to larger esolutions, theailing edge an
ance Sailing
28TH
June
merical simula
al one, a verywhich is clesail. On the his higher, lea
ut also to a widue to trailinns, where thes very close the suction pe
ifferences be are near the
region, the dirformed with wed large difand time reso
cal to the corres. The diffeected on the 3the lowest se pressure platdifferent fr. Both the diffose near the tras under-pre
tion of the trecomputed wi
nces than rticularly, largof the sail, whrences are smts a later tras a larger suctOn the high
h, the suctionensitive to theading to higherror bars. U
e same pressurnd on the wind
g Yachts, Lo
e, 2013
ations and me
y sharp leadinearly visible highest sectionading to a largider pressure png edge sepae LST fails tto the leadin
eak due to the
etween the e leading edgeifferences betwdifferent grid
fferences. Theolution used trrect computaerent trends o3/4 section, wections. The teau near the rom the offerences notedrailing edge suedicted by
ends showed bwith RANS an
computed ger differencehile on the mi
maller. On the ailing edge sction peak corhest section, wn on the leewe different tim
her numerical Using different
re trend is comdward side of
orient, Fran
easured with t
ng edge suctioon the lowe
n of the sail, tger leading-edplateau near taration. On tto reattach, t
ng edge and sail curvature
numerical ane on the higheween numericd and time-sterefore, it seemto model the tation of the saf on the 7
while differenccomputed batrailing edge
one measurd on the higheuggest that flothe numeric
by the forces nd DDES sho
with differes occur near tid section of tlowest sectionseparation threlated with twhere the LS
ward side of tme steps testuncertainty ant time and grmputed near tthe sail.
nce
the
on est the dge the the the
e.
nd est cal tep ms tip ail
7/8
ces ase
is red est ow cal
in ow ent the the ns,
han the ST the ted nd rid the
The Third International Conference on Innovation in High Performance Sailing Yachts, Lorient, France
140
26TH
– 28TH
June, 2013
The experimental tests presented in this paper are the first of their kind and the large differences between measured with flexible and rigid sails show that the level of accuracy of these tests is still quite poor. The differences between the two measurements are probably due to differences in the sail shapes used during the two experiments. In fact, on one hand the shape of flexible sails is measured with difficulty, and on the other hand rigid sails may experience deformations due to their own weight, being suspended only from the head and tack corners. The numerical simulations are based on the flexible-sail flying shapes, which were also used to build the mould for the rigid sails. Further investigations are in progress in order to establish if the main source of inaccuracy is the photogrammetric reconstruction of the flexible sails or the deformation of the rigid sails. In the first case, the geometry modelled numerically would be more similar to the rigid sails, while in the second case it would be more similar to the flexible sails. 4 CONCLUSIONS In the present work, wind tunnel experiments on a 1:15th model-scale sailing yacht were modelled with RANS (Reynolds-average Navier-Stokes simulations) and DDES (Delayed Detached Eddy Simulations), allowing new insights on the aerodynamics of sails. In particular, sails are efficient aerodynamic fins, which operate at low Reynolds numbers. The tested configuration foresaw two sails in tandem where the spinnaker (foresail) had larger sail area, low aspect ratio and high camber, while the mainsail (aftsail) had smaller sail area, higher aspect ratio and less camber. Most of the aerodynamic load was carried by the spinnaker, which experienced the upwash of the mainsail. Experiments were performed with both flexible and rigid sails, and both global aerodynamic forces and pressure distributions on sails were measured. Numerical simulations were performed with two different grids, where the node distance was halved from the coarser to the finer grid, and with three different time steps, where the smallest one was 1/4 of the largest one. The high grid and space resolution allowed modelling the flow near the sails with high accuracy. An attached boundary layer was found on the windward side (pressure side) of the sails while the flow separates on the leeward side (suction side) along all the leading edge of the spinnaker. Laminar to turbulent transition occurs on the separated shear layer and the flow reattaches on most of the sail but not on the highest region, creating a span-wise-axis laminar separation tube. The reattached turbulent boundary layer grows along the sail chord for more than half chord, when trailing edge separation occurs. High-grid-resolution DDES allowed drawing the topology of the sail’s wake and discovering new flow features, which were barely detectable with low-grid-
resolution DDES and, particularly, with RANS. A helicoidal tip vortex is generated from the head of the spinnaker and convects downstream in the direction of the far field velocity. The tip vortex from the head of the mainsail rolls around the former one. The span-wise twist of the spinnaker also leads to a mid-span helicoidal vortex having a horizontal axis and rotating in the same direction of the tip vortex. It should be noted that the mid-span vortex has never been reported by previous authors, and its role on the aerodynamic performance of the sail should be further explored. Vortical span-wise tubes are released from the trailing edges of the mainsail and the spinnaker and, while convecting downstream, these structures roll around the tip and mid-span vortices of the spinnaker. Vortical tubes are also detached intermittently from the sails’ feet and these break down into smaller and smaller structures while convecting downstream. The comparison between the different numerical models showed that DDES allow a step change in the understanding of the sails’ wake topology. Importantly, the more resolved sail wake led to differences on the pressure distributions on the sails and thus on the global aerodynamic performances. Forces and surface pressures computed with DDES were in better agreement with the experimental data than those computed with RANS, though significant differences between the measurements performed with flexible and rigid sails did not allow a proper verification of the numerical simulations. DDES with different time and space resolutions led to similar forces and pressure distributions, while RANS led to significantly different pressure distributions and, particularly to higher suction on the leeward side on the lowest sections of the spinnaker, leading to larger global aerodynamic forces. While the forces predicted by DDES were between the maximum and the minimum forces measured with flexible and rigid sails, RANS predicted a lift force 1% and 17% larger than the those measured with flexible and rigid sails, respectively. Therefore DDES seems to be able to predict sail performance more accurately than RANS. Forces and pressures were almost independent from the time and space resolutions tested in the present work. The largest differences were observed on the suction side of the spinnaker in the region of separated flow: on the highest sections near the leading edge and downstream from the trailing edge separation. 5 ACKNOWLEDGEMENTS This research was supported in part by CILEA Interuniversity Consortium (Italy), CFD Technologies (UK) and ANSYS (Italy), who kindly provided HPC resources, licences of Pointwise and Fluent, respectively.
The Third International Conference on Innovation in High Performance Sailing Yachts, Lorient, France
141
26TH
– 28TH
June, 2013
Figure 15: Cp versus x/c on five horizontal sail sections computed with different simulations and measured with the two experimental tests.
-5
-4
-3
-2
-1
0
-4
-3
-2
-1
0
-3
-2
-1
0
-3
-2
-1
0
-3
-2
-1
0
+1
0 0.2 0.4 0.6 0.8 1 x/c
Section 7/8
Section 3/4
Section 1/2
Section 1/4
Section 1/8
Cp -5
-4
-3
-2
-1
0
-4
-3
-2
-1
0
-3
-2
-1
0
-3
-2
-1
0
-3
-2
-1
0
+1
0 0.2 0.4 0.6 0.8 x/c
Section 7/8
Section 1/2
Section 1/4
Section 1/8
Model and grid-resolution effect Time – step effect Cp
Section 3/4
The Third International Conference on Innovation in High Performance Sailing Yachts, Lorient, France
142
26TH
– 28TH
June, 2013
6 REFERENCES 1. Hain, R., Kahler, C.J., Radespiel, R., 2009. Dynamics of Laminar Separation Bubbles at low-Reynolds-number Aerofoils, J. Fluid Mech., 630, 129-153. 2. Hoerner, S.F., Borst, H.V., 1985. Fluid-dynamic Lift. Information on Lift and its Derivatives, in air and in Water. Bakersfield, CA, Hoerner Fluid Dynamics. 3. Shyy, W., Lian, Y., Tang, J., Viieru, D., Liu, H., 2008. Aerodynamics of Low Reynolds Number Flyers, Cambridge University Press. ISBN:9780521882781 4. Viola, I.M., Flay, R.G.J., 2011. Sail Aerodynamics: Understanding Pressure Distributions on Upwind Sails, Experimental Thermal and Fluid Science, 35 (8), 1497-1504. 5. Milgram, J.H., Peters, D.B., Eckhouse, D.N., 1993. Modeling IACC Sail Forces by Combining Measurements with CFD, Proc. 11th Chesapeake Sailing Yacht Symposium, January 29th-30th, Annapolis, MD, 65-73. 6. Masuyama, Y., Fukasawa, T., 1997. Full-Scale Measurements of Sail force and Validation of Numerical Calculation Method, Proc. 13th Chesapeake Sailing Yacht Symposium, January 25th, Annapolis, MD, 23-36. 7. Hochkirch, K., Brandt, H., 1999. Full-Scale Hydrodynamic Force Measurement on the Berlin Sailing Dynamometer, Proc. 14th Chesapeake Sailing Yacht Symposium, January 30th, Annapolis, MD, 33-44. 8. Masuyama, Y., Tahara, Y., Fukasawa, T., Maeda, N., 2009. Database of Sail Shapes versus Sail Performance and Validation of Numerical Calculations for the Upwind condition, J. Mar. Sci. Tech., 14, 137-160. 9. Hansen, H., Jackson, P.S., Hochkirch, K., 2003. Comparison of Wind Tunnel and Full-Scale Aerodynamic Sail Force Measurements, Int. J. of Small Craft Tech., RINA Trans., 145(B1), 23-31. 10. Warner, E.P., Ober, S., 1925. The aerodynamics of Yacht Sails, Proc. 3rd General Meeting of the Society of Naval Architects and Marine Engineers, November 12th-13th, New York, NY. 11. Flay, R.G.J., Millar, S., 2006. Experimental Consideration Concerning Measurements in Sails: Wind Tunnel and Full Scale, Proc. 2nd High Performance Yacht Design Conference, February 14th-16th, Auckland, New Zealand. 12. Gaves, W., Barbera, T., Braun, J.B., Imas, L., 2008. Measurements and Simulation of Pressure Distribution on Full size scales, Proc. 3rd High Performance Yacht
Design Conference, December 2nd-4th, Auckland, New Zealand. 13. Puddu, P., Erriu, N., Nurzia, F., Pistidda, A., Mura, A., 2006. Full Scale Investigation of One-Design Class Catamaran Sails, Proc. 2nd High Performance Yacht Design Conference, February 14th-16th, Auckland, New Zealand. 14. Viola, I.M., Flay, R.G.J., 2010. Full‐scale Pressure Measurements on a Sparkman & Stephens 24-foot Sailing Yacht, Journal of Wind Engineering and Industrial Aerodynamics, 98, 800‐807. 15. Viola, I.M., Flay, R.G.J., 2011. Sail Pressures from Full-Scale, Wind-Tunnel and Numerical Investigations, Ocean Engineering, 38, 1733-1743. 16. Viola, I.M., Flay, R.G.J., 2012. Sail Aerodynamics: On Water Pressure Measurements on a Downwind Sail, Journal of Ship Research (SNAME), 56 (4), 197-206. 17. Claughton, A.R., Wellicome, J.F., Shenoi, R.A., 2006. Sailing Yacht Design: Theory, 2nd revised edition. University of Southampton, Computing Service, Southampton, UK. ISBN-10: 0854328297 18. Hedges, K.L., Richards, P.J., Mallison, G.D., 1996. Computer Modelling of Downwind Sails, J. of Wind Eng. and Ind. Aerody., 63, 95-110. 19. Miyata, H., Lee, Y.W., 1999. Application of CFD Simulation to the Design of Sails, J. Marine Science & Tech, 4, 163-172. 20. Viola, I.M., 2009. Downwind Sail Aerodynamics: a CFD Investigation with High Grid Resolution, Ocean Engineering, 36 (12-13), 974-984. 21. Richards, P., Lasher, W., 2008. Wind Tunnel and CFD Modelling of Pressures on Downwind Sails, Proc. BBAA VI International Colloquium on Bluff Bodies Aerodynamics and Applications, July 20th-24th, Milan, Italy. 22. Braun, J.B, Imas, L., 2008. High Fidelity CFD Simulations in Racing Yacht Aerodynamic Analysis,” Proc. 3rd High Performance Yacht Design Conference, December 2nd-4th, Auckland, New Zealand. 23. Wright, A.M., Claughton, A.R., Paton, J., Lewins, R., 2010. Off-Wind Sail Performance Prediction and Optimisation, Proc. 2nd International Conference on Innovations in High Performance Sailing Yachts, June 30th – July 1st, Lorient, France. 24. Viola I.M., Flay R.G.J., Force and Pressure Investigation of Modern Asymmetric Spinnakers, International Journal of Small Craft Technology, Trans.
The Third International Conference on Innovation in High Performance Sailing Yachts, Lorient, France
143
26TH
– 28TH
June, 2013
RINA, 151 (B2), 31‐40, 2009 (Discussion in Trans. RINA, 152 (B1), 51‐ 53, 2010). 25. Viola I.M., Flay R.G.J., Pressure Distribution on Modern Asymmetric Spinnakers, International Journal of Small Craft Technology, Trans. RINA, 152 (B1) 41‐50, 2010. 26. Bot, P., Viola, I.M., Flay, R.G.J., 2013. Wind-Tunnel Pressure Measurements on Model-Scale Rigid Downwind Sails. Proc. 3rd International Conference on Innovations in High Performance Sailing Yachts, June 26th– 29th, Lorient, France. 27. Spalart, P.R., Deck, S., Shur, M.L., Squires, K.D., Strelets, M.K., Travin, A., 2006. A new version of detached-eddy simulation, resistant to ambiguous grid densities. Theoretical and Computational Fluid Dynamics, 20, 181-195. 28. ANSYS FLUENT 12.0/12.1 Documentation, 2010. ANSYS Inc., Canonsburg, PA. 29. Spalart, P.R., 2009. Detached Eddy Simulation, Ann. Rev. Fluid Mech., 41, 181-202. 30. Viola I.M., Bot P., Riotte M., 2013 (in press). On the Uncertainty of CFD in Sail Aerodynamics, International Journal for Numerical Methods in Fluids. DOI: 10.1002/fld.3780. 31. Hunt, J.C.R., Wray, A.A., Moin, P., 1988. Eddies, stream, and convergence zones in turbulent flows. Center for Turbulence Research Report, CTR-S88, 193–208.
AUTHORS BIOGRAPHY Ignazio Maria Viola, PhD, is Lecturer in Naval Architecture at the School of Marine Science and Technology of Newcastle University, UK. He has a background in applied fluid dynamics and a specialist expertise in yacht engineering. His previous experience includes a Post Doctoral Fellowship at the Yacht Research Unit (University of Auckland), which was Scientific Advisor of the America’s Cup team Emirates Team New Zealand, and a PhD (Politecnico di Milano) on experimental and numerical modelling of the aerodynamics of sailing yachts, sponsored by the America’s Cup team Luna Rossa. Ignazio is Group Leader of the Yacht and Superyacht Research Group at Newcastle University, he serves in several international committees including the CFD Specialist Committee of the ITTC, he is Member of the Editorial Board of the Journal of Small Craft Technology, Reviewer for more than ten international journals and has written more than 50 peer-reviewed publications since 2008. Simone Bartesaghi, PhD, is a former PhD student of the Politecnico di Milano (Italy) who joined the Yacht and Superyacht Research Group for an internship of six months under the supervision of Dr Viola. Simone has a research interest on Computational Fluid Dynamics and, particularly, on its applications to yacht engineering. His previous experience includes Master in Yacht Design (110/110) at Politecnico di Milano and Università degli Studi di Genova. Other projects include consultancies for the small craft industry and yacht designers. In close collaboration with PortoRicerca snc, he was in the design team as CFD RANS analyst for the new design VOR70’s CAMPER/Emirates Team New Zealand Volvo Ocean Race 2011-2012 campaign, 2nd overall and 24h-speed record. Thomas Van-Renteghem is a former student of the engineering school Arts et Métiers Paris Tech, who joined the Yacht and Superyacht Research Group for an internship of nine months under the supervision of Dr Viola. Simone has a research interest on fluid dynamics and, particularly, on its applications to yacht engineering and aeronautics. Thomas is currently employed by Airbus (Toulouse). Raffaele Ponzini, PhD, is a member of the Super-Computing Applications and Innovation Department of CINECA, which is the largest Italian supercomputer centre. Raffaele, who was awarded a PhD in Bioengineering at the Politecnico di Milano in 2007, has a specialist expertise in High Performance Computing and Computational Fluid Dynamics. His research interests also include multiscale models in hemodynamics, and scientific visualization.