Dr. Richard Aynsley Director of Research & Development Big Ass Fan Co. THE THRUST OF ANSI/AMCA 230-07 AMCA International Engineering Conference Las Vegas, NV, USA 2 – 4 March 2008 ENGINEERING PAPER 5245-08
Transcript
Dr. Richard Aynsley Director of Research & Development
Big Ass Fan Co.
THE THRUST OF ANSI/AMCA 230-07
AMCA International Engineering Conference Las Vegas, NV, USA 2 – 4 March 2008
ENGINEERING PAPER5245-08
The Thrust of ANSI/AMCA 230-07
Richard Aynsley Big Ass Fan Company, Lexington, KY
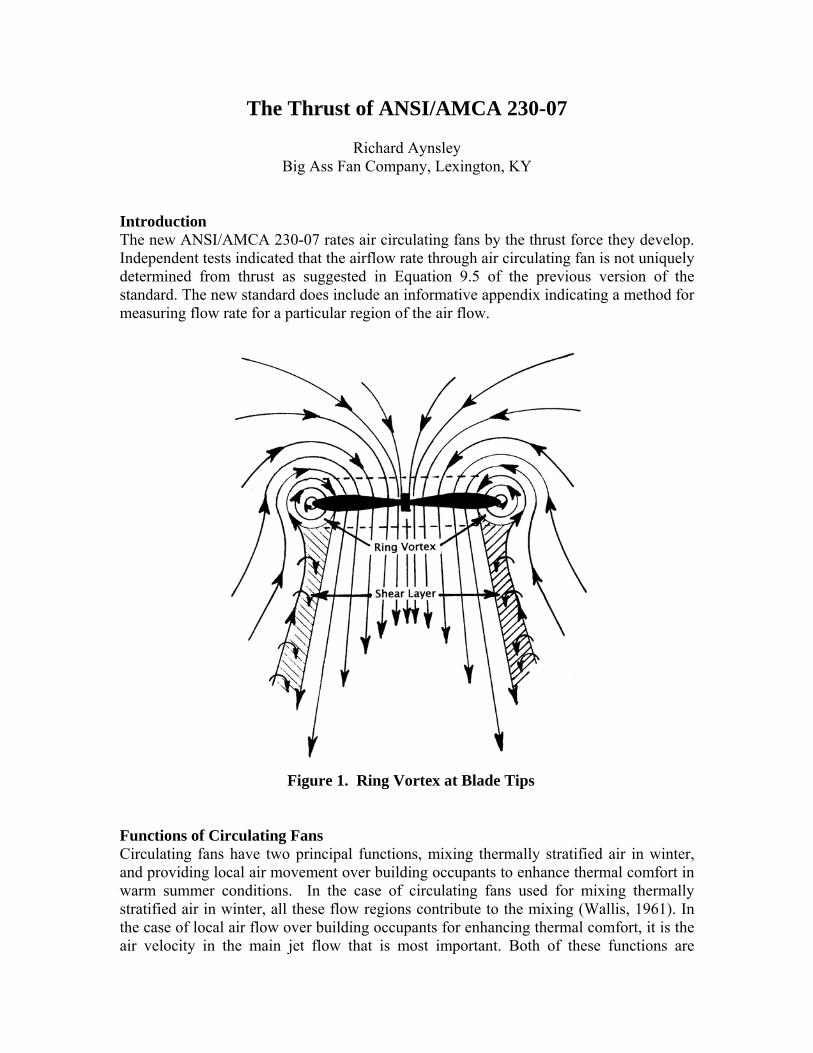
Introduction The new ANSI/AMCA 230-07 rates air circulating fans by the thrust force they develop. Independent tests indicated that the airflow rate through air circulating fan is not uniquely determined from thrust as suggested in Equation 9.5 of the previous version of the standard. The new standard does include an informative appendix indicating a method for measuring flow rate for a particular region of the air flow.
Figure 1. Ring Vortex at Blade Tips Functions of Circulating Fans Circulating fans have two principal functions, mixing thermally stratified air in winter, and providing local air movement over building occupants to enhance thermal comfort in warm summer conditions. In the case of circulating fans used for mixing thermally stratified air in winter, all these flow regions contribute to the mixing (Wallis, 1961). In the case of local air flow over building occupants for enhancing thermal comfort, it is the air velocity in the main jet flow that is most important. Both of these functions are
sensitive to local air speed over the skin, and not particularly to the CFM rating of a circulating fan. In the case of circulating fans used for mixing air in winter, is important that the mixing be achieved without exceeding a mean velocity of 40 fpm. This is the threshold velocity at which air flow can be felt over the skin and higher velocities should be avoided or occupants will complain of drafts in winter. Cooling Effect of Air Flow Heat exchange between the human body and the surrounding environment is complex (Parsons, 2003). A number of single number indexes have been developed to address this complexity. One of these indexes is the Standard Effective Temperature signified as SET*. Calculating SET* is complex and computers are commonly used for this task. One readily available computer program for this purpose is the ASHRAE Thermal Comfort Tool. To compute the SET* using this tool the following data are required:
• Air temperature ºF • Mean radiant temperature ºF (if surface temperatures of the enclosing space are less than 4ºC above ambient Air temperature, then mean radiant temp. ≈ air temperature) • Air velocity fpm • Relative humidity % • Metabolic rate met (see Appendix A in ASHRAE Standard 55-2004) • Clothing Insulation clo (see Appendix B in ASHRAE Standard 55-2004)
Note: summer clothing should be loose fitting to allow air movement between the clothing and the skin. SET* can be used to indicate the cooling effect of elevated air velocities
Example
When: Air temperature = 95 ºF Mean radiant temperature = 95 ºF Air velocity = 590.6 fpm Relative humidity = 70 % Metabolic rate = 1.0 met Clothing Insulation = 0.22 clo
SET* = 84.8 ºF (Computed using the ASHRAE Thermal Comfort Tool software)
Without the benefit of 3.0 m/s air velocity and only a nominal air velocity 0.15 m/s. This is a typical value used for assessing people engaged in light sedentary activity of 1.0 met.
Air temperature = 95 ºF Mean radiant temperature = 95 ºF Air velocity = 29.5 fpm Relative humidity = 70 % Metabolic rate = 1.0 met Clothing Insulation = 0.22 clo
SET* = 97.3 ºF The influence of elevating a uniform air speed from 29.5 fpm to 590.6 fpm can be seen to be 12.5 ºF, the difference between 97.3 ºF and 84.8 ºF , the two otherwise identical SET* conditions. This cooling effect can be used to either evaluate the benefit of air speed through natural ventilated spaces, or to offset summer air conditioning cooling loads to save energy in air conditioned space. Air Speed Preferences Air movement can have a significant influence on human thermal comfort. Wind chill in cold conditions is detrimental but air movement in neutral to warm environments is considered beneficial. This is because normally under conditions with air temperatures above about 73.4 ºF, the body needs to lose heat in order to maintain a constant internal temperature (Parsons, 2003). Survey data from the Center for Built Environment at the University of California Berkeley clearly show this preference for more air movement Figure 2.
Figure 2. Percentage preference for air movement versus thermal sensation
(CBE Berkeley survey data (Zhang et al, 2006)
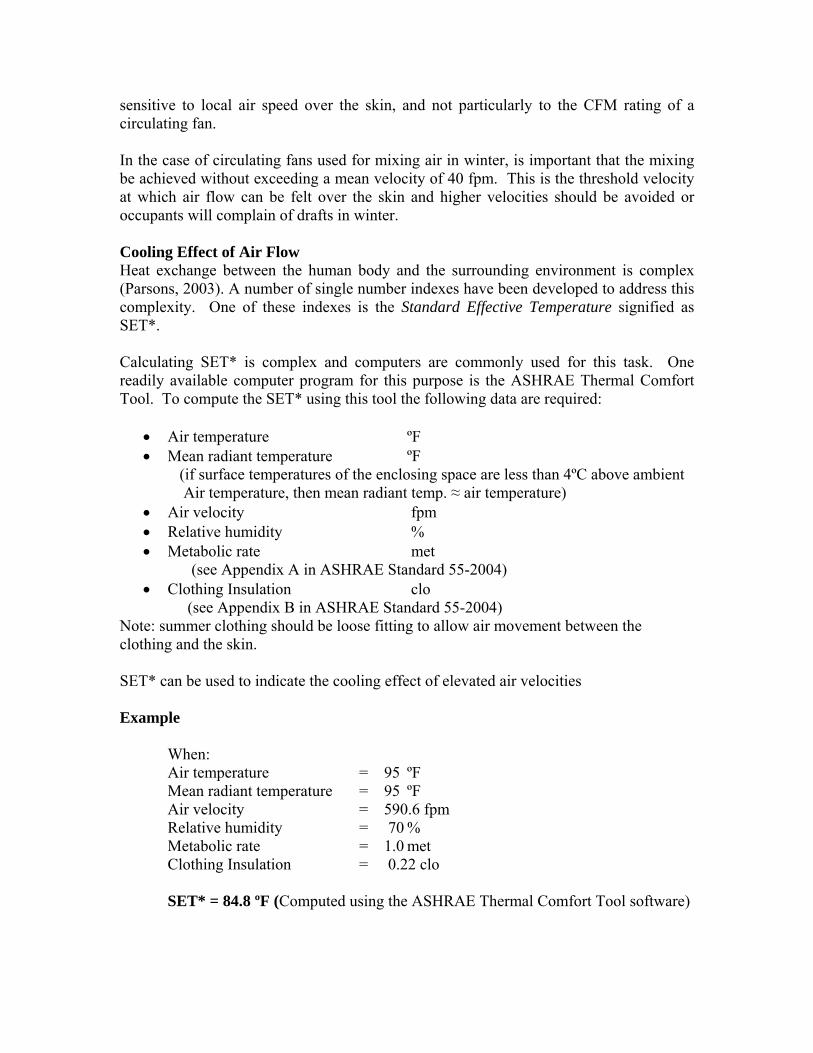
People tend to prefer wind speeds in the range of 3 mph (264 fpm) to around 5 mph (440 fpm) for cooling in the summer time. Wind speeds above 5 mph tend to cause disarrangement of hair and loose clothing, difficulty in use of umbrellas and activities such as reading newspapers etc. Individual Control of Local Air Speed Automobile and aircraft designers have provided individual control of local air flow to enhance personal thermal comfort for decades Figure 3. Building air conditioning systems on the other hand provide little control to individuals in a space. The exception has been in some high-end computer work stations that have built-in individual controls for local air flow and task lighting. Some under-desk fan units are now available that provide individuals local control of air movement over their torso Figure 4. Any fan used for enhancing summer thermal comfort should have a fine control of air speed. The ASHRAE 55-2004 Standard suggests a maximum air speed control steps of 30 fpm. Broader steps in fan air speed controls are likely to be too broad to provide for individual thermal comfort satisfaction.
Figure 3. Typical automobile air supply outlets provide individual passenger control.
Figure 4. Work station air supply fan with individual speed control. It is often difficult for people who have not measured air speeds to place numbers such as 100 fpm in a context. This has been a problem for a very long time and prompted Lord Beaufort of the British Admiralty to develop a table describing the physical effects of wind at different speeds. The original table described conditions at sea, but Table 3 describes the effects of winds at different speeds up to gale force over land. The table allows people to recognize numerical values of air speed from their personal outdoor experiences. The full scale extends to force 12 which represents a hurricane.
Table 3. Partial Beaufort Wind Scale Force WMO
Classification Wind Speed
mph Wind Speed
fpm Wind Effects over Land
0 Calm Less than 1.15 Less than 100 Calm, smoke rises vertically 1 Light Air 1.15 to 3.5 100 to 300 Smoke drift indicates wind direction, still wind vanes 2 Light Breeze 4.6 to 6.9 400 to 600 Wind felt on face, leaves rustle/ wind vanes begin to move 3 Gentle Breeze 8.1 to 11.5 700 to 1000 Leaves and small twigs constantly moving, light flags extended 4 Moderate Breeze 12.7 to 18.4 1100 to 1600 Dust, leaves and loose paper lifted, small tree branches move 5 Fresh Breeze 19.6 to 24.2 1700 to 2100 Small trees in leaf begin to sway 6 Strong Breeze 25.3 to 31.1 2200 to 2700 Larger tree branches moving, whistling in wires 7 Near Gale 32.2 to 38 2800 to 3300 Whole trees moving, resistance felt walking against wind 8 Gale 39.1 to 46 3400 to 4000 Whole trees in motion, strong resistance felt to walking against
wind Enhanced Cooling Effect of Air Gusts In 1985 Oelsen reported on the effect of gust frequency on the detrimental winter chilling effect of drafts. They determined that the thermal sensors beneath the skin had a peak sensitivity at a frequency of 0.47Hz. That is gusts occurring at 2.1 seconds intervals.
Later Chinese professors Xia et al (2000) led a team that repeated the experiment to determine the beneficial cooling effects in humid summer conditions of 86 ºF and 60% relative humidity. They also found that the peak cooling effect occurred with a gust frequency around 0.5Hz. Relative Power Spectral Density of Turbulent Air Flow from Fans The relative energy of gusts at different frequencies in turbulent air flow can be found by recording a time history of velocity over say 30 minutes to capture low frequencies and performing a Fast Fourier Transform (FFT) to change time history of velocity into the power spectral density frequency domain. Such time-history of velocity measurements need to be performed using an anemometer with a high frequency response capability of at least 10kHz.in order to capture a broad range of frequencies. This peak sensitivity more than doubles the cooling effect of air gusts at low air speeds below 40 fpm. Large high-volume, low-speed (HVLS) fans that have their highest power spectral density between frequencies of 0 Hz to 1 Hz (Figure 5) are ideally suited to cooling people in summer.
Figure 5. Power Spectral Density of turbulent air flow from a 20 ft diameter HVLS fan 43 inches above floor level, 20ft from the center of the fan.
Placement of Pedestal Fans For wall or pedestal mounted circulating fans their velocity profile reveals the velocities that can be expected at various distance from the fan, Figure 6. This data can be used to determine how many fans are needed to cover workers from the angle of spread of the air jet and the distance air is thrown.
Figure 6. Velocity profile for a 30 inch diameter pedestal circulating fan
These smaller fans tend to have relatively narrow jets so their floor area coverage is limited unless they have an oscillating capability. The narrow velocity profile can be useful for narrow aisle ways however people close to the fan are exposed to high air speed and fan noise while those at a distance receive only modest air speeds. Workspace Airflow Criteria While air movement in the workplace can enhance thermal comfort local velocities around 1 m/s or higher can result in the disturbance of loose papers etc. Paper weights offer one solution but many people place desk fans beneath their desk so that the air flow is aimed at their midriff. Most good quality circulator fans have speed control that can be used to moderate local velocities. In warm climates it is common to find ceiling fans fitted under roofs of outdoor deck areas for air flow during periods of calm breezes, Figure 8.
Figure 7. Ceiling fan in outdoor patio area in warm humid climate region
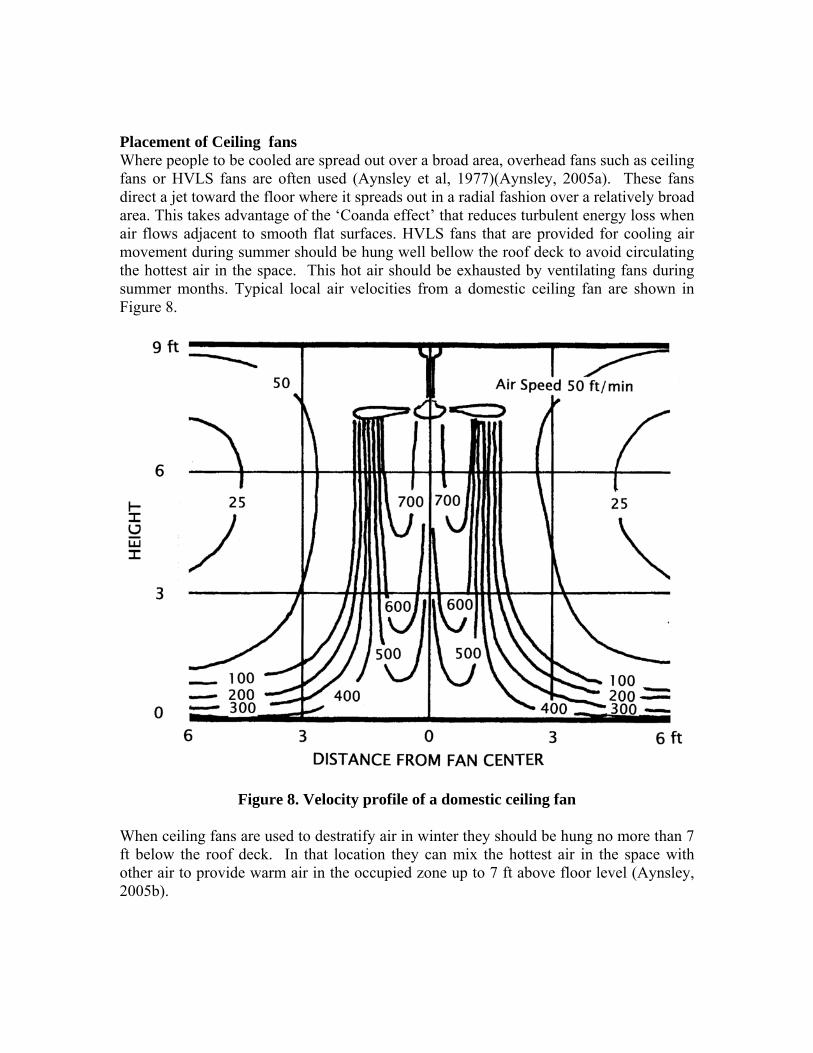
Placement of Ceiling fans Where people to be cooled are spread out over a broad area, overhead fans such as ceiling fans or HVLS fans are often used (Aynsley et al, 1977)(Aynsley, 2005a). These fans direct a jet toward the floor where it spreads out in a radial fashion over a relatively broad area. This takes advantage of the ‘Coanda effect’ that reduces turbulent energy loss when air flows adjacent to smooth flat surfaces. HVLS fans that are provided for cooling air movement during summer should be hung well bellow the roof deck to avoid circulating the hottest air in the space. This hot air should be exhausted by ventilating fans during summer months. Typical local air velocities from a domestic ceiling fan are shown in Figure 8.
Figure 8. Velocity profile of a domestic ceiling fan When ceiling fans are used to destratify air in winter they should be hung no more than 7 ft below the roof deck. In that location they can mix the hottest air in the space with other air to provide warm air in the occupied zone up to 7 ft above floor level (Aynsley, 2005b).
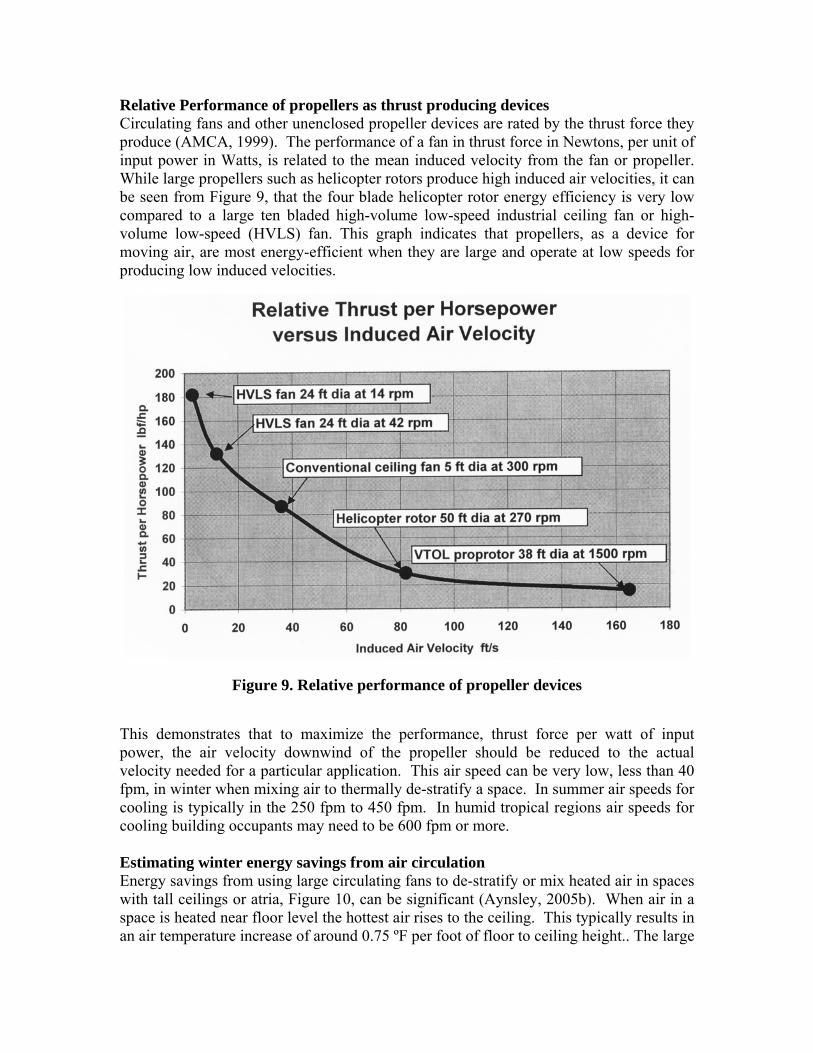
Relative Performance of propellers as thrust producing devices Circulating fans and other unenclosed propeller devices are rated by the thrust force they produce (AMCA, 1999). The performance of a fan in thrust force in Newtons, per unit of input power in Watts, is related to the mean induced velocity from the fan or propeller. While large propellers such as helicopter rotors produce high induced air velocities, it can be seen from Figure 9, that the four blade helicopter rotor energy efficiency is very low compared to a large ten bladed high-volume low-speed industrial ceiling fan or high-volume low-speed (HVLS) fan. This graph indicates that propellers, as a device for moving air, are most energy-efficient when they are large and operate at low speeds for producing low induced velocities.
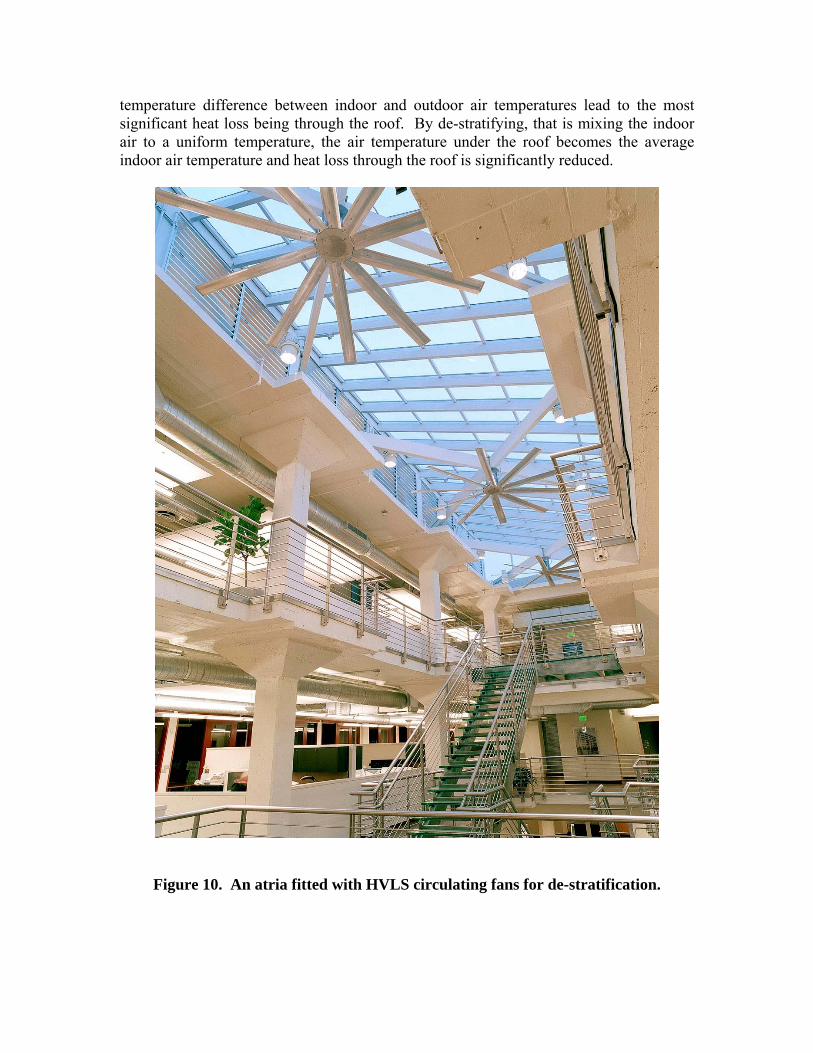
Figure 9. Relative performance of propeller devices This demonstrates that to maximize the performance, thrust force per watt of input power, the air velocity downwind of the propeller should be reduced to the actual velocity needed for a particular application. This air speed can be very low, less than 40 fpm, in winter when mixing air to thermally de-stratify a space. In summer air speeds for cooling is typically in the 250 fpm to 450 fpm. In humid tropical regions air speeds for cooling building occupants may need to be 600 fpm or more. Estimating winter energy savings from air circulation Energy savings from using large circulating fans to de-stratify or mix heated air in spaces with tall ceilings or atria, Figure 10, can be significant (Aynsley, 2005b). When air in a space is heated near floor level the hottest air rises to the ceiling. This typically results in an air temperature increase of around 0.75 ºF per foot of floor to ceiling height.. The large
temperature difference between indoor and outdoor air temperatures lead to the most significant heat loss being through the roof. By de-stratifying, that is mixing the indoor air to a uniform temperature, the air temperature under the roof becomes the average indoor air temperature and heat loss through the roof is significantly reduced.
Figure 10. An atria fitted with HVLS circulating fans for de-stratification.
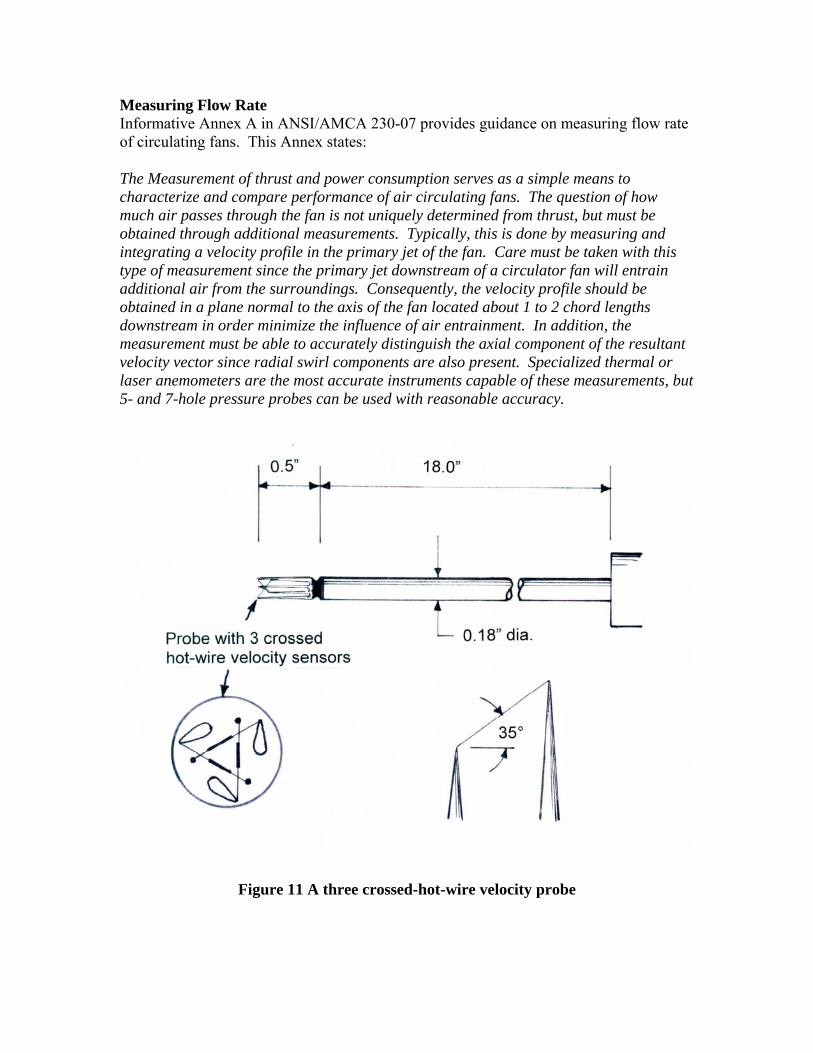
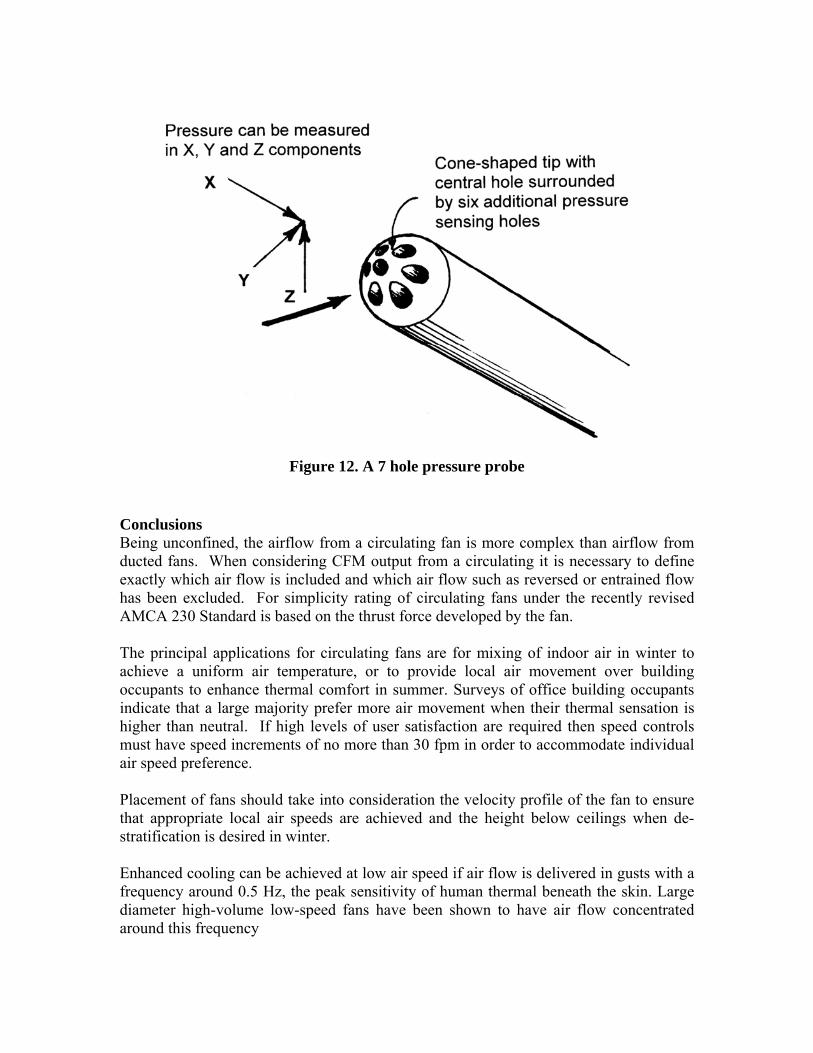
Measuring Flow Rate Informative Annex A in ANSI/AMCA 230-07 provides guidance on measuring flow rate of circulating fans. This Annex states: The Measurement of thrust and power consumption serves as a simple means to characterize and compare performance of air circulating fans. The question of how much air passes through the fan is not uniquely determined from thrust, but must be obtained through additional measurements. Typically, this is done by measuring and integrating a velocity profile in the primary jet of the fan. Care must be taken with this type of measurement since the primary jet downstream of a circulator fan will entrain additional air from the surroundings. Consequently, the velocity profile should be obtained in a plane normal to the axis of the fan located about 1 to 2 chord lengths downstream in order minimize the influence of air entrainment. In addition, the measurement must be able to accurately distinguish the axial component of the resultant velocity vector since radial swirl components are also present. Specialized thermal or laser anemometers are the most accurate instruments capable of these measurements, but 5- and 7-hole pressure probes can be used with reasonable accuracy.
Figure 11 A three crossed-hot-wire velocity probe
Figure 12. A 7 hole pressure probe
Conclusions Being unconfined, the airflow from a circulating fan is more complex than airflow from ducted fans. When considering CFM output from a circulating it is necessary to define exactly which air flow is included and which air flow such as reversed or entrained flow has been excluded. For simplicity rating of circulating fans under the recently revised AMCA 230 Standard is based on the thrust force developed by the fan. The principal applications for circulating fans are for mixing of indoor air in winter to achieve a uniform air temperature, or to provide local air movement over building occupants to enhance thermal comfort in summer. Surveys of office building occupants indicate that a large majority prefer more air movement when their thermal sensation is higher than neutral. If high levels of user satisfaction are required then speed controls must have speed increments of no more than 30 fpm in order to accommodate individual air speed preference. Placement of fans should take into consideration the velocity profile of the fan to ensure that appropriate local air speeds are achieved and the height below ceilings when de-stratification is desired in winter. Enhanced cooling can be achieved at low air speed if air flow is delivered in gusts with a frequency around 0.5 Hz, the peak sensitivity of human thermal beneath the skin. Large diameter high-volume low-speed fans have been shown to have air flow concentrated around this frequency
References ANSI/AMCA Standard 230-07 (2007) Laboratory Methods of Testing Air Circulating Fans for Rating and Certification, AMCA International, Arlington Heights, IL, 14 pages. ANSI/ASHRAE Standard 55 (2004) Thermal Environmental Conditions for Human Occupancy, ASHRAE Inc., Atlanta GA. 26 pages. Aynsley, R. 1 (2005a) Saving energy with indoor air movement. The International Journal of Ventilation, Vol. 4, No. 2, Sept., 167-175. Aynsley, R. (2005b) Saving Heating Costs in Warehouses. ASHRAE Journal, vol. 47, No. 12, December, 46-51. Aynsley, R., Melbourne, W. and Vickery, B. (1977) Architectural Aerodynamics, Applied Science, London, 256 Pages. Hui Zhang, Edward Arens, Sahar Abbaszadeh Fard, Charlie Huizenga, Gwelen Paliaga, Gail Brager and Leah Zagreus from Center for the Built Environment, UC Berkeley (2006) Air movement preferences observed in office buildings, Proceedings of Comfort and Energy Use In buildings Conference, Windsor, UK, April 27-30. 18 pages. Oelsen, B. (1985) Local thermal comfort, Denmark, Bruel& Kjaer Technical Review, No.1, 44 pages. Parsons, K (2003) Human Thermal Environments, Second Ed., Taylor & Francis, London, 527 pages. Wallis, R.A. (1961) Axial Flow Fans: Design and Practice, New York, Academic Press, 361 pages. Yizai Xia, Rongyi Zhao and Weiquan Xu (2000) Human Thermal Sensation to Air Movement Frequency, Air Distribution in Rooms Volume 1, Proceedings of the 7th International Conference on Air Distribution in Rooms, Reading, UK, 9-12 July 2000, pp. 41-46.