Theory to Practice: Oxygen Transfer and the New ASCE Standard
Michael K. Stenstrom, Shao-Yuan (Ben) Leu, and Pan Jiang
Civil and Environmental Engineering Dept, UCLA, Los Angeles, CA
ABSTRACT Oxygen transfer is an important part of wastewater treatment and accounts for as much as 60% of the energy consumption for the activated sludge process. Prior to 1984, no standard method for quantifying oxygen transfer existed, which created problems in the design and warranties for treatment plants. The ASCE Standard for the Measurement of Oxygen Transfer in Clean Water and the ASCE Standard Guidelines for In-Process Oxygen Transfer Testing have found widespread application and have reduced the variability in new designs and allowed operators and engineers to access the process operation of existing treatment plants. A new clean water standard is in press as of this writing and the in-process Guidelines are undergoing updating for reissue. This paper illustrates the key concepts of both the Standard and the Guidelines and shows why they are important and reduced the variability of testing. The paper also highlights key new areas of the revised clean water Standard, which includes an optional correction for test water total dissolved solids concentration, and applications to loop (ditch) activated sludge process and the high purity oxygen activated sludge process. KEYWORDS Activated sludge, aeration, ASCE, off-gas, oxygen transfer, standard INTRODUCTION In 1977, under the sponsorship of the US EPA, a Committee organized by ASCE began the study of methods to quantify oxygen transfer rates in wastewater treatment. The Committee met as a group in Asilomar, California in 1978 (US EPA, 1979) and proposed consensus methods for establishing uniform and repeatable test conditions, estimating clean water parameters (mass transfer coefficient or KLA, and equilibrium oxygen concentration *
∞C ) from reaeration data, and translating clean water rates to process conditions. The resulting methods were evaluated over next several years by the committee members, consultants and manufactures and refined through the collective experience of the group. The final result was the 1984 version of the ASCE Standard for the Measurement of Oxygen Transfer in Clean Water. The Standard was subsequently improved, updated and republished in 1991 and will be published again in 2006. Following the development of the Clean Water Standard, it was realized that the next most important gap in knowledge was the characterization of process water transfer rates. The Standard provided ways of calculating expected process water rates from clean water rates, by adjusting for standard conditions, such as barometric pressure, temperature and the effects of the contaminants in the process water (α and β factors for KLA and *
∞C , respectively), but there were no consensus-based process water
measurement procedures, and a lack of knowledge of the conditions that affect process water testing. The US EPA and ASCE funded a new effort to develop process water testing methods, which were published by the US EPA in 1989 and later adopted into a standard guideline (ASCE, 1997). Several major changes and improvements were realized over the process of these projects. The first was in the methodology of estimating KLA from the reaeration data. Prior to the Standard, the log deficit method was used which required a priori knowledge of *
∞C . Several methods for specifying *∞C existed, but all had pitfalls,
allowing the introduction of errors which might bias the overall transfer rate by ± 15 to 20% (Boyle, et al. , 1974). The Standard uses a non-linear regression technique which avoids the use of a priori methods and eliminates the possibility of bias. A second major change was the realization that α factors, which prior to 1980 had almost always been routinely specified as 0.8, were dependent not only on just the wastewater type, but also on the aeration devices (i.e., fine pore diffusers have lower α factors than surface aerators, Stenstrom and Gilbert, 1981) and on the conditions of the activated sludge mixed liquor (i.e., processes operating with longer mean cell retention times (MCRT) have higher α factors that processes operating at low MCRT, Rosso, et al, 2005). A series of other improvements were realized including the impact of cobalt as an interference in the Winkler dissolved oxygen (DO) measurement procedure, the impact of the lag in DO probes on estimates of KLA (Philichi and Stenstrom, 1989). Finally, a new testing methodology, developed as part of the second project, called off-gas analysis was developed and perfected (Redmon, et al., 1983), and this method, in the ten years following its development, has become the method of choice for measuring oxygen transfer in subsurface aeration systems for conventional processes as well as occasional use in novel process such as biological aerated filters (Newman, et al., 2005) This paper describes some of the key concepts used in developing the Clean Water Standard and illustrates why they are still important. Several new aspects of the new Standard are described. Finally, in a similar fashion, several key concepts used in process water testing are also described. CLEAN WATER TESTING The basic theory used in the Standard is the well-known “Two-film Theory” from Lewis and Whitman (1924), which states that transfer rate can be expressed in terms of an overall transfer coefficient and resistances on either side of the interface. With sparingly soluble gases such as oxygen, the resistance is primarily in the liquid film and the gas film can be ignored. This allows the transfer to be expressed as follows:
*( - )∞= LdC K a C Cdt
(1)
where LK a = volumetric mass transfer coefficient (1/T), *C∞ = average DO concentration attained at infinite time (mg/L) and
C = effective average DO concentration in the liquid phase. The integrated form becomes:
or * *0 0( ) exp[ ( )]LC C C C K a t t∞ ∞= − − ⋅ ⋅ − (3)
where 0C = initial DO concentration at t = t0 Equation (2) is the log deficit form of the equation and equation (3) is the exponential form. The previous cited log deficit forms for parameter estimation use equation (2) while the non-linear regression forms associated with the Standard use equation (3). Both approaches use an non-steady state clean water test to determine the oxygen transfer capacity of aeration equipment, which is widely applicable to a variety of aeration including both surface aerators and subsurface diffusers, such as coarse bubble tubes, perforated pipes, static tubes, fine pore diffusers (discs, domes, plates, strips and panels), submerged turbines and jet aerators. Data collection proceeds by taking DO measurements over time, after stripping the test water of DO. The final result of the test is expressed as the Standard Oxygen Transfer Rate (SOTR), a hypothetical mass of oxygen transferred per unit of time in tap water at zero dissolved oxygen concentration, water temperature of 20oC and barometric pressure of 1 atm under specified gas rate and power conditions. Generally a test proceeds as follows:
1. The test tank (cleaned by washing with tap water) is filled with tap water to the desired volume.
2. The DO is reduced to zero by either stripping with nitrogen gas or oxidizing with sodium sulfite catalyzed with cobalt. The sodium sulfite is added in amounts usually equal to 125 or 175% of the stoichiometric requirement and cobalt chloride is added to produce a concentration of approximately 0.05 mg/L as cobaltous ion.
3. The aeration device is normally operating during the period of deaeration and reaeration. The DO concentration can be observed to plunge to zero and remain at zero for a few minutes depending on the specifics of the test. As DO returns to the liquid, the concentration is recorded or observed at appropriate intervals. The test is terminated when the DO equals to 98% of the expected value of *C∞
The test is relatively straightforward and the Standard describes both required and recommended conditions to create accurate and precise results. It should be consulted for the detailed procedure, but issues such as the way to add sodium sulfite, locate DO sampling points, methods for calculating flow rates and power etc. are all described. The general form of the reaeration test was used prior to the Standard, and even though the theory of reaeration is unequivocal, the results of the test were affected by the techniques used to analyze the test data. Modeling and interpretation of the resulting data are critical for the characterization of the aeration system and, especially, for performance acceptance tests. The method for estimating the parameter used in equations (2) or (3) may influence the final results by ± 15 to 20%. In order to avoid bias, it is important for consultants and manufacturers to use the same procedure. The ASCE Method, which has also been called the Nonlinear Regression Method, is based on nonlinear regression of equation (2). A variety of non-linear regression methods can be used and produce identical results when the methods converge (Stenstrom et al. , 1981) The best estimates of the parameters, LK a , *C∞ , 0C are selected as the values that minimize the residual sum of squares between equation (3) and the
DO-versus-time data. The residual is the difference in concentration between measured DO value at a given time and the DO value predicted by equation (3) at the same time. The non-linear regression technique requires a computer or programmable calculator to estimate the parameters and for this reason was not popular prior to the wide-spread use of personal computers. Equation (2) was more popular because it could be linearized and LK a could be estimated by drawing a straight line on graph paper. Equation (2) can be rearranged when t0 = 0 as follows:
* *0ln( ) ln( ) ∞ ∞− = − − LC C C C K a t (4)
The problem is how to estimate *C∞ . There were several methods, called a priori methods, which used knowledge about the aeration system. For submerged aeration, the hydrostatic pressure of the water column increases the gas pressure inside bubbles, which increases the value of *C∞ . Therefore the value of *C∞ becomes a function of tank depth and transfer efficiency. Simplistic models were used for *C∞ and the symbol
*stC will be used to represent the parameter in equation (4) when it is derived from an a
priori model, which include surface saturation, mid-depth saturation, bottom saturation, and mid-depth corrected saturation. The surface saturation model is appropriate for surface aerators and assumes that all the gas transfer takes place at the surface. Hence the value of *
stC is equal to the handbook value of DO saturation, or Cs. This assumption is generally true for surface aerators, although surface aerators, especially at high power per unit volume (> 1 hp/1000 ft3) may entrain bubbles, which flow around the tank and experience hydrostatic pressure, increasing the value of *
stC In submerged aeration, oxygen transfer occurs throughout the tank volume and *
stC will vary with depth because of progressive decreases in both hydrostatic pressure and oxygen mole fraction as the bubbles move upward. Equation (5) has been used to estimate *
stC and accounts for the changes in hydrostatic pressure.
* 0h ( )+
= ∫dZ
ast
d
Y P rz dzC
z (5)
where dz =aerator submergence depth, assumed to be equal to liquid height above the
aerator h (m) aP =atmospheric pressure (atm)
H=Henry’s law coefficient Y =mole fraction of oxygen in gas phase (0.2095) r =weight density of water
When z =2dz =
2h , the mid-depth model is defined, as follows:
0*
0
( )2[ ]
+=st s
hP CFC C
P (6)
where 0P = Atmospheric pressure @the surface (atm or psi)
CF = water weight density and units conversion factor. Equal to 0.09664 when using atm and meters or 0.433 when using when using psi and feet.
Similarly, when z = h , the Bottom Saturation Model is obtained. This model assumes that the effective oxygen transfer occurs at the tank bottom. Therefore, the effective saturation concentration is calculated as follows:
* 0
0
( )[ ]+=st sP CF hC C
P (7)
Other methods for estimating *stC have been used but all in some way use equations such
as (6) and (7). An alternative method is to actually measure *stC . This was rarely done
because of the time penalty associated with waiting so long for a test to complete. Generally it is necessary to conduct a test to 5/ KLA or 6/KLA units of time to obtain an accurate (± 1%) estimate of *
stC . It was common practice prior to the Standard to conduct a reaeration test long enough to reach only 70 to 90% of *
∞C (Boyle, et al, 1974), which requires only 1/KLA or 2/KLA units of time, or roughly 30% of the time for a more accurate test. The burden of measuring *
stC is especially onerous for replicate testing. COMPARISION OF METHODS This section shows the differences among the various methods and how they impact to overall estimate of transfer efficiency. Two example data sets were selected, one from a surface aeration test and the second from a diffused aeration system operating at very low air flux (air flow per unit area of tank bottom). Three estimates of *
stC are demonstrated using the log deficit method as well as the ASCE method (marked as best-fit). Figure 1 shows the reaeration data, plotted to conform to equation (4). The left panel represents the subsurface aeration system and the right panel shows the surface aerator. The curved lines are indicative of poor fit. For the diffused aeration system on the left panel, both bottom saturation and surface saturation models show curvature beginning at about 80% of saturation. The mid-depth model is close to but not equal to the best fit model. The right panel shows similar curvature but for mid-depth and bottom saturation. The mid-depth model and the best fit provide similar results. Figure 2 shows the results of these errors on the overall mass transfer rate, called the Standard Oxygen Transfer Rate (SOTR), when specified at standard conditions. The left vertical axis shows the ratio of the transfer rate obtained using the a priori models to the best fit. In the case of the subsurface system, a 20% bias of greater transfer (defined as positive) is obtained if a surface saturation model is used, and a 5% negative bias is obtained if the bottom saturation model is used. For the surface aerator (right panel) there is 10 to 12 % negative bias when the mid-depth and bottom saturation models are
Figure 1. Reaeration Data, Plotted to Conform to the Log Deficit Method of Parameter Estimation Figure 2. Change in Predicted SOTR as a Function of Equilibrium DO Concentration
1 1.1 1.2 1.3 1.4
C∞∗/Cs
0.8
1
1.2
SOTR
/SO
TRA
SCE
1 1.2 1.4 1.6 1.8 2
s
m
b
s
m
b
s - surface saturationm - mid-depthb - bottom saturationO - best fit
used. The best fit and most correct a priori models (mid depth for subsurface, surface for surface) differ by approximately 2 to 5%. The best fit model selects the correct value of *C∞ with based upon the reaeration data alone. The extreme limits of the bias (+22% and -12%) are large by today’s methods for specifying aerators. Bids are won and lost by as little as 2% difference in transfer rates. The most troublesome part of the results show in Figures 1 and 2 is the inability to detect a bias, if the analysis shown in Figure 1 is conducted to only 80%. The curvature of the line is not obvious until the test is conducted to 90% or more of saturation. Therefore it was possible to use the wrong a priori model, bias the final results and not know that an error had been made. To prevent this type of error it is necessary to continue the test until the DO approaches saturation. Unfortunately, this can have an unexpected negative impact on test accuracy and precision. This occurs because of error transformation. When using the log deficit method (equation 4), the residuals are not actual errors in DO concentration, but errors in the log of DO concentration. Taking the logarithm of the error transforms it. Small values of error are made larger while large errors are reduced in size. Therefore, minimizing the log of the residuals does not minimize the difference in the actual residuals. All log deficit methods minimize the log of the error while the ASCE method minimizes the actual error. A simple example is useful. Suppose the value of *
stC is 10 mg/L and the error in DO measurement is ± 0.1 mg/L. At 1.0 mg/L DO concentration, the error in log deficit will be difference between log | 10-1.1| or log |10-0.9| and log |10-1.0|, which is ± 0.004. At 96% of *C∞ , near the end of the test, the error will be the difference in log |10-9.7| or log |10-9.5| and log |10-9.6|, which is 0.09 or -0.12. The relative contribution of the same error in DO measurement is 24 to 31 times greater at the end of the test than at the beginning of the test. The transformed error structure weights measurements at the conclusion of the test more heavily than at the beginning. Also, if the DO measurement error is higher, it may be possible to have undefined error due to a negative deficit. The error transformation is one possible reason for the former practice of terminating reaeration tests early (Boyle, et al. , 1974). The two types of errors, non-uniform residuals and bias due to the incorrect value of *
stC , require mutually exclusive modifications to the data analysis methodology. The best fit method, has neither problem. The error structure is not transformed and it is possible to conduct the test to arbitrarily close to *C∞ . Another difference between methods is the correlation of random error. In fitting equation (3) to experimental data, small, random errors in DO measurement create inversely correlated errors in the parameters estimates for KLA and *C∞ (an error in DO measurement is compensated by a small increase in the estimate of *C∞ and a small decrease in the estimate of KLA, or vice-versa). When the SOTR is calculated, the estimates of KLA and *C∞ are multiplied, which partially cancels the net error in SOTR. For this reason, the Standard requires that the estimates of KLA and *C∞ from each measuring point or probe be multiplied to obtain the SOTR and the SOTR from each measuring point be averaged to obtain the overall SOTR. This improvement due to
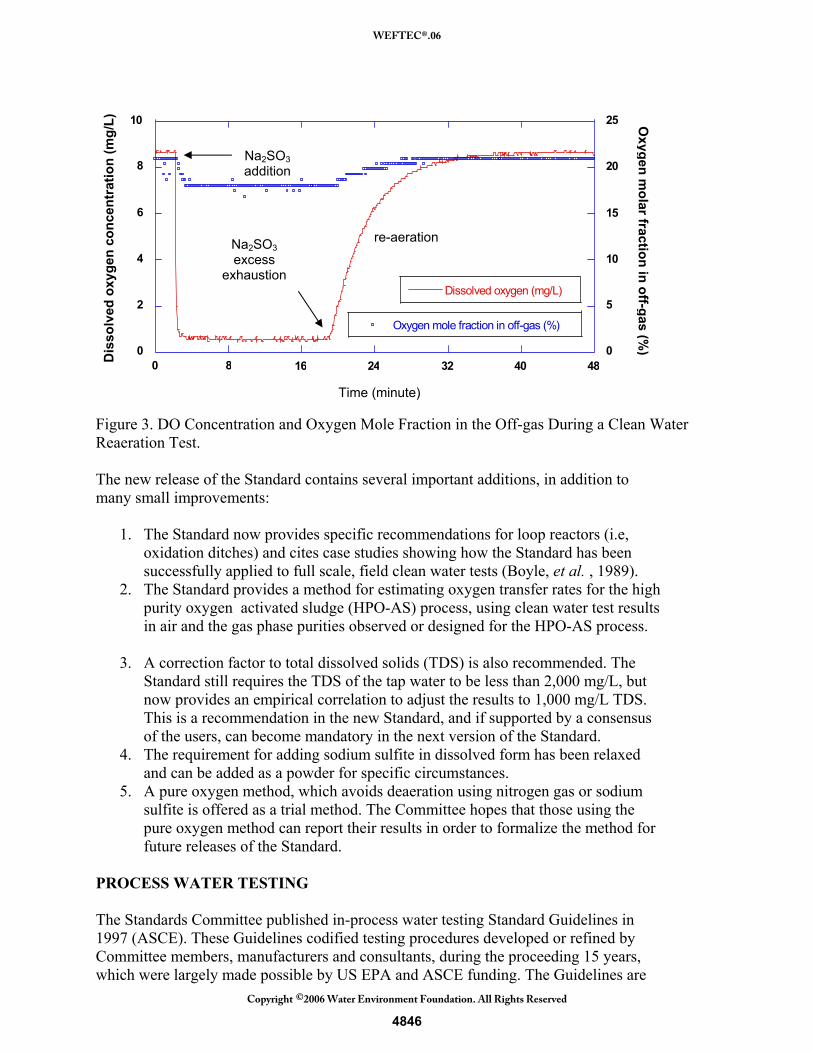
negative correlation in the errors associated with parameters does not occur in the log deficit procedures. GAS PHASE OXYGEN DEPLETION A criticism of the non-steady state reaeration test (regardless of data analysis methods) is the effect of oxygen depletion in the rising bubbles. As the bubbles rise, oxygen is absorbed by the liquid, reducing the oxygen mole fraction in the bubbles. Also, nitrogen and carbon dioxide is stripped from the liquid which further reduces the oxygen partial pressure. The loss of oxygen is greatest in the early part of the reaeration test, where the deficit, and therefore transfer rate, is greatest. Figure 3 shows this phenomenon for a typical reaeration test. The test was performed according to the ASCE Standard, except that the off-gas from the surface of the tank was collected in a hood and analyzed for oxygen with a Teledyne fuel cell analyzer (Model 320, Teledyne, City of Industry, CA). The oxygen in the off-gas is depleted in the early part of the test and then returns to 0.2095 mole fraction at the end of the test. The effect of this deficit on parameter estimation and subsequent use of the data for steady-state design calculations was examined by Baillod (1979). He noted that the effect of gas side depletion on parameter estimation was to reduce the estimate of KLA and increase the estimate of *C∞ . He formulated a conversion equation between “observed” KLA and *C∞ and “true” KLA and
*C∞ by modeling oxygen transfer in a column, and concluded that the errors in observed KLA and *C∞ canceled for depths below approximately 30 ft, depending on oxygen transfer rate. In the early discussion of the Standard, it was proposed that the true KLA be reported as KLA’ . In later discussions it was decided not to introduce the concept of true and apparent KLAs since the effect was not significant, or even measurable in most cases, for aeration systems used in wastewater treatment. For this reason, it is not necessary to adjust the value of *C∞ for process conditions due to gas phase bubble depletion. In rare cases, such as fermentation systems, or systems using fine pore aeration with pure oxygen, it may be necessary to compensate for gas phase oxygen depletion. CONCLUDING REMARKS ON CLEAN WATER TESTING The ASCE Standard is more than 20 years old and its third revision will soon be published. It has eliminated many of the experimental and data analysis errors previously encountered in clean water testing. The Standard has defined terms to define transfer, such as SOTR (lbO2/hr or kg O2/hr), Standard Oxygen Transfer Efficiency (SOTE, %), and Standard Aeration Efficiency (SAE, lbO2/hp-hr or kg O2/kW-hr), and provided conversion methodology for translating these to process conditions. One of its most important contribution is the avoidance of systemic errors by eliminating the need for a priori estimates of *C∞ . The original objections to the Standard, that it was difficult to understand and that a computer was required, are no longer valid.
Figure 3. DO Concentration and Oxygen Mole Fraction in the Off-gas During a Clean Water Reaeration Test. The new release of the Standard contains several important additions, in addition to many small improvements:
1. The Standard now provides specific recommendations for loop reactors (i.e, oxidation ditches) and cites case studies showing how the Standard has been successfully applied to full scale, field clean water tests (Boyle, et al. , 1989).
2. The Standard provides a method for estimating oxygen transfer rates for the high purity oxygen activated sludge (HPO-AS) process, using clean water test results in air and the gas phase purities observed or designed for the HPO-AS process.
3. A correction factor to total dissolved solids (TDS) is also recommended. The Standard still requires the TDS of the tap water to be less than 2,000 mg/L, but now provides an empirical correlation to adjust the results to 1,000 mg/L TDS. This is a recommendation in the new Standard, and if supported by a consensus of the users, can become mandatory in the next version of the Standard.
4. The requirement for adding sodium sulfite in dissolved form has been relaxed and can be added as a powder for specific circumstances.
5. A pure oxygen method, which avoids deaeration using nitrogen gas or sodium sulfite is offered as a trial method. The Committee hopes that those using the pure oxygen method can report their results in order to formalize the method for future releases of the Standard.
PROCESS WATER TESTING The Standards Committee published in-process water testing Standard Guidelines in 1997 (ASCE). These Guidelines codified testing procedures developed or refined by Committee members, manufacturers and consultants, during the proceeding 15 years, which were largely made possible by US EPA and ASCE funding. The Guidelines are
currently under review and will undergo improvement to be republished over the next two years. The Guidelines recommend three types of in-process water testing methods: 1) the non-steady method, using pure oxygen or hydrogen peroxide, for surface or diffused aeration systems; 2) off-gas analysis for diffused aeration systems, and 3) the tracer racer method for both surface and diffused aeration systems. It also describes but does not recommend two other methods, including methods based upon ex-situ oxygen uptake rate measurements and liquid-phase mass balances. Methods based upon ex-situ oxygen uptake rate measurements, usually called the steady-state method, and using a BOD bottle for uptake measurement, have severe limitations on applicability because of the inability to create conditions in a sample bottle that properly reflect conditions in an aeration basin. The inability to measure an accurate oxygen uptake rate creates artificially low or high oxygen transfer estimates, which have sometimes been explained as biologically enhanced transfer (Albertson and DiGregorio, 1975). The problems and a history of the errors introduced by ex-situ measurements have been discussed in detail by Mueller and Stensel (1990), who concluded that there was no evidence for biologically enhanced oxygen transfer rates in the activated sludge process. In-situ oxygen uptake measurements, such as those taken by process respirometers ,have not been extensively used for in-process testing, and there is little or no long term experience in this use. The major advance described by the Standard Guidelines is the off-gas analysis method, which was developed by Redmon et al (1983) under US EPA and ASCE sponsorship. The method uses an oxygen gas sensor to measure the oxygen mole fraction in the off-gas. By removing the carbon dioxide and water vapor from the off-gas, and assuming no change in nitrogen fraction, Redmon et al (1983) showed that the OTE could be calculated directly from the mole fraction measurements, and did not rely one volumetric gas flow rate. This technique improved on the methods used previously by a number of investigators, including Sawyer and Nichols (1939), Hover et. al. (1954), Pauling et al (1968), Prit and Callow (1958), Downing (1960), Conway and Kumke (1966) and Leary et al. (1968). OFF-GAS ANALYSIS Figure 4 shows a schematic of a set-up to perform off-gas testing. A portable hood is floated on the liquid surface and captures the gas bubbles that reach the surface. The gas flows through an analyzer that measures total gas flow and the oxygen mole fraction of a small slip stream of the gas. Even though the total gas flow is not needed for OTE measurement, it is desirable to measure it, which is usually done by withdrawing a measured flow that precisely balances the pressure under the hood. The need to measure gas flow rate is to create a flow weighted average transfer efficiency over the entire aeration tank. This is required not only to estimate transfer for tapered aeration systems, but also when there is uneven air flow distribution due to fouled or damaged diffusers. The hood dimensions are important when performing off-gas analysis in order to sample a representative area of the tank. For fine pore aeration systems, such as discs or domes, the spacing among diffusers may be less than several feet, but for coarse bubble diffusers or tanks that use diffusers to create strong mixing currents (i.e., spiral roll,
Figure 4. Off-gas test equipment schematic, showing hood, analyzer, DO meter and aeration tank. Figure 5. Schematic Diagram of the Nitrifying-Denitrifying Treatment Plant (headworks, primary clarifier, equalization basin and disinfection facilities not shown)
cross roll), diffusers may be located more than 10 feet apart. Each portion of the tank area must be sampled representative to the entire area, so hood positions must include areas of low air flux (air flow per unit area of tank surface) and high air flux. To reduce the number of separate analysis, a larger hood is used to integrate over high and low flux areas of the tank. Hoods that are 10 feet by 2 feet or 8 feet by 4 feet in dimensions are common. In extreme cases, it is possible to construct a hood to cover an entire tank (Boyle, et al. , 1989). To illustrate the capabilities of off-gas analysis, the results of a 24-hour test are presented, and illustrate the changing in oxygen transfer rates with process loading. Figure 5 is a plant schematic, which is an activated sludge plant that nitrifies and denitrifies using a modified MLE concept. The head works, primary clarifiers and equalization tank are not shown in the figure. Primary effluent flow rate is equalized by diverting excess flow to an off-line storage basin, which is then pumped back into the process during the low flow period. In this way peak loads on the process are reduced. Figure 6 shows the results of the 24-hour off-gas test along with flow rate and chemical oxygen demand (COD) loading rate. The time scale is noon to noon. The top panel (a) shows the influent flow rate and the influent COD. Note that the maximum flow rate is limited through equalization and that the flow declines to a minimum value at 6 AM morning. The next panel (b) shows the total oxygen demand loading on the plant which was calculated as the product of flow rate and the sum of COD and 4.5 times the ammonia nitrogen concentration. The next panel (c) shows the OTE and air flow rate as determined from off-gas analysis and the air flow rate, also calculated from off-gas analysis. The lower panel (d) shows the oxygen uptake rate, also calculated from off-gas analysis. The results of this test are useful to designers and clearly show the value of flow equalization. The results are also value for understanding the process dynamics and how the OTE is not a constant value, but changes with plant loading. The α factor can also be calculated from the data shown in Figure 6, and will be the subject of future work from our laboratory. Design engineers and operators need to plan for a range of transfer efficiencies when designing and operating their treatment plants. It is also interesting to observe the lag between plant loading and oxygen uptake rate, as well as the lag in transfer efficiency and plant loading. The load requires one to two hours to exert its effect on oxygen uptake rate. Also, the low loading period from hours 15 to 21 creates a period of higher oxygen transfer efficiency, which is believed to correspond to reduced surfactant concentrations in the mixed liquor. Trends such as these have been observed by the authors at other treatment plants. CONCLUDING REMARKS This paper has described the current state of clean and in-process water oxygen transfer testing. The ASCE Standard, adopted in 1984, eliminated much of the guess work and variability in clean water testing, creating a uniform set of procedures that all manufacturers and consultants can rely upon. The Standard has eliminated several of the key pitfalls of oxygen transfer parameter estimation, including the use of a priori methods for selecting the equilibrium oxygen concentration, which can influence overall results by ± 20 to 25%. The new Standard will contain additional information to assist in the testing of loop (ditch) activated sludge processes, HPO-AS processes and will also have a recommended procedure for eliminating the effects of variable TDS in the test water.
The in-process water Standard Guidelines are now nine years old and have had two major impacts on process water testing. The first is encouraging the wide-spread use of off-gas testing for evaluating process performance. Off-gas testing has become the method of choice for diffused aeration systems. It is shown how it can be used to evaluate oxygen transfer efficiency as a function of process loads as well as show the impacts of flow equalization. Off-gas testing can also be used for pilot plant evaluations or novel processes such as the biological aerated filter (Newman, et al. 2005). The second major impact is the reduction in use of the steady-state “BOD” bottle method for estimating transfer rates. REFERENCES Albertson, O. E., and DiGregorio, D. (1975) "Biologically mediated inconsistencies in aeration equipment performance." J. Water Pollution Control Federation, Vol., 47, 976 ASCE (1991). ASCE Standard: Measurement of Oxygen Transfer in Clean Water, ISBN 0-87262-430-7, New York, NY. ASCE (1997) Standard Guidelines for In-Process Oxygen Transfer Testing, ASCE 18-96, 3 45 E. 47th St, New York, NY. Baillod C. R. (1979a) “Review of oxygen transfer model refinements and data interpretation” In Workshop Toward an Oxygen Transfer Standard (Edited by Boyle W. C.), US EPA/600-9-78-021 pp. 17-26. Boyle, W.C., Berthoue, P.M. and Rooney, T.C. (1974), “Pitfalls in Oxygen Transfer Parameter Estimation,” for Oxygen-Transfer Data,” Journal of the Environmental Engineering Division, ASCE, Vol. 100, pp. 391-408. Boyle, W.C., Stenstrom, M.K., Campbell, H.O. and Brenner, R.C. (1989) “Oxygen Transfer in Clean and Process Water for Draft Tube Turbine Aerators in Total Barrier Oxidation Ditches,” Journal of the Water Pollution Control Federation, Vol. 61, pp. 1449-1463. Conway, R.A. and Kumke, G.W. (1966). "Field Techniques for Evaluating Aerators," Journal of the Sanitary Engineering Division, ASCE, Vol. 92, SA2, p21. Downing, A.L. (1960). "Aeration in the Activated Sludge Process," Institution of Public Health Engineers, Vol. 59, pp 80. Hoover, S.R., Jasewicz, L. and Porges, N. (1954). "Measurement of Oxygen Transfer ," Inst. and Autom., Vol. 27, p 774. Leary, R.D., Ernest, L.A. and Katz, W.J. (1968). "Effect of Oxygen Transfer Studies of Seven Diffuser Systems," Journal of the Water Pollution Control Federation, Vol. 40, pp 1298. Pauling, L., Wood, R.E., Sturdivant, J.H. (1968)."An Instrument for Determining the Partial Pressure of Oxygen in a Gas," Journal of the American Chemical Society, Vol. 68, p 795.
Prit, S.J. and Callow, D.S. (1958). "Exocellular Product Formation by Microorganisms Continuous Culture I. Production of 2:3-Butanediol by Aerobacter Aerogenes in a Single Stage Process," Journal of Applied Bacteriology, Vol. 21, pp 188. Lewis, W.K. and Whitman, W.G. (1924). “Principles of gas absorption,” Industrial and Engineering Chemistry, Vol.16, pp. 1215–1220. Mueller, J.A. and Stensel, H.D. (1990) “Biologically Enhanced Transfer in the Activated Sludge Process,” Research Journal of the Water Pollution Control Federation, Vol. 62, 192-203. Newman, J., Occiano, V., Appleton, R., Melcer, H., Sen, S., Parker, D., Langworthy, A. and P. Wong, (2005) “Confirming BAF Performance for Treatment of CEPT Effluent on a Space Constrained Site,” Proc. of 78th WEFTEC Conference, Washington, DC., WEF. Alexandria VA. Philichi, T. and Stenstrom, M.K (1989) “The Effect of Dissolved Oxygen Probe Lag Upon Oxygen Transfer Parameter Estimation,” Journal of the Water Pollution Control Federation, Vol. 61, pp 83-86. Redmon, D.T., Boyle, W.C., Ewing, L., (1983) Oxygen transfer efficiency measurements in Mixed liquor using off-gas techniques. Journal of the Water Pollution Control Federation, Vol. 55, pp. 1338–1347. Rosso, D., Iranpour, R. and Stenstrom, M.K. (2005), “Fifteen Years of Off-Gas Transfer Efficiency Measurements on Fine Pore Aerators: Key Role of Sludge Age and Normalized Air Flux,” Water Environment Research, Vol. 77, pp 266-273. Sawyer, C.N., and Nichols, M.S. (1939). "Activated Sludge Oxidations -I Effect of Sludge Concentration and Temperature on Oxygen Utilization," Sewage Works Journal, Vol. 11, p 52. Stenstrom, M.K. and Gilbert, R.G. (1981) “Effects of Alpha, Beta and Theta Factors in Design, Specification and Operations of Aeration Systems,” Water Research, Vol. 15, pp 643-654. Stenstrom, M.K., L.C. Brown and H.J. Hwang (1981) “Oxygen Transfer Parameter Estimation,” Journal of the Environmental Engineering Division, ASCE, Vol. 107, pp 379-397. US EPA (1979) Workshop Toward an Oxygen Transfer Standard, (edited by Boyle W. C.), EPA/600-9-78-021 U.S. Environmental Protection Agency: Cincinnati, Ohio. U.S. EPA (1989) Fine Pore (Fine Bubble) Aeration Systems, EPA/625/1-89/023; U.S. Environmental Protection Agency: Cincinnati, Ohio.


![NOTICE OF INCORPORATION United States Legal Document · 2012. 7. 31. · ASCE 17-96 Air-Supported Structures ASCE ] 8-96 Standard Guidelines for In-Process Oxygen Transfer Testing](https://static.documents.pub/doc/80x56/610e77375192c85f687f2234/notice-of-incorporation-united-states-legal-document-2012-7-31-asce-17-96-air-supported.jpg)


