Thermodynamic and Energy Efficiency Analysis of Power Generationfrom Natural Salinity Gradients by Pressure Retarded OsmosisNgai Yin Yip and Menachem Elimelech*
Department of Chemical and Environmental Engineering, Yale University, New Haven, Connecticut 06520-8286, United States
*S Supporting Information
ABSTRACT: The Gibbs free energy of mixing dissipatedwhen fresh river water flows into the sea can be harnessed forsustainable power generation. Pressure retarded osmosis(PRO) is one of the methods proposed to generate powerfrom natural salinity gradients. In this study, we carry out athermodynamic and energy efficiency analysis of PRO workextraction. First, we present a reversible thermodynamic modelfor PRO and verify that the theoretical maximum extractablework in a reversible PRO process is identical to the Gibbs freeenergy of mixing. Work extraction in an irreversible constant-pressure PRO process is then examined. We derive an expres-sion for the maximum extractable work in a constant-pressurePRO process and show that it is less than the ideal work (i.e.,Gibbs free energy of mixing) due to inefficiencies intrinsic to the process. These inherent inefficiencies are attributed to (i)frictional losses required to overcome hydraulic resistance and drive water permeation and (ii) unutilized energy due to thediscontinuation of water permeation when the osmotic pressure difference becomes equal to the applied hydraulic pressure. Thehighest extractable work in constant-pressure PRO with a seawater draw solution and river water feed solution is 0.75 kWh/m3
while the free energy of mixing is 0.81 kWh/m3a thermodynamic extraction efficiency of 91.1%. Our analysis further revealsthat the operational objective to achieve high power density in a practical PRO process is inconsistent with the goal of maximumenergy extraction. This study demonstrates thermodynamic and energetic approaches for PRO and offers insights on actualenergy accessible for utilization in PRO power generation through salinity gradients.
■ INTRODUCTIONThe impetus to reduce greenhouse gas emissions and mitigateclimate change has invigorated research on alternative powersources.1 Natural salinity gradients have been identified as apromising source of clean renewable energy. The free energy ofmixing that is released when two solutions of different saltconcentration are combined can be harnessed for sustainablepower production.2 When fresh river water mixes with the sea,free energy equal to a 270 m high waterfall is released.3 The an-nual global river discharge of ∼37 300 km3 represents an enor-mous source of renewable energy4 that can potentially producean estimated 2 TW of electricity, or 13% of global electricityconsumption.5
Several methods have been proposed to harvest this sus-tainable energy source, including reverse electrodialysis,6,7 mixingentropy batteries,5 and pressure retarded osmosis (PRO).8,9 InPRO salinity power generation, the osmotic pressure differenceacross a semipermeable membrane drives the permeation ofwater from the dilute river water “feed solution” into con-centrated seawater “draw solution”. A hydraulic pressure lessthan the osmotic pressure difference is applied to the drawsolution, thereby “retarding” water flux across the membrane,and a hydroturbine extracts work from the expanding drawsolution volume. In 2009, the world’s first PRO power plant
came into operation in Norway, demonstrating the potentialviability of the process.9 The prospects of cost-effective osmoticpower production are further bolstered by the recent devel-opment of thin-film composite PRO membranes with transportand structural properties projected to produce high powerdensities.10−12
Previous studies on power generation from natural salinitygradients employed the Gibbs free energy of mixing to evaluatethe realizable energy.3,5,13,14 However, the free energy of mixingrepresents the theoretical maximum energy that is available foruseful work by a reversible thermodynamic process and doesnot take into account the intrinsic thermodynamic inefficien-cies. Hence, actual work output will always be less than thetheoretical energy available because practical work extractionprocesses are irreversible in nature and, thus, generateentropy.15−17 To obtain the actual extractable worka moreapplicable and relevant figurethermodynamic conversionefficiencies have to be incorporated into the energy analysis.
Received: January 10, 2012Revised: March 28, 2012Accepted: April 1, 2012Published: April 2, 2012
In this study we carry out a thermodynamic and energyefficiency analysis of pressure retarded osmosis. The theoreticalmaximum extractable work in a PRO process is determinedfrom a reversible thermodynamic model for PRO andcompared to the Gibbs free energy of mixing. We thenexamine the thermodynamic efficiency of work extraction in apractical constant-pressure PRO process using natural salinitygradients. The inherent inefficiencies of frictional losses andunutilized energy imposed by the constant-pressure PROprocess are analyzed and discussed. Finally, we look at thepractical constraints of an actual PRO process and highlight theimplications on energy extraction efficiency. Our analysis of thethermodynamic considerations in the extraction of work fromnatural salinity gradients provides insights into the energyefficiency intrinsic to the PRO power generation process.
■ ENERGY OF MIXING
When two solutions of different compositions are mixed, theGibbs free energy of mixing is released. In this section we drawupon established thermodynamic concepts15,16,18−20 to present acondensed theoretical background on the energy change ofmixing for a binary system of aqueous strong electrolyte solutions.A detailed presentation of the energy change of mixing can befound in the Supporting Information (SI).Mixing Releases Free Energy. Mixing two solutions, A
and B, of different composition yields a resultant mixture, M.The difference in the Gibbs free energy between the final mixture(GM) and initial (GA and GB) solutions gives the change in freeenergy of mixing.15 The Gibbs free energy of mixing per mole ofthe system, ΔGmix, is
16
∑ ∑
∑
−Δ = γ − ϕ γ
− ϕ γ
⎡⎣ ⎤⎦ ⎡⎣ ⎤⎦⎡⎣ ⎤⎦
{}
G RT x x x x
x x
ln( ) ln( )
ln( )
i i i i i i
i i i
mixM A A
B B (1)
where xi is the mole fraction of species i in solution, R is the gasconstant, and T is temperature. The activity coefficient, γi, isincorporated to account for the behavior of nonideal solutions,and is a function of the temperature, pressure, and solutioncomposition.16 ϕA and ϕB are the ratios of the total moles insolutions A or B, respectively, to the total moles in the system(i.e., ϕA + ϕB = 1). Here, we adopt the negative convention forthe energy of mixing to reflect that energy is released.An inspection of eq 1 reveals that ΔGmix is dependent on the
relative proportion of the initial solutions (ϕA and ϕB) and thecomposition of the solutions (xi and, implicitly, γi) for a mixingprocess at constant temperature and pressure. The Gibbs freeenergy of mixing described in eq 1 is applicable for all generalmixing processes,15 and it is equal and opposite in sign to theminimum energy required to separate the mixture M into prod-ucts A and B.19
Energy Change of Mixing for Strong ElectrolyteSolutions. For a two-component system of aqueous strongelectrolyte solutions, the two species are water and a salt thatdissociates completely in solution (denoted by subscripts wand s, respectively). For relatively low salt concentrationsolutions, both the mole fraction of water, xw, and the activitycoefficient, γw, can be approximated to unity.18 There-fore, ln(γwxw) for the initial solutions and final mixtureapproaches zero in eq 1. In this case, the contribution ofthe salt species to ΔGmix overwhelms the contribution of the
water species, and the molar Gibbs free energy of mixing(eq 1) simplifies to
−Δν
≈ γ − ϕ γ
− ϕ γ
⎡⎣ ⎤⎦ ⎡⎣ ⎤⎦⎡⎣ ⎤⎦
GRT
x x x x
x x
ln( ) ln( )
ln( )
s s s s s s
s s s
mixM A A
B B (2)
where ν, the number of ions each electrolyte moleculedissociates into, accounts for the multiple ionic speciescontribution of the strong electrolyte salt.16
For practicality and ease of application, the mole fraction andmolar mixing energy in eq 2 are converted to molar saltconcentration and Gibbs free energy of mixing per unit volume,respectively. This is achieved by assuming the volumetric and molecontribution of the salt to the solution is negligible compared towater, and that the volume of the system remains constant in themixing process (VA + VB = VM). Thus, the mole fractions can beapproximated to the volumetric fractions. The detailed steps of theconversion can be found in the SI. The Gibbs free energy of mixingper unit volume of the resultant mixture, ΔGmix,VM
, is then
−Δ
ν≈ γ − ϕ γ
− − ϕ γ
G
RTc c c c
c c
ln( ) ln( )
(1 ) ln( )
Vs s
s
mix,M ,M M A ,A A
B ,B B
M
(3)
where c is the molar salt concentration of the aqueous solutionsand ϕ is the ratio of the total moles in solution A to the totalmoles in the system (i.e., ϕ = ϕA and 1 − ϕ = ϕB). Based onthe above simplifying assumptions, ϕ is also the volumetricratio of solution A to the total system volume (i.e., ϕ = VA/ VM).An examination of eq 3 shows that ΔGmix,VM
is solely a functionof the salt concentration and mole fraction (or volume fraction)of the initial solutions (cM is determined by cA, cB, and ϕ, while γis dependent on c).In power generation from natural salinity gradients, often
seawater from the ocean is abundant while fresh water from theestuaries is the limiting resource. As such, expressing the mixingenergy per unit volume of the dilute solution would moreaccurately capture the energy available for extraction. Multi-plying eq 3 by VM/VA (≈ 1/ϕ) yields the Gibbs free energy ofmixing per unit volume of A (the more dilute solution):
−Δ
ν≈
ϕγ − γ − − ϕ
ϕ
γ
G
RTc
c c c
c c
ln( ) ln( )(1 )
ln( )
Vs s
s
mix, M,M M A ,A A
B ,B B
A
(4)
Figure 1 shows ΔGmix,VA, calculated using eq 4, for the mixing
of a fresh water source with seawater as a function of the molefraction of the fresh water, ϕ, in 0.1 increments. Fresh waters(dilute solution A) with salinities of 1.5 and 17 mM (∼88 and∼1000 mg/L) NaCl were selected to represent river water(blue square symbols) and brackish water (red circle symbols),respectively.10 The seawater (concentrated solution B) wastaken to be 600 mM (35 g/L) NaCl10 and the temperature, T,was fixed at 298 K. The calculated values are presented in SITable S1. The activity coefficients of the initial solutions (A and B)and resultant mixture (M) were approximated by linearinterpolation of the data in SI Table S2.The highest mixing energy of 0.77 kWh/m3 (2.76 kJ/L) is
achieved for river water when ϕ tends to zero (i.e., an infin-itesimal amount of fresh water mixes with an infinitely largevolume of seawater). This value of 0.77 kWh/m3 is similar to
the minimum energy to desalinate seawater at 0% recovery21,22
(the minor difference between the values is attributed to theslight difference in concentrations and approximationsemployed for the calculations). This observation is consistentwith our understanding of reversible thermodynamics: theseparation energy at 0% recovery is equal in magnitude butopposite in sign to the free energy of mixing at ϕ = 0. As themole fraction of the fresh water increases, ΔGmix,VA
decreasesand eventually reaches zero at ϕ = 1. A similar trend is observedfor brackish water, except that at ϕ = 0, the energy of mixing is0.68 kWh/m3 (2.45 kJ/L). This value is lower compared to riverwater due to the higher initial salt content of brackish water.Note that actual seawater contains a mixed composition of ionicspecies other than Na+ and Cl−,23 and the energy of mixing will,therefore, differ slightly from the above calculated values.ΔGmix for Ideal Solutions. For the relatively low salt
concentrations investigated in this study, the mole fraction ofsalt (or molar salt concentration) dominates over the saltactivity coefficient in the logarithmic term in eq 4, i.e., ln(γsxs) =ln(γs) + ln(xs) ≈ ln(xs). For example, for a 600 mM NaClsolution, which is representative of seawater, ln(xs) =ln(0.0107) = −4.54 is much greater in magnitude thanln(γs) = ln(0.672) = −0.40 (SI Table S2).18 To further simplifythe analysis, we can neglect the activity coefficients (i.e., assumeideal behavior) and eq 4 further reduces to
−Δ
ν≈
ϕ− − − ϕ
ϕG
RTc
c c c c cln ln(1 )
lnVmix, MM A A B B
A
(5)
Figure 1 shows ΔGmix,VA, determined using eq 5, for the mix-
ing of a river water (solid blue line) and brackish water (dashedred line) with seawater, as a function of ϕ. The ΔGmix,VA
values
calculated using eq 5 for 0.1 increments in ϕ are presented in SITable S1. The concentrations of the fresh water sources andseawater were the same as those used in the previous cal-culations of ΔGmix,VA
(i.e., with eq 4). The highest mixing energies
of 0.81 kWh/m3 (2.92 kJ/L) and 0.72 kWh/m3 (2.59 kJ/L) areachieved for river water and brackish water, respectively, when ϕtends to zero. The free energy of mixing determined without theactivity coefficient, γ, exhibits a similar trend compared to ΔGmix,VA
with γ (i.e., eq 4), except the values are slightly higher (∼5.4−9.3%, SI Table S1). The similar trend and magnitude of themixing energies between eqs 4 and 5 reinforces the validity ofthe simplifying step to ignore the activity coefficients. Althoughsome precision is sacrificed, eq 5 offers a great ease of applica-tion, compared to eq 4, as ΔGmix,VA
can be determined directly.
The change in Gibbs free energy represents an upper boundon the energy that can be extracted for useful work, regardlessof the pathway. However, the second law of thermodynamicsstipulates that in actual cases, the useful work extracted isalways less than ΔGmix,VA
due to the production of entropy.15
The inherent irreversible energy losses in the work extractionprocesses are analogous to the thermodynamic inefficiencies ofseparation processes, where the energy consumed to carry outthe purification is always greater than the theoretical minimumenergy of separation.19 Therefore, an efficient work extractionprocess is one that minimizes such thermodynamic inefficien-cies and utilizes most of the available energy.
■ REVERSIBLE THERMODYNAMIC MODEL OFPRESSURE RETARDED OSMOSIS
In pressure retarded osmosis power generation, a semiper-meable membrane separates two solutions of different con-centration. The osmotic pressure difference that developsacross the membrane drives the permeation of water from thedilute feed solution into the more concentrated draw solution.A hydraulic pressure less than the osmotic pressure difference isapplied to the draw solution and a hydroturbine extracts workfrom the expanding draw solution volume. In this section, wepresent a reversible thermodynamic model of PRO and showthe derivation of the theoretical maximum extractable work. Inthe following analyses, a 600 mM NaCl draw solution is used tosimulate seawater of ∼35 g/L TDS, while the salt concen-trations of the feed solutions are 1.5 and 17 mM NaCl, torepresent river water and brackish water of approximately 88and 1000 mg/L TDS, respectively.10 The temperature is 298 Kand assumed to remain constant throughout the PRO process.
Pressure Retarded Osmosis Model. Figure 2 shows theschematics of a PRO process. The dilute feed solution (of initialconcentration cF
0 and volume VF0) is separated from the draw
solution (of initial concentration cD0 and volume VD
0 ) by an idealsemipermeable membrane that completely rejects salt (NaCl)while allowing water to permeate (Figure 2A). We assume thevan’t Hoff relation to be valid (i.e., ideal solutions) for theconcentration range considered here. Therefore, the osmoticpressure of the solutions is π = νcRT, where ν is the number ofionic species each salt molecule dissociates into, c is the molarsalt concentration, R is the gas constant, and T is the absolutetemperature.
Figure 1. Gibbs free energy of mixing, ΔGmix,VA, as a function of the
mole fraction of the fresh river or brackish water (A) to both the freshwater and seawater (A and B), ϕ. The change in free energy of mixingis expressed as the energy released per unit volume of the river orbrackish water. Blue square symbols and red circle symbols indicateΔGmix,VA
calculated with activity coefficients (eq 4) for river water and
brackish water, respectively. Solid blue line and dashed red line representΔGmix,VA
determined without γ (eq 5) for river water and brackish water,
respectively. The calculations were carried out for a temperature of 298 K,and the concentration of seawater was assumed to be 600 mM (35 g/L)NaCl, while the concentrations of river water and brackish water weretaken to be 1.5 and 17 mM (88 and 1000 mg/L) NaCl, respectively. Forthe dilute concentrations considered here, the mole fraction can beapproximated to be the volumetric fraction of freshwater.
The difference in osmotic pressure drives water flux from thefeed to the draw solution, as illustrated in Figure 2B. As waterpermeates across the membrane, it dilutes the draw solutionto concentration cD = cD
0VD0 /(VD
0 + ΔV), where ΔV is the per-meate volume. Volume is conserved, based on the earlierassumption that the dilute solutions exhibit ideal behavior, andΔV is equivalent to the increase in draw solution volume anddecrease in feed solution volume. The concentration of the feedsolution, hence, increases to cF = cF
0VF0/(VF
0 − ΔV) due to thecomplete rejection of salt by the membrane.In the absence of an applied hydraulic pressure, water per-
meation is terminated when the concentrations of the draw andfeed solutions equilibrate and the net osmotic driving forcevanishes (i.e., Δπ = 0). The concentration of the final solutionsat this point, denoted by the superscript f, is
= = − ϕ + ϕ ≡c c c c c(1 )f f fF D D
0F0
(6)
where ϕ = VF0/(VD
0 + VF0) is the ratio of the initial feed solution
volume to both initial draw and feed solution volume. Note thatϕ is approximately the mole fraction because we assume the
volumetric contribution of salt is negligible compared to that ofwater. Hence, ϕ is consistent with the previous definition usedto determine the energy of mixing.The total volume of permeate, ΔVf, that ultimately passes
into the draw solution can be calculated by solving ΔV forcD = cF:
Δ = − ϕϕ
− = −⎛⎝⎜
⎞⎠⎟
⎛⎝⎜
⎞⎠⎟
VV
cc
cc
11 1
f
f fF0
D0
F0
(7)
The final total permeate volume divided by the initial feedsolution volume (eq 7) gives the fraction of VF
0 that eventuallypermeates into the draw solution. SI Figure S1 shows ΔVf/VF
0
as a function of ϕ for a river water or brackish water feedsolution (1.5 and 17 mM NaCl, respectively) and a seawaterdraw solution (600 mM NaCl).
Reversible Thermodynamic PRO Process. In thetheoretical reversible thermodynamic PRO model, an infin-itesimal water flux is maintained throughout the osmosis pro-cess. This is achieved by applying a hydraulic pressure, ΔP,negligibly smaller than the osmotic pressure difference, Δπ, onthe draw solution such that an infinitesimally small volume ofpure water permeates across the membrane. The draw solutionis diluted very slightly by the minuscule permeate while theconcentration of the feed solution increases a little. Hence, theosmotic pressure difference decreases such that Δπ = ΔP.The applied hydraulic pressure is then lowered marginally foranother tiny drop of water to permeate across. Based on thevan’t Hoff relation, the osmotic pressure difference when ΔVhas permeated across the membrane is linearly proportional tothe concentration difference (Δc = cD − cF):
Δπ = ν Δ = ν+ Δ
−− Δ
⎛⎝⎜
⎞⎠⎟RT c RT
VV V
cV
V VcD
0
D0 D
0 F0
F0 F
0
(8)
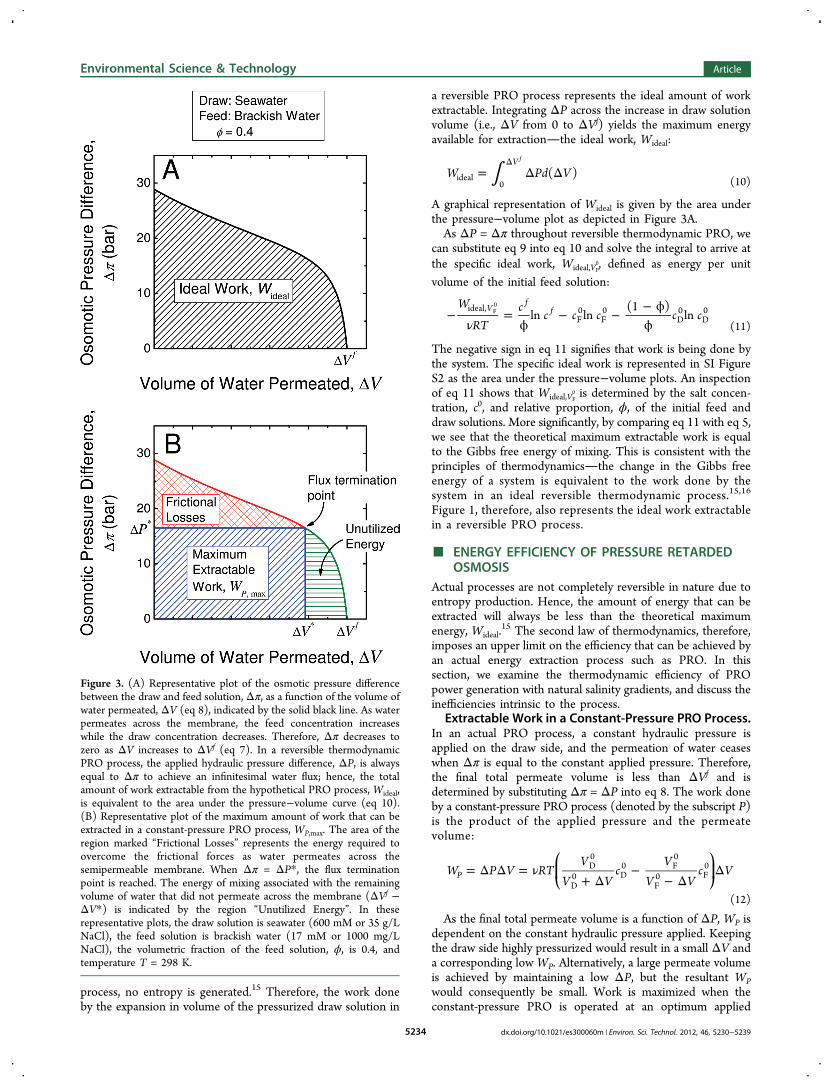
The process of gradually reducing the applied hydraulicpressure is repeated in infinite small steps to achieve a con-tinuous decrease in ΔP while keeping ΔP = Δπ. At any pointduring the process, the applied hydraulic pressure can be raisedsuch that ΔP is just slightly higher than Δπ. The process is thus“reversed” as an infinitesimally small volume of pure waterpermeates back into the feed solution. A representative plot ofΔπ as a function of ΔV (eq 8) is shown in Figure 3A for a sea-water draw solution and brackish water feed solution. Thevolumetric fraction of the feed solution ϕ = 0.4 and ν = 2 forNaCl. The horizontal axis intercept indicates the final permeatevolume, ΔVf, when the salinity difference reaches zero.Substituting the initial draw solution volume expressed in
Thus, using eq 9, we can express Δπ in terms of ΔV/VF0the
volumetric fraction of the initial feed solution that has per-meated into the draw solution. The osmotic pressure differenceas a function of ΔV/VF
0 is shown in SI Figure S2 for a range ofϕ values with the same seawater draw solution and brackishwater feed solution.
Theoretical Maximum Extractable Work is Equal tothe Gibbs Energy of Mixing. In a reversible thermodynamic
Figure 2. Schematics of a pressure retarded osmosis process. The drawand feed solutions are separated by an ideal semipermeable membranethat allows the passage of water while completely rejecting salt. (A)Initially, the higher concentration of the draw solution induces anosmotic pressure difference, Δπ = πD
0 − πF0, across the membrane to
provide the driving force for water flux from the feed side to the drawside. (B) During the PRO process, the draw solution is pressurized byan applied hydraulic pressure, ΔP. Due to the cumulative volume ofpure water, ΔV, that has permeated across the membrane, the feedsolution is concentrated while the draw solution is diluted.
process, no entropy is generated.15 Therefore, the work doneby the expansion in volume of the pressurized draw solution in
a reversible PRO process represents the ideal amount of workextractable. Integrating ΔP across the increase in draw solutionvolume (i.e., ΔV from 0 to ΔVf) yields the maximum energyavailable for extractionthe ideal work, Wideal:
∫= Δ ΔΔ
W Pd V( )V
ideal0
f
(10)
A graphical representation of Wideal is given by the area underthe pressure−volume plot as depicted in Figure 3A.As ΔP = Δπ throughout reversible thermodynamic PRO, we
can substitute eq 9 into eq 10 and solve the integral to arrive atthe specific ideal work, Wideal,VF
0, defined as energy per unitvolume of the initial feed solution:
−ν
=ϕ
− − − ϕϕ
W
RTc
c c c c cln ln(1 )
lnVf
fideal,F0
F0
D0
D0F
0
(11)
The negative sign in eq 11 signifies that work is being done bythe system. The specific ideal work is represented in SI FigureS2 as the area under the pressure−volume plots. An inspectionof eq 11 shows that Wideal,VF
0 is determined by the salt concen-tration, c0, and relative proportion, ϕ, of the initial feed anddraw solutions. More significantly, by comparing eq 11 with eq 5,we see that the theoretical maximum extractable work is equalto the Gibbs free energy of mixing. This is consistent with theprinciples of thermodynamicsthe change in the Gibbs freeenergy of a system is equivalent to the work done by thesystem in an ideal reversible thermodynamic process.15,16
Figure 1, therefore, also represents the ideal work extractablein a reversible PRO process.
■ ENERGY EFFICIENCY OF PRESSURE RETARDEDOSMOSIS
Actual processes are not completely reversible in nature due toentropy production. Hence, the amount of energy that can beextracted will always be less than the theoretical maximumenergy, Wideal.
15 The second law of thermodynamics, therefore,imposes an upper limit on the efficiency that can be achieved byan actual energy extraction process such as PRO. In thissection, we examine the thermodynamic efficiency of PROpower generation with natural salinity gradients, and discuss theinefficiencies intrinsic to the process.
Extractable Work in a Constant-Pressure PRO Process.In an actual PRO process, a constant hydraulic pressure isapplied on the draw side, and the permeation of water ceaseswhen Δπ is equal to the constant applied pressure. Therefore,the final total permeate volume is less than ΔVf and isdetermined by substituting Δπ = ΔP into eq 8. The work doneby a constant-pressure PRO process (denoted by the subscript P)is the product of the applied pressure and the permeatevolume:
= Δ Δ = ν+ Δ
−− Δ
Δ⎛⎝⎜
⎞⎠⎟W P V RT
VV V
cV
V Vc VP
D0
D0 D
0 F0
F0 F
0
(12)
As the final total permeate volume is a function of ΔP, WP isdependent on the constant hydraulic pressure applied. Keepingthe draw side highly pressurized would result in a small ΔV anda corresponding low WP. Alternatively, a large permeate volumeis achieved by maintaining a low ΔP, but the resultant WPwould consequently be small. Work is maximized when theconstant-pressure PRO is operated at an optimum applied
Figure 3. (A) Representative plot of the osmotic pressure differencebetween the draw and feed solution, Δπ, as a function of the volume ofwater permeated, ΔV (eq 8), indicated by the solid black line. As waterpermeates across the membrane, the feed concentration increaseswhile the draw concentration decreases. Therefore, Δπ decreases tozero as ΔV increases to ΔVf (eq 7). In a reversible thermodynamicPRO process, the applied hydraulic pressure difference, ΔP, is alwaysequal to Δπ to achieve an infinitesimal water flux; hence, the totalamount of work extractable from the hypothetical PRO process, Wideal,is equivalent to the area under the pressure−volume curve (eq 10).(B) Representative plot of the maximum amount of work that can beextracted in a constant-pressure PRO process, WP,max. The area of theregion marked “Frictional Losses” represents the energy required toovercome the frictional forces as water permeates across thesemipermeable membrane. When Δπ = ΔP*, the flux terminationpoint is reached. The energy of mixing associated with the remainingvolume of water that did not permeate across the membrane (ΔVf −ΔV*) is indicated by the region “Unutilized Energy”. In theserepresentative plots, the draw solution is seawater (600 mM or 35 g/LNaCl), the feed solution is brackish water (17 mM or 1000 mg/LNaCl), the volumetric fraction of the feed solution, ϕ, is 0.4, andtemperature T = 298 K.
hydraulic pressure, ΔP*, and permeate volume, ΔV*. SolvingdWP/dΔP (or dWP/dΔV) equal to zero yields
Δ * =−
+ ϕ− ϕ
Vc c
c cVD
0F0
D0
1 F0 F
0
(13)
Δ * = ν − ϕ − ϕ + ϕ −⎡⎣ ⎤⎦P RT c c c c(1 ) (2 1)D0
F0
D0
F0
(14)
SI Figures S1 and S3 show ΔV*/VF0 (ratio of total permeation
to initial feed solution volume) and ΔP*, respectively, as afunction of ϕ. Substituting eqs 13 and 14 into eq 12 gives themaximum extractable work in constant-pressure PRO, WP,max:
= Δ *Δ * = ν − ϕ −W P V RT c c V(1 )( )P ,max D0
F0 2
F0
(15)
Figure 3B illustrates the optimum applied hydraulic pressuredifference and permeate volume for a seawater draw solutionand brackish water feed solution when ϕ = 0.4. The maximumextractable work in constant pressure PRO is demarcated bythe area of the patterned blue region. Dividing the maximumwork by VF
0 gives the specific WP,max (energy per unit initial feedsolution volume). An examination of eq 15 reveals the constantnegative slope of the function with respect to ϕ: WP,max ishighest when ϕ is equal to zero, and as ϕ increases to one, thespecific WP,max decreases linearly to zero.Frictional Losses and Unutilized Energy. Because
constant-pressure PRO is not a completely reversible process,WP,max is less than the ideal amount of work extractable (eq 11).During water permeation, the frictional forces between thewater molecules and the membrane give rise to hydraulicresistance.24,25 To achieve a nonzero water flux across thesemipermeable membrane, a portion of the osmotic drivingforce is expended to overcome the resistance. Entropy isproduced when energy is spent to counter the solvent−membrane friction. This energy is, thus, not tapped for usefulwork and is analogous to the irreversible energy loss in areverse osmosis desalination process.22,26 The energy attributedto frictional losses is represented as the area of the patternedred region in Figure 3B, and is expressed as
∫= Δ Δ − Δ *Δ *Δ *
Pd V P VFrictional Losses ( )V
0 (16)
In constant-pressure PRO, the actual permeate volume issmaller than the volume of water that would eventuallypermeate into an unpressurized draw solution. This is becausethe permeation of water is terminated when the osmoticpressure difference is equal to the constant applied hydraulicpressure (i.e., interception of horizontal line, ΔP, and Δπ curvein Figure 3B), before the feed and draw solutions reach thesame concentration. At this point, the net driving force forwater flux becomes zero. Hence, the energy of mixingembedded in the “unpermeated” volume (ΔVf − ΔV*) is notextracted for useful work. This “unutilized energy” is indicatedas the area of green patterned region in Figure 3B, and isdescribed by
∫= Δ ΔΔ *
ΔPd VUnutilized Energy ( )
V
V f
(17)
Thermodynamic Efficiency of PRO Work Extraction.The first law of thermodynamics stipulates that the sum of theuseful, dissipated, and remaining energy (maximum extractable
work, frictional losses, and unutilized energy, respectively) isequal to the ideal work.15,16 Figure 4 (top) shows stacked plotsof the specific energies as a function of ϕ, for river water (A)and brackish water (B) feed solution. The wedges representingfrictional losses and unutilized energy (patterned red and greenregion, respectively) are stacked on top of the specific WP,max
(patterned blue region) to yield the specific ideal work, Wideal,VF0.
Adding up the specific energies in these plots yields the specificGibbs free energy of mixing, ΔGmix,VA
, indicated in Figure 1(solid blue line and dashed red line for a river water andbrackish water feed solution, respectively).The thermodynamic efficiency of work extraction, η, is
defined as the maximum percent of the Gibbs free energy ofmixing, or ideal work, that can be extracted in constant-pressurePRO:
η =Δ
×W
G100%P ,max
mix (18)
The thermodynamic efficiency is calculated by substituting eqs 5(or 11) and 15 into eq 18. Here, we assume zero energylosses from the PRO system components, such as pumps,pressure exchangers, and hydroturbines. Hence, η representsthe thermodynamic limit of work extraction and is a measure ofthe inefficiencies due to entropy production and unutilizedenergy that are intrinsic to constant-pressure PRO. Aninspection of eqs 5 (or 11) and 15 reveals that η is determinedby the initial salt concentrations and relative proportion, ϕ, ofthe feed and draw solutions. Figure 4 (bottom) shows η (solidblue line) for a river water (A) and brackish water (B) feedsolution paired with a seawater draw solution. The portion ofenergy consumed by frictional losses and the unutilized energyof mixing are indicated by the dashed red line and dotted greenline, respectively.For a river water−seawater PRO system, the specificWP,max is
largest at 0.75 kWh/m3 (2.68 kJ/L) when ϕ = 0, and decreaseslinearly to zero as ϕ increases to unity (eq 15 and Figure 4A,top). The thermodynamic efficiency decreases concomitantlyfrom 91.1 to 18.1% (Figure 4A, bottom). Therefore, it isenergetically desirable to operate constant-pressure PRO atsmall ϕ values (i.e., small feed solution volume is paired with alarge draw solution volume) to simultaneously achieve a highspecific WP,max and η. In an actual crossflow membrane module,ϕ is determined by the volumetric flow rate in the feed anddraw channels. Hence, a small ϕ corresponds to a relativelylow feed stream flow rate. A similar trend is observed for thebrackish water−seawater system (Figure 4B): the specificWP,max and η are highest at 0.57 kWh/m3 (2.06 kJ/L) and79.4%, respectively, when ϕ approaches zero. The lower saltconcentration in the initial river water feed solution, relativeto the brackish water, allows a higher specific WP,max andthermodynamic efficiency to be attained. However, the higherpurity of river water also signifies that it is a more precious anddesirable resource compared to brackish water. These, andother, factors will need to be considered when selecting thefeed solution for PRO power generation with natural salinitygradients.
Practical Constraints in PRO Operation. Membranepower density (power produced per membrane area) is a keyfactor in determining the economical feasibility of PRO powergeneration.3,9,27 Operating at a high power density will max-imize the utilization of membrane area, thereby reducing capitalcost and enhancing cost-effectiveness.3,9 To maximize power
density, a hydraulic pressure approximately half of the osmoticpressure difference is applied across the membrane, i.e., ΔP ≈(πD − πF)/2.
10,27 However, based on our preceding discussion,the ΔP requirement for maximum power density is incom-patible with the condition for achieving maximum extractablework in constant-pressure PRO, WP,max (eq 15). Therefore,when PRO is operated to maximize power density, the ex-tractable work is not fully accessed (except for ϕ = 0.5, whereboth aims are simultaneously realized).Membrane power density is the product of the PRO water
flux and the applied hydraulic pressure,27 while the water flux isproportional to the effective osmotic driving force across themembrane.27,28 As PRO progresses, the osmotic driving force(Δπ − ΔP) decreases due to dilution of the draw solution andconcentration of the feed solution. Beyond a certain point, theensuing water flux and power density become too low for cost-effective operation. The practical constraint to sustain an appre-ciable water flux at all points along the membrane requires theprocess to be terminated before the effective driving forcereaches zero. Hence, the actual permeate volume, ΔVactual, islower than the total volume that would eventually permeate ifthe process had proceeded to completion.A representation of the two operational constraints on work
extraction is depicted in Figure 5 for a brackish water−seawaterPRO system with ϕ = 0.4. The process is operated at a constant-pressure of ΔPactual = (πD
0 − πF0)/2 (14.5 bar) to maximize mem-
brane power density.10,27 When the effective osmotic driving
force falls below a certain level, the process is discontinued. Theactual extractable work, WP,actual, frictional losses, and unutilizedenergy are represented by the areas of patterned blue, red, andgreen regions, respectively. To facilitate comparison, the max-imum extractable work, WP,max, is indicated by the area withinthe dashed blue line.To maximize power density, the required applied hydraulic
pressure departs from the optimal ΔP* and the actual ex-tractable work is lower than WP,max. Figure 5 shows that moreenergy is expended to overcome membrane hydraulic resistanceand achieve a higher water flux (indicated by the overlappedarea of WP,max and frictional losses). That is, work is consumedfor entropy production instead. As PRO proceeds, the dwindl-ing water flux causes the membrane power density to diminishand eventually triggers the process to be discontinued. Theremaining energy of mixing is unutilized and, therefore, agreater portion of the available energy is not extracted forpower generation (area of patterned green region in Figure 5).The operational objectives to maximize and maintain
sufficient power density are not aligned with the goal of max-imum work extraction. In satisfying the practical power densityrequirements, the maximum extractable work in constant-pressure PRO is not fully exploited. The actual efficiency ofPRO work extraction, ηactual = (WP,actual/ΔGmix) × 100% islower than the constant-pressure thermodynamic efficiency, i.e.,ηactual < η. Therefore, practical PRO systems will need tobalance the two inconsistent objectives of maximizing power
Figure 4. Top: Specific maximum extractable work, frictional losses, and unutilized energy in a constant-pressure PRO process as a function of thevolumetric fraction of feed solution to both draw and feed solutions, ϕ. Bottom: Efficiency of work extraction (solid blue line), defined as the percentof total free energy of mixing that is extractable in a constant-pressure PRO process, as a function of ϕ. The percent of energy required to overcomethe frictional forces as water is driven across the semipermeable membrane (i.e., frictional losses) is indicated by the dashed red line. The dottedgreen line represents the percent of total energy that is unutilized due to the osmotic pressure difference being smaller than the constant appliedhydraulic pressure difference (i.e., Δπ ≤ ΔP). (A) River water (1.5 mM NaCl) and (B) brackish water (17 mM NaCl) are employed as the feedsolutions. The draw solution is seawater (600 mM NaCl) and temperature T = 298 K.
density and maximizing extraction efficiency through the operat-ing parameters (applied hydraulic pressure and processtermination point).
■ IMPLICATIONS FOR PRO ENERGY PRODUCTIONOur recent studies demonstrated the intricate influence ofmembrane properties on PRO power density performance.10,11
The membrane transport and structural parameters relate thebulk osmotic pressure difference and applied hydraulic pressureto the power density.10,11,27 A higher power density can beattained under the same operating conditions by employinghigh performance membranesactive layer with high waterpermeability and salt selectivity, coupled with customizedsupport layer that suppresses the detrimental effect of internalconcentration polarization.10,11 Improved membranes canenable PRO to be operated cost-effectively even when powerdensity is not maximized, i.e., ΔPactual ≠ (πD − πF)/2. Higherperformance membranes will also better utilize small osmoticpressure differences to produce relatively higher water fluxes,thereby enabling the generation of adequate power densitieseven with the dwindled Δπ toward the later phase of the PROprocess. As the process is allowed to proceed further, a largerportion of the free energy of mixing is converted to usablework. Therefore, the innovation of PRO membranes with thedesired transport and structural properties can enhance theefficiency of work extraction while maintaining sufficient waterflux and power density for cost-effective operation.Fouling is a key issue affecting productivity in membrane
processes as it gives rise to flux decline and shortenedmembrane life-span.22,29−31 To mitigate these detrimentaleffects, pretreatment of the input streams is typically employedin separation processes, such as reverse osmosis desalina-tion, which incurs an additional energy cost to the overallprocess.22,29,31,32 The PRO input feed stream will similarly need
to undergo pretreatment to control membrane fouling.33 Here,brackish water can have an advantage over river water. Brackishwaters from groundwater are naturally filtered through the sub-surface. Hence, a significant portion of the organic and colloidalmatter that causes membrane fouling is naturally removed.34
Employing brackish groundwater with lower fouling potential,instead of surface river water, can potentially reduce the energyrequirement for pretreatment, thus making PRO powergeneration from salinity gradients more attractive.Technological advances that are within our reach can address
some of the above-mentioned challenges. If the obstacles areadequately overcome, PRO can potentially harvest part of theenergy of mixing from the annual global river discharge of ∼37300 km3 to generate a significant source of clean sustainableenergy.4 For a PRO power plant operated at an actual efficiencyηactual = 60% with a river water feed solution and a seawaterdraw solution, i.e., ΔGmix = 0.77 kWh/m3, the specific ex-tractable work will be ηactual × ΔGmix = 0.46 kWh/m3. Assuminga further 20% is lost from inefficiencies in PRO system com-ponents, 0.37 kWh of useful work can be derived per cubicmeter of the river water feed solution.Channeling a tenth of the global river water discharge (i.e.,
3730 km3/y) for PRO can potentially generate 157 GW ofrenewable power, or 1370 TWh/y, after factoring in the con-servative estimations on process losses and inefficiencies. Thisis equivalent to the electrical consumption of 520 millionpeople, based on the average global electricity use of ∼300W/capita.35 Producing the same amount of electricity throughcoal-fired power plants, which release 1 kg of CO2 equivalentper kWh generated,36 would emit ∼1.37 × 10⁹ metric tons ofgreenhouse gases in CO2 equivalent. Nature’s hydrologicalcycle offers a significant source of sustainable energy throughsalinity gradients. Further studies to better our understandingof the technology will enable the realization of these clean andrenewable power sources toward alleviating our current climatechange and energy issues.
■ ASSOCIATED CONTENT
*S Supporting InformationPresentation of the energy change of mixing for a binary systemof aqueous strong electrolyte solutions; summary of the Gibbsfree energy of mixing with, and without, the activity coefficient(Table S1); summary of sodium chloride activity coefficients atdifferent molar concentrations (Table S2); plot of fraction ofinitial feed solution volume that permeates into the draw solu-tion, as a function of the volumetric fraction of the feed solution(Figure S1); plot of osmotic pressure difference between the drawand feed solutions, as a function of the volumetric fraction ofinitial feed solution permeated (Figure S2); plot of appliedhydraulic pressure difference in order to maximize the work thatcan be extracted in a constant pressure PRO process, as a functionof the volumetric fraction of the feed solution (Figure S3). Thisinformation is available free of charge via the Internet at http://pubs.acs.org/ .
NotesThe authors declare no competing financial interest.
Figure 5. Representative plot of the amount of work that can beextracted in an actual constant-pressure PRO process, WP,actual. Theosmotic pressure difference in excess of the hydraulic pressure (i.e.,Δπ − ΔP) provides the driving force for water flux (i.e., to overcomefrictional losses). In an actual PRO process, the constant appliedhydraulic pressure difference is constrained by the operational needto sustain sufficient water flux. Therefore, the actual work that isextracted, represented by the patterned region marked WP,actual, is lessthan the WP,max, indicated by area under the dotted blue line. In thisrepresentative plot, the draw solution is seawater (600 mM NaCl), thefeed solution is brackish water (17 mM NaCl), the volumetric fractionof the feed solution, ϕ, is 0.4, and the temperature T = 298 K.
■ ACKNOWLEDGMENTSWe acknowledge the Graduate Fellowship (to N.Y.Y.) made bythe Environment and Water Industrial Development Council ofSingapore.
■ NOMENCLATUREc molar concentrationΔc salt concentration difference across the membraneG molar Gibbs free energy of solutionΔGmix molar Gibbs free energy of mixingΔGmix,VA
specific Gibbs free energy of mixing
ΔGmix,VMGibbs free energy of mixing per unit volume of theresultant mixture
N number of moles in solutionΔP applied hydraulic pressure difference across the
membraneR gas constantT absolute temperatureV volume of solutionΔV permeate volumexi mole fraction of species i in solutionWideal ideal workWideal,VF
0 specific ideal work
WP work done by a constant-pressure PRO processWP,max maximum work done by a constant-pressure PRO
process
■ GREEK SYMBOLSγi activity coefficient of species iη thermodynamic efficiencyηactual work extraction efficiency in an actual PRO processν number of ions each electrolyte molecule dissociates intoπ osmotic pressure of the solutionΔπ osmotic pressure difference across the membraneϕ ratio of total moles (or volume) of the solution to total
moles (or volume) of the system
■ SUPERSCRIPTS0 initialf final* optimum parameter to achieve maximum work in a
constant-pressure PRO process
■ SUBSCRIPTSA solution AB solution BD draw solutionF feed solutionM resultant mixtures salt speciesw water species
■ REFERENCES(1) Hoffert, M. I.; Caldeira, K.; Benford, G.; Criswell, D. R.; Green,C.; Herzog, H.; Jain, A. K.; Kheshgi, H. S.; Lackner, K. S.; Lewis, J. S.;Lightfoot, H. D.; Manheimer, W.; Mankins, J. C.; Mauel, M. E.;Perkins, L. J.; Schlesinger, M. E.; Volk, T.; Wigley, T. M. L. Advancedtechnology paths to global climate stability: Energy for a greenhouseplanet. Science 2002, 298 (5595), 981−987.(2) Pattle, R. E. Production of Electric Power by Mixing Fresh andSalt Water in the Hydroelectric Pile. Nature 1954, 174 (4431), 660−660.
(3) Ramon, G. Z.; Feinberg, B. J.; Hoek, E. M. V. Membrane-basedproduction of salinity-gradient power. Energy Environ. Sci. 2011, 4(11), 4423−4434.(4) Dai, A.; Trenberth, K. E. Estimates of freshwater discharge fromcontinents: Latitudinal and seasonal variations. J. Hydrometeorol. 2002,3 (6), 660−687.(5) La Mantia, F.; Cui, Y.; Pasta, M.; Deshazer, H. D.; Logan, B. E.Batteries for Efficient Energy Extraction from a Water SalinityDifference. Nano Lett. 2011, 11 (4), 1810−1813.(6) Lacey, R. E. Energy by reverse electrodialysis. Ocean Eng. 1980, 7(1), 1−47.(7) Post, J. W.; Hamelers, H. V. M; Buisman, C. J. N. EnergyRecovery from Controlled Mixing Salt and Fresh Water with a ReverseElectrodialysis System. Environ. Sci. Technol. 2008, 42 (15), 5785−5790.(8) Loeb, S. Osmotic Power-Plants. Science 1975, 189 (4203), 654−655.(9) Achilli, A.; Childress, A. E. Pressure retarded osmosis: From thevision of Sidney Loeb to the first prototype installation - Review.Desalination 2010, 261 (3), 205−211.(10) Yip, N. Y.; Tiraferri, A.; Phillip, W. A.; Schiffrnan, J. D.; Hoover,L. A.; Kim, Y. C.; Elimelech, M. Thin-Film Composite PressureRetarded Osmosis Membranes for Sustainable Power Generation fromSalinity Gradients. Environ. Sci. Technol. 2011, 45 (10), 4360−4369.(11) Yip, N. Y.; Elimelech, M. Performance Limiting Effects in PowerGeneration from Salinity Gradients by Pressure Retarded Osmosis.Environ. Sci. Technol. 2011, 45 (23), 10273−10282.(12) Chou, S.; Wang, R.; Shi, L.; She, Q.; Tang, C.; Fane, A. G. Thin-film composite hollow fiber membranes for pressure retarded osmosis(PRO) process with high power density. J. Membr. Sci. 2012, 389, 25−33.(13) Thorsen, T.; Holt, T. The potential for power production fromsalinity gradients by pressure retarded osmosis. J. Membr. Sci. 2009,335 (1−2), 103−110.(14) Nijmeijer, K.; Metz, S.; Isabel, C. E.; Andrea, I. S. f. Chapter 5.Salinity Gradient Energy. In Sustainability Science and Engineering;Elsevier; Vol. 2, pp 95−139.(15) Smith, J. M.; Van Ness, H. C.; Abbott, M. M. Introduction toChemical Engineering Thermodynamics, 7th ed.; McGraw-Hill: Boston,MA, 2005; p xviii, 817 pp.(16) Sandler, S. I. Chemical and Engineering Thermodynamics, 3rd ed.;Wiley: New York, 1999; p xx, 772 pp.(17) Mistry, K. H.; McGovern, R. K.; Thiel, G. P.; Summers, E. K.;Zubair, S. M.; Lienhard, J. H. Entropy Generation Analysis ofDesalination Technologies. Entropy 2011, 13 (10), 1829−1864.(18) Robinson, R. A. Stokes, R. H. Electrolyte Solutions, 2nd rev. ed.;Dover Publications: Mineola, NY, 2002; p xv, 571 pp.(19) King, C. J. Separation Processes, 2d ed.; McGraw-HillL NewYork, 1980; p xxvi, 850 pp.(20) Pitzer, K. S.; Peiper, J. C.; Busey, R. H. ThermodynamicProperties of Aqueous Sodium-Chloride Solutions. J. Phys. Chem. Ref.Data 1984, 13 (1), 1−102.(21) Semiat, R. Energy Issues in Desalination Processes. Environ. Sci.Technol. 2008, 42 (22), 8193−8201.(22) Elimelech, M.; Phillip, W. A. The Future of SeawaterDesalination: Energy, Technology, and the Environment. Science2011, 333 (6043), 712−717.(23) Morel, F. Hering, J. G. Principles and Applications of AquaticChemistry; Wiley: New York, 1993; p xv, 588 pp.(24) Kedem, O.; Katchalsky, A. Thermodynamic Analysis of thePermeability of Biological Membranes to Non-Electrolytes. Biochim.Biophys. Acta 1958, 27 (2), 229−246.(25) Spiegler, K. S.; Kedem, O. Thermodynamics of hyperfiltration(reverse-osmosis) - criteria for efficient membranes. Desalination 1966,1 (4), 311−326.(26) Liu, C.; Rainwater, K.; Song, L. F. Energy analysis and efficiencyassessment of reverse osmosis desalination process. Desalination 2011,276 (1−3), 352−358.
(27) Lee, K. L.; Baker, R. W.; Lonsdale, H. K. Membranes for Power-Generation by Pressure-Retarded Osmosis. J. Membr. Sci. 1981, 8 (2),141−171.(28) Mehta, G. D.; Loeb, S. Internal Polarization in the PorousSubstructure of a Semipermeable Membrane under Pressure-RetardedOsmosis. J. Membr. Sci. 1978, 4 (2), 261−265.(29) Baker, R. W. Membrane Technology and Applications, 2nd ed.; J.Wiley: Chichester; New York. 2004; p x, 538 pp.(30) Mi, B.; Elimelech, M. Chemical and physical aspects of organicfouling of forward osmosis membranes. J. Membr. Sci. 2008, 320 (1−2), 292−302.(31) National Research Council. Desalination: A National Perspective;The National Academies Press, 2008; p 312.(32) Fritzmann, C.; Lowenberg, J.; Wintgens, T.; Melin, T. State-of-the-art of reverse osmosis desalination. Desalination 2007, 216 (1−3),1−76.(33) Loeb, S. Production of Energy from Concentrated Brines byPressure-Retarded Osmosis: I. Preliminary Technical and EconomicCorrelations. J. Membr. Sci. 1976, 1 (1), 49−63.(34) Greenlee, L. F.; Lawler, D. F.; Freeman, B. D.; Marrot, B.;Moulin, P. Reverse osmosis desalination: Water sources, technology,and today’s challenges. Water Res. 2009, 43 (9), 2317−2348.(35) EIA. International Energy Data and Analysis. http://www.eia.doe.gov/international/.(36) Evans, A.; Strezov, V.; Evans, T. J. Assessment of sustainabilityindicators for renewable energy technologies. Renew. Sustain. EnergyRev. 2009, 13 (5), 1082−1088.


![Enhanced thermodynamic efficiency in time asymmetric ratchets · 2011-07-03 · With the emergence of a separate subfield called stochastic energetics [7,8], it has become possible](https://static.documents.pub/doc/80x56/5f8aa74ec7d1451cff532f07/enhanced-thermodynamic-eifciency-in-time-asymmetric-2011-07-03-with-the-emergence.jpg)


