21st Australasian Fluid Mechanics Conference Adelaide, Australia 10-13 December 2018 Three-dimensional measurements of particle clusters at the exit of a turbulent pipe jet T. C. W Lau 1 , J. H. Frank 2 and G. J. Nathan 1 1 Centre for Energy Technology, School of Mechanical Engineering The University of Adelaide, SA 5005, Australia 2 Combustion Research Facility Sandia National Laboratories, Livermore, CA 94550, United States Abstract An investigation into the phenomenon of particle clustering at the exit of a turbulent two-phase pipe flow was conducted util- ising detailed time-resolved tomographic-PIV measurements in conjunction with Voronoi analysis. The flow consisted of an air jet laden with solid, spherical particles, issuing from a long round pipe into a weak co-flow. The pipe diameter was D = 6.22mm, while the pipe length-to-diameter ratio was L/D=160. The jet Reynolds number, based on the pipe diameter, was fixed at Re D = 10, 000. Two different particle diameters were in- vestigated, namely d p = 0.3 and 10μm. The corresponding Stokes numbers, based on the large-eddy time-scale, was Sk D = 0.004 and 1.4, respectively. The particle bulk concentration was ≈190particles/mm 3 , which was sufficiently large to result in significant particle-fluid interaction (that is, the flow was in the two-way coupling regime). The results show that for the Sk D = 1.4 case, particle clustering is significant, with the clus- ters characterised by their filament or rope-like morphology and their coherence in time. Importantly, they are also detected right from the exit plane, which implies that these clusters were gen- erated inside the pipe. For the case Sk D = 0.004 particle clus- tering is negligible, and where detected, clusters tended to be small and incoherent in time, suggesting that they most likely arise out of random motion of individual particles. Introduction Particle-laden flows, typically consisting of solid or liquid par- ticles suspended in a fluid, are an important class of flow due to their wide relevance in many natural, scientific and indus- trial systems. In particular, particle-laden turbulent jets utilis- ing solid particles are commonly employed in industrial sys- tems such as in solid fuel combustion, minerals processing, and, more recently, concentrated solar thermal receivers. In these processes, the instantaneous distributions of particle concen- trations can significantly impact chemistry, temperature distri- butions, heat transfer, particle attrition, emissions and overall process efficiency [1, 14]. However, studies have shown that the phenomenon of particle clustering, whereby particles are instantaneously preferentially concentrated in highly localised regions of the flow, can occur in a wide array of particle-laden flows, including shear flows [5] and turbulent jets [8, 7, 9, 11]. This phenomenon results in highly non-uniform particle distri- butions within the flow, which in turn impacts the performance of systems employing particle-laden flows. Hence, there is a strong need to improve current understanding of particle clus- tering in particle-laden turbulent flows. Complete understanding of particle-laden turbulent flows re- quires fully-resolved measurements and/or calculations of the velocities of both the discrete (i.e. particle) and gas phases to- gether with particle positions simultaneously in four dimensions (4D, consisting of 3 spatial and 1 temporal). To the authors’ knowledge, no such experimental measurements exist for tur- bulent flows in the regime where particle-fluid interaction are significant (i.e., in the two-way or four-way coupling regime), partly due to the significant practical challenges of obtaining ac- curate measurements under these conditions. Furthermore, nu- merical simulations of these flows where both phases are com- puted directly remains computationally expensive, with almost all computational fluid dynamics (CFD) studies of particle- laden turbulent flows utilising simplifications or models. How- ever, the development of accurate two-phase CFD models is currently hindered by the paucity of detailed experimental mea- surements under well-characterised conditions that is suitable for model validation. This paper forms part of a larger research study that aims to ad- vance current understanding of particle-laden flows and particle clustering utilising detailed 4D experimental measurements at the exit of a turbulent particle-laden jet. In particular, this pa- per aims to demonstrate a method to measure particle clusters and subsequently describe the 3D particle cluster morphology at the turbulent jet exit in the two-way coupling regime. These aims will be met utilising tomographic particle image velocime- try (tomo-PIV) in conjunction with 3D image processing and Voronoi analysis. Experimental method The experiment consisted of tomographic-PIV measurements at the exit of a particle-laden turbulent pipe jet, as shown in figure 1. The pipe was a smooth stainless steel round pipe of diameter D = 6.22mm and length L = 1000mm. The resul- tant length to diameter ratio of L/D = 160 is sufficiently long to result in an approximately fully-developed two-phase pipe flow at the exit [6]. The pipe was mounted vertically such that the flow was opposed to gravity. The jet bulk velocity was fixed at U b = 12m/s, resulting in an exit Reynolds number of Re D = ρ a U b D/μ = 10, 000, where ρ a and μ is the density and dynamic viscosity of air, respectively. A fume hood placed ap- proximately 1m above the pipe exit induced a weak co-flow within the experimental test section, resulting in a jet-to-flow velocity ratio at the exit plane of 12:1. The pipe jet was laden with two types of spherical parti- cles, namely alumina particles with material density ρ p = 3950kg/m 3 and mean diameter d p ≈ 0.5μm, and PMMA par- ticles with material density ρ p = 1200kg/m 3 and mean diam- eter d p = 10μm. The latter particles are mono-disperse, with a standard deviation of particle diameter ≈ 1μm [6]. The re- sultant exit Stokes numbers for both particles, based on the large-eddy time-scale, were Sk D = ρ p d 2 p U b /(18μD)= 0.004 and 1.4, respectively. The bulk particle concentration was fixed at Θ b ≈ 190particles/mm 3 , resulting in a volume loading of β = 10 -4 and ≈ 10 -8 for the d p = 10μm and 0.5μm particles, respectively. Particles were introduced into the flow at the pipe inlet using a diametrically opposed tee-piece (as shown in figure 1). This inlet condition has previously been shown to assist in achieving symmetric particle distributions at the pipe exit [6].
Transcript
21st Australasian Fluid Mechanics ConferenceAdelaide, Australia10-13 December 2018
Three-dimensional measurements of particle clusters at the exit of a turbulent pipe jet
T. C. W Lau1, J. H. Frank2 and G. J. Nathan1
1Centre for Energy Technology, School of Mechanical EngineeringThe University of Adelaide, SA 5005, Australia
2Combustion Research FacilitySandia National Laboratories, Livermore, CA 94550, United States
Abstract
An investigation into the phenomenon of particle clustering atthe exit of a turbulent two-phase pipe flow was conducted util-ising detailed time-resolved tomographic-PIV measurements inconjunction with Voronoi analysis. The flow consisted of anair jet laden with solid, spherical particles, issuing from a longround pipe into a weak co-flow. The pipe diameter was D =6.22mm, while the pipe length-to-diameter ratio was L/D=160.The jet Reynolds number, based on the pipe diameter, was fixedat ReD = 10,000. Two different particle diameters were in-vestigated, namely dp = 0.3 and 10µm. The correspondingStokes numbers, based on the large-eddy time-scale, was SkD= 0.004 and 1.4, respectively. The particle bulk concentrationwas ≈190particles/mm3, which was sufficiently large to resultin significant particle-fluid interaction (that is, the flow was inthe two-way coupling regime). The results show that for theSkD = 1.4 case, particle clustering is significant, with the clus-ters characterised by their filament or rope-like morphology andtheir coherence in time. Importantly, they are also detected rightfrom the exit plane, which implies that these clusters were gen-erated inside the pipe. For the case SkD = 0.004 particle clus-tering is negligible, and where detected, clusters tended to besmall and incoherent in time, suggesting that they most likelyarise out of random motion of individual particles.
Introduction
Particle-laden flows, typically consisting of solid or liquid par-ticles suspended in a fluid, are an important class of flow dueto their wide relevance in many natural, scientific and indus-trial systems. In particular, particle-laden turbulent jets utilis-ing solid particles are commonly employed in industrial sys-tems such as in solid fuel combustion, minerals processing, and,more recently, concentrated solar thermal receivers. In theseprocesses, the instantaneous distributions of particle concen-trations can significantly impact chemistry, temperature distri-butions, heat transfer, particle attrition, emissions and overallprocess efficiency [1, 14]. However, studies have shown thatthe phenomenon of particle clustering, whereby particles areinstantaneously preferentially concentrated in highly localisedregions of the flow, can occur in a wide array of particle-ladenflows, including shear flows [5] and turbulent jets [8, 7, 9, 11].This phenomenon results in highly non-uniform particle distri-butions within the flow, which in turn impacts the performanceof systems employing particle-laden flows. Hence, there is astrong need to improve current understanding of particle clus-tering in particle-laden turbulent flows.
Complete understanding of particle-laden turbulent flows re-quires fully-resolved measurements and/or calculations of thevelocities of both the discrete (i.e. particle) and gas phases to-gether with particle positions simultaneously in four dimensions(4D, consisting of 3 spatial and 1 temporal). To the authors’knowledge, no such experimental measurements exist for tur-bulent flows in the regime where particle-fluid interaction are
significant (i.e., in the two-way or four-way coupling regime),partly due to the significant practical challenges of obtaining ac-curate measurements under these conditions. Furthermore, nu-merical simulations of these flows where both phases are com-puted directly remains computationally expensive, with almostall computational fluid dynamics (CFD) studies of particle-laden turbulent flows utilising simplifications or models. How-ever, the development of accurate two-phase CFD models iscurrently hindered by the paucity of detailed experimental mea-surements under well-characterised conditions that is suitablefor model validation.
This paper forms part of a larger research study that aims to ad-vance current understanding of particle-laden flows and particleclustering utilising detailed 4D experimental measurements atthe exit of a turbulent particle-laden jet. In particular, this pa-per aims to demonstrate a method to measure particle clustersand subsequently describe the 3D particle cluster morphologyat the turbulent jet exit in the two-way coupling regime. Theseaims will be met utilising tomographic particle image velocime-try (tomo-PIV) in conjunction with 3D image processing andVoronoi analysis.
Experimental method
The experiment consisted of tomographic-PIV measurementsat the exit of a particle-laden turbulent pipe jet, as shown infigure 1. The pipe was a smooth stainless steel round pipe ofdiameter D = 6.22mm and length L = 1000mm. The resul-tant length to diameter ratio of L/D = 160 is sufficiently longto result in an approximately fully-developed two-phase pipeflow at the exit [6]. The pipe was mounted vertically such thatthe flow was opposed to gravity. The jet bulk velocity wasfixed at Ub = 12m/s, resulting in an exit Reynolds number ofReD = ρaUbD/µ = 10,000, where ρa and µ is the density anddynamic viscosity of air, respectively. A fume hood placed ap-proximately 1m above the pipe exit induced a weak co-flowwithin the experimental test section, resulting in a jet-to-flowvelocity ratio at the exit plane of 12:1.
The pipe jet was laden with two types of spherical parti-cles, namely alumina particles with material density ρp =
3950kg/m3 and mean diameter dp ≈ 0.5µm, and PMMA par-ticles with material density ρp = 1200kg/m3 and mean diam-eter dp = 10µm. The latter particles are mono-disperse, witha standard deviation of particle diameter ≈ 1µm [6]. The re-sultant exit Stokes numbers for both particles, based on thelarge-eddy time-scale, were SkD = ρpd2
pUb/(18µD) = 0.004and 1.4, respectively. The bulk particle concentration was fixedat Θb ≈ 190particles/mm3, resulting in a volume loading ofβ = 10−4 and ≈ 10−8 for the dp = 10µm and 0.5µm particles,respectively. Particles were introduced into the flow at the pipeinlet using a diametrically opposed tee-piece (as shown in figure1). This inlet condition has previously been shown to assist inachieving symmetric particle distributions at the pipe exit [6].
Figure 1: Schematic of the experimental arrangement.
The measurement region was illuminated using a QuantronixHawk HP dual head laser, operating at a wavelength of 532nm.Each head was operated at a repetition rate of 40kHz, resultingin an overall illumination rate of 80kHz. The laser beam wasshaped into a 2.8mm thick light sheet within the imaging regionusing a series of cylindrical lenses and knife-edge slits. Imagesof the measurement region were simultaneously recorded us-ing 4 CMOS (Vision Research Phantom v1610) cameras. Theviewing angle of the cameras, i.e., the angle between the lensaxis and the plane normal to the laser sheet, was θ = 20◦,45◦, 135◦ and 160◦, respectively. Each camera utilised a Tam-ron 180mm f#3.5 1:1 macro lens mounted on a Scheimpflug(tilt-shift) mount. The cameras, which recorded images syn-chronously with the laser pulses, had an effective array size ofNarr = 512× 304pixels. Images were recorded continuouslyfor 1.345s (resulting in 107,636 images per camera) per ex-perimental run. Each image was corrected for background bysubtracting from each image the time-averaged signal recordedwithout the presence of particles. Calibration measurements fortomographic image registration were conducted before and af-ter each experimental run. This involved recording images of asemi-transparent grid of circular dots at 7 different planes offsetfrom the illumination plane.
Tomographic reconstruction and velocity field calculation
The multiplicative algebraic reconstruction technique (MART)with 5 iterations was used to reconstruct the three-dimensionalparticle intensity distributions from the images of the 4 cam-eras. The resultant reconstructed volume corresponded to theregion 0≤ x/D≤ 0.87 (329 pixels), −0.95≤ y/D≤ 0.95 (713pixels) and −0.23 ≤ z/D ≤ 0.23 (171 pixels), where x is theaxial (streamwise) co-ordinate, y is the co-ordinate parallel tothe beam path and z is the co-ordinate normal to the light sheet(depth). The origin is centred on the pipe axis at the exit plane.
The velocity field was computed from successive reconstructedvolumes using a multi-pass, multi-grid, fast-Fourier transformalgorithm. The final step utilised an interrogation window sizeof 16×16×16pixels and an overlap of 75%. Outliers were de-tected and replaced in a 2 step process. In the first step, outlierswere detected using the universal outlier detection method [15]with a 3× 3× 3 neighborhood, a threshold value of 2.0 pixelsand a normalisation level of 0.1 pixels. Furthermore, vectorswere also labeled as outliers if the ratio of the first and secondpeaks in the correlation plane, Q < 1.01. In both these cases,outliers were replaced with interpolated values. The secondstep, performed after all the reconstructions in the time-serieswere computed, involved calculating the mean and standard de-viation of velocity at each grid location, U and σU , respectively,and then specifying a vector as an outlier if the velocity was out-side the range U − 3σU ≤U ≤U + 3σU . These outliers were
not interpolated. Instead, the “robust” option of the smoothingmethod proposed by [4] was used to simultaneously smooth thedata and replace these outliers. A low smoothing parameter ofs = 10−3 was used to avoid over-smoothing the velocity data.
Cluster identification
To reduce tomographic reconstruction artifacts commonlyknown as “ghost particles”, a two-stage scheme was used. Inthe first stage, ghost particles were detected and removed us-ing the intensity thresholding technique, whereby particle im-ages with a mean intensity below a minimum threshold wereremoved from further analysis [2]. In the next stage, succes-sive recorded tomographic volume reconstructions were usedin conjunction with the measured velocity field to calculatetemporally-correlated volumes [13].
Particle positions were measured to sub-pixel accuracy fromthe temporally-correlated volumes by fitting 3D Gaussian func-tions to the particle intensity distributions. Clusters were identi-fied from the particle positions using the Voronoi method. Thismethod has previously been demonstrated for two-dimensionalmeasurements [12] but has been extended to three-dimensionalmeasurements in this study. This method firstly involved calcu-lating the vertex co-ordinates of the three-dimensional Voronoicell and its respective volume, ∀v, for each particle in the recon-structed volume. A Voronoi cell for a particle contains all pointsthat are located closer to that particles than to any other parti-cle. All cells with a normalised volume ∀̃v = ∀v/∀v, larger thana threshold ε̃v were discarded, where ∀v is the mean Voronoicell volume within the reconstructed image. In this calcula-tion, Voronoi cells with vertices that extend beyond the recon-struction volume were omitted. Clusters were then defined ascontiguous groups of three or more Voronoi cells that share anexternal surface. The threshold ε̃v was calculated by first con-sidering the expected normalised Voronoi volume distributionof a random Poisson process, ∀̃v,P. Since there is no known an-alytical solution for the probability density function of ∀̃v,P, acurve-fit was chosen using the 3-parameter gamma distributiondescribed by [3]
pd f (∀̃v) = cb(a/c)
Γ(a/c)∀̃(a−1)
v exp(−b∀̃c
v). (1)
Here, Γ is the gamma function, while the empirically-derivedconstants were chosen to be a = 4.7868, b = 4.0681 and c =1.1580 following [10]. To minimise the detection of particleclusters that were generated through random particle motion,the threshold was selected to exclude 97.5% of the largest (byvolume) Voronoi cells expected from a random Poisson process.Mathematically, this threshold is the solution to cd f (∀̃v) =0.025, where cd f = γ(a/c,b∀̃c
v)/Γ(a/c) is the cumulative distri-bution function and γ is the lower incomplete gamma function.The value of this threshold was numerically calculated to beε̃v = 0.338. In summary, this methodology identifies as clustersany group of 3 or more particles that are spaced more closelythan 97.5% of randomly distributed particles.
Results
Figure 2 presents false-color images of the particle clustersrecorded at three successive timesteps for both SkD = 0.004 andSkD = 1.4. The results show that for SkD = 0.004 case, parti-cle clustering is not significant, with nearly no clusters detectedin the flow. Importantly, where the clusters are detected, theyare small and not coherent in time, which suggests that theseregions are not “true” clusters, but are instead regions of tem-porarily high particle concentration that arise due to randommotion of the particles. By contrast, for the SkD = 1.4 case,
Figure 2: False-color images of particle clusters at the pipe exit for SkD = 0.004 and SkD = 1.4, respectively, recorded at 3 successivetime-steps. The clusters are colored from red to blue proportional to their depth (z co-ordinate).
particle clustering is significant, consistent with previous stud-ies [9]. Numerous particle clusters of varying size are detectedthroughout the flow, with the clusters appearing as filament-likeor rope-like structures that are coherent in time. Crucially, theclusters are detected right from the exit plane, implying thatthey are generated inside the pipe.
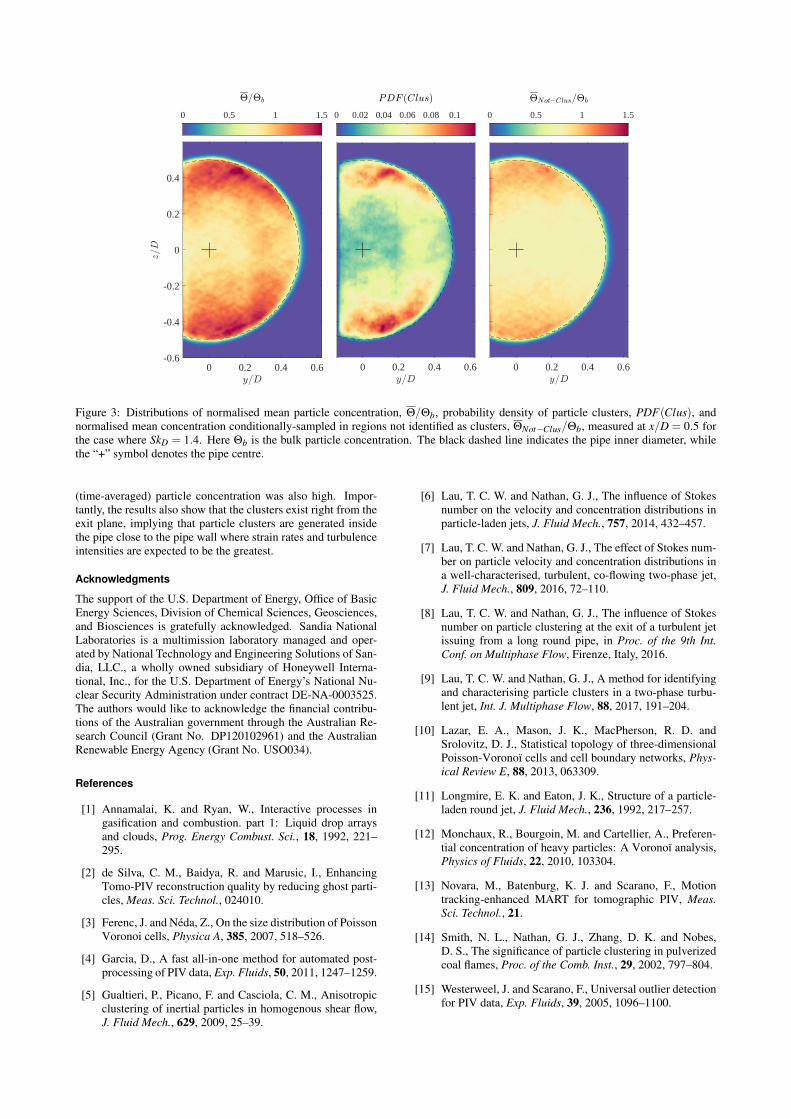
Figure 3 presents mean (time-averaged) particle concentrationΘ/Θb, particle cluster probability distribution, PDF(Clus), andthe mean particle concentration conditionally-sampled in re-gions not considered a cluster, ΘNot−Clus/Θb, measured atx/D = 0.5 for SkD = 1.4 case. The results show that the meanparticle concentration is greater close to the jet edge, consis-tent with previously published planar data [6] at identical Stokesnumbers. However, the peak concentration found in this study,Θ/Θb ≈ 1.4, is greater than the values of Θ/Θb ≈ 1.2 found in[6]. This is attributed to differences in ReD and dp between bothstudies. In the case where the data is conditionally-sampled inregions outside of clusters only, the particle mean concentra-tion approaches a more uniform distribution, with a peak con-centration of ΘNot−Clus/Θb ≈ 1.05. Furthermore, the meanparticle concentration distribution shows some signs of radialasymmetry, with greater values of Θ/Θb measured at y/D = 0,z/D = ±0.5 than at y/D = 0.5, z/D = 0. This is possibly dueto the effect of the inlets, which were located within the planey/D = 0, suggesting that the 160 pipe diameters of flow devel-
opment length used in this study was not sufficient to result in atruly fully-developed particle-laden flow at the pipe exit.
Interestingly, the results also show that PDF(Clus) is greaterclose to the jet edge, i.e., an increase in mean particle con-centration is correlated with an increased probability of clus-ter detection. While this correlation is perhaps not surprising,it is unclear whether particle clustering causes an increase inmean concentration, a greater mean concentration leads to anincreased likelihood of particle clusters, or if both phenomenonare coupled. Incidentally, the region close to the jet edge/pipeboundary is the region with the greatest strain rates and turbu-lence intensities [7]. These results, taken together with the find-ing that the clusters are likely generated inside the pipe, suggesta link between cluster generation, mean preferential concentra-tion of particles and the flow close the pipe boundary. However,much more work is required to confirm the details of this link.
Conclusions
Detailed 4D measurements of a particle-laden turbulent jet hasrevealed that for the case where the Stokes number, based onthe large-eddy time-scale, is SkD = 1.4, particle clustering issignificant, with the measured particles appearing as filament-or rope-like structures that remain coherent in time within themeasurement volume. These clusters were found to be pref-erentially concentrated close to the jet edge, where the mean
0 0.2 0.4 0.6-0.6
-0.4
-0.2
0
0.2
0.4
0 0.5 1 1.5
0 0.2 0.4 0.6
0 0.02 0.04 0.06 0.08 0.1
0 0.2 0.4 0.6
0 0.5 1 1.5
Figure 3: Distributions of normalised mean particle concentration, Θ/Θb, probability density of particle clusters, PDF(Clus), andnormalised mean concentration conditionally-sampled in regions not identified as clusters, ΘNot−Clus/Θb, measured at x/D = 0.5 forthe case where SkD = 1.4. Here Θb is the bulk particle concentration. The black dashed line indicates the pipe inner diameter, whilethe “+” symbol denotes the pipe centre.
(time-averaged) particle concentration was also high. Impor-tantly, the results also show that the clusters exist right from theexit plane, implying that particle clusters are generated insidethe pipe close to the pipe wall where strain rates and turbulenceintensities are expected to be the greatest.
Acknowledgments
The support of the U.S. Department of Energy, Office of BasicEnergy Sciences, Division of Chemical Sciences, Geosciences,and Biosciences is gratefully acknowledged. Sandia NationalLaboratories is a multimission laboratory managed and oper-ated by National Technology and Engineering Solutions of San-dia, LLC., a wholly owned subsidiary of Honeywell Interna-tional, Inc., for the U.S. Department of Energy’s National Nu-clear Security Administration under contract DE-NA-0003525.The authors would like to acknowledge the financial contribu-tions of the Australian government through the Australian Re-search Council (Grant No. DP120102961) and the AustralianRenewable Energy Agency (Grant No. USO034).
References
[1] Annamalai, K. and Ryan, W., Interactive processes ingasification and combustion. part 1: Liquid drop arraysand clouds, Prog. Energy Combust. Sci., 18, 1992, 221–295.
[2] de Silva, C. M., Baidya, R. and Marusic, I., EnhancingTomo-PIV reconstruction quality by reducing ghost parti-cles, Meas. Sci. Technol., 024010.
[3] Ferenc, J. and Néda, Z., On the size distribution of PoissonVoronoi cells, Physica A, 385, 2007, 518–526.
[4] Garcia, D., A fast all-in-one method for automated post-processing of PIV data, Exp. Fluids, 50, 2011, 1247–1259.
[5] Gualtieri, P., Picano, F. and Casciola, C. M., Anisotropicclustering of inertial particles in homogenous shear flow,J. Fluid Mech., 629, 2009, 25–39.
[6] Lau, T. C. W. and Nathan, G. J., The influence of Stokesnumber on the velocity and concentration distributions inparticle-laden jets, J. Fluid Mech., 757, 2014, 432–457.
[7] Lau, T. C. W. and Nathan, G. J., The effect of Stokes num-ber on particle velocity and concentration distributions ina well-characterised, turbulent, co-flowing two-phase jet,J. Fluid Mech., 809, 2016, 72–110.
[8] Lau, T. C. W. and Nathan, G. J., The influence of Stokesnumber on particle clustering at the exit of a turbulent jetissuing from a long round pipe, in Proc. of the 9th Int.Conf. on Multiphase Flow, Firenze, Italy, 2016.
[9] Lau, T. C. W. and Nathan, G. J., A method for identifyingand characterising particle clusters in a two-phase turbu-lent jet, Int. J. Multiphase Flow, 88, 2017, 191–204.
[10] Lazar, E. A., Mason, J. K., MacPherson, R. D. andSrolovitz, D. J., Statistical topology of three-dimensionalPoisson-Voronoï cells and cell boundary networks, Phys-ical Review E, 88, 2013, 063309.
[11] Longmire, E. K. and Eaton, J. K., Structure of a particle-laden round jet, J. Fluid Mech., 236, 1992, 217–257.
[12] Monchaux, R., Bourgoin, M. and Cartellier, A., Preferen-tial concentration of heavy particles: A Voronoï analysis,Physics of Fluids, 22, 2010, 103304.
[13] Novara, M., Batenburg, K. J. and Scarano, F., Motiontracking-enhanced MART for tomographic PIV, Meas.Sci. Technol., 21.
[14] Smith, N. L., Nathan, G. J., Zhang, D. K. and Nobes,D. S., The significance of particle clustering in pulverizedcoal flames, Proc. of the Comb. Inst., 29, 2002, 797–804.
[15] Westerweel, J. and Scarano, F., Universal outlier detectionfor PIV data, Exp. Fluids, 39, 2005, 1096–1100.