Thin Solid Films 414 (2002) 78–90 0040-6090/02/$ - see front matter 2002 Elsevier Science B.V. All rights reserved. PII: S0040-6090 Ž 02 . 00329-2 Three-dimensional wafer-scale copper chemical–mechanical planarization model Dipto G. Thakurta , Donald W. Schwendeman , Ronald J. Gutmann , Sadasivan Shankar , a,b,1 c b,d e Lei Jiang , William N. Gill * e a,b, Department of Chemical Engineering, Rensselaer Polytechnic Institute, Troy, NY 12180, USA a Center for Integrated Electronics and Electronic Manufacturing, Rensselaer Polytechnic Institute, Troy, NY 12180, USA b Department of Mathematical Sciences, Rensselaer Polytechnic Institute, Troy, NY 12180, USA c Department of Electrical, Computer and Systems Engineering, Rensselaer Polytechnic Institute, Troy, NY 12180, USA d Integrated Process Application Group, Technology CAD Department, Intel Corporation, Hillsboro, OR 97124, USA e Received 15 March 2002; received in revised form 10 April 2002; accepted 10 April 2002 Abstract Models based on slurry hydrodynamics, mass transport, and reaction kinetics are developed in order to predict the removal rate of copper on a wafer-scale during chemical–mechanical planarization (CMP). The steps in the copper removal model include: mass transport of the oxidizer to the wafer surface; reaction of oxidizer with copper to form a reacted layer; and subsequent removal of the reacted layer by mechanical abrasion. The rates of the chemical reaction and mechanical abrasion steps are described by separate kinetic parameters. For low oxidizer concentrations the chemical step controls the process, while for high concentrations the mechanical step controls. The model shows that mass transport of the oxidizer to the surface controls the removal process at higher removal rates and can cause wafer-scale non-uniformity. Copper CMP experiments with potassium dichromate based slurry are compatible with the proposed surface kinetics steps and showed that the surface kinetics controlled the removal process for this slurry. 2002 Elsevier Science B.V. All rights reserved. Keywords: Chemical–mechanical planarization; Copper; Wafer-scale; Lubrication theory; Surface chemistry 1. Introduction Chemical mechanical planarization (CMP) has the capability to achieve adequate local and global planari- zation necessitated by increasingly stringent on-chip interconnects requirements in integrated circuit (IC) device manufacturing w1–3x. CMP has been widely used for planarization of interlevel dielectric (ILD), shallow trench isolation (STI), and the Damascene metallization process w1,2,4–6x. In spite of extensive use of the CMP process, many aspects of CMP are not well understood. Hence, physics-based modeling is useful in providing fundamental insight, optimization of the process, and performing sensitivity analyses of operating parameters *Corresponding author. Fax: q1-518-276-4030. E-mail address: [email protected](W.N. Gill). Present address: Integrated Process Application Group, Technol- 1 ogy CAD Department, Intel Corporation, Hillsboro, OR 97124, USA. w7x. Several CMP models have been published in the literature, with Nanz and Camilletti w8x and Subramanian et al. w9x presenting comprehensive summaries. In this paper, we develop a copper CMP model based on mass- transport theory and wafer surface kinetic steps, which predicts the removal rate on a wafer-scale. The concen- tration of the chemical reactant in the slurry is computed using a convective diffusive mass transport equation. The surface kinetic steps model the chemical reaction and mechanical abrasion processes at the wafer surface. A conventional CMP process is depicted in Fig. 1. The slurry containing chemical reagents and abrasive particles is drawn beneath the wafer by the rotating pad. The slurry forms a lubricating film between the wafer and pad w10x. The film thickness, h, ranges between 20 and 60 mm depending upon operating conditions w11x. Fig. 1b shows a side profile of the pad surface which has asperities of randomly varying heights w12x. The
Transcript
Thin Solid Films 414(2002) 78–90
0040-6090/02/$ - see front matter� 2002 Elsevier Science B.V. All rights reserved.PII: S0040-6090Ž02.00329-2
Dipto G. Thakurta , Donald W. Schwendeman , Ronald J. Gutmann , Sadasivan Shankar ,a,b,1 c b,d e
Lei Jiang , William N. Gill *e a,b,
Department of Chemical Engineering, Rensselaer Polytechnic Institute, Troy, NY 12180, USAa
Center for Integrated Electronics and Electronic Manufacturing, Rensselaer Polytechnic Institute, Troy, NY 12180, USAb
Department of Mathematical Sciences, Rensselaer Polytechnic Institute, Troy, NY 12180, USAc
Department of Electrical, Computer and Systems Engineering, Rensselaer Polytechnic Institute, Troy, NY 12180, USAd
Integrated Process Application Group, Technology CAD Department, Intel Corporation, Hillsboro, OR 97124, USAe
Received 15 March 2002; received in revised form 10 April 2002; accepted 10 April 2002
Abstract
Models based on slurry hydrodynamics, mass transport, and reaction kinetics are developed in order to predict the removal rateof copper on a wafer-scale during chemical–mechanical planarization(CMP). The steps in the copper removal model include:mass transport of the oxidizer to the wafer surface; reaction of oxidizer with copper to form a reacted layer; and subsequentremoval of the reacted layer by mechanical abrasion. The rates of the chemical reaction and mechanical abrasion steps aredescribed by separate kinetic parameters. For low oxidizer concentrations the chemical step controls the process, while for highconcentrations the mechanical step controls. The model shows that mass transport of the oxidizer to the surface controls theremoval process at higher removal rates and can cause wafer-scale non-uniformity. Copper CMP experiments with potassiumdichromate based slurry are compatible with the proposed surface kinetics steps and showed that the surface kinetics controlledthe removal process for this slurry.� 2002 Elsevier Science B.V. All rights reserved.
Chemical mechanical planarization(CMP) has thecapability to achieve adequate local and global planari-zation necessitated by increasingly stringent on-chipinterconnects requirements in integrated circuit(IC)device manufacturingw1–3x. CMP has been widely usedfor planarization of interlevel dielectric(ILD), shallowtrench isolation(STI), and the Damascene metallizationprocessw1,2,4–6x. In spite of extensive use of the CMPprocess, many aspects of CMP are not well understood.Hence, physics-based modeling is useful in providingfundamental insight, optimization of the process, andperforming sensitivity analyses of operating parameters
ogy CAD Department, Intel Corporation, Hillsboro, OR 97124, USA.
w7x. Several CMP models have been published in theliterature, with Nanz and Camillettiw8x and Subramanianet al. w9x presenting comprehensive summaries. In thispaper, we develop a copper CMP model based on mass-transport theory and wafer surface kinetic steps, whichpredicts the removal rate on a wafer-scale. The concen-tration of the chemical reactant in the slurry is computedusing a convective diffusive mass transport equation.The surface kinetic steps model the chemical reactionand mechanical abrasion processes at the wafer surface.A conventional CMP process is depicted in Fig. 1.
The slurry containing chemical reagents and abrasiveparticles is drawn beneath the wafer by the rotating pad.The slurry forms a lubricating film between the waferand padw10x. The film thickness,h, ranges between 20and 60mm depending upon operating conditionsw11x.Fig. 1b shows a side profile of the pad surface whichhas asperities of randomly varying heightsw12x. The
79D.G. Thakurta et al. / Thin Solid Films 414 (2002) 78–90
Fig. 1. Schematic top and side view of wafer and pad.
surface roughness of the pad, defined as the standarddeviation of the height of the asperities, ranges from 10to 30 mm depending on the pad propertiesw13,14x.Whenh is of the same order as the mean height of theasperities, a significant fraction of the asperities are incontact with the wafer surface, while a thicker slurryfilm gives lesser contact. The applied load on the waferis carried by the hydrodynamic pressure developed inthe slurry film and by the asperities in contact.For purposes of slurry flow modeling, the slurry is
considered to flow between the finger-like protrusions(asperities) on the pad surface. The resistance to theslurry flow from these asperities has been modeled byJiang and Shankarw15x. They obtain the slurry pressureand velocity distributions for flow with pad-asperityywafer contact by using a statistical-averaging approachanalogous to Patir and Cheng’sw16x model for roughbearing lubrication. Here, we will use the 3-D wafer-scale slurry flow model developed by Thakurta et al.w17x, which treats the pad as a smooth surface. In ourapproach, the effect of contact of the asperities with thewafer is brought into our mass-transport model througha boundary condition describing the surface kinetics atthe wafer surface. The flux of the reactant at the wafersurface is computed from its concentration distribution,which is related to the local removal rate through amodified Langmuir–Hinshelwood model developed forcopper CMP. The model includes a chemical reaction atthe wafer surface with formation of a reacted layer,followed by its removal by mechanical abrasion. Thechemical reaction and the mechanical abrasion are mod-eled by separate kinetic parameters. Copper CMP exper-iments are performed to evaluate the model.Sundararajan et al.w18x analyzed the mass transport
in copper CMP using an alkaline slurry. A 2-D lubrica-tion model was used to analyze the mass-transport inthe slurry film and was coupled to a chemical reactionat the wafer surface. The model agreed reasonably wellwith experiments predicting the effects of slurry chem-istry, relative speed between the wafer and pad, andapplied pressure on the wafer. The primary improvementof our present work is that the mass transport and flow
models are extended to 3-D, which enables one topredict the wafer-scale local material removal rate. Inaddition, a more complete surface reaction kineticsscheme, including both chemical and mechanical effects,is presented for an acidic slurry, which is a morecommonly used slurry for copper.Subramanian et al.w9x have investigated transport
phenomena issues in CMP from a somewhat differentviewpoint. The pores of the pad are modeled as rectan-gular cells, which carry the slurry underneath the wafer.A mass-transport equation is used to describe the reac-tant concentration distribution in the cell, and the fluxat the wafer surface is used to obtain the materialremoval rate. According to their model, the removal rateincreases with pad speed, saturating at larger speeds,which agrees with trends observed experimentally. Thetransport model presented in our work differs from thatin Subramanian et al.w9x in that we consider the padfibers as protrusions from the pad surface and hence, donot restrict the slurry flow within a cell. Also, weinclude an additional kinetic rate parameter, whichaccounts for mechanical abrasion at the wafer surface.In the work presented here we begin by briefly
summarizing the flow model of Thakurta et al.w17x inSection 2. The flow results are needed as input to themass-transport model developed in Sections 3.1 and 3.2.These two sections describe the model for the mass-transport in the gap between the wafer and the pad andthe boundary condition given by our surface kineticsmodel, respectively. The model, as discussed in Section3.3, determines the flux of copper at the wafer surfaceand this flux may be integrated to obtain the removalrate of copper. An effectiveness factor is defined inSection 3.3, which measures the mass-transport resis-tance to the overall removal process. The kinetic rateparameters used in the model are discussed in Section3.4, followed by a discussion of the numerical solutionprocedure in Section 3.5. Results of the model for arepresentative flow configuration is presented in Section4. The experiments used to test the model and determinethe kinetic parameters are described in Section 5 andconclusions relating the model and experiments aregiven in Section 6.
2. Flow model
The purpose of the flow model is to compute theslurry film thickness and the velocity distribution of theslurry in the gap between the wafer and pad. Thesecomputed quantities are required by the mass-transportmodel to be discussed in the next section. As waspointed out earlier, the mass-transport model can beused with any available 3-D wafer-scale slurry flowmodel. For the purposes of this paper, we will use the3-D wafer-scale slurry flow model developed by Thak-urta et al.w17x, which is briefly summarized here.
80 D.G. Thakurta et al. / Thin Solid Films 414 (2002) 78–90
Fig. 2. (a) Schematic top view of CMP tool showing pad and wafer positions.(b) Schematic side view of 3-D model. Boundary conditions(forthe mass-transport model) at inlet, pad and wafer surfaces are shown within boxes.
Fig. 2 shows the geometry of the wafer-pad system.The wafer radius isR and the distance between the1
centers of the wafer and pad isR . The wafer and pad2
rotate about their respective centers with angular speedsv andv , respectively. The co-ordinate system is fixed1 2
in space with the origin at the pad surface directlybelow the center of the wafer. The wafer height is givenby zsh(x, y) measured relative to the pad surface(thex–y plane) and includes a global convex curvature andangles of attack. The curvature is represented in termsof the protrusion at the center of the wafer, also knownas the wafer dome heightw10x. The wafer dome heightis denoted byd and is of the order of 10mm for a0
200-mm diameter wafer.(The curvature shown in Fig.2b is exaggerated for the purpose of illustration.) Thewafer surface is taken to be
2 2w z w z w zx y x qyx | x | x |Ž .h x,y sh qS qS qd (1)0 x y 0 2y ~ y ~ y ~R R R1 1 1
whereh is the wafer height at the origin, andS and0 x
S are slopes associated with the angles of attack in they
x- and y-directions, respectively. The parametersh , S0 x
and S in the expression forh are adjusted to balancey
the applied pressure and to satisfy zero moments on thewafer about the centerw10,17x.The flow model in w17x considers the lubrication
approximation of the Navier–Stokes equations, whichis solved numerically to obtain the slurry pressure in thegap and the adjustable parameters in the expression forh. Once the pressure is found, the velocity distributioncan be computed. Under typical CMP conditions, thecomputed slurry film thickness ranges from 20 to 60mm, and the slurry flow speeds range from 0.3 to 1.4m s . Fig. 3 shows velocity-arrow plots of the com-y1
puted slurry velocity field between the wafer and pad atthree different normalized heightszs0, 0.75 and 0.5,wherezszyh, for a sample case withP s25 kPa andapp
v sv s60 r.p.m. The length of the arrow represents1 2
the magnitude of slurry velocity. For reference, the
arrows at the wafer edge in Fig. 3a denote a velocity ofmagnitude 0.63 m s . Mass-transport calculations fory1
the same sample case will be presented in Section 4.1.For the work presented here, pad bending and porosity
effects are considered to be secondary and are neglected.Also, no contact of wafer and pad is assumed whilesolving for the slurry flow field. It is noted that contactand flow models may be coupled as demonstrated inRefs.w15,19x. Here, the effect of pad contact is includedonly through kinetic rate parameters, which describe therate of mechanical abrasion.
3. Copper removal model
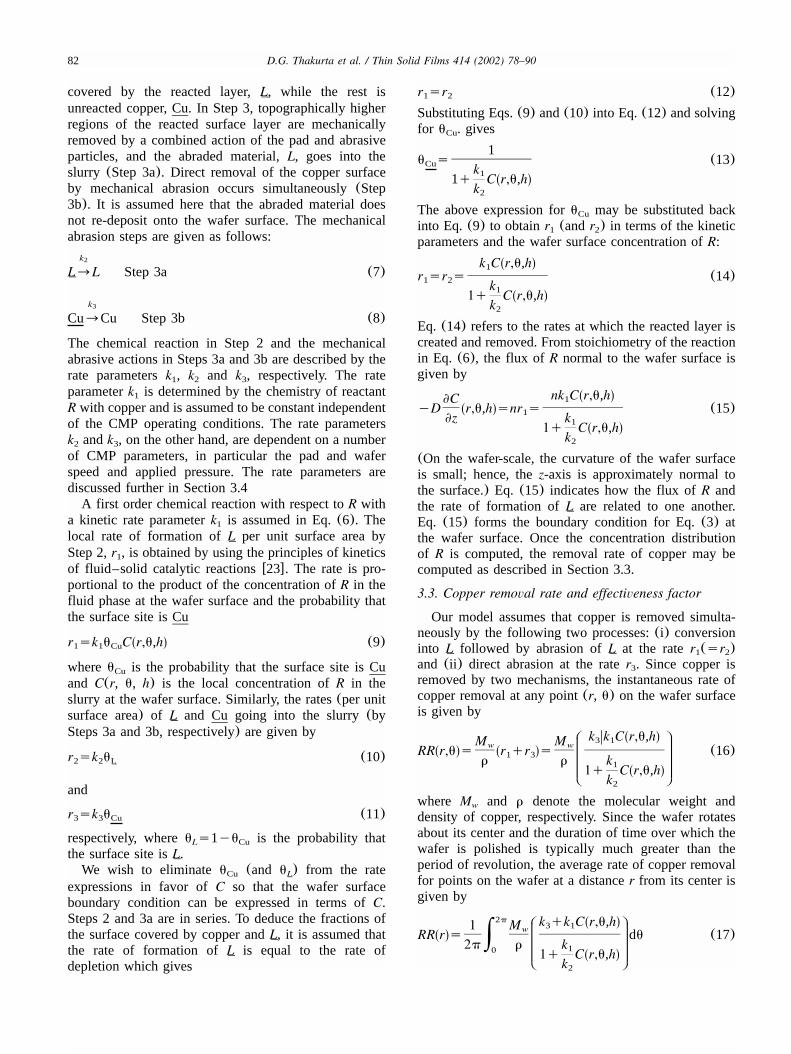
A copper CMP slurry primarily consists of an oxidizerand abrasive particles. Several oxidizers, such as hydro-gen peroxidew20x, ferric nitratew9x, potassium ferricy-anide, nitric acidw6x, and potassium dichromatew21x,have been used. Typically, sub-micrometer alumina par-ticles are used as abrasives. A copper removal model ispresented which has three steps:(1) mass transport ofoxidizer to the wafer surface;(2) chemical reaction ofthe oxidizer with copper to form a reacted layer at thewafer surface; and(3) removal of both(a) the reactedlayer and (b) copper by mechanical abrasion. Thesesteps are depicted in Fig. 4 and are discussed in Sections3.1 and 3.2 below.
3.1. Mass transport of oxidizer to the wafer surface
The thin slurry-film region between the wafer andpad may be visualized as a chemical reactor in whichthe reaction is occurring at the wafer surface. The freshslurry consisting of an oxidizer,R, enters this region asshown in Fig. 1a. The copper at the wafer surface, Cu,reacts withn moles of R forming a reacted layer,L,which then is removed from the surface by mechanicalabrasion, thus effecting material removal. The overallreaction of copper with the oxidizer may be written as
81D.G. Thakurta et al. / Thin Solid Films 414 (2002) 78–90
Fig. 4. Steps in the removal model for copper.
Fig. 3. Computed slurry velocity vectors at differentzszyh surfaces between the wafer(at zs1) and pad(at zs0). Flow simulation parameters:P s25 kPa,v sv s60 r.p.m.,R s100 mm,R s178 mm,d s10 mm andms0.001 Pa s.app 1 2 1 2 0
follows:
CuqnR™L (2)
where the symbols with under-bars denote species pres-ent on the wafer surface. The slurry leaves the regiondepleted inR and enriched inL. The rate of materialremoval depends upon the availability ofR in the fluidphase at the wafer surface. Both convection and diffu-sion transportR to the wafer surface. Mass transport ofR to the surface is step 1 in the overall material removalprocess(see Fig. 4). A mass-transport model is used tosolve for the concentration distribution ofR under thewafer region, which is used to compute the rate ofconsumption ofR at the wafer surface and subsequently,the local copper removal rate.Assuming a dilute system with constant liquid density
and diffusivity, we can write the following governingequation, from Bird et al.w22x, for the concentration,C(r, u, z), of oxidizerR:
2≠C 1 ≠C ≠C ≠ Cv qv qv sD (3)r u z 2≠r r ≠u ≠z ≠z
whereD is the diffusivity of R in the slurry andv , v ,r u
v are functions of(r, u, z) given by the slurry flowz
model. In Eq.(3), the contribution to diffusion inr-andu-directions is neglected becauseh<R . The equa-1
tion for C is solved in the region between the wafer andpad given byrgw0, R x, ugw0, 2px, andzgw0, hx, with1
appropriate boundary conditions at the inlet, pad andwafer surfaces. The inlet is defined as the regions atrsR where the slurry, assumed ‘fresh’ inR, enters the1
space between the wafer and pad. Thus, the inletboundary condition forC is given by
C(R ,u,z)sC whenv (R ,u,z)-0 (4)1 0 r 1
whereC is the molar concentration ofR in fresh or as0
prepared slurry(assumed to be known), and the velocitycriterion in Eq.(4) identifies the inlet regions. The padis considered to be inert and impermeable, so thediffusive flux is set to zero at the pad surface
≠CŽ .yD r,u,0s0 (5)
≠z
The boundary condition at the wafer surfacezsh(r, u)is based on the subsequent surface kinetic steps asdescribed in the next section.
3.2. Surface kinetic steps
The mass transport ofR (step 1) is followed by steps2 and 3 both occurring at the wafer surface. In step 2,the copper film, Cu, reacts withn moles ofR (in thefluid phase) to form a reacted layer,L, on the wafer
¯surface:k1
CuqnR™L Step 2 (6)¯
assuming that the adsorption ofR on the copper surfaceis sufficiently fast and that the backward reaction rateof Eq. (6) is negligible. The reacted surface layer,L, is
¯an oxidized copper compound depending uponR.According to our model, part of the wafer surface is
82 D.G. Thakurta et al. / Thin Solid Films 414 (2002) 78–90
covered by the reacted layer,L, while the rest is¯unreacted copper, Cu. In Step 3, topographically higher
regions of the reacted surface layer are mechanicallyremoved by a combined action of the pad and abrasiveparticles, and the abraded material,L, goes into theslurry (Step 3a). Direct removal of the copper surfaceby mechanical abrasion occurs simultaneously(Step3b). It is assumed here that the abraded material doesnot re-deposit onto the wafer surface. The mechanicalabrasion steps are given as follows:
k2
L™L Step 3a (7)¯
k3
Cu™Cu Step 3b (8)
The chemical reaction in Step 2 and the mechanicalabrasive actions in Steps 3a and 3b are described by therate parametersk , k and k , respectively. The rate1 2 3
parameterk is determined by the chemistry of reactant1
R with copper and is assumed to be constant independentof the CMP operating conditions. The rate parametersk andk , on the other hand, are dependent on a number2 3
of CMP parameters, in particular the pad and waferspeed and applied pressure. The rate parameters arediscussed further in Section 3.4A first order chemical reaction with respect toR with
a kinetic rate parameterk is assumed in Eq.(6). The1
local rate of formation ofL per unit surface area by¯Step 2,r , is obtained by using the principles of kinetics1
of fluid–solid catalytic reactionsw23x. The rate is pro-portional to the product of the concentration ofR in thefluid phase at the wafer surface and the probability thatthe surface site is Cu
Ž .r sk u C r,u,h (9)1 1 Cu
whereu is the probability that the surface site is CuCu
and C(r, u, h) is the local concentration ofR in theslurry at the wafer surface. Similarly, the rates(per unitsurface area) of L and Cu going into the slurry(by
¯Steps 3a and 3b, respectively) are given by
r sk u (10)2 2 L¯
and
r sk u (11)3 3 Cu
respectively, whereu s1yu is the probability thatL Cu
the surface site isL.¯We wish to eliminateu (and u ) from the rateCu L
¯expressions in favor ofC so that the wafer surfaceboundary condition can be expressed in terms ofC.Steps 2 and 3a are in series. To deduce the fractions ofthe surface covered by copper andL, it is assumed that
¯the rate of formation ofL is equal to the rate of¯depletion which gives
r sr (12)1 2
Substituting Eqs.(9) and(10) into Eq.(12) and solvingfor u . givesCu
1u s (13)Cu k1 Ž .1q C r,u,h
k2The above expression foru may be substituted backCu
into Eq. (9) to obtainr (andr ) in terms of the kinetic1 2
parameters and the wafer surface concentration ofR:
Ž .k C r,u,h1r sr s (14)1 2 k1 Ž .1q C r,u,h
k2Eq. (14) refers to the rates at which the reacted layer iscreated and removed. From stoichiometry of the reactionin Eq. (6), the flux of R normal to the wafer surface isgiven by
Ž .nk C r,u,h1≠CŽ .yD r,u,h snr s (15)1
≠z k1 Ž .1q C r,u,hk2
(On the wafer-scale, the curvature of the wafer surfaceis small; hence, thez-axis is approximately normal tothe surface.) Eq. (15) indicates how the flux ofR andthe rate of formation ofL are related to one another.
¯Eq. (15) forms the boundary condition for Eq.(3) atthe wafer surface. Once the concentration distributionof R is computed, the removal rate of copper may becomputed as described in Section 3.3.
3.3. Copper removal rate and effectiveness factor
Our model assumes that copper is removed simulta-neously by the following two processes:(i) conversioninto L followed by abrasion ofL at the rater (sr )1 2
¯ ¯and (ii) direct abrasion at the rater . Since copper is3
removed by two mechanisms, the instantaneous rate ofcopper removal at any point(r, u) on the wafer surfaceis given by
B EZ Ž .k k C r,u,h3 1M Mw wŽ . Ž .RR r,u s r qr s (16)1 3r r k1C FŽ .1q C r,u,h
kD G2
where M and r denote the molecular weight andw
density of copper, respectively. Since the wafer rotatesabout its center and the duration of time over which thewafer is polished is typically much greater than theperiod of revolution, the average rate of copper removalfor points on the wafer at a distancer from its center isgiven by
B E2p Ž .k qk C r,u,h3 11 MwŽ .RR r s du (17)|2p r k1C F0 Ž .1q C r,u,hkD G2
83D.G. Thakurta et al. / Thin Solid Films 414 (2002) 78–90
We will refer to RR(r) as the local removal rate. It isalso useful to define
R12Ž .RR s RR r rdr (18)avg |2R1 0
which is the average removal rate for the entire wafersurface.An effectiveness factor,h, is defined by
RRavghs (19)
RRavg,0
whereRR is given by Eqs.(17) and(18) with C(r,avg,0
u, h) replaced byC and withk andk replaced by the0 2 3
reference valuesk andk , respectively, so that20 30
B EM k qk Cw 30 1 0RR s (20)avg,0r k1C F1q C0kD G20
The average removal rate would take the value ofRR if the entire wafer surface were exposed to theavg,0
inlet concentration. This would be the case if masstransport occurred very fast relative to the time scalefor the surface kinetics so that the surface concentrationwould beC to a good approximation. The effectiveness0
factor, h, is thus a measure of the mass-transportresistance to the overall removal process. That is,h isvery close to unity if the mass transfer rate ofR to thesurface is fast enough to feed the chemical reaction andmaintain the concentration at the slurry–surface inter-face near the inlet concentration,C .0
3.4. Kinetic rate parameters
In Section 3.2, the removal mechanism of copper wasmodeled using three surface kinetic parametersk , k1 2
and k . The parameterk , which describes the rate of3 1
the chemical reaction at the wafer surfacewEq. (6)x, isprimarily a function of the oxidizerR present in theslurry. The local temperature, pressure and concentrationof R are also known to effect the rate of chemicalreaction. In CMP, the abrasive particles also can enhancethe rate of reaction by weakening the surface bonds bymicrocutting or brittle fracture. Here, we assume thatk depends only on the oxidizer used and it is independ-1
ent of position on the wafer surface.The rate parametersk and k describe the rates of2 3
mechanical abrasion ofL and Cu, respectively. The¯contact pressure, pad, abrasive size and concentration
have strong effect onk and k . The value ofk also2 3 2
depends strongly on the type of reacted layer,L, formed¯by the oxidizer. In the case of oxidizers such as
potassium dichromate(K Cr O ), the reacted layer pas-2 2 7
sivates the surfacew21x and prevents further corrosionof the underlying copper. Other oxidizers, such as nitricacid (HNO ) w6x and ferric nitratewFe(NO ) x w24x, do3 3 3
not form an effective passivating film. The propertiesof the reacted layer may depend critically upon theconcentration of the oxidizer in the slurry as in the caseof hydrogen peroxide(H O ) w24x. Lower concentra-2 2
tions of H O give a porous reacted layer while higher2 2
concentrations produce a passivating layer. A reactedlayer, which is passivating is more difficult to abradethan the case when it is not passivating or porous innature. It is noted thatk is the rate at which copper is3
abraded and it is not a function of the slurry oxidizer.The values of the abrasion rate parametersk and k2 3
vary locally as a function of the local contact pressureat the wafer surface. To illustrate the effect of variationof the contact pressure on the local removal rate, weassume thatk and k are directly proportional to the2 3
local contact pressure between the wafer and pad insome of our simulation runs. The mechanical rateparametersk and k are assumed to be proportional to2 3
a shape functionf(r), which describes the shape of thecontact pressure distribution,
k (r)sk f(r), k (r)sk f(r) (21)2 20 3 30
The shape function captures the positional dependencyof k and k across the wafer, while the proportionality2 3
parametersk andk determine the scale, and they are20 30
functions of applied pressure, waferypad speed, abra-sives, back pressure, wafer-backing film and the type ofpad.Several articles have been published which present
models to compute the contact pressure distributionw19,25–29x. Baker’s 2-D contact modelw26x, for exam-ple, treats the pad as a beam supported by an elasticfoundation which leads to an analytical expression forthe shape,f(r), of the contact pressure distributionwhich takes the form
{ }f(r)s1q 1q4cos(yb(R yr)) exp(yb(R yr))1 1
(22)
whereb is a parameter which depends on the elasticproperties of the pad. The shape function,f(r), nearthe wafer edge is plotted in Fig. 5 for a typical value ofb given by Bakerw26x. The contact pressure is constantin the central region of the wafer and there is a six-foldincrease at the edge. The parameterb primarily deter-mines the distance from the edge at which the contactpressure starts increasing. For the choice ofb used here,the contact pressure starts increasing from approximately4 mm away the edge.
3.5. Solution procedure
A numerical method of solution is needed to obtainthe concentration distribution of the oxidizerC in theregion between the wafer and the pad. We can computethe copper removal rate using Eq.(16) once C iscomputed. Eq.(3) is solved numerically forC(r, u, z)
84 D.G. Thakurta et al. / Thin Solid Films 414 (2002) 78–90
Fig. 5. Shape function for the contact pressure distribution(plottednear the wafer edge) from Baker’s modelw26x.
Table 1Summary of results of the three different cases
Simulation parameters:C s0.1 molyl, Ds10 m s , k sy9 2 y10 20
1=10 mol m s ,k s0, bs655 m andns1. Flow simu-y2 y2 y1 y130
lation parameters are the same as in Fig. 3.
in the region between the wafer and pad defined byrgw0, R x, ugw0, 2px, and zgw0, hx, with boundary1
conditions at inlet, pad and wafer surfaces given byEqs.(4), (5) and(15), respectively.Since the wafer surface is curved, transformation of
the z-coordinate is convenient for the purpose of dis-cretization. The following co-ordinate transformation isapplied
zszyh(r, u) (23)
which changes the solution domain fromzgw0, hx tozgw0, 1x. Eq. (3) and its boundary conditions arechanged to the(r, u, z) co-ordinate system and thendiscretized using a finite volume approachw30x. Amethod of iteration(Newton’s method) is used to solvethe system of discrete equations for the oxidizer concen-tration. The accuracy of the numerical results waschecked by using standard grid refinement techniques.In the results reported, the number of grid points in ther-, u- and z-directions are 75, 50 and 50, respectively,for a 200 mm diameter wafer.
4. Model results
4.1. Sample runs
As described in the previous section, a numericalapproximation to the concentration distribution of theoxidizer,C(r, u, z), and the local removal rate of copper,RR(r), may be computed once the flow and mass-transport problems are solved. Three sample run condi-tions and key results are presented in Table 1, with moreresults presented elsewherew30x. A typical mass diffu-sivity of a species in liquid media of 10 m s isy9 2 y1
used along with a stoichiometric coefficient,n, of unityfor these runs. The direct abrasion rate coefficient,k ,30is set to zero for simplicity and the slurry flow shownin Fig. 3 is used as input to the mass-transport equations.The results listed in Table 1 show that the average
removal rate decreases with decreasingk , a measure of1
the rate of chemical reaction at the wafer surface. Thebehavior ofh and the average concentrations of theoxidizer at the wafer and pad, denoted byC and C ,s b
respectively, as functions ofk are also indicated in1
Table 1. The values ofk have been varied by a factor1
of more than 20 to show how the chemical reactionaffects the results. Higher chemical rate constants causemore rapid consumption of oxidizer at the wafer surfaceso that mass transfer to the wafer surface is moreimportant as evidenced by the lower values ofh andC yC for larger k . That is, mass transfer is not rapids 0 1
enough to keep the concentration at the wafer surfaceclose toC when rate of reaction is very fast.0
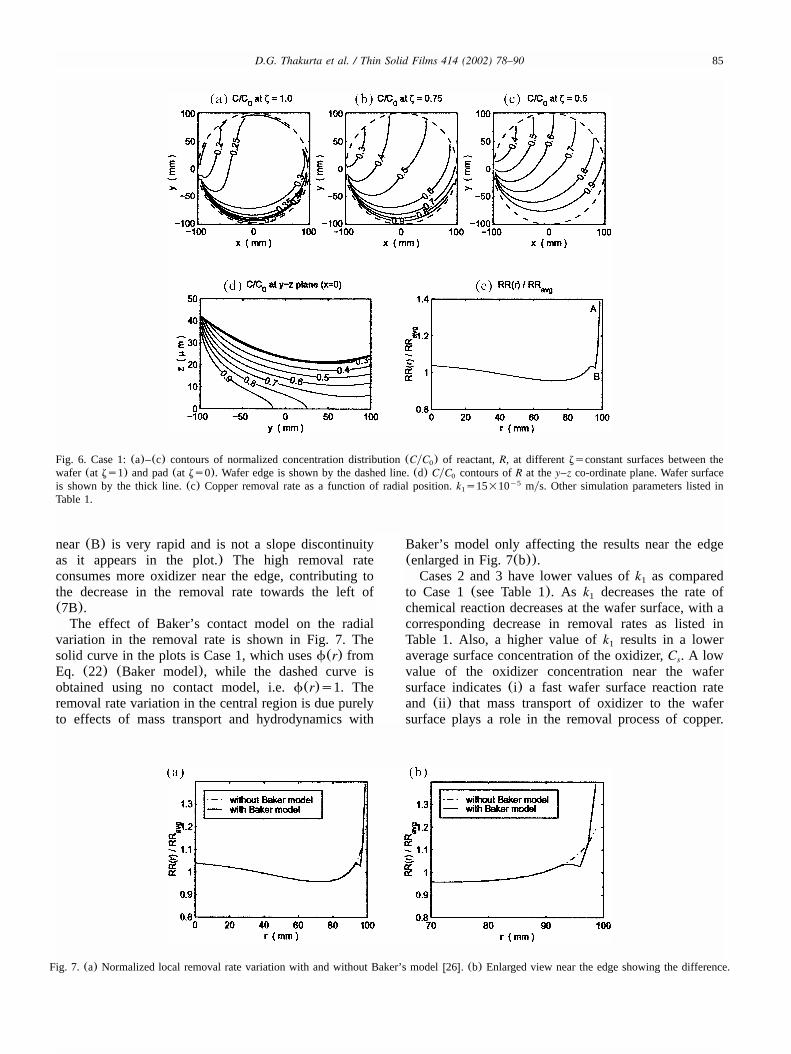
Fig. 6a shows contours of the normalized concentra-tion distribution, CyC , of the oxidizer at the wafer0
surface (zs1) for Case 1. Similarly, Fig. 6b,c showplots of CyC contours on surfaceszs0.75 and 0.5,0
respectively, between the wafer and pad. The value ofCyC is equal to one at the slurry inlet regions(the0
bottom parts of the wafer edge in the plots) as set bythe boundary condition at the inlet. The oxidizer reactswith the copper at the wafer surface and is thus con-sumed as it flows underneath the wafer. The depletionof the oxidizer is higher near the wafer surface as it isconsumed by the surface reaction, as illustrated by thecontours ofCyC in the y–z co-ordinate plane shown0
in Fig. 6d. (The slurry flows from left to right in thisplot.) The value of the concentration near the wafersurface is approximately 0.3C except for a small region0
near the inlet, while the concentration near the pad isalmost undepleted with values ranging from approxi-mately 0.75 to 1.Fig. 6e shows the normalized local copper removal
rate as a function of wafer radial position,r, that is thelocal removal rateRR(r) divided by the average removalrateRR . The computed average removal rate,RR ,avg avg
is 1256 nmymin for Case 1. The high removal rate atthe edgewlabeled (A) in Fig. 6x is due to the largevalue of k (see Eq.(21)) at the edge caused, in part,2
by f(r) being larger at the edge, and also by masstransfer being rapid at the inlet. The small dip at point(B) corresponds to the dip in the value ofk at rs962
mm as seen in Fig. 5.(The change in slope ofRR(r)
85D.G. Thakurta et al. / Thin Solid Films 414 (2002) 78–90
Fig. 6. Case 1:(a)–(c) contours of normalized concentration distribution(CyC ) of reactant,R, at differentzsconstant surfaces between the0
wafer (at zs1) and pad(at zs0). Wafer edge is shown by the dashed line.(d) CyC contours ofR at they–z co-ordinate plane. Wafer surface0
is shown by the thick line.(c) Copper removal rate as a function of radial position.k s15=10 mys. Other simulation parameters listed iny51
Table 1.
Fig. 7. (a) Normalized local removal rate variation with and without Baker’s modelw26x. (b) Enlarged view near the edge showing the difference.
near(B) is very rapid and is not a slope discontinuityas it appears in the plot.) The high removal rateconsumes more oxidizer near the edge, contributing tothe decrease in the removal rate towards the left of(7B).The effect of Baker’s contact model on the radial
variation in the removal rate is shown in Fig. 7. Thesolid curve in the plots is Case 1, which usesf(r) fromEq. (22) (Baker model), while the dashed curve isobtained using no contact model, i.e.f(r)s1. Theremoval rate variation in the central region is due purelyto effects of mass transport and hydrodynamics with
Baker’s model only affecting the results near the edge(enlarged in Fig. 7(b)).Cases 2 and 3 have lower values ofk as compared1
to Case 1(see Table 1). As k decreases the rate of1
chemical reaction decreases at the wafer surface, with acorresponding decrease in removal rates as listed inTable 1. Also, a higher value ofk results in a lower1
average surface concentration of the oxidizer,C . A lows
value of the oxidizer concentration near the wafersurface indicates(i) a fast wafer surface reaction rateand (ii) that mass transport of oxidizer to the wafersurface plays a role in the removal process of copper.
86 D.G. Thakurta et al. / Thin Solid Films 414 (2002) 78–90
Fig. 8. Behavior of the average removal rate as a function of the inlet concentration of the oxidizer for(a) varying k , (b) varying k , and (c)1 20
varying k .30
The impact of mass transport on the removal rate isquantified by the efficiency factor,h, as defined in Eq.(19) which varies from 0 to 1. The efficiency factor forCase 1 is lowest indicating that mass-transport resistanceof the oxidizer in reaching the wafer surface plays animportant role in the removal process. In Case 3, a highvalue of hs0.9 indicates that mass transport plays aless significant role as compared to Cases 1 and 2. Table1 also lists the average concentration of the oxidizer atthe pad surfaceC , which does not vary as much asCb s
because it is further away from the reacting surface andin effect is the source from which diffusion occurs tofeed the reaction.
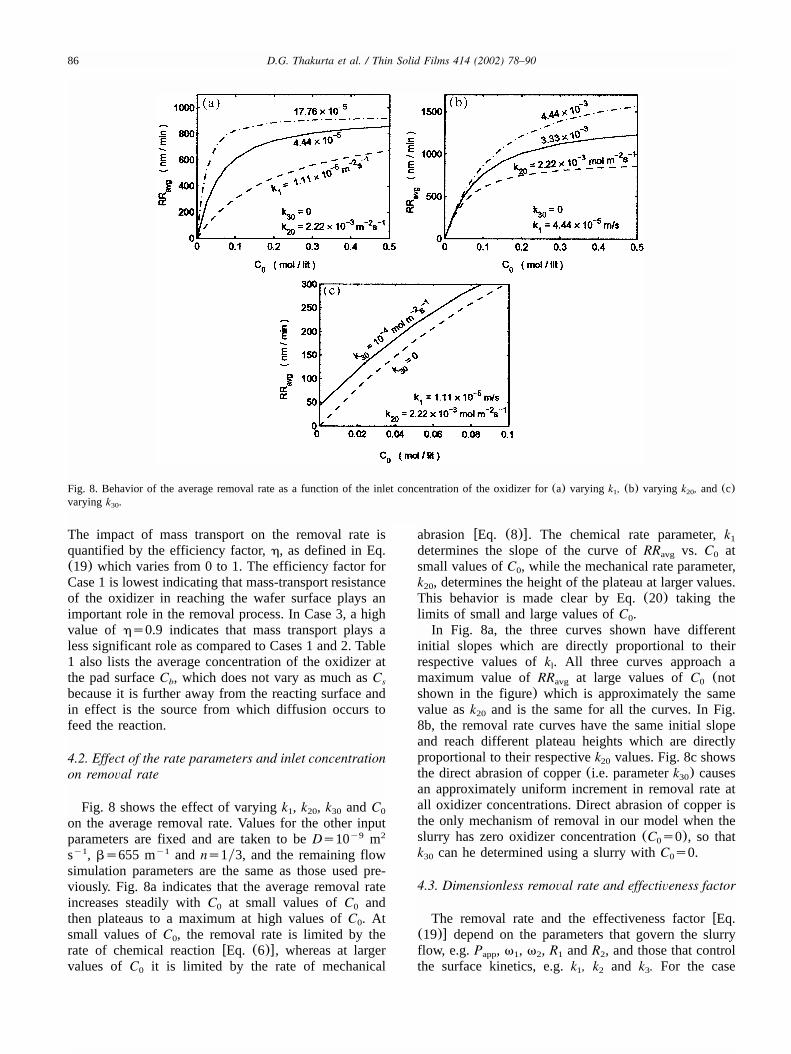
4.2. Effect of the rate parameters and inlet concentrationon removal rate
Fig. 8 shows the effect of varyingk , k , k andC1 20 30 0
on the average removal rate. Values for the other inputparameters are fixed and are taken to beDs10 my9 2
s , bs655 m andns1y3, and the remaining flowy1 y1
simulation parameters are the same as those used pre-viously. Fig. 8a indicates that the average removal rateincreases steadily withC at small values ofC and0 0
then plateaus to a maximum at high values ofC . At0
small values ofC , the removal rate is limited by the0
rate of chemical reactionwEq. (6)x, whereas at largervalues ofC it is limited by the rate of mechanical0
abrasion wEq. (8)x. The chemical rate parameter,k1determines the slope of the curve ofRR vs. C atavg 0
small values ofC , while the mechanical rate parameter,0
k , determines the height of the plateau at larger values.20
This behavior is made clear by Eq.(20) taking thelimits of small and large values ofC .0In Fig. 8a, the three curves shown have different
initial slopes which are directly proportional to theirrespective values ofk . All three curves approach al
maximum value ofRR at large values ofC (notavg 0
shown in the figure) which is approximately the samevalue ask and is the same for all the curves. In Fig.20
8b, the removal rate curves have the same initial slopeand reach different plateau heights which are directlyproportional to their respectivek values. Fig. 8c shows20
the direct abrasion of copper(i.e. parameterk ) causes30
an approximately uniform increment in removal rate atall oxidizer concentrations. Direct abrasion of copper isthe only mechanism of removal in our model when theslurry has zero oxidizer concentration(C s0), so that0
k can he determined using a slurry withC s0.30 0
4.3. Dimensionless removal rate and effectiveness factor
The removal rate and the effectiveness factorwEq.(19)x depend on the parameters that govern the slurryflow, e.g.P , v , v , R andR , and those that controlapp 1 2 1 2
the surface kinetics, e.g.k , k and k . For the case1 2 3
87D.G. Thakurta et al. / Thin Solid Films 414 (2002) 78–90
Fig. 9. Contours of(a) dimensionless average removal rate and(b)removal effectiveness factor.(The dots in the bottom-left corner cor-respond to experimental data, which are discussed in Section 5.) Flowparameters given in Fig. 3. Mass transport parameters given in Table1 exceptns1y3 andbs0 here.
when the resistance of mass transport of oxidizer to thewafer surface, either by convection or diffusion, is small,the rate determining step is either chemical(Step 2 asgiven by Eq.(6)) or mechanical abrasion(Step 3a asgiven by Eq.(8)) at the wafer surface. Our model maybe used to determine the behavior of the removal rateand the effectiveness factor as functions ofk (for Step1
2) and k (for Step 3a) while holding the remaining20
input parameters fixed as indicated in Fig. 9.In order to motivate the choice of the dimensionless
quantities used to plot Fig. 9, we must define some newquantities that are related to the magnitudes of thevarious parameters in the process. We begin with alength scale,z , which is proportional to the distance0
between the pad and the wafer. This quantity is relatedto known quantities by balancing scales for the horizon-tal pressure gradient and the vertical component of theshear stress in the horizontal momentum equation, i.e.Eq. (9) of Thakurta et al.w17x. Appropriate scales forthese quantities areP yR and v R y , respectively.2zapp 1 2 2 0
Equating these scales leads to
1y2w zmv R R2 2 1x |z s (24)0y ~Papp
which givesz in terms of known quantities.0
We now consider the left-hand-side of the flux bound-ary condition in Eq.(15), and approximate it in termsof the difference in concentration at the wafer and thepad as follows:
Ž .≠C r,u,h w z w zC yC C yCs b b sx | x |yD ,yD sD (25)y ~ y ~≠z z z0 0
When the concentration at the wafer surface is small,C ,0, the process is mass transfer limited because thes
rate of consumption of the active ingredient by thesurface reaction is rapid enough to consume essentiallyall of it that reaches the surface by mass transfer. In this
case, we may define a dimensionless average removalrate by
RRavg*RR s (26)avg 1M DCw 0
n r z0
where the concentration at the pad,C , is taken as theb
inlet concentration,C . When is small, substan-*RR0 avg
tially less than one, the surface reaction is relativelyslow and the effectiveness factor is close to unity. Underthese conditions the concentration of active ingredientremains close toC throughout the slurry.0
The dimensionless average removal rate, , is*RRavgplotted in Fig. 9a as a function of dimensionless rates
and . These quantities are defined below by a* *k k1 20
further consideration of Eq.(15). If we divide Eq.(15)(with f(r) taken to be 1) by the mass transfer limitedflux, DC yz , we obtain0 0
* * *Ž . Ž .≠C r,u,h k C r,u,h1y s (27)* *≠z k1 *Ž .1q C r,u,h*k20
whereC*sCyC and z*szyz , and the dimensionless0 0
rates and are given by* *k k1 20
nk z nk z1 0 20 0* *k s and k s (28)1 20D DC0
The surface rate limited flux occurs whenC(r, u, h)sC in which case0
* *Ž .≠C r,u,h k1y s (29)* *≠z k11q *k20
The right-hand-side of Eq.(29) gives the ratio of thesurface rate limited flux to the mass transfer rate limitedflux, the ratio of the two limiting cases of importance.It also suggests the definitions of the dimensionless rateparameters and . The quantity, , is the ratio of* * *k k k1 20 1
the rate of chemical reaction to the mass transfer rateand is the ratio of the rate of the mechanical abrasion*k20to mass transfer.Similarly, if we divide Eq.(16) by the mass transfer
limited rate, we obtain* * * Ž .k qk C r,u,h30 1
*Ž .RR r,u s (30)*k1 *Ž .1q C r,u,h*k20
where
Ž .RR r,u nk z30 0* *Ž .RR r,u s and k s (31)30 DC1 M DC 0w 0
n r z0
Performing the integrations indicated in Eqs.(17) and
88 D.G. Thakurta et al. / Thin Solid Films 414 (2002) 78–90
(18) gives us the complete expression for , and if*RRavgh,1 this reduces to
* *k qk30 1*RR s (32)*k11q *k20
In Fig. 9a we show the behavior of a dimensionlessaverage removal rate, . Contours of the dimension-*RRavgless average removal rate are plotted as a function ofthe dimensionless rate parameters and . Also,* *k k1 20
contours of the effectiveness factor,h, are plotted inFig. 9b as a function of and . For these plots,k* *k k1 20 30
is taken to zero(as in Table 1), because the contributionof direct abrasion of copper(Step 3b) to the removalrate is not significant unless the inlet concentration ofoxidizer is small.Plots such as those in Fig. 9 provide a means of
interpreting experimental data. If the removal rate hasbeen measured, one can compute from Eq.(26).*RRavgFor example, suppose s0.2, then the contour for*RRavgthis removal rate can be located on Fig. 9a and the*k1and values corresponding to that contour on Fig. 9b*k20indicate thath is between 0.96 and 0.98. For this case,one would conclude that surface kinetics limit the rateof removal, as one would want in CMP because thenthe concentration is close toC everywhere between the0
pad and the wafer and the removal rate is more uniform.Furthermore, ifh,1, Eq. (20) determines the removalrate to a very good approximation. However, if therange ofh includes values that are not close to unitythen the full slurry flowymass transfer model must besolved to determine the removal rate. In addition, ifh
is not close to unity, then local variations in removalrate may be significant and can be determined from Eq.(16) by using the mass transfer model given here.
5. Copper CMP experiments with potassium dichro-mate based slurry
Copper CMP experiments are performed with aK Cr O slurry, with the applied pressure, waferypad2 2 7
speed and oxidizer concentration varied. The objectivesare to(i) evaluate the model assumptions,(ii) determinevalues of the kinetic parametersk , k andk by fitting1 20 30
the model predicted average removal rate to the exper-imentally measured value, and(iii ) determine the behav-ior of k and k as functions of applied pressure and20 30
speed.For our CMP experiments, blanket copper films are
sputtered on 125 mm diameter unpatterned wafers. Theslurry consisted of an oxidizer(K Cr O ), alumina2 2 7
particles(50 nm nominal diameter) and de-ionized(DI)water, with the abrasive concentration fixed at 3 wt.%.An IPEC 372M polishing tool is used with a Pan-Wpad manufactured by Freudenberg. The diameter of the
polishing table is 57 cm and the eccentric distancebetween the polishing head and the center of thepolishing table,R , is 173 mm. Both the platen and2
carrier are rotated at equal speed in all experiments,with the slurry delivery rate fixed at 150 mlymin. Thepolish time varied from 1 to 2 min. Sheet resistance ismeasured using a four-point probe before and after thepolishing experiment at four locations in the centralregion of the wafer. The sheet resistance measurementsare used to obtain the local removal rates, which arethen averaged to compute an average removal rate,
.*RRavgThe K Cr O slurry is ideal to evaluate our model2 2 7
because the formation of a reacted layer on the surfacewith this slurry has been confirmed by potentiodynamicand surface Auger electron spectroscopy(AES) meas-urementsw21x. The overall oxidation reaction at thewafer surface can be written as follows
2y q 2q 3q3CuqCr O q14H ™3Cu q2Cr q7H O (33)2 7 2
Three moles of copper react per mole of the oxidizer,giving a stoichiometric coefficientns1y3. (For com-parison with Eq.(2), R is Cr andL is Cu .) The2y 2qO2 7
applied pressure, waferypad speed and K Cr O concen-2 2 7
tration in the slurry are varied to study their effects onthe average removal rate. The following pressure(kPa)yspeed(r.p.m.) combinations are used: 14y45; 28y45;42y45; 28y30; and 28y60. K Cr O concentration in the2 2 7
slurry, C , is varied between 0 and 0.35 molyl for each0
pressureyspeed combination. The experimental dataplotted in Fig. 10 show that the average removal rateincreases with an increase in either pressure or speed.A measurable removal rate exists at zero K Cr O2 2 7
concentration, which is also a function of pressure andspeed. For any given pressureyspeed combination,
initially increases withC and then plateaus with*RRavg 0
further increase inC , in agreement with our model.0
The values ofk , k and k for this slurry are1 20 30
determined by fitting the average removal rate predictedby our model with that determined experimentally. Weassume the following:(i) the value ofk is constant;1
and(ii) k andk are functions of pressure and speed.20 30
The shape function,f, is set equal to one as it onlyaffects the removal rate in a small region at the waferedge and does not significantly affect the averageremoval rate calculations.Initial estimates for thek values are obtained as
follows. At a given pressure and speed,k is estimated20
to fit the removal rate data in the plateau region, whilek is estimated to fit the data at zero oxidizer concen-30
tration. The value ofk (1yk yk ) determines the rate1 3 2
of change of withC for small values ofC, is*RRavg 0
estimated by fitting to the initial slopes at all pressureyspeed combinations of the experimental data shown inFig. 10.
89D.G. Thakurta et al. / Thin Solid Films 414 (2002) 78–90
Table 2Values ofk , k andk fitted to experimental data for different pres-1 20 30
sureyspeed combinations
Papp v sv1 2 k =1061 k =10420 k =10430
(kPa) (r.p.m.) (m s )y1 (mol m s )y2 y1 (mol m s )y2 y1
Fig. 10. Behavior of the average removal rate as a function of K Cr O concentration for(a) varying applied pressure and(b) varying speed.2 2 7
The marks represent experimental measurements. The error bars for the 45 r.p.m.y14 kPa case indicate one standard deviation in the averageremoval rate measurements and are representative of the other cases. The solid curves show model predictions based on fitted values of the kineticparameters listed in Table 2.
The efficiency factor,h, for all experimental condi-tions is very close to one implying that the masstransport of the oxidizer(Step 1) is fast enough tomaintain the concentration near the wafer surface veryclose toC . Therefore, the removal process is controlled0
by the surface kinetic steps, and the average removalrate is well approximated by Eq.(20). The dots in Fig.9b show the corresponding dimensionless rate parame-ters for these experiments.The five sets of data plotted in Fig. 10 correspond to
the five chosen pressureyspeed combinations in theexperiments. Given thath is close to one, values fork , k and k may be determined from the data using1 20 30
a non-linear least squares fit to the curves given by Eq.(20) with the constraint thatk is held fixed for all data1
setsw30x. The fitted rate parameters are listed in Table2.In the experimental range of pressure and speed, both
k andk are approximately proportional to the wafer-20 30
pad speed whilek has a stronger dependency on the20
applied pressure than that fork . Intuitively, the hard-30
ness of the copper layer relative to that of the reactedlayer plays a significant role on the dependency ofk20andk on pressure, but not so much on speed. For the30
oxider used in the experiments, the dependency suggeststhat the copper layer is harder than the reacted layer.Also, at a given pressure and speed, the higher valuesof k as compared tok (both fitted from the experi-20 30
ments) again implies the reacted layer is easier to abradethan copper.Removal by chemical reaction followed by the abra-
sion of the reacted layer is preferred as a better surfacefinish is obtained. Wafers which were polished withC G0.1 molyl had a shiny metallic finish, while polish-0
ing with C F0.1 molyl resulted in a hazy finish with0
significant visible scratching.
6. Conclusions
A model for copper CMP was developed for an acidicslurry and evaluated with experiments. The model takesinto account the effects of slurry hydrodynamics, slurrychemistry, chemical reaction and mechanical abrasion atthe wafer surface. The steps in the copper removalprocess include: mass transport of the oxidizer to thewafer surface; reaction of oxidizer with copper to forma reacted layer with subsequent removal of the reactedlayer by mechanical abrasion; in addition, copper maybe removed by direct abrasion. The rates of the chemicalreaction and mechanical abrasion steps are described byseparate kinetic rate parameters. Variation in the removalrate results from mass transport effects and variation inthe local contact pressure.A good CMP process should be controlled by the
surface processes, not mass transfer, and requires abalance between chemical and mechanical effects. Forlow oxidizer concentrations, the chemical reaction(Step1) limits the removal rate; as a result, surface damageis possible due to direct mechanical abrasion(Step 2)
90 D.G. Thakurta et al. / Thin Solid Films 414 (2002) 78–90
and the removal rate is lower than can be achieved. Athigh oxidizer concentrations, mechanical abrasion con-trols the removal rate of the chemically-altered surfacelayer. Copper CMP experiments with K Cr O oxidizer2 2 7
and alumina abrasive particles are compatible with theproposed surface kinetics model.The importance of mass transport has been incorpo-
rated in our model and is measured by the efficiencyfactor,h. Mass transport effects are important when theremoval rates are quite high; more specifically, masstransport of the oxidizer to the wafer surface not onlylimits the removal rate, but results in a wafer-scale radialnon-uniformity. Unfortunately, this regime of operationcould not be experimentally evaluated with our equip-ment and consumable set. In fact, any robust CMPmanufacturing process requires a value ofhs1 to avoidwafer-scale non-uniformities in removal rate.
Acknowledgments
This work was supported by the Center of Intercon-nect Science and Technology(CAIST), SemiconductorResearch Corporation(SRC) contract number 99-IC-448. The authors also thank Freudenberg Nonwovensfor donating Pan-W polishing pads.
References
w1x S. Sivaram, H. Bath, R. Leggett, A. Maury, K. Monnig, R.Tolles, Solid State Technol. 35(1992) 87.
w2x I. Ali, M. Rodder, S.R. Roy, G. Shinn, M.I. Raja, J. Electro-chem. Soc. 142(1995) 3088.
w3x J.M. Steigerwald, S.P. Murarka, R.J. Gutmann, ChemicalMechanical Planarization of Microelectronic Materials, Wiley-Interscience, New York, 1997.