39
TOMOGRAPHIC INSTRUMENTATION SYSTEM BASED ON ULTRASONIC SENSOR FOR MONITORING IRREGULARITIES IN PIPE MOHD KHAIRUL NAIM BIN RAMLI UNIVERSITI TEKNOLOGI MALAYSIA
TOMOGRAPHIC INSTRUMENTATION SYSTEM BASED ON ULTRASONIC
SENSOR FOR MONITORING IRREGULARITIES IN PIPE
MOHD KHAIRUL NAIM BIN RAMLI
UNIVERSITI TEKNOLOGI MALAYSIA
TOMOGRAPHIC INSTRUMENTATION SYSTEM BASED ON ULTRASONIC
SENSOR FOR MONITORING IRREGULARITIES IN PIPE
MOHD KHAIRUL NAIM BIN RAMLI
A thesis submitted in fulfilment of the
requirements for the award of the degree of
Master of Engineering (Gas)
Faculty of Petroleum and Renewable Energy Engineering
Universiti Teknologi Malaysia
APRIL 2015

iii
DEDICATION
I dedicated this thesis to my beloved family especially my father Ramli Bin Mat Taib
and my mother Mastura Binti Kusaini, my lecturers and friends who are always
stand by my side in accomplishing this thesis.

iv
ACKNOWLEDGEMENT
In the name of Allah, the Most Gracious and the Most Merciful
Alhamdulillah, all praises to Allah for the strengths and His blessing in
completing this thesis. Special gratitude goes to my supervisor, Dr Mariani Binti
Idroas, for her supervision and constant support in accomplishing this thesis. Her
invaluable help of constructive comments and suggestions regarding instrumentation
system throughout the experimental and thesis works have contributed to the success
of this research. Not forgotten, my appreciation to my co-supervisor, Associate
Professor Dr. Ir. Zainal Bin Zakaria for his support and valuable knowledges
regarding this topic.
I would like to express my deepest appreciation to the staff of Faculty of
Petroleum and Renewable Energy Engineering, Mr Ikhwan and Mr Yahya for
assisting me to finish the project. I will not forget to all AMIR Lab members,
especially Associate Professor Dr. Nasir Ibrahim who actually contributes a lot of
ideas for this instrumentation system. A remarkable honor for Mr. Amir Hamzah
and Mr. Azreen Firdaus, Mr Ridhwan, Mr. „Akif and Muhazri who are willing to
put a great effort in assisting me through most difficult moments.
Finally, I would like to address deepest appreciation to my beloved family,
especially to my parent Ramli Bin Mat Taib and Mastura Binti Kusaini for keeping
faith in me and give me moral support during my toughest time in study.
v
ABSTRACT
The formation of irregularities inside pipes is a common phenomenon that
occurs in the chemical industry. The presence of irregularities on the surface of the
internal pipe wall can lead to corrosion which eventually reduces its own integrity for
operation. Many methods have been developed for the prevention and detection of
this problem. An ultrasonic is one of the non-destructive methods used in the
industrial sector. An ultrasonic instrumentation system has been developed in this
project to detect the presence of internal irregularities in a pipe. The variations of
ultrasonic signals were observed in the experiment when it passed through different
conditions of the internal pipe surfaces. An ultrasonic Sensor EFC16T/R-2 with a
frequency of 40 kHz was mounted outside the test pipe using a circle ring sensoring
unit. The results showed that there were changes of output voltage when there were
irregularities detected in the ultrasonic path. The output voltage was low in the range
of 2.1333V to 3.1334V when there were no irregularities detected inside the steel
pipe. The increase in output voltage from 5.4677V to 8.8667V indicated that the
absorption of ultrasonic signals by irregularities had occurred. The collected data
were processed using Matlab software to reconstruct the images inside the pipe. The
reconstructed images showed the irregularities detected inside the pipe that
resembled the actual conditions of the pipe. However, several images showed a slight
inaccuracy of irregularities position in the test pipe compared to the actual condition
of the pipe. This was due to the instability of ultrasonic signals, which could be
easily affected by environmental factors and the presence of noise during the
experiment. Nonetheless, it is believed that the developed ultrasonic tomography was
able to monitor any irregularities present inside a pipe.
vi
ABSTRAK
Pembentukan ketaksekataan di dalam paip adalah fenomena yang biasa
berlaku dalam industri kimia. Kehadiran ketaksekataan pada permukaan dinding
dalaman paip boleh mengakibatkan pengaratan yang akhirnya akan mengurangkan
keutuhannya untuk beroperasi. Banyak kaedah telah dibangunkan untuk pencegahan
dan pengesanan masalah ini. Ultrasonik adalah salah satu kaedah tanpa-musnah yang
digunakan dalam sektor industri. Sistem instrumentasi ultrasonik telah dibangunkan
dalam projek ini untuk mengesan kehadiran ketaksekataan dalaman paip.
Kepelbagaian isyarat ultrasonik telah diperhatikan dalam ujikaji ini apabila melalui
keadaan yang berbeza di permukaan dalaman paip. Penderia ultrasonik EFC16T/R-2
dengan frekuensi 40 kHz telah dipasang di luar paip yang diuji dengan menggunakan
unit penderiaan gelang bulat. Keputusan menunjukkan terdapat perubahan pada
voltan keluaran apabila ketaksekataan dikesan pada laluan ultrasonik. Voltan
keluaran adalah rendah dalam julat antara 2.1333V sehingga 3.1334V apabila tiada
ketaksekataan dikesan di dalam paip keluli. Kenaikan dalam voltan keluaran
daripada 5.4677V sehingga 8.8667V menunjukkan penyerapan isyarat ultrasonik
oleh ketaksekataan telah berlaku. Data terkumpul telah diproses menggunakan
perisian Matlab untuk membina-semula bayangan di dalam paip. Bayangan yang
dibina-semula menunjukkan ketaksekataan dikesan pada dalaman paip dan ini
menyerupai keadaan sebenar paip. Walaubagaimanapun, beberapa bayangan
menunjukkan sedikit ketidakjituaan kedudukan ketaksekataan dalam paip yang diuji
berbanding dengan keadaan paip sebenar. Ini disebabkan ketidakstabilan isyarat
ultrasonik yang terjejas dengan mudah oleh faktor persekitaran dan kehadiran hingar
semasa ujikaji. Namun begitu, ultrasonik tomografi yang dibangunkan mampu
mengawas sebarang ketaksekataan yang hadir dalam paip.
vii
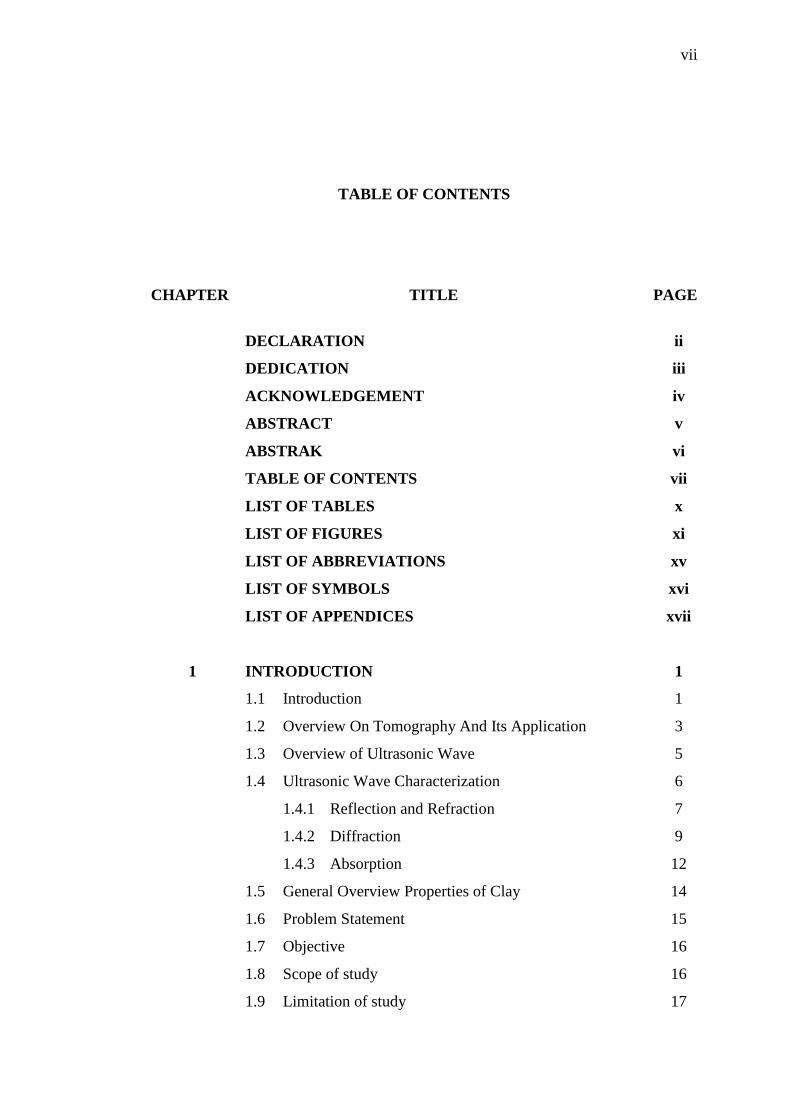
TABLE OF CONTENTS
CHAPTER TITLE PAGE
DECLARATION ii
DEDICATION iii
ACKNOWLEDGEMENT iv
ABSTRACT v
ABSTRAK vi
TABLE OF CONTENTS vii
LIST OF TABLES x
LIST OF FIGURES xi
LIST OF ABBREVIATIONS xv
LIST OF SYMBOLS xvi
LIST OF APPENDICES xvii
1 INTRODUCTION 1
1.1 Introduction 1
1.2 Overview On Tomography And Its Application 3
1.3 Overview of Ultrasonic Wave 5
1.4 Ultrasonic Wave Characterization 6
1.4.1 Reflection and Refraction 7
1.4.2 Diffraction 9
1.4.3 Absorption 12
1.5 General Overview Properties of Clay 14
1.6 Problem Statement 15
1.7 Objective 16
1.8 Scope of study 16
1.9 Limitation of study 17
viii
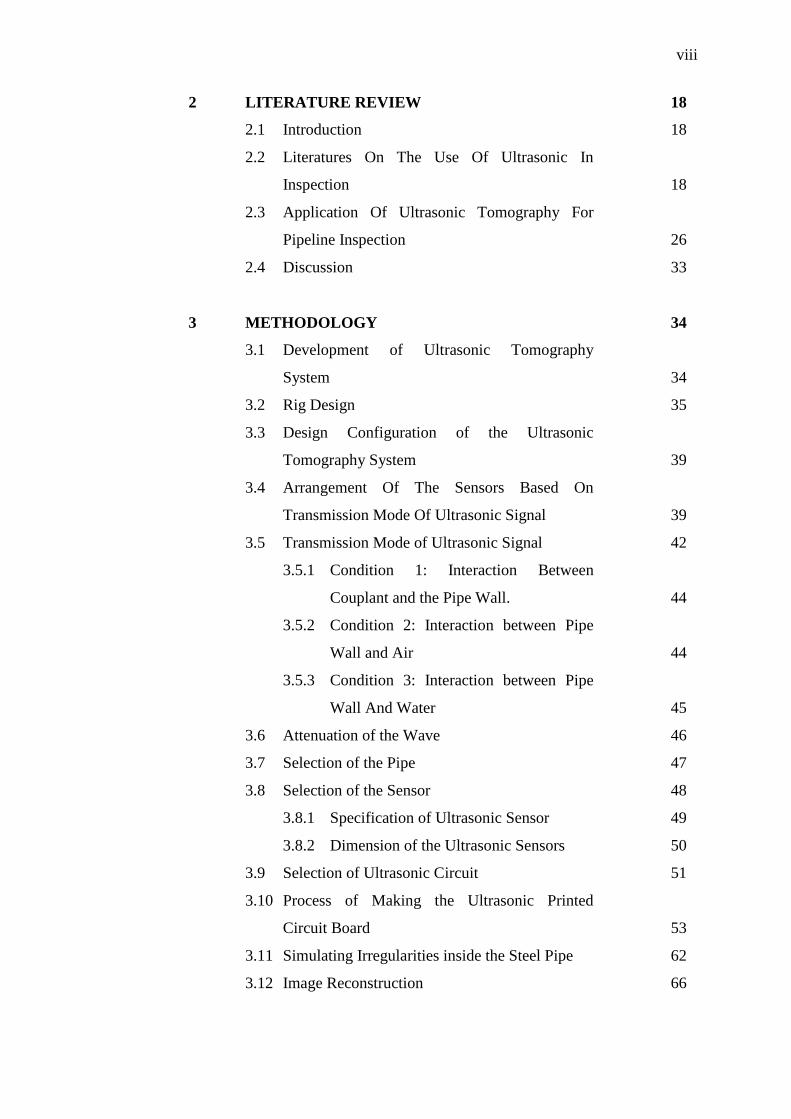
2 LITERATURE REVIEW 18
2.1 Introduction 18
2.2 Literatures On The Use Of Ultrasonic In
Inspection 18
2.3 Application Of Ultrasonic Tomography For
Pipeline Inspection 26
2.4 Discussion 33
3 METHODOLOGY 34
3.1 Development of Ultrasonic Tomography
System 34
3.2 Rig Design 35
3.3 Design Configuration of the Ultrasonic
Tomography System 39
3.4 Arrangement Of The Sensors Based On
Transmission Mode Of Ultrasonic Signal 39
3.5 Transmission Mode of Ultrasonic Signal 42
3.5.1 Condition 1: Interaction Between
Couplant and the Pipe Wall. 44
3.5.2 Condition 2: Interaction between Pipe
Wall and Air 44
3.5.3 Condition 3: Interaction between Pipe
Wall And Water 45
3.6 Attenuation of the Wave 46
3.7 Selection of the Pipe 47
3.8 Selection of the Sensor 48
3.8.1 Specification of Ultrasonic Sensor 49
3.8.2 Dimension of the Ultrasonic Sensors 50
3.9 Selection of Ultrasonic Circuit 51
3.10 Process of Making the Ultrasonic Printed
Circuit Board 53
3.11 Simulating Irregularities inside the Steel Pipe 62
3.12 Image Reconstruction 66
ix
3.12.1 Basic Concept of Image Reconstruction
by Matlab Software 66
3.13 Initial Sensor Testing 69
3.14 Irregularities Detection in Pipe 71
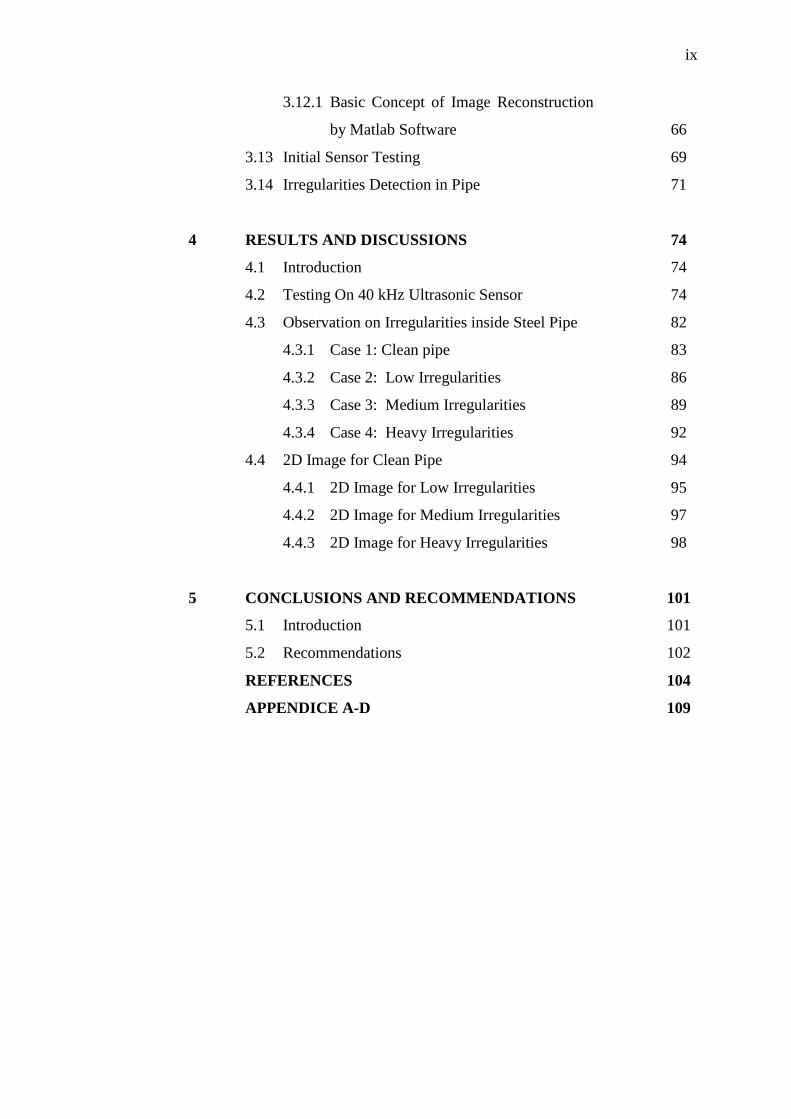
4 RESULTS AND DISCUSSIONS 74
4.1 Introduction 74
4.2 Testing On 40 kHz Ultrasonic Sensor 74
4.3 Observation on Irregularities inside Steel Pipe 82
4.3.1 Case 1: Clean pipe 83
4.3.2 Case 2: Low Irregularities 86
4.3.3 Case 3: Medium Irregularities 89
4.3.4 Case 4: Heavy Irregularities 92
4.4 2D Image for Clean Pipe 94
4.4.1 2D Image for Low Irregularities 95
4.4.2 2D Image for Medium Irregularities 97
4.4.3 2D Image for Heavy Irregularities 98
5 CONCLUSIONS AND RECOMMENDATIONS 101
5.1 Introduction 101
5.2 Recommendations 102
REFERENCES 104
APPENDICE A-D 109
x
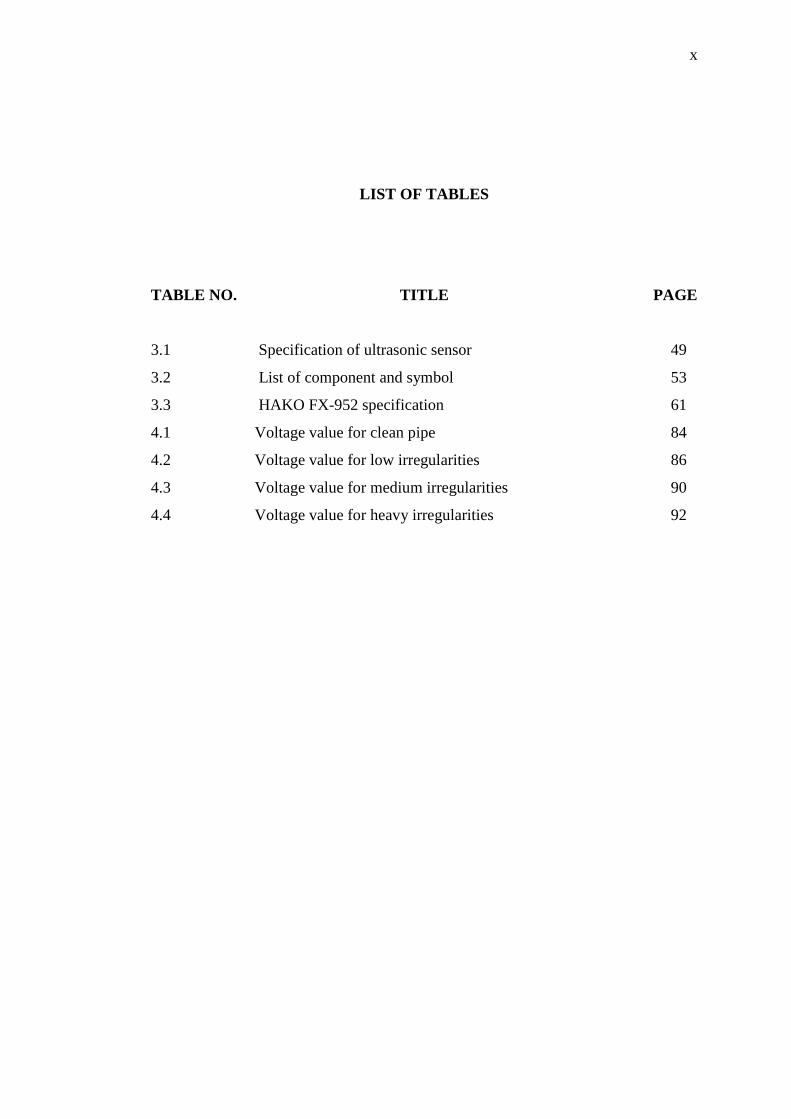
LIST OF TABLES
TABLE NO. TITLE PAGE
3.1 Specification of ultrasonic sensor 49
3.2 List of component and symbol 53
3.3 HAKO FX-952 specification 61
4.1 Voltage value for clean pipe 84
4.2 Voltage value for low irregularities 86
4.3 Voltage value for medium irregularities 90
4.4 Voltage value for heavy irregularities 92
xi
LIST OF FIGURES
FIGURE NO. TITLE PAGE
1.1 Schematic diagram of tomography 2
1.2 Schematic diagram of ECT 3
1.3 Mechanical and Electromagnetic wave spectrum 6
1.4 Propagation of longitudinal and transverse wave 7
1.5 Reflection of sound wave 8
1.6 Refraction of sound wave 8
1.7 Diffraction of sound wave 9
1.8 Diffraction through small aperture 10
1.9 Diffraction through large aperture 10
1.10 Diffraction through the small obstacle 11
1.11 Diffraction through the big obstacle 12
1.12 Absorption of the sound 13
2.1 The set-up of the 3D numerical model for
investigation of ultrasonic guided wave
propagation in a defective CFRP rod 19
2.2 Location of circular array of PWAS 20
2.3 Schematic diagram for the path of the lamb wave
correspondent with Figure 2.2 21
2.4 A general view a box with three inserted
samplesfor corrosion test 22
2.5 Ultrasonic attached at the surface of the plat 22
2.6 Ultrasonic signal response of non-corroded
sample 24
2.7 Ultrasonic signal response of corroded sample 24
xii
2.8 (a) Dimensions and (b) ultrasonic inspection of a
GRP step-shaped specimen containing an
artificial delamination created by Teflon film 25
2.9 Experimental setup for ultrasonic imaging in
molten Al 26
2.10 Measurement section 27
2.11 Schematic diagram of the ultrasonic propagation
imaging system 28
2.12 Pipe is attached with sensors and signal
visualisation 29
2.13 Experimental setup for data acquisition 30
2.14 Mounted transducer ring and G3 Wavemaker
excitation instrument, both from Guided
Ultrasonics Ltd 31
2.15 Pipeline Corrosion Inspection Experiment 32
2.16 Illustration of three-dimensional parameters
(Axial extent, radial depth and circumferential
extent) of the defect 32
2.17 Schematic representation of experimental setup
for pipe inspection 33
3.1 Ultrasonic tomography system 35
3.2 Rig setup 36
3.3 Drawing of the experiment setup 37
3.4 Trail path for the ring‟s movement 38
3.5 Drawing of trail path for the ring‟s movement 38
3.6 The sensor configuration of transmission mode 40
3.7 Arrangement of ultrasonic sensors 40
3.8 Steel pipe used in experiment 41
3.9 Transmission-mode of ultrasonic signal 42
3.10 Signal travel across an empty pipe 46
3.11 Dimension of the pipe 48
3.12 Transmitter and receiver ultrasonic sensor 49
3.13 Dimension of the sensors 50
3.14 Receiver circuit 51
xiii
3.15 Transmitter circuit 52
3.16 Schematic diagram for transmitter circuit 54
3.17 Schematic diagram for receiver circuit 54
3.18 Printed transmitter diagram 55
3.19 Printed receiver diagram 55
3.20 Clean copper board 56
3.21 Laminating the copper board 57
3.22 Imprinted circuit on the board 57
3.23 Etching process 58
3.24 Clean circuit board 59
3.25 Drilling process 59
3.27 Solder station 60
3.27 Soldering process 61
3.28 Low irregularities 63
3.29 Medium irregularities 64
3.30 Heavy irregularities 65
3.31 Alpha position in image 68
3.32 Direction of projection, m 68
3.33 Tomography a 2-D reconstruction 69
3.34 Experiment setup for sensor testing 70
3.35 Schematic diagram of the experiment setup for
sensor testing 71
3.36 Experiment setup. (a) Location of the transmitter.
(b) Location of the receiver. (c) Overall
experiment setup. (d) Testing on section 1 72
4.1 Schematic diagram an arrangement of the
ultrasonic sensor for testing 75
4.2 Arrangement of the ultrasonic sensor for testing 75
4.3 Response of the signal when travelling through
the open air 76
4.4 One period of input ultrasonic signal 76
4.5 Schematic diagram for sensor testing using one
steel pipe 78
4.6 Setup for sensor testing using one steel pipe 78
xiv
4.7 Example output of the signal 80
4.8 Example of data interpretation 81
4.9 Position of sensors 83
4.10 Output voltage at the clean pipe section
measurement 85
4.11 Output voltage at low irregularities 87
4.12 Example of output response from Rx1 89
4.13 Output voltage for medium irregularities 91
4.14 Output voltage for heavy irregularities 93
4.15 2D image of clean pipe 95
4.16 2D image for low irregularities 96
4.17 2D image for medium irregularities 98
4.18 2D image for heavy irregularities 99
xv
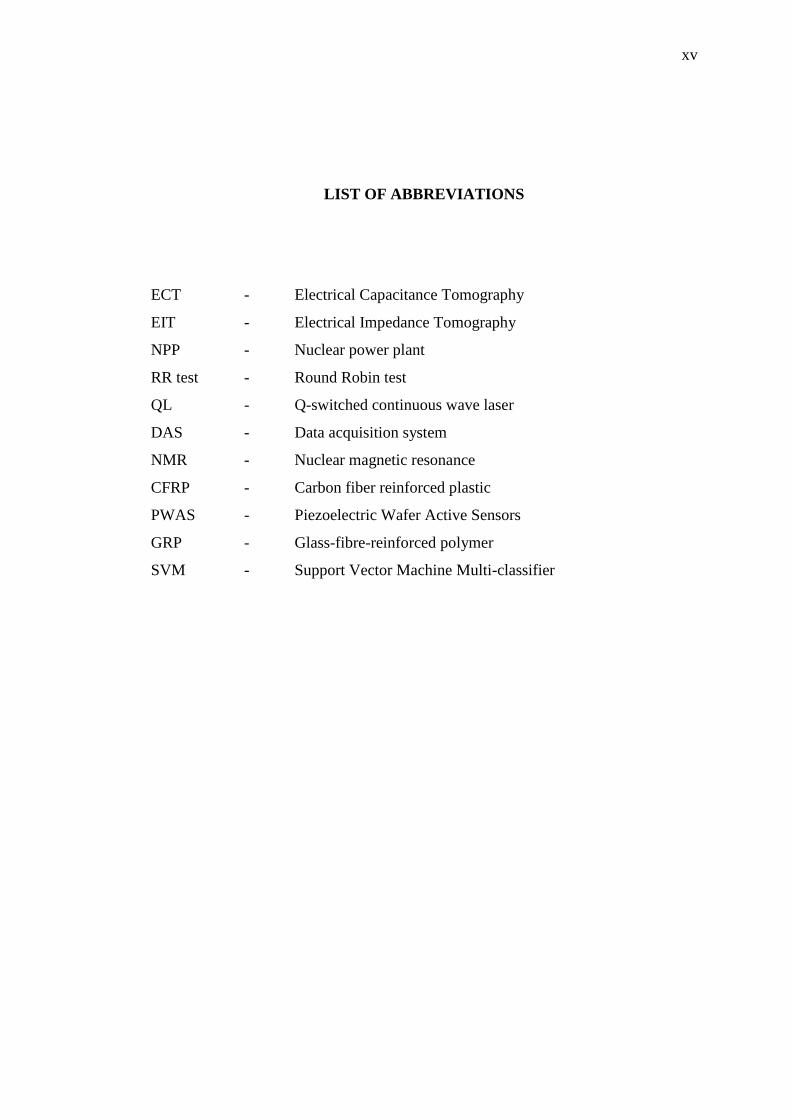
LIST OF ABBREVIATIONS
ECT - Electrical Capacitance Tomography
EIT - Electrical Impedance Tomography
NPP - Nuclear power plant
RR test - Round Robin test
QL - Q-switched continuous wave laser
DAS - Data acquisition system
NMR - Nuclear magnetic resonance
CFRP - Carbon fiber reinforced plastic
PWAS - Piezoelectric Wafer Active Sensors
GRP - Glass-fibre-reinforced polymer
SVM - Support Vector Machine Multi-classifier
xvi
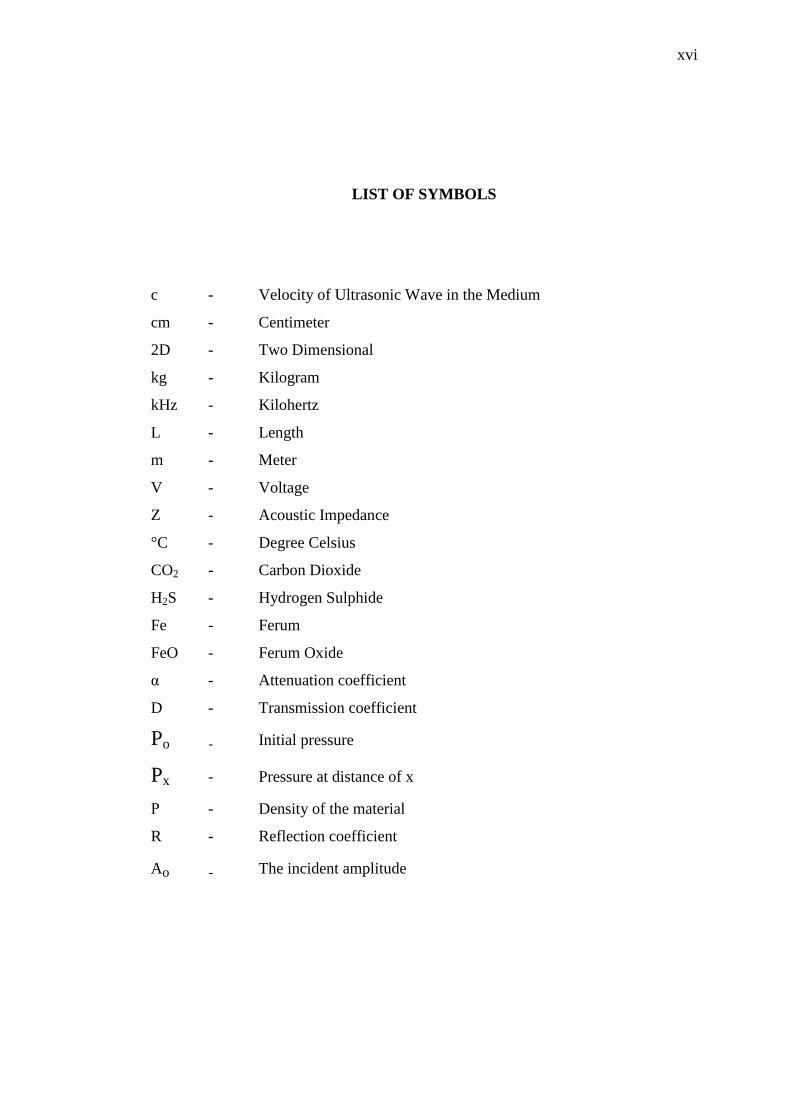
LIST OF SYMBOLS
c - Velocity of Ultrasonic Wave in the Medium
cm - Centimeter
2D - Two Dimensional
kg - Kilogram
kHz - Kilohertz
L - Length
m - Meter
V - Voltage
Z - Acoustic Impedance
°C - Degree Celsius
CO2 - Carbon Dioxide
H2S - Hydrogen Sulphide
Fe - Ferum
FeO - Ferum Oxide
α - Attenuation coefficient
D - Transmission coefficient
Po - Initial pressure
Px - Pressure at distance of x
Ρ - Density of the material
R - Reflection coefficient
Ao - The incident amplitude
xvii
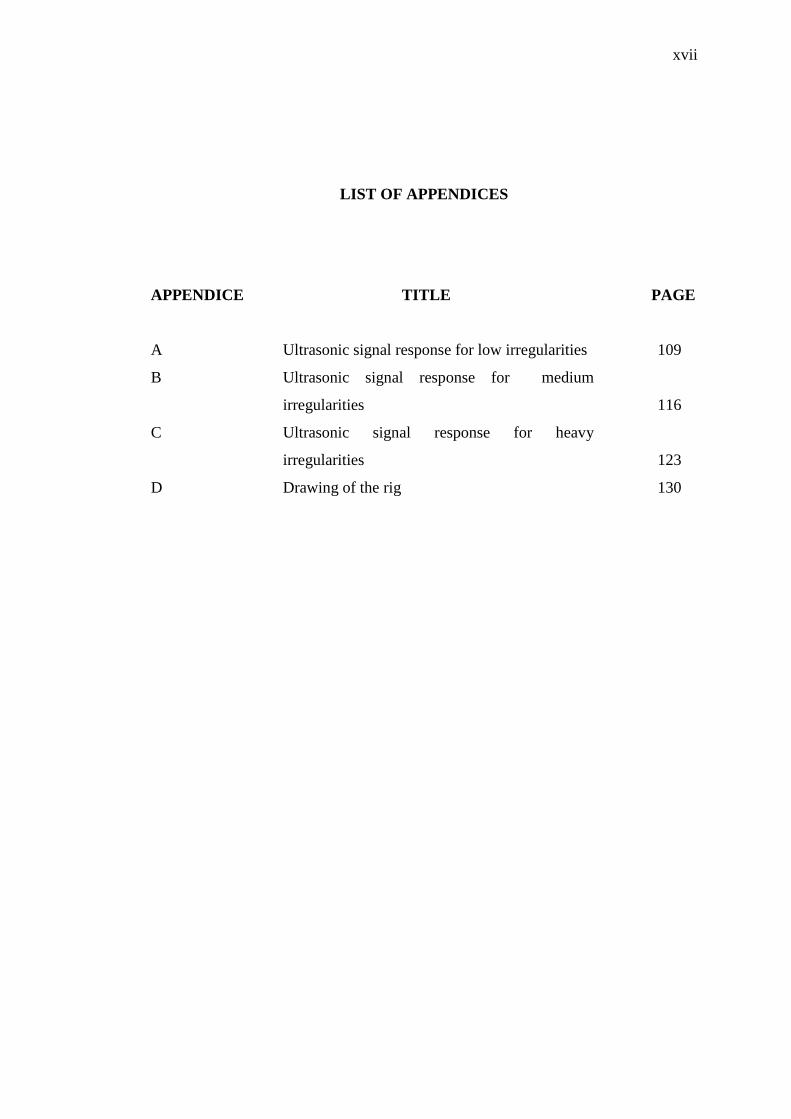
LIST OF APPENDICES
APPENDICE TITLE PAGE
A Ultrasonic signal response for low irregularities 109
B Ultrasonic signal response for medium
irregularities 116
C Ultrasonic signal response for heavy
irregularities 123
D Drawing of the rig 130
CHAPTER 1
INTRODUCTION
1.1 Introduction
Tomography is defined as a process of imaging by sectioning interior solid
materials from the outside using waves of energy without affecting the object.
Process tomography can give real-time cross-sectional images inside the materials
(Grangeat, 2013; Martin.J et al., 2001). In the process of tomography, a 2D or 3D
image of some physical quantity inside the object can be obtained using external
sensors to detect signals from the boundaries of the object (Dickin et al., 1992;
Schlaberg et al., 1997)
This process also involves getting measurements and data in order to
investigate what is going on inside the particular material, such as a vessel or
pipeline. The measurements are usually based on temperature, pressure, power level,
component geometry and others (Dickin et al., 1992).
Process tomography consists of three basic elements. The elements are
sensors, a sensor electronic circuit and an image reconstruction system. The most
important element is the sensor because how the sensor interrogates the process and
information obtained from the process will affect the accuracy of the whole system
(Dickin et al., 1992).
2
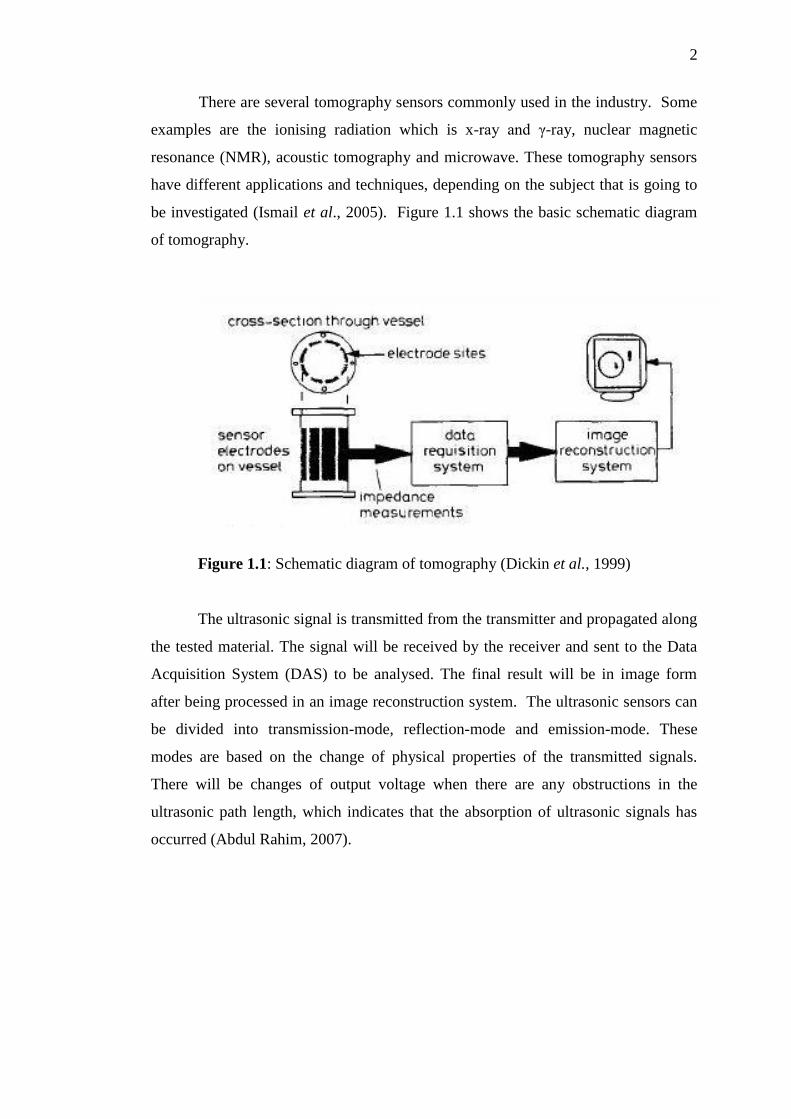
There are several tomography sensors commonly used in the industry. Some
examples are the ionising radiation which is x-ray and γ-ray, nuclear magnetic
resonance (NMR), acoustic tomography and microwave. These tomography sensors
have different applications and techniques, depending on the subject that is going to
be investigated (Ismail et al., 2005). Figure 1.1 shows the basic schematic diagram
of tomography.
Figure 1.1: Schematic diagram of tomography (Dickin et al., 1999)
The ultrasonic signal is transmitted from the transmitter and propagated along
the tested material. The signal will be received by the receiver and sent to the Data
Acquisition System (DAS) to be analysed. The final result will be in image form
after being processed in an image reconstruction system. The ultrasonic sensors can
be divided into transmission-mode, reflection-mode and emission-mode. These
modes are based on the change of physical properties of the transmitted signals.
There will be changes of output voltage when there are any obstructions in the
ultrasonic path length, which indicates that the absorption of ultrasonic signals has
occurred (Abdul Rahim, 2007).
3
1.2 Overview On Tomography And Its Application
Tomography has become one of the most important techniques and has been
applied in various kinds of fields such as medical, engineering, biotechnology and
others.
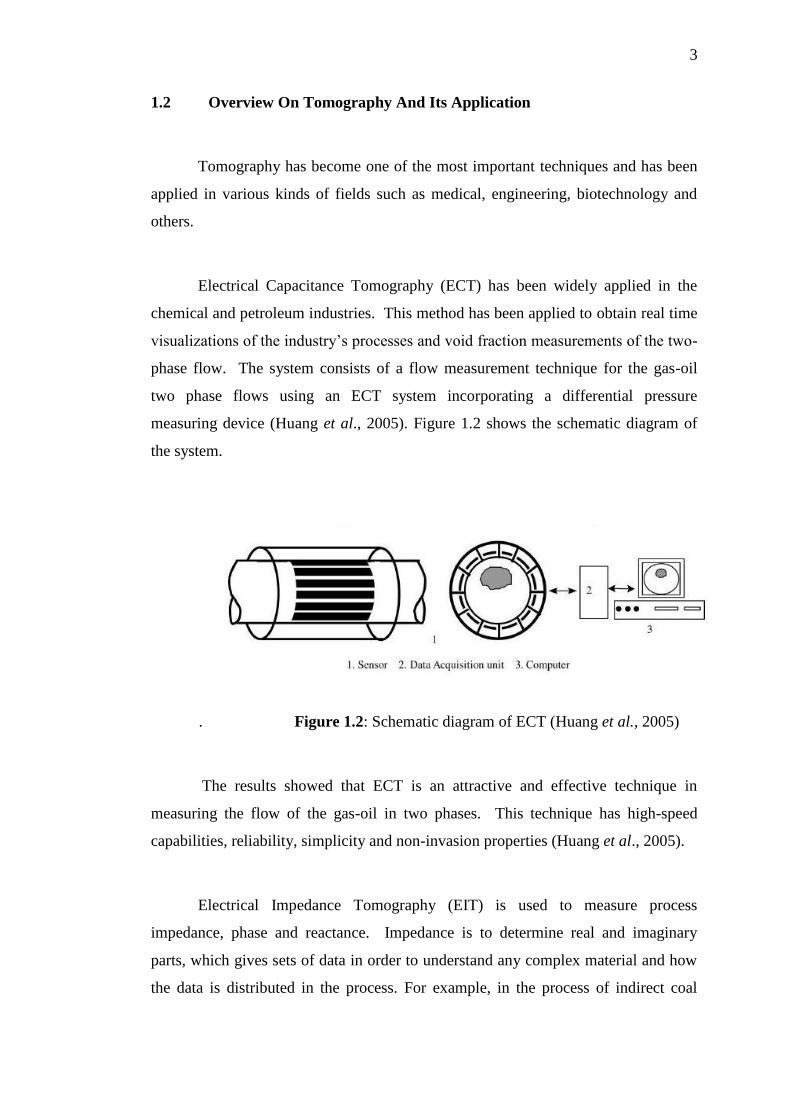
Electrical Capacitance Tomography (ECT) has been widely applied in the
chemical and petroleum industries. This method has been applied to obtain real time
visualizations of the industry‟s processes and void fraction measurements of the two-
phase flow. The system consists of a flow measurement technique for the gas-oil
two phase flows using an ECT system incorporating a differential pressure
measuring device (Huang et al., 2005). Figure 1.2 shows the schematic diagram of
the system.
. Figure 1.2: Schematic diagram of ECT (Huang et al., 2005)
The results showed that ECT is an attractive and effective technique in
measuring the flow of the gas-oil in two phases. This technique has high-speed
capabilities, reliability, simplicity and non-invasion properties (Huang et al., 2005).
Electrical Impedance Tomography (EIT) is used to measure process
impedance, phase and reactance. Impedance is to determine real and imaginary
parts, which gives sets of data in order to understand any complex material and how
the data is distributed in the process. For example, in the process of indirect coal
4
liquefaction where a reactive gas is bubbled through a slurry laden with catalysts, a
spatial non-uniform gas distribution can occur within the reactor. This situation can
reduce the process efficiency by inducing large-scale, buoyancy-driven re-circulating
flows. For this situation, techniques that are capable in measuring the distribution of
each phase in multiphase flows must be applied to improve the control of such
processes (Georgea et al., 2000).
The technique can be used for validating computational models of multiphase
flows. EIT is applied in a process where it can provide spatially resolved
information on dispersed multiphase flows. EIT methods are relatively mature and
able to measure spatial phase distributions accurately (Georgea et al., 2000).
Seismographic Tomography is used to interpret data and generate three
dimensional or two dimensional images of the internal parts of the Earth. There are
two energy sources for seismic tomography. One of them is from earthquakes.
When earthquakes happen, it will generate waves that can be picked up by a receiver
on the surface of the Earth. Geologists will be able to create images of the layers
where the waves pass through (Rawlinson et al., 2010).
Seismic Tomography will show the actual shapes of rocks in the Earth
because the waves‟ movements are different when it passes through different rocks.
Other sources are from the waves generated by geologists and its corresponding
reflections. This method can be applied to observe the desired area. The wave energy
produced can be tracked by its own reflection (Nolet, 1987).
Transmission and Emission Tomography is commonly used in the medical
field as a technique of obtaining the structure of the body as well as physiological
functions. However, this method has been accepted in other industries and acts as a
powerful tool for non-destructive testing. An emission tomography system has been
applied in nuclear power plants. Experiments have been carried out to stimulate the
scanning of irradiated nuclear fuel (Hutchinson et al., 1987).
5
Optical Tomography is one of the methods commonly used in industries. The
optical method has become a powerful tool for verification of materials in process
industry. In the micro electric field, great support has been given to the online
measurement of doping profiles of large scale productions so that the overall
equipment effectiveness can be increased (Zeni et al., 2000).
In this situation, a new technique has been introduced based on optical
tomography. Optical tomography is able to reconstruct the doping profiles of
semiconductor wafers, which begins with the reflected intensity measurement taken
at infrared wavelengths. The measurement of material characteristics is important to
improve the reliability of process simulators (Zeni et al., 2000)
1.3 Overview of Ultrasonic Wave
Ultrasonic wave is a description of waves that transport mechanical energy
through vibrations at the frequency of 20 kHz or more (Leighton, 2007). The
frequency of ultrasonic waves is above the range of a normal person‟s hearing
(Makar et al., 1999). The frequency commonly used for testing is about 20 kHz to
25MHz (Bindal, 1999).
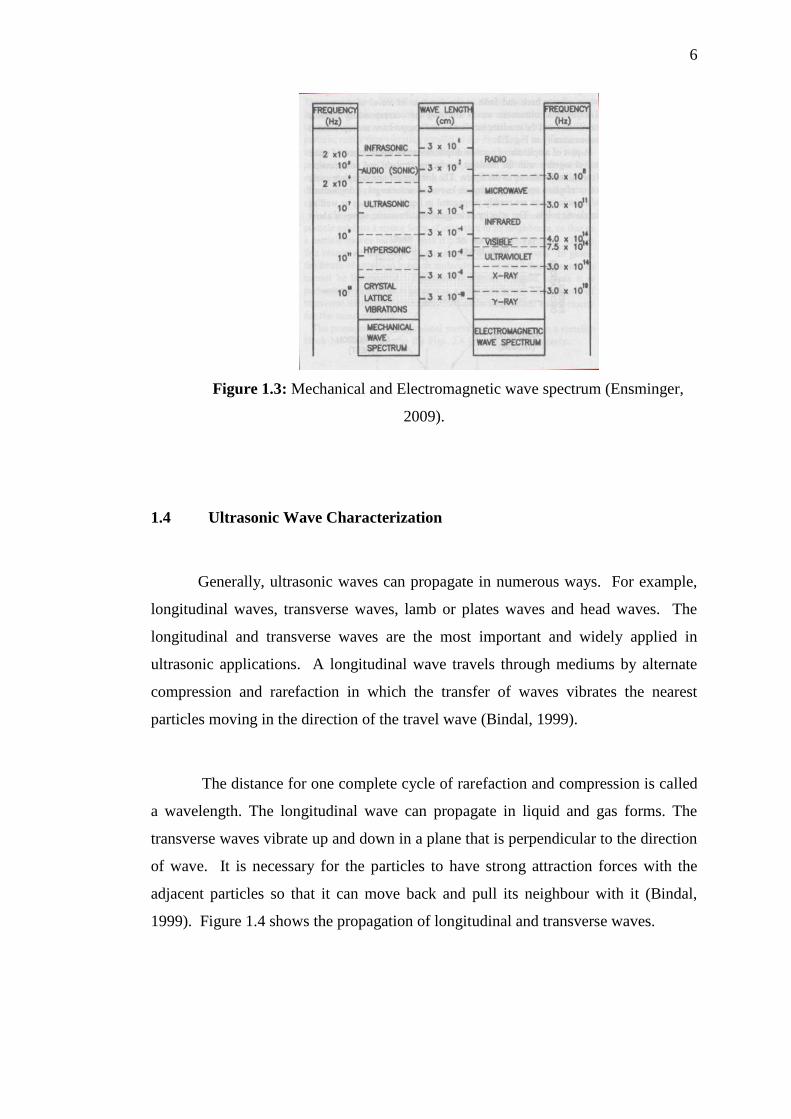
Ultrasonic waves are also known as stress waves and only exist in mass
media. It needs a medium to propagate. The signal transmits the energy to another
medium by direct contact between them. From this characteristic, ultrasonic sound is
different from light and radiation waves which can propagate through vacuum or
without medium (Ensminger, 2009). Figure 1.3 shows the location of ultrasonic
sound in the mechanical wave spectrum.
6
Figure 1.3: Mechanical and Electromagnetic wave spectrum (Ensminger,
2009).
1.4 Ultrasonic Wave Characterization
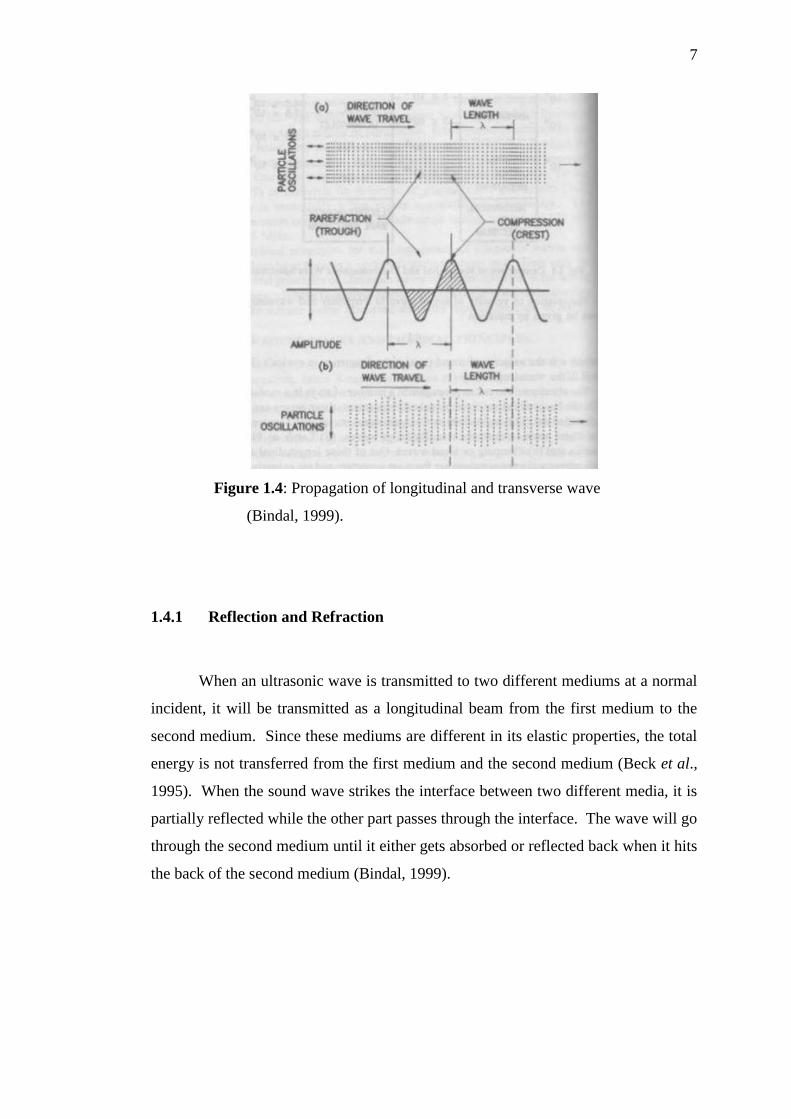
Generally, ultrasonic waves can propagate in numerous ways. For example,
longitudinal waves, transverse waves, lamb or plates waves and head waves. The
longitudinal and transverse waves are the most important and widely applied in
ultrasonic applications. A longitudinal wave travels through mediums by alternate
compression and rarefaction in which the transfer of waves vibrates the nearest
particles moving in the direction of the travel wave (Bindal, 1999).
The distance for one complete cycle of rarefaction and compression is called
a wavelength. The longitudinal wave can propagate in liquid and gas forms. The
transverse waves vibrate up and down in a plane that is perpendicular to the direction
of wave. It is necessary for the particles to have strong attraction forces with the
adjacent particles so that it can move back and pull its neighbour with it (Bindal,
1999). Figure 1.4 shows the propagation of longitudinal and transverse waves.
7
Figure 1.4: Propagation of longitudinal and transverse wave
(Bindal, 1999).
1.4.1 Reflection and Refraction
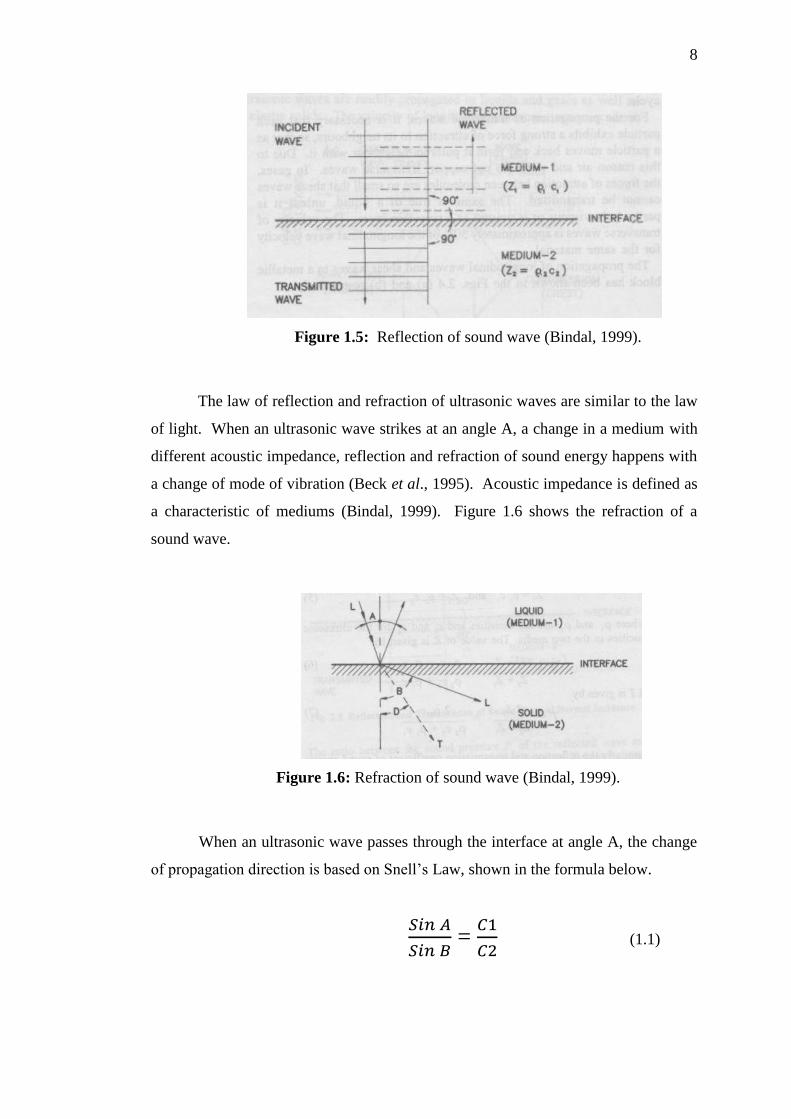
When an ultrasonic wave is transmitted to two different mediums at a normal
incident, it will be transmitted as a longitudinal beam from the first medium to the
second medium. Since these mediums are different in its elastic properties, the total
energy is not transferred from the first medium and the second medium (Beck et al.,
1995). When the sound wave strikes the interface between two different media, it is
partially reflected while the other part passes through the interface. The wave will go
through the second medium until it either gets absorbed or reflected back when it hits
the back of the second medium (Bindal, 1999).
8
Figure 1.5: Reflection of sound wave (Bindal, 1999).
The law of reflection and refraction of ultrasonic waves are similar to the law
of light. When an ultrasonic wave strikes at an angle A, a change in a medium with
different acoustic impedance, reflection and refraction of sound energy happens with
a change of mode of vibration (Beck et al., 1995). Acoustic impedance is defined as
a characteristic of mediums (Bindal, 1999). Figure 1.6 shows the refraction of a
sound wave.
Figure 1.6: Refraction of sound wave (Bindal, 1999).
When an ultrasonic wave passes through the interface at angle A, the change
of propagation direction is based on Snell‟s Law, shown in the formula below.
=
(1.1)
9
Where A is the angle of incidence meanwhile B is the refraction angle. C1
and C2 are the velocity of waves when it passes through two different mediums
(Bindal, 1999).
1.4.2 Diffraction
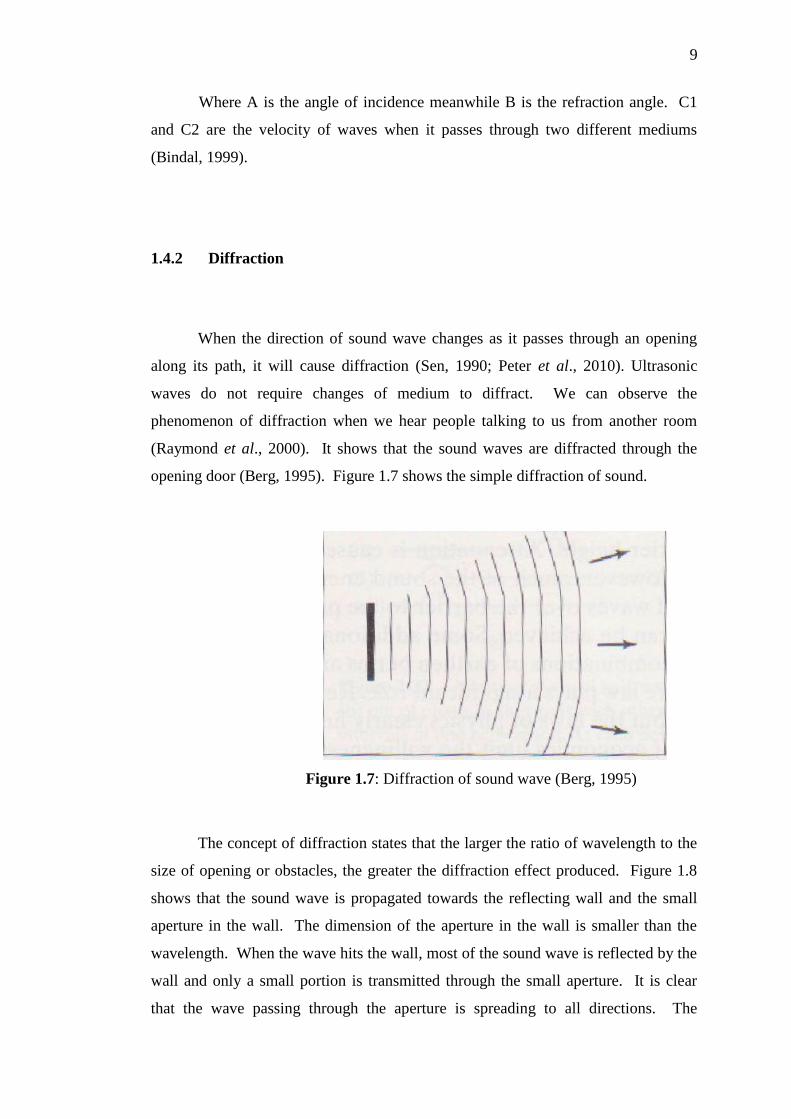
When the direction of sound wave changes as it passes through an opening
along its path, it will cause diffraction (Sen, 1990; Peter et al., 2010). Ultrasonic
waves do not require changes of medium to diffract. We can observe the
phenomenon of diffraction when we hear people talking to us from another room
(Raymond et al., 2000). It shows that the sound waves are diffracted through the
opening door (Berg, 1995). Figure 1.7 shows the simple diffraction of sound.
Figure 1.7: Diffraction of sound wave (Berg, 1995)
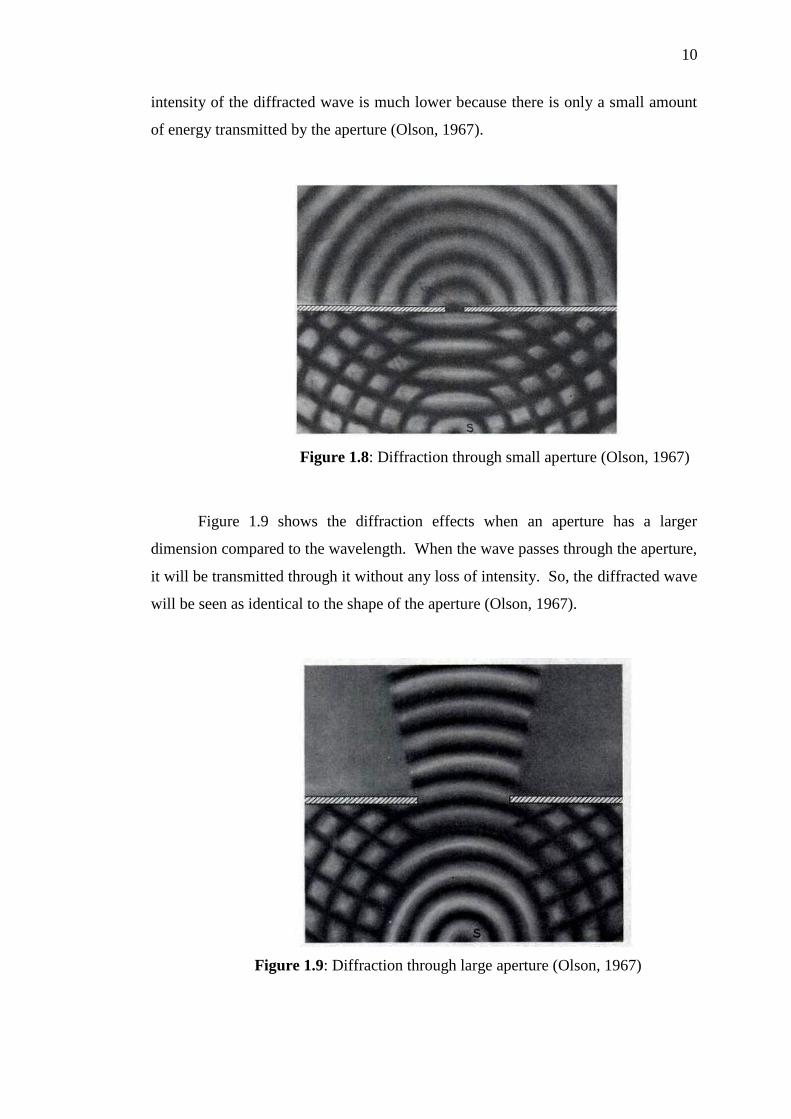
The concept of diffraction states that the larger the ratio of wavelength to the
size of opening or obstacles, the greater the diffraction effect produced. Figure 1.8
shows that the sound wave is propagated towards the reflecting wall and the small
aperture in the wall. The dimension of the aperture in the wall is smaller than the
wavelength. When the wave hits the wall, most of the sound wave is reflected by the
wall and only a small portion is transmitted through the small aperture. It is clear
that the wave passing through the aperture is spreading to all directions. The
10
intensity of the diffracted wave is much lower because there is only a small amount
of energy transmitted by the aperture (Olson, 1967).
Figure 1.8: Diffraction through small aperture (Olson, 1967)
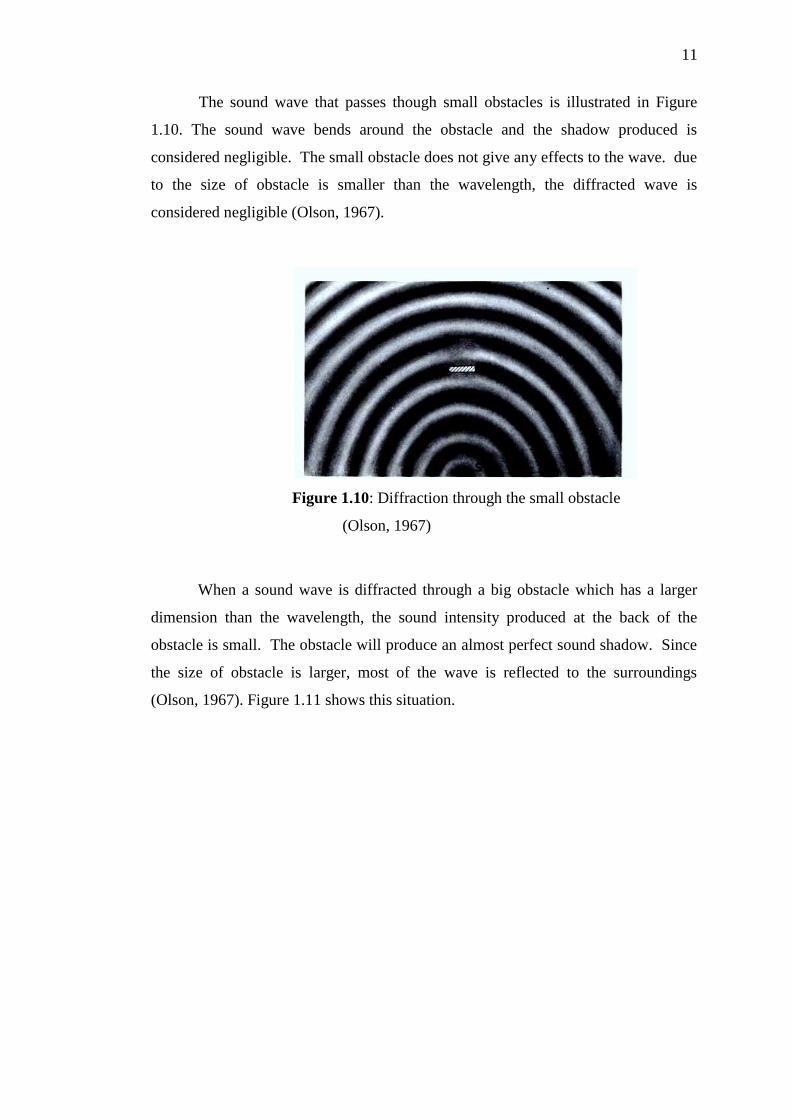
Figure 1.9 shows the diffraction effects when an aperture has a larger
dimension compared to the wavelength. When the wave passes through the aperture,
it will be transmitted through it without any loss of intensity. So, the diffracted wave
will be seen as identical to the shape of the aperture (Olson, 1967).
Figure 1.9: Diffraction through large aperture (Olson, 1967)
11
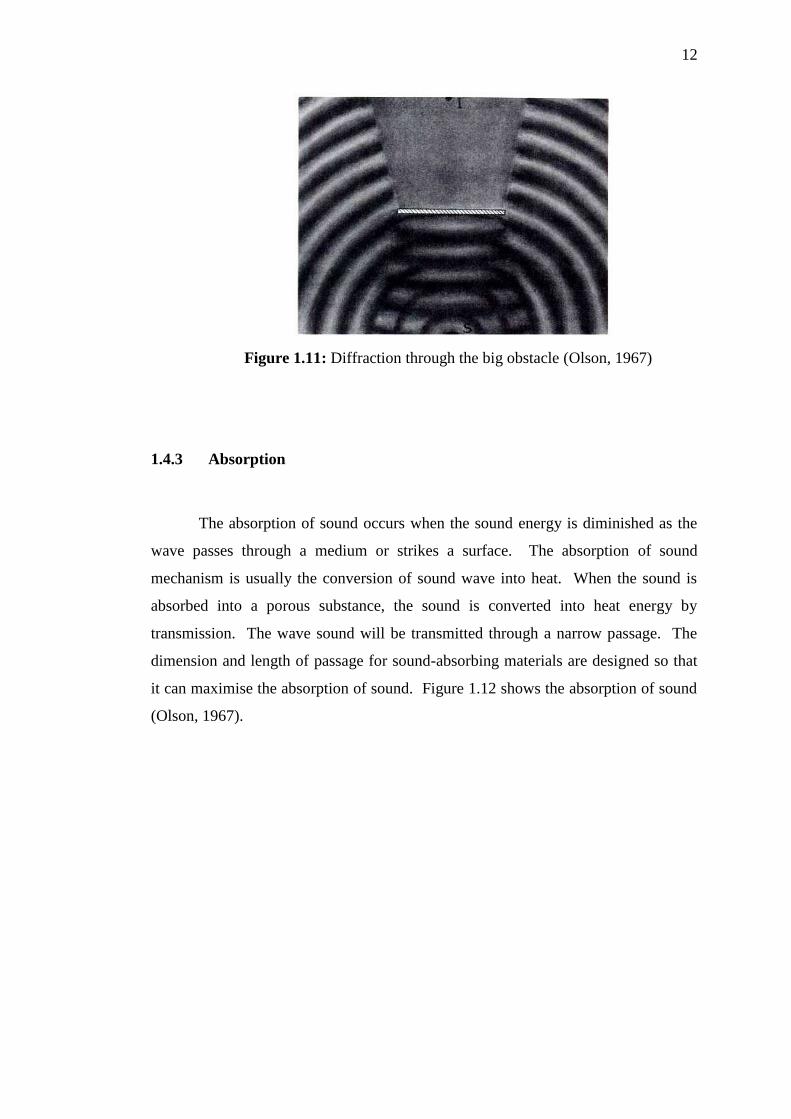
The sound wave that passes though small obstacles is illustrated in Figure
1.10. The sound wave bends around the obstacle and the shadow produced is
considered negligible. The small obstacle does not give any effects to the wave. due
to the size of obstacle is smaller than the wavelength, the diffracted wave is
considered negligible (Olson, 1967).
Figure 1.10: Diffraction through the small obstacle
(Olson, 1967)
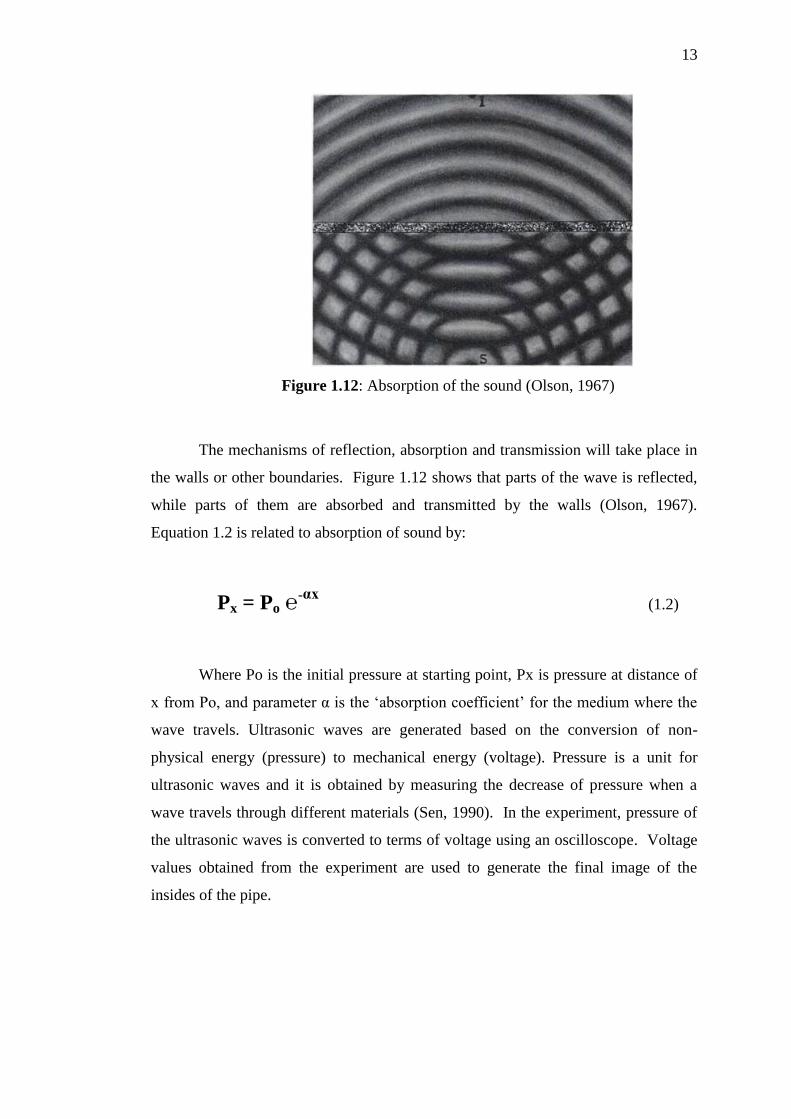
When a sound wave is diffracted through a big obstacle which has a larger
dimension than the wavelength, the sound intensity produced at the back of the
obstacle is small. The obstacle will produce an almost perfect sound shadow. Since
the size of obstacle is larger, most of the wave is reflected to the surroundings
(Olson, 1967). Figure 1.11 shows this situation.
12
Figure 1.11: Diffraction through the big obstacle (Olson, 1967)
1.4.3 Absorption
The absorption of sound occurs when the sound energy is diminished as the
wave passes through a medium or strikes a surface. The absorption of sound
mechanism is usually the conversion of sound wave into heat. When the sound is
absorbed into a porous substance, the sound is converted into heat energy by
transmission. The wave sound will be transmitted through a narrow passage. The
dimension and length of passage for sound-absorbing materials are designed so that
it can maximise the absorption of sound. Figure 1.12 shows the absorption of sound
(Olson, 1967).
13
Figure 1.12: Absorption of the sound (Olson, 1967)
The mechanisms of reflection, absorption and transmission will take place in
the walls or other boundaries. Figure 1.12 shows that parts of the wave is reflected,
while parts of them are absorbed and transmitted by the walls (Olson, 1967).
Equation 1.2 is related to absorption of sound by:
Px = Po ℮-αx (1.2)
Where Po is the initial pressure at starting point, Px is pressure at distance of
x from Po, and parameter α is the „absorption coefficient‟ for the medium where the
wave travels. Ultrasonic waves are generated based on the conversion of non-
physical energy (pressure) to mechanical energy (voltage). Pressure is a unit for
ultrasonic waves and it is obtained by measuring the decrease of pressure when a
wave travels through different materials (Sen, 1990). In the experiment, pressure of
the ultrasonic waves is converted to terms of voltage using an oscilloscope. Voltage
values obtained from the experiment are used to generate the final image of the
insides of the pipe.
14
1.5 General Overview Properties of Clay
Clay is formed from a natural composition of fine-grained minerals. It can
exist in plastic form when it has appropriate water content and can be hardened when
fired or dried. It is generally accepted that crystals make up the major content of clay
(Theng, 2012). Very fine clay such as smectite is resistant to water because at high
densities, compacted clay will exert water suction (Bergaya et al., 2011).
Clay materials have special properties, including cation exchange properties,
plastic behaviour when wet, catalytic abilities and low permeability. It is because
clay exists in the form of small size particles and has a unique structure (Theng,
2012). The conductivity and strain/stress properties of clay is different as compared
to soil sand due to its particle size and the electric charges that makes them interact
and hydrate with each other (Bergaya et al., 2011).
Clay mineral has been used widely in industries, such as coating on paper to
produce whiteness, in the tyre industry in order to prolong the life of rubber,
purification of oils and many other industrial processes. Montmorillonite clay is
commonly used as clay barriers for nuclear and chemical wastes. It is due to its
special properties which are cation-exchange capabilities, long term structural
stability, and low permeability (Theng, 2012).
15
1.6 Problem Statement
Most pipelines will experience deterioration in terms of integrity due to
natural causes, operating conditions and maintenance of the pipeline. This is due to
the irregularities present inside the pipe. The existence of irregularities inside the
pipe can contribute to pitting problems. There are several causes that may lead to the
formation of irregularities such as spillages of soldering flux inside the pipe during
welding processes. Improper joints and bends of pipes can also be the cause of
irregularities (Cantor, 2009).
Irregularities also can be formed due to high water velocities flowing inside
pipes which basically will scour the pipes‟ walls. This phenomenon will lead to the
formation of localised corrosion inside the pipe (Hayes, 2011). The corrosion can
affect the original physical properties of the pipeline. Corrosion at the internal
surface of pipelines can reduce the material‟s functions and the pipe‟s lifespan (Nuhi
et al., 2011).
Irregularities such as dents, scratches and bumps inside pipes will force fluids
to flow to other smooth surfaces and the fluid‟s velocity will be different from its
original velocity. This will cause a turbulence flow inside the pipe. The turbulence
flow of the fluid will affect the delivery rate of piping system and reduce the
production rate (Spellman, 2013).
Many ways have been taken to overcome this problem. For example, an
internal inspection device named the smart pipe inspection gauge (PIG) was
invented. However, the smart PIG is not suitable for all pipelines. Since most of the
gas pipeline consists of sharp bends, reduced port valves and loops, these conditions
will cause problems for the smart PIG‟s operational inspection. The smart PIG tends
to get stuck in the middle of the pipe during operation due to this problem. When the
smart PIG gets stuck, the whole operation must be shut-down and it will cost more
money for its cleaning process. (Meisner, 2006).
16
Ultrasonic is commonly used in the oil and gas industry for monitoring
irregularities inside the pipe. This technique is able to locate and visualise the
presence of irregularities inside the pipe (Mudali, 2006). Ultrasonic tomography is a
non-invasive technique. Non-invasive technique means that sensors are mounted
outside the pipe to be tested without making any changes to it, such as drilling a hole.
Ultrasonic tomography also does not interfere with the processes inside the pipe
during operation (Abdul Wahab, 2015).
1.7 Objective
The objectives of this research are:
1. To develop a tomographic instrumentation system for monitoring
irregularities based on ultrasonic sensors.
2. To detect the presence of irregularities in pipes using ultrasonic
tomography and to display the image of irregularities in two-dimension
images.
3. To detect the location of irregularities inside pipes based on the two-
dimension images obtained from the processed data from the Matlab
simulation
1.8 Scope of study
1. Study on the general concept and theory of tomography and its
mechanism.
2. Study on the properties and characteristics of ultrasonic wave and how it
travels from its sources and also its interactions with different materials.
3. Obtain experimental data based on the transmission mode of ultrasonic
tomography.
17
4. Obtain two-dimension images of corrosion inside different conditions,
such as clean and corroded pipes using the Matlab software.
1.9 Limitation of study
1. The system is limited to detect the presence of irregularities inside pipes.
It is unable to measure the type and degree of irregularities detected.
2. The images generated in the final result were 2-Dimensional.
3. The ultrasonic sensors are not able to detect very small irregularities.
REFERENCES
Abbaszadeh.J., H.A.Rahim, R.A.Rahim, S.Sarafi,M.N Ayob, M.Faramarzi (2013).
Design Procedure of Ultrasonic Tomography System with Steel Pipe
Conveyer. Sensors and Actuator. A 203 215-224.
Abdul Rahim, R., M.H. Fazalul Rahiman, K.S. Chan, S.W. Nawawi ( 2007). Non-
invasive imaging of liquid/gas flow using ultrasonic transmission-mode
tomography. Sensors and Actuators. A 135 (2007) 337–345.
Berg, R E. and D.G. Stork (1995). The Physics of Sound (3rd
ed). Prentice Hall
Bindal,V.N. (1999). Transducers For Ultrasonic Flaw Detection. National Physical
Laboratory.
Bucur,V. (2003). Nondestructive Characterization and Imaging of Wood. Springer.
Science & Business Media.
Beck.M.S., Williams.(1995). Process Tomography: Principles, Techniques and
Applications.(1st ed). Butterworth-Heinemann.
Bergaya,F.,B.K.G Theng.,G.Lagaly (2011). Handbook of Clay Science.
Elsevier.Cantor,A.F.(2009). Water Distribution System Monitoring: A
Practice Approach for Evaluating Drinking Water Quality. CRC Press.
Chen.J, Y., Shi., S,Shi.(1998). Noise analysis of digital ultrasonic system and
elimination of pulse noise. International Journal of Pressure Vessels and
Piping 75 (1998) 887–890.
Fazalul Rahiman, M.H., R. Abdul Rahim., Z. Zakaria (2008). Design and modelling
of ultrasonic tomography for two-component high-acoustic impedance
mixture. Sensors and Actuators. A 147 (2008) 409–414.
Dickin, F.J. and B.S. Hoyle (1992). Tomographic Imaging Of Industrial Process
Equipment Techniques And Applications. IEE Proceedings-G, Vol. 139,
No.I .
Ensminger,D. (2009). Ultrasonic Fundamentals , Technology And Applications.(3rd
ed). Taylor and Francis.
105
Georgea,D.L., J.R. Torczynskia., K.A. Shollenbergera, T.J. O'herna,S.L. Ceccio
(2000). Validation Of Electrical-Impedance Tomography For Measurements
Of Material Distribution In Two-Phase Flows. International Journal Of
Multiphase Flow. 26 549-581.
Grangeat.P.( 2013). Tomography. John Wiley & Sons.
Hayes,C.(2012). Internal Corrosion Control of Water Supply Systems: Code of
Practice Code of Practice. IWA Publishing.
Hutchinson, I.G. And J. Huddleston (1986). Applications Of Emission Tomography
In The Nuclear Industry, Nuclear Instruments And Methods In Physics
Research. 242 615-619.
Huang, Z., D.Xie, H.Zhang, H. Li (2005). Gas–Oil Two-Phase Flow Measurement
Using An Electrical Capacitance Tomography System And A Venturi Meter.
Flow Measurement And Instrumentation. 16 177–182.
Ismail,I., J.C. Gamio, S.F.A. Bukharia. and W.Q. Yang (2005). Tomography for
multi-phase flow measurement in the oil industry. Flow Measurement and
Instrumentation. 16 145–155.
Laugier.P., Guillaume.H.(2010). Bone Quantitative Ultrasound, Springer Science &
Business Media.
Lee, J.R., H. Jeong, C.C Ciang (2010). Application Of Ultrasonic Wave Propagation
Imaging Method To Automatic Damage Visualization Of Nuclear Power
Plant Pipeline. Nuclear Engineering And Design. Ned-5871.
Leighton. T. G. (2007). What Is Ultrasound?. Progress In Biophysics And Molecular
Biology 93 3–83.
Lovstad, A., Peter Cawley (2011). The Reflection Of The Fundamental Torsional
Guided Wave From Multiple Circular Holes In Pipes. NDT &E
International. 44 553–562.
Makar, J. M. Chagnon, N.(1999). Inspecting systems for leaks, pits, and Corrosion.
American Water Works Association. v. 91, no. 7, pp. 36-46.
Martin.J., K.J. Broughton, A. Giannopolous, M.S.A. Hardy, M.C. Forde. (2001).
Ultrasonic tomography of grouted duct post-tensioned reinforced concrete
bridge beams. NDT&E International. 34 107–113.
Meisner, T.O., Leffler.W. (2006 ). Oil And Gas Pipeline In Nontechnical
Language.PennWell Corporation.
106
Mouritz, A.P. , C. Townsend and M.Z. Shah Khan (2000). Non-Destructive
Detection Of Fatigue Damage In Thick Composites By Pulse-Echo
Ultrasonic. Composites Science And Technology. 60 23-32.
Mudali, U.K., C.B. Rao,and B. Raj (2006). Intergranular Corrosion Damage
Evaluation Through Laser Scattering Technique. Corrosion Science. 48 783–
796.
Nolet.G. (1987). Seismic Tomography: With Applications In Global Seismology And
Exploration Geophysics. D Reidel Publishing Company.
Nuhia,M., T. Abu Seerb, A. M. Al Tamimia, M. Modarres, A. Seibib (2011).
Reliability Analysis For Degradation Effects Of Pitting Corrosion In Carbon
Steel Pipes. Procedia Engineering. 10 1930–1935.
Ozolinsh,I., I.Pavelko, V. Pavelko, M.Wevers, and H.Pfeiffer (2007). Some Results
Of Ultrasonic Detection Of Uniform Corrosion In Thin Al2024-T3 Sheets. Eu
Project Meeting On Aircraft Integrated Structural Health Assessment
(Aisha), Leuven, Belgium.
Olson .H.F ( 1967). Music, physics and engineering (2nd
ed). Courier
DoverPublications.
Ono,Y., J.F Moisan, and C.Kuei ( 2003). Ultrasonic Technique For Imaging And
Measurement In Molten Aluminium, IEEE Transaction Of Ultrasonic,
Ferroelectric, And Frequency Control. Vol.50, N0. 12.
Parker, D.J., M.R Hawkesworth , T.D Beynon (1995). Process Of Application Of
Emmision Tomography. The Chemical Engineering Journal. 56 109-117 .
Peter,R.H., Kevin, M., Abigail,T. (2010). Diagnostic Ultrasound: Physics and
Equipment.(2nd
ed). Cambridge University Press.
Qidwai, U.A. (2009). Autonomous Corrosion Detection In Gas Pipelines: A Hybrid-
Fuzzy Classifier Approach Using Ultrasonic Nondestructive Evaluation
Protocols. IEEE Transaction On Ultrasonic, Ferroelectric And Frequency
Control. Vol.56, No.12.
Raymond, D. Berendt, Edith L. R. Corliss, Morris Ojalvo. (2000). Quieting: A
Practical Guide to Noise Control. The Minerva Group, Inc.
Rathod,V.T. and D.R. Mahapatra (2011). Ultrasonic Lamb Wave Based Monitoring
Of Corrosion Type Of Damage In Plate Using A Circular Array Of
Piezoelectric Transducers. Ndt&E International. 44 628–636.
107
Rahiman, H.F., R.A Rahim, And M. Tajjudin (2006). Ultrasonic Transmission-Mode
Tomography Imaging For Liquid/Gas Two-Phase Flow. IEEE Sensors
Journal. Vol. 6, No. 6.
Rahiman, M.H.F., R.A.Rahim, H.A.Rahim, E.J.Mohamad, Z.Zakariaa, S.Z.M. Muji.
(2014). An Investigation on Chemical Bubble Column Using Ultrasonic
Tomography For Imaging of Gas Profiles. Sensors and Actuators. 202 (2014)
46–52.
Rawlinson,N., S. Pozgay, S. Fishwick (2010). Seismic Tomography: A Window Into
Deep Earth. Physics Of The Earth And Planetary Interiors. 178 101–135.
Raisutis, R., R. Kazys, E.Zukauskas, L.Mazeika, and Alfonsas Vladisauskas (2010).
Application Of Ultrasonic Guided Waves For Non-Destructive Testing Of
Defective CFRP Rods With Multiple Delaminations. NDT&E Internationa,l
43 416–424.
Rose,J.L (2000). Guided Wave Nuances for Ultrasonic Nondestructive Evaluation.
IEEE transactions on ultrasonics, ferroelectrics, and frequency control, vol.
47, no. 3.
Saffar.S., A.Abdullah. R.Othman (2014). Influence of the Thickness of Matching
Layers on Narrow Band Transmitter Ultrasonic Airborne Transducers with
Frequencies <100kHz:Application of a genetic algorithm. Applied Acoustics.
75 (2014) 72–85
Sen,S.N (1990). Acoustics, Waves and Oscillations. New Age International.
Stocksley,M.( 2001) Abdominal Ultrasound. Cambridge University Press.
Schlaberg,H.I., M. Yang ,B.S. Hoyle, M.S. Beck, C Lenn.(1997). Wide-angle
transducers for real-time ultrasonic process tomography imaging applications.
Ultrasonics, 35 (1997) 213-221.
Theng.B.K.G.(2012). Formation and Properties of Clay-Polymer Complexes (4th
Ed). Elsevier.
Tole,N.M. (2005) Basic Physics of Ultrasonographic Imaging. World Health
Organization.
Wang, X.J., P.Tse, C.Mechefske, and M. Hua (2010). Experimental Investigation
Of Reflection In Guided Wave-Based Inspection For The Characterization Of
Pipeline Defect. NDT&E International, 43 365–374.
108
Yun, X., D. Bo, T. Xiaoping, S.Sha ( 2010 ). Ultrasonic In-Line Inspection Of
Pipeline Corrosion Based On Support Vector Machine Multi-Classifier.
Proceeding Of The 29th Chinese Control Conferences.
Zeni,L., R.Bernini, and R.Pierri (2000). Optical Tomography For Dielectric
Profiling In Processing Electronic Materials. Chemical Engineering Journal.
77 137–142.


