Dept. for Speech, Music and Hearing Quarterly Progress and Status Report Toward a better vocal tract model Wakita, H. and Fant, G. journal: STL-QPSR volume: 19 number: 1 year: 1978 pages: 009-029 http://www.speech.kth.se/qpsr
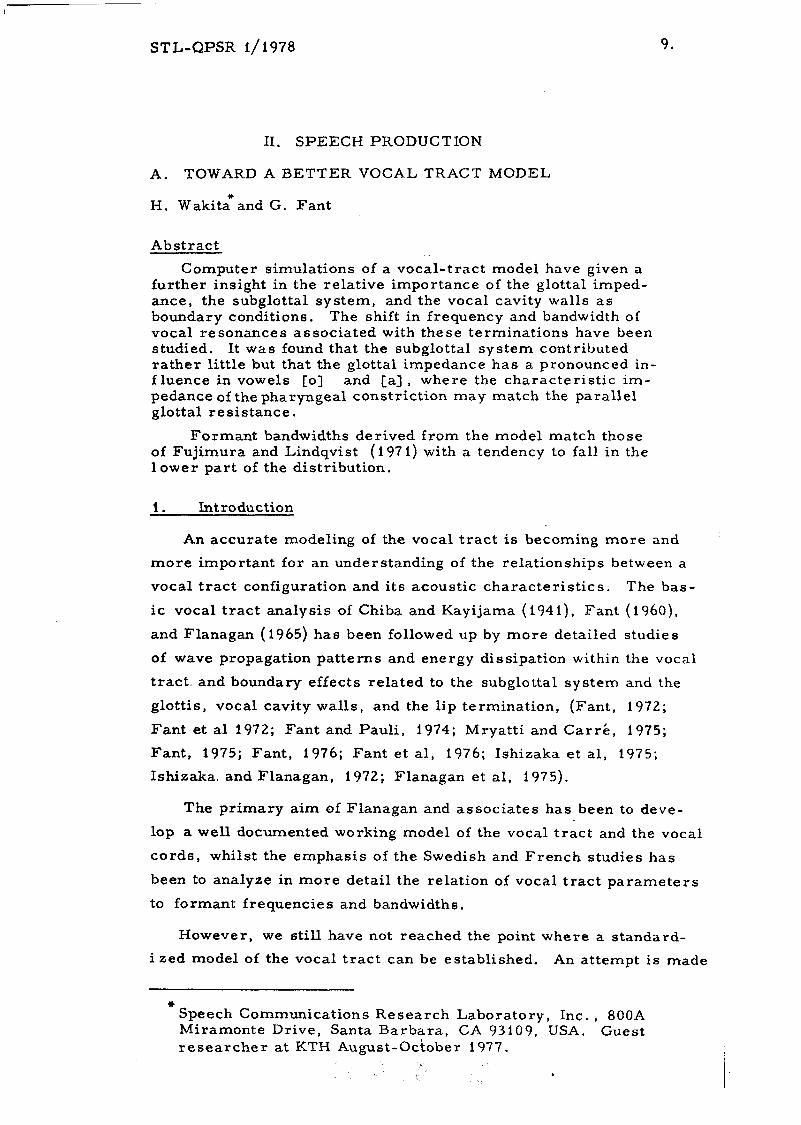
Computer simulations of a vocal-tract model have given a further insight in the relative importance of the glottal imped- ance, the subglottal system, and the vocal cavity walls a s boundary conditions. The shift in frequency and bandwidth of vocal resonances associated with these terminations have been studied. It was found that the subglottal system contributed rather little but that the glottal impedance has a pronounced in- f luence in vowels [o] and [a] , where the characteristic im- pedance of the pharyngeal constriction may match the parallel glottal resistance.
Formant bandwidths derived from the model match those of Fujimura and Lindqvist (1 97 1) with a tendency to fall in the 1 ower part of the distribution.
I. Introduction
An accurate modeling of the vocal t ract is becoming more and
more important for an understanding of the relationships between a
vocal t ract configuration and i ts acoustic characteristics. The bas-
ic vocal t ract analysis of Chiba and Kayijama ( 194 I), Fant ( 1960),
and Flanagan (1965) has been followed up by more detailed studies
of wave propagation patterns and energy dissipation within the vocal
tract. and boundary effects related to the subglottal system and the
glottis, vocal cavity walls, and the lip termination, (Fant, 1972;
Fant et a1 1972; Fant and Pauli, 1974; Mryatti and Carrk, 1975;
Fant, 1975; Fant, 1976; Fant et al , 1976; Ishizaka et al , 1975;
Ishizaka. and Flanagan, 1972; Flanagan et al, 1975).
The primary aim of Flanagan and associates has been to deve-
lop a well documented working model of the vocal t ract and the vocal
cords, whilst the emphasis of the Swedish and French studies has
been to analyze in more detail the relation of vocal tract parameters
to formant frequencies and bandwidths.
However, we still have not reached the point where a standard-
i zed model of the vocal t ract can be established. An attempt is made
Y Speech Communications Research Laboratory, Inc. , 800A Miramonte Drive, Santa Barbara, CA 93109, USA. Guest researcher a t KTH ~ u ~ u s t - 0 c t o b e r 1977.
STL-QPSR 1/1978
i n this paper to evaluate some of the proposed parameter values
t o be used in a vocal t r ac t model and to obtain some insight for
developing an improved model.
A distributed element transmission line representation has
been widely used for modeling the vocal t rac t . The choice of com-
ponent values, however, is not consistent among u s e r s , and the
values which represent the best choices have remained undete r-
mined. More investigations will be needed to establish a reliable
standardized model, which will be important for making fair com-
parisons of different studies in the a r e a s of phonetics, speech a -
nalysis, and speech synthesis. In the following we discuss the
problems involved in choosing some of the parameter values in
the model.
2 . Vocal t r ac t model - 2. I Vocal t r ac t -
In this model, the vocal t r ac t is represented by a finite number
of t ransmission line elements. The typical s t ructure i s given in
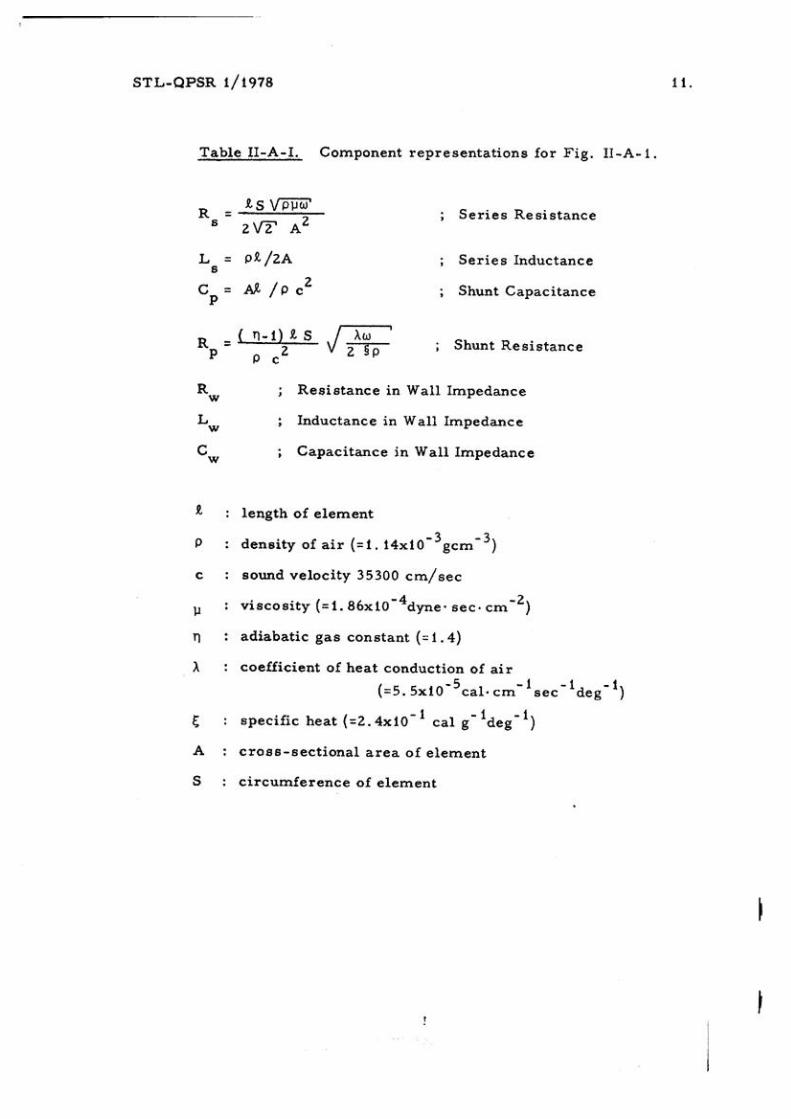
Fig. 11-A- i . The physical definitions of the circuit components a r e
given in Table 11-A-I. The values for the s e r i e s inductance L and S
shunt capacitance C depend in the usual way on the dimensions of P
the tube and the physical propert ies of a i r , a s shown in Table 11-A-I.
The components of the wall impedance a r e not easily related to in-
trinsic physical propert ies of the wall, which a r e not yet well under-
stood, and so these elements must be assigned values on the basis
of a match to experimental data. Note that the se r i e s and shunt re -
s is tances, RS and R depend on the circumference S of the c o r r e s - P '
ponding cross-sect ional a r e a of the vocal t r ac t .
A problem a r i s e s when i t comes to choosing a value of the c i r -
cumference for evaluating these resis tances. The corresponding
acoustic tube element is sometimes assumed to be c i rcu lar , leading
to a value of 2 ( n A) 'I2 for the circumference. Fant has suggested
the doubling of this value to S = 4 (s A) i /2 (Fant , 1 960), whif h would
apply exactly to a hard-walled surface of elliptic shape with a width
b height ratio of 9 o r to a l e s s extreme shape factor and a somewhat
Fig. 11-A- I . A T-type network representation of an element in the transmission line analog of the vocal tract. (Parameters are listed in Table 11-A-I. )
-
STL-QPSR 1/1978
larger surface friction. This compromize appears reasonable and
i s . adopted for the circumference in our present model. In a
more detailed modeling, a different conversion from a cross- sec-
tional area to i t s circumference could be used depending upon the
location of the elenlent along the vocal t ract . However, more ana-
tomical and acoustical measurements would be needed to motivate
such a refinement.
There a r e so f a r no agreed-upon values for the components
of the wall impedance. Ishizaka, French, and Flanagan ( 1 975)
have measured the mechanical impedance of the cheek under re-
laxed and tensed conditions and also of the neck. Fant et al (1976)
have computed the wall impedance on the basis of measurements of
the resonance characteristics of the vocal tract under the closed
tract condition and have proposed the possibility of using a lumped
wall impedance which i s independent of vocal tract configurations.
The choice of the wall impedance values used for our present model
i s discussed in Section 3.
2 . 2 Lip radiation impedance
The lip radiation impedance i s generally approximated by the
radiation impedance Z of a vibrating piston set in an infinite baffle, P
and is represented by
where k = w /c, a is the piston radius, A the piston area , ~ ~ ( x )
t h e Bessel function of the f i rs t kind, and Sl(x) is the first order
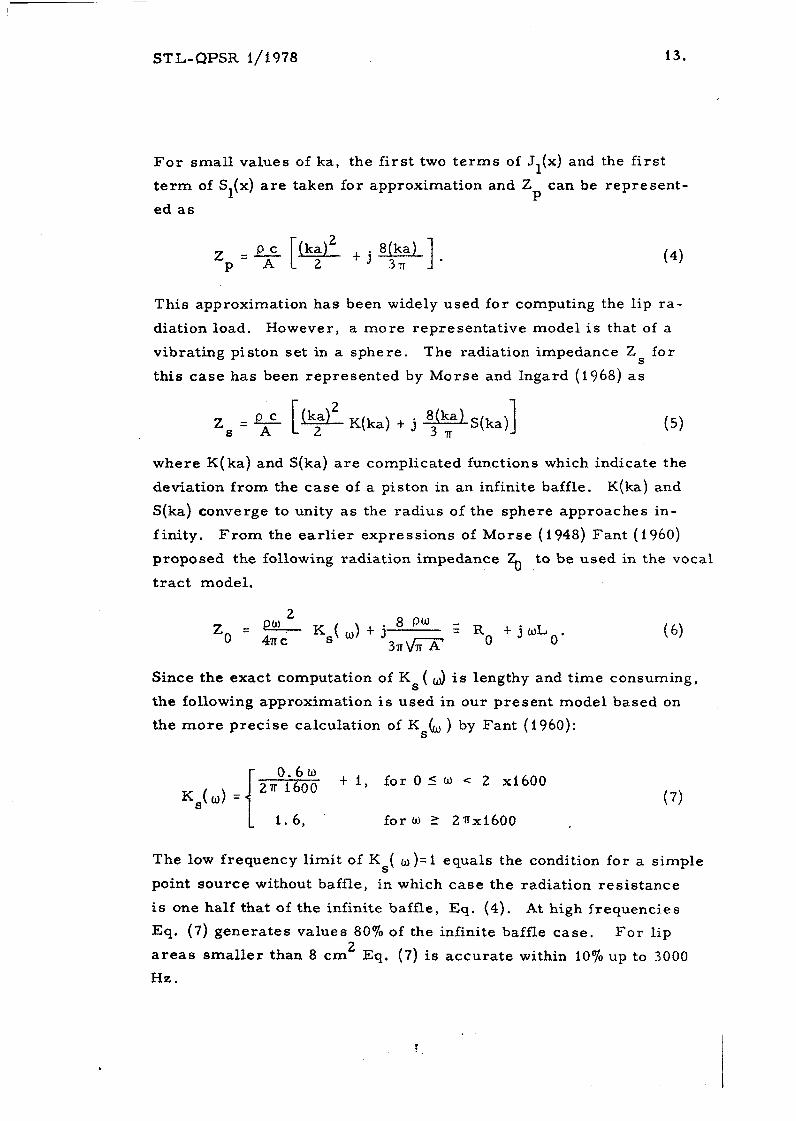
Fo r small values of ka, the f irst two terms of J ~ ( X ) and the first
t e rm of S (x) a r e taken for approximation and Z can be represent- 1 P
ed a s
This approximation has been widely used for computing the lip ra-
diation load. However, a more representative model i s that of a
vibrating piston set in a sphere. The radiation impedance Zs for
this case has been represented by Morse and Ingard (1968) a s
where K(ka) and S(ka) a r e complicated functions which indicate the
deviation from the case of a piston in an infinite baffle. K(ka) and
S(ka) converge to unity a s the radius of the sphere approaches in-
f inity. From the earl ier expressions of Morse (1948) Fant ( 1 960)
proposed the following radiation impedance % t o be used in the vocal
t ract model.
*
Since the exact computation of Ks ( o) i s lengthy and time consuming,
the following approximation i s used in our present model based on
the more precise calculation of K ~ C ) by Fant (1960):
+ 1, for 0 I w .= 2 xi600 K s ( o ) =
L 1.6, for w L 2nxi600
The low frequency limit of K ( w)=l equals the condition for a simple S
point source without baffle, in which case the radiation resistance
i s one half that of the infinite baffle, Eq. (4). At high frequencies
Eq. (7) generates values 80'70 of the infinite baffle case. For lip 2 areas smaller than 8 cm Eq, (7) i s accurate within 10% up to 3000
Hz.
STL-QPSR 1/1978
Eq. (7) has been experimentally validated by model experiments,
Fant (1960), Appendix and Fant (1975). F o r calculations of sound
p res su re levels in the radiated field the directivity en ters a s an
additional factor. The combined effect of directivity a t normal in-
cidence and the K (w ) factor is an increase of approx. 6 dB from s
300 Hz to 5000 Hz, see Fant (1960), p. 44. More accurate es t i -
ma tes of Ks(w) would have to be derived from careful experiments
on human speech production.
2. 3 Subglottal system
The subglottal system of Fig. 11-A-2 was adopted. It i s s imilar
to the one proposed by Fant, Ishizaka, Lindqvist, and Sundberg ( 1972).
It consis ts of a glottal impedance, a t racheal tube with a tracheal
wall impedance, and a lung termination.
The input impedance to the subglottal model, a s seen from below
the vocal cords , has resonance frequencies (poles) a t 600, 1350, and
21 60 Hz with bandwidths of 240, 180, and 190 Hz, respectively.
The glottal impedance c u r rently used, e . g. , by Flanagan ( 196 5).
Flanagan e t a1 (1975) s tems f rom the measurements of van den Berg
et a1 (1957). F o r a stationary .flow they found
The constant k of their model was 0.875. Ps is the subglottal p res -
s u r e , U =A v is the flow, v the particle velocity, and A the con- g g g g g
stant a r e a of the model glottis with length 1 and thickness d (axially g
in the flow direction) andv is the constant of viscosity. F o r glottal
openings l a rge r than 1/5 of the value in voicing the viscosity t e r m is
small compared to the f i r s t "kinetic" t e r m which accounts for the
turbulence los ses (Flanagan 1965 ). In a small signal analysis, deal- N -
ing with a differential flow U = v . A superimposed on the mean flow g g g
U =: v - A and neglecting viscosity, we find g g g
p: air danslty, C: sourid velocity, d : vocal cord thickness, Ag Ct) : glottis area.
aP: transglottal pressure, vt alr volume velocity through glottis.
Fig. 11-A- 2. A netuvo rk representation of the subglottal system.
- STL-QPSR 1/1978
The mean particle velocity
i s approximately constant over the main part of the glottal opening.
The differential resistance R i s twice the flow resistance which g
follows from the second power proportionality of subglottal pressure
with respect to the DC flow, Eq. (8).
This i s a rather crude analysis and more exact insight is needed
in the basic aerodynamic conditions including end correction effects.
We have adopted a glottal impedance according to Eq. ' (9) with
k= 1 and d=0.5 cm to conform with the Fant et a1 ( 1972) studies. In Fla-
nagan' s et a1 (.I 975) model k=0.87 5 and d= 0 . 3 cm divided on the two
mass parts. The thickness apparently varies according to anatomy
and voice register. van den Berg et a1 (1 957) used a value of d=O. 32
crn for their model.
The glottal impedance is usually high compared to the input im-
pedance to the sub- and supraglottal cavity systems. For simplified
calculations i t is thus convenient to transform the glottal impedance
to an equivalent resistance and inductance in parallel
I terminating the vocal tract. The inductance L accounts for a posi- g
tive shift in Fi during the open phase and R' determines a glottal g
bandwidth component B . F o r the single tube resonator of area A g
and length 1 (volume V=l . A),
For a Helmholtz resonator with volume V
which i s one half that of the single tube case.
-
STL-QPSR 1/1978
where VG and IG a r e the voltage and cur rent at the glottis, respec-
tively, Z the radiation impedance, IO the cur rent a t the l ips , and 0
the A . . the elements of the F -matr ix for the total vocal t rac t . Thus, 1J
the cur rent t ransfer function i s given by:
The simulation program was designed so that the evaluation could be
accomplished under various los s and boundary conditions.
3 . On wall impedance
3 . 1 Formant frequencies and bandwidths for various wall impedance values
Fant, Nord and Branderud (1976) measured the distribution of vib-
rational amplitudes on the walls of the neck and face, and suggested a
non-uniform distribution of the equivalent distributed m a s s -loading
independent of vowel articulation. Their measurements indicated a
maximum amplitude at the level of the larynx and another somewhat
weaker maximum at the closed l ips . Based on this finding, they
made measurements of input impedance through a tube held between
the l ips with the tongue either raised to make a closed mouth cavity
o r flat in the mouth to allow a full coupling to the pharynx. Also, the
f i r s t resonance frequency and i t s bandwidth for the closed vocal t rac t
were measured directly. F r o m these measurements , anter ior and
poster ior pa r t s of the m a s s load were estimated together with the vo-
lumes of the front and back par t s of the vocal t r ac t . The resulting
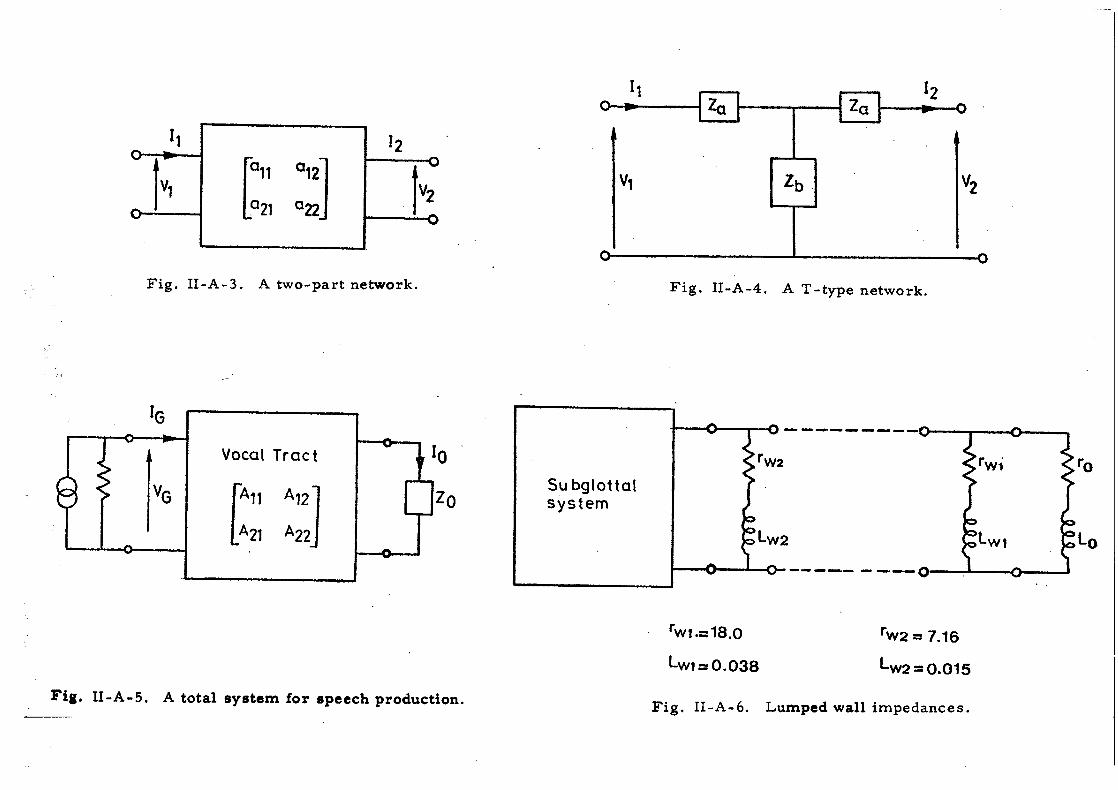
values were then used f o r two wall impedances placed at the front
and the back ends of the vocal t rac t model a s i l lustrated in Fig. 11-A-6
to se rve a s an alternative to the distributed wall impedance shown in
Fig. 11-A-1.
Fig. 11-A-3. A two-part network.
Vocal Tract
Fig. 11-A-5. A total system for speech production.
Fig. 11-A-4. A T-type network.
Su bglot tal s y s t e m
Fig. 11-A- 6 . Lumped wall impedances.
STL-QPSR 1/1978
To t e s t the validity of the simplified approach, the a r e a functions
for five Russian vowels (Fant. 1960) were used in the model discussed
in the previous section. In this case , the shunt a r m representing the
distributed wall impedance in each section of the vocal t rac t in Fig.
11-A-I was eliminated and the two lumped wall impedances were in-
ser ted a s i l lustrated in Fig. 11-A-6.
The f i r s t three formant frequencies and bandwidths computed in
this way a r e given in column B of Table 11-A-11, together with the va-
lues for the rigid wall (without wall impedance) (column A ) . To eva-
luate this result , formant frequency and bandwidths were also com-
puted by using the other wall impedance values measured by Ishizaka,
French and Flanagan (1975). Ishizaka et a1 made d i rec t measurements
of the vocal t r ac t wall impedance of the cheek and the neck. Especial-
ly for the cheek, they measured the impedance under different condi-
tions, i. e . tensed and relaxed conditions. The per-uni t -area values - 2 - 2 - 1
of their wall impedance a r e Lw = 2 . 1 gcrn and Rw = 800 gcrn sec - 2 - 2 - 1
fo r the relaxed cheek, Lw = 1 . 5 gcrn and Rw = 1060 gcrn sec for - 2 - 2 -1 the tensed cheek, and Lw = 2 . 4 gcrn and Rw = 2320 gcrn sec for
-2 -2 - 1 the neck. A value of Lw = 1 . 5 gcrn and Rw = 1600 gcrn sec appears
to have been used for synthesis by Flanagan e t a1 (1975). Because i t i s
ha rd to s a y which of these se ts of values i s most appropriate for the
walls of the vocal t rac t , we did one se r i e s of simulations using each
se t of values.
The values were used to compute the f i r s t three formant frequen-
c i e s and bandwidths for the same five vocal t rac t shapes used for the
lumped wall impedances. In this case , the wall impedance was dis t r i -
buted along the vocal t rac t using the network element in Fig. 11-A-1,
but without the condenser in the wall impedance shunt a r m since this
condenser has virtually no effect on the resulting resonances of the
model. The resul ts of these computations a r e given in columns C , D,
and E of Table 11-A-11. In comparing the resul ts using the lumped i m -
pedances with those using the distributed impedances, it i s seen that
reasonable formant values a r e obtained f o r the vowels / i / , / e / , and /u/ .
STL-QPSR 1/1978
Table 11-A-11. Formant frequencies and bandwidths for various values of wall impedance. A: rigid wall; B: Fant e t a1 lumped wall impedance; C: Ishizaka- Flanagan relaxed cheek; D: Ishizaka-Flanagan tensed cheek; E: Ishizaka-Flanagan neck.
2 3 Uniform tube: length=17 cm. Ai=5 . 75 c m , number of sections=30.
h
S * o o b N m * N N N l n N
( r 9 6 0 ' m e d N N N V ) N
h
I4
(7
O ' N r - a m - N 9 r n N L n C C )
O \ N ~ - 0 3 9 4 N 9 r n N n l *
n
W
r3
o Q * m s N Q ) N N
O r - + m r - m b N 9 W N C O N N
I4
Q
d
c 0 Q N 0 ' N Q N + N + M ~
Q 0 0 ' 9 b O ~ N N N ~ N
* o l c * a o d + 4 + d +
N V I + . . - ( * c o 9 W Q N 9 0 N * S L n N l n
# O ' b O O + O c o ~ , + m ~ ~ N T ~ ' Q L C I N L ~
d ' O 9 b l c m - l b L C I a N b - 4 N T l ' S r n N Y ,
C P N O \ V I O O - c o a m r - e , N W F r n N l n
V
m
A
P v
+ Gc
6 d 1 n l n 4 0 \ ~ a r n ~ ~ r n
N 1 0 0 0 d ' d m a e m N +
u ' ~ r n * O \ O N 9 * N - + *
* * o + - ' + m m o o ~ ~ r - m m o m s * N d +
a 0 0 0 C O 0 ' ~ ~ m m o o s m t - m m o a a 2 N - + *
V I t n N C C ) - + + F r ) O \ C O 9 N b ~ o \ O O O S - $ N + +
d N - $ S m S d z - r n F (7) 0 N N d
w
n
- U
+ U
P9
4
W
Q
U
a
w 0 9 ~ ~ m a n )
C
3 M '
$ V
c9
4
!4
CI
m
4
-
N * Q l n o o Q * N r n O \ N C O N W Q e N *
4
4
.+ P, cd 0
a
4
W
Q
O ' N m V O O N * O O r - d * + N N N N N N
m m - 4 m . 4 - t - - N * c o b * * * N N N N N
* TS1
(7)
dr 9 N
. c t Q r d 0 3 & I
C O ~ o o o o 9 C 3 \ n l C O 9 e o L n * 0 ' 0 " 0 9 2 N d d
- U * b4
m - - ' + m C O C O * o O N ( 7 ) C o b * * * N N N N N
mJ L-J
Q d ' W N 9 L O 9 m s m ~ c o N N
c o r n r r , ~ 9 r n 9 N Q m N c O N N
d ' 9 0 1 0 ' b - W m N * * o o r - * * * * N N N N N
O D C O N N O O - e d r m r r , e o o b e ~ f ( * N N N N N N
I . . - l a r d o 3 p j
4
a
N ,--I * N
N
N
*
--
STL-QPSR 1/1978
However, the formant frequency shift for the vowels [a] and [o]
using the lumped impedances seems to be rather large. This indi-
ca tes that a lumped wall impedance which i s independent of the vowel
configuration may not work satisfactorily. However, there i s some
evidence from vocal t r ac t calculations that F of [ a ] and [ a ] vow-
e l s comes out too low without the extra tuning by LwZ which would
support the simple assumption of a constant L w E . On the other hand,
the glottis inductance L could have a s imi lar effect, see section 5. l3
Apart f r o m the above reservation a t least two different lumped wall
impedances may have to be used; one for the open vowels and the other
for the non-open vowels. A more attractive solution would be to let
the L., be a function of the mean pharyngeal cross-sect ional a r e a . It
was found that the lumped wall impedance for the front par t of the
vocal t r a c t makes little contribution because of the relatively low in-
ductance in the lip impedance. Moving the front and back wall impe-
dances toward the inside of the vocal ' t ract , up to 2 c m from both ends,
made li t t le difference to the formant frequencies and bandwidths.
In connection with the three se t s of values obtained under different
conditions of distributed wall impedance, i t is interesting to note that
the formant frequencies and bandwidths a r e more affected under the
tensed cheek condition than under the relaxed cheek condition. I t can
be seen that the resu l t s based on the Fant e t a1 (1976) data a r e rather
close to the resul ts under the tensed cheek condition.
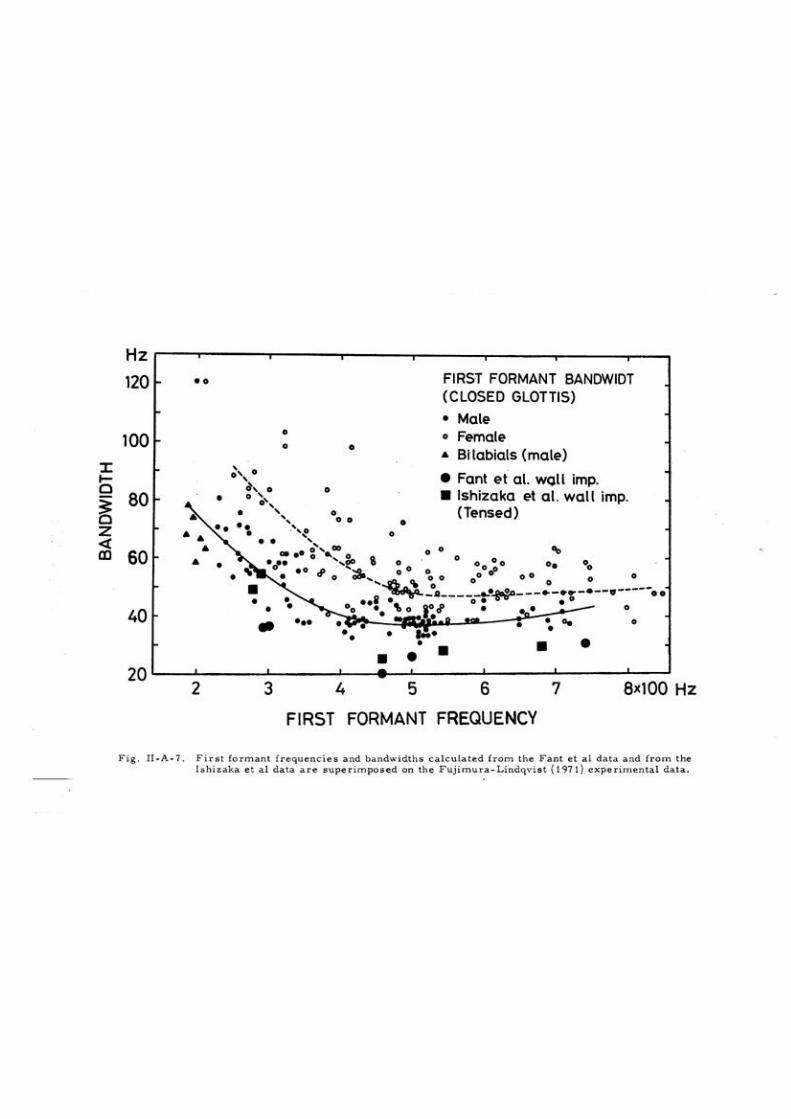
3 . 2 Comparison with Fuj imura- Lindqvist data
In o rde r to compare the above resul ts with those obtained f r o m the
sweep tone measurements by Fujimura and Lindqvist (1971), we plot-
ted our resul ts on their frequency vs . bandwidth graph, a s shown in
Fig. 11-A-7. It i s seen that most of our data a r e somewhat below the
lowe s t range of the Fuj imura- Lindqvist data.
Except f o r two points of the Ishizaka e t a1 tensed case , there i s ap-
proximately a 10 Hz negative bias in the formant bandwidths from the
mean curve for male speakers obtained by Fujimura and Lindqvist.*
- --
+ Recent measurements , unpublished data by L. Nord, a l so show the same tendency of falling in the lower l imit of the Fuj imura- Lindqvi s t distribution.
- ---
STL-QPSR 1/1978
It will also be interesting to compare the extreme limits of F and 1 B1, which correspond to the resonance frequency (f ) and band-
W
width (B ) of the vocal t rac t with closed lips. W
Fw and Bw can be measured relatively easily (Fant et a1 1976),
and can be used a s approximate measures for comparison of wall im-
pedance values, since the Fw and Bw involve the vibration of the en-
t i re closed vocal t rac t walls. The average frequency and bandwidth
of approximately 200 Hz and 65 Hz for closed-lip vocal t rac t of male
subjects obtained by Fujimura and Lindqvist (1971) roughly coincide
with the corresponding values of 191 Hz and 76 Hz obtained by Fant
e: a l (1976).
F o r low frequencies, a closed vocal t r ac t can be represented by L
a condenser Ct = v t / p c , where V i s the total volume of the vocal t t rac t , connected in parallel with the lumped m a s s element Lw of the
vocal t r ac t walls with associated se r i e s resis tance R . Thus, Fw W
and Bw a r e given by:
and
2 By assuminga total surface of the vocal t r ac t of 160 c m ( c o r r e s -
ponding to an elliptic cross-sect ion of 2 by 4 cm of the vocal t r ac t , 3 16 c m long and 100 c m in volume), the L and Rw resulting from the
W - 4 I s h i z a k a e t a l d a t a b e c o m e Lw = 2.1/160 = 0.0131 ycm and - 4 - 1
Rw = 800/160 = 5.0 gcm sec for the relaxed cheek, and L = - 4 3
1 . 5 / 1 6 0 = 0 . 0 0 9 4 ~ c r n - . ~ a n d R ~ = i 0 6 0 / 1 6 0 = 6 . 6 2 5 g c m sec for
the tensed cheek. Consequently, Fw = 160 Hz and B - 61 IIz for the W
relaxed cheek and Fw = 196 Hz and Bw = 112 Hz for the tensed cheek.
F r o m these values, i t appears that the resonance frequency of 196 H z
for the tensed cheek i s close to both the Fant e t a1 data and the Fuji-
mura-Lindqvist data, while for the bandwidth i t i s the value of 61 Hz
for the relaxed cheek that corresponds rather closely to these two sets -2 -1 -2 of data. The Rw - 1600 gcrn sec and 1. = 1 . 5 gcrn noted in the
W
STL-QPSR 1/1978
Flanagan et a1 (1975) ar t ic le apparently provides a representative
Fw but a too high Bw = R / Z X L :: 170 1-12. The cause of the d is - W W
crepancies described in this section i s not known a t this moment and
m o r e careful investigation would be necessary to clarify them.
4. Effects of frequency -dependent elements
As mentioned ea r l i e r , the se r i e s and shunt resis tances R and S
R in the t ransmission line analog model a r e frequency dependent. P
However, in the time-domain computer simulation of the model for
the purpose of synthesis, frequency-independent components for these
r e s i s to r s have to be assumed. The effects of using a fixed frequency
for these r e s i s to r s a r e not well publicized. One resul t using our mo-
del is given in Table 11-A-111. Formant frequencies and bandwidths
of five Russian vowels were computed for both frequency-dependent
and frequenc y-independent cases without wall impedance and under
the glottis-closed condition. F o r the frequency -independent case ,
the frequency was fixed a t 1 kHz to compute the values of frequency-
dependent res i s tors . It is seen from the table that the frequencies
a r e scarcely affected a t all , hut that the bandwidths a r e affected rath-
e r appreciably. The f i r s t formant bandwidth becomes larger for the
frequency-independent case since i t i s mainly determined by the f r ic -
tion and heat conduction losses . The second and third formant band-
widths, on the other hand, become smal le r for the frequency-inde - en dent case except for R of /o/ and /u/ whose corresponding for-
2 mant frequencies a r e l e s s than 1 kHz. The grea tes t e r r o r occurs for
B of Cij and [el which comes out an o r d e r of magnitude too small 3 in the frequency-independent calculation. This i s because they a r e
strongly affected by the radiation resistance fi which i s proportional 0
to the frequency squared. This result may suggest the use of one f r e -
quency fo r friction and heat conduction losses and another frequency
for the radiation loss . The ad hoc choice of the frequencies of 500 H z
and 1500 Hz, however, did not give any satisfactory improvement.
The radiation resis tance can be better handled by conversion to a r e -
sistance parallelling the radiation inductance a s in the Flanagan model.
This eer ie-paral le l t ransform eliminates the frequency square depend-
ency (but not the Ks( lo ) factor).
STL-QPSR 1/1978
5 . Effect of glottis condition on formants
To know the effect of the glottis condition on the formant fre-
quencies and bandwidths i s quite important for understanding the es -
timation of formant frequencies and bandwidths. Data for static
cases under various glottal openings would provide some cues to in-
terpret the e stirnated formant frequencies and bandwidths, but since
most of the formant estimation techniques require a speech segment
of several pitch periods, the interpretation of the static data may not
be straightforward. At the very least, however, it should be expect-
ed that the formant shifts deduced from various static glottal openings
should indicate the range of the dynamic changes within the glottal
period. Using the subglottal system described ear l ier , the formant
frequencies and bandwidths of Russian vowels were computed under
two different glottal openings.
The results a r e given in Table 11-A-IV together with the results
for the closed glottis condition. It i s clear that there a r e substantial
effects on the Fi and F2 of the open vowels /a/ and /o/ and on F3 of
e . Bl and BZ of all the vowels a r e considerably affected by the
glottal plus subglottal system. It was found that i t is the glottal part
of this subvocal t ract system (R" and L in' Fig. 11-A-2) that predomi- 0 l3
nantly affects the resulting formant frequencies and bandwidths.
These findings a r e supported by the ear l ier studies of Fant (1960),
p. 136, who tabulated the bandwidth components contributed by a
RG = 5 pc resistance terminating the vocal tract. These data BG may
be used to calculate the bandwidth B associated with other glottal re- 8
sistances R' €!
R~ - B = B G R' g
(20) g
I where R is the equivalent parallel glottal resistance according to g
E . ( 1 . The nearest correspondence in the present study
would be the difference between columns B and A in Table 11-B-IV
which pertains toa glottal area of 0.08 cm2 and the subglottal system
included.
STL-QPSR 1/1978 24.
Table 11-A-IV. Effects of glottis opening on formant frequencies and b a n w d t h s . A: Glottis closed; B: Glottal area= 0 . 0 8 cm , subglottal ?ressure=6.O cm HZO; C: Glottal area=O. 12 cm , subglottal pressure=6.0 c m HZO. 8 = single tube 17. 6 cm resonator.
* Accurate bandwidth could not be determined due to the effect of the neighboring peak, since the bandwidth was determined from the frequencies 3 dB below the peak level.
3 M
o o r - * d ' U a m m e n
nl N
0 9 0 3 m o a a r - * m n N N
h z - m
c9
I n l n t - d t b 4 4 * I n
S C O m w * N N N N N
~ W O O Q a o m H * * u ' t - m * d ' N N N N N
-
n
P - L"
n
E2 v
d
b4
h
P - k*
-
a O c O N N O 4 e * m ( . , m o O b * * d l N N N N N
~ 0 3 ~ 2 ~ u 0 0 0 3 N * a * + * N N - '
Q O N I n Q O a c o r n ~ n - t u n o r ( o 0 9 N N d
a O C O o O Q ' + m c r m 9 m m c r o m 9 N +
U ) N Q ) N * U O C O I n C O r u
n d r a m r s ,
b m S N c O a c r t - o m 0 n] dl 03 In (.,
m o \ t - o o + 4 a , t n P . - * N - ~ + Q ~ N
c d O M
m a m o \ m 4 * N N N I n
.,-I Q) rb 0
I
- i v
N m .
h
v 2 .-I
a
O t - d ' W l F 4 P N S W h ] N N
* N O ' O ' C O N
U w m O O C P N .-4
w N S*N 0' !a r - m m d ' b d d
[ T N F C O G 4 N s m N n ]
* * b b 0 3 0 d '
U m r - c O F d ' .-d 4 . 4 . 4
~ 0 ' 0 9 0 m d a 9 - N H N - - d
I
STL-QPSR 1/1978
Table 11-A-V. Glottal bandwidth component a t Ag=0 .08 cm2, d=O. 5 cm, and Ps=6 cm H 2 0 ( ~ ~ = l . 14 p c) , F=Fant (1960), p. 136, bandwidths corrected for actual parallel Rg and Lg of the glottal impedance and the associated frequency shift. W=calculations Wakita-Fant in present article with subglottal system included but without wall impedance. A=formant frequencies in Fant (1960) without wall impedance and glottal inductance .
n M
rn
n . Er
h) M
rn
N 6(
.PI
aM'
4
6(
O c " + Q c " 3 * d
f) d d f U O r - N u 3 4
O O O O Q o o - - - t ' V ,
o m m e + N n l n l N N
0 0 0 0 0 p c r n o n l b 4 o \ p c + n n N N n l N n l
m o u ' e n C - 3 ' * 4 4 , d ."I
0 - 3 ' m C - p c Q + d C C *
d
9 O N m m C o n r L n o ' N 3 n o - m a N N d
o o n l o o N 9 r - 9 . 4 N C - O , Q N d -
n c * ? - f \ - u l C G Y P 4 0 Q
N 4
N r - N n 9 r - N r - b
nl .-I
p c r n 9 N c O 3 F O * O N + a O V I r n
0 0 0 0 0 4 r n N C * ? O + ~ + a r n o
. c ( Q , ( d O 3
*
STL-QPSR 1/1978 2 6.
As seen in Table 11-A-V these data agree rather well with those
derived from Eq. (20) and the Fant (1960) data. The few instances
of deviation may be related to the difference in frequency of F1 set
by L and to the finite impedance of the subglottal system. The large g
B and B of [a] and B of 103 a r e verified. These effects a r e g i g2 g l
apparent in the analog simulations of Fant et a1 (1972). Figs. I-A- 17
and I-A- 18 of their article illustrate vocal t ract transfer functions
of the vowels La] and C03 with the source situated at the glottis in
ser ies with R . This figure also shows the traces of subglottal in- I g
fluence, e. g. a zero at the second reconance of the subglottal model
a t 1400 Hz and an additional pole at 1450 HZ .*
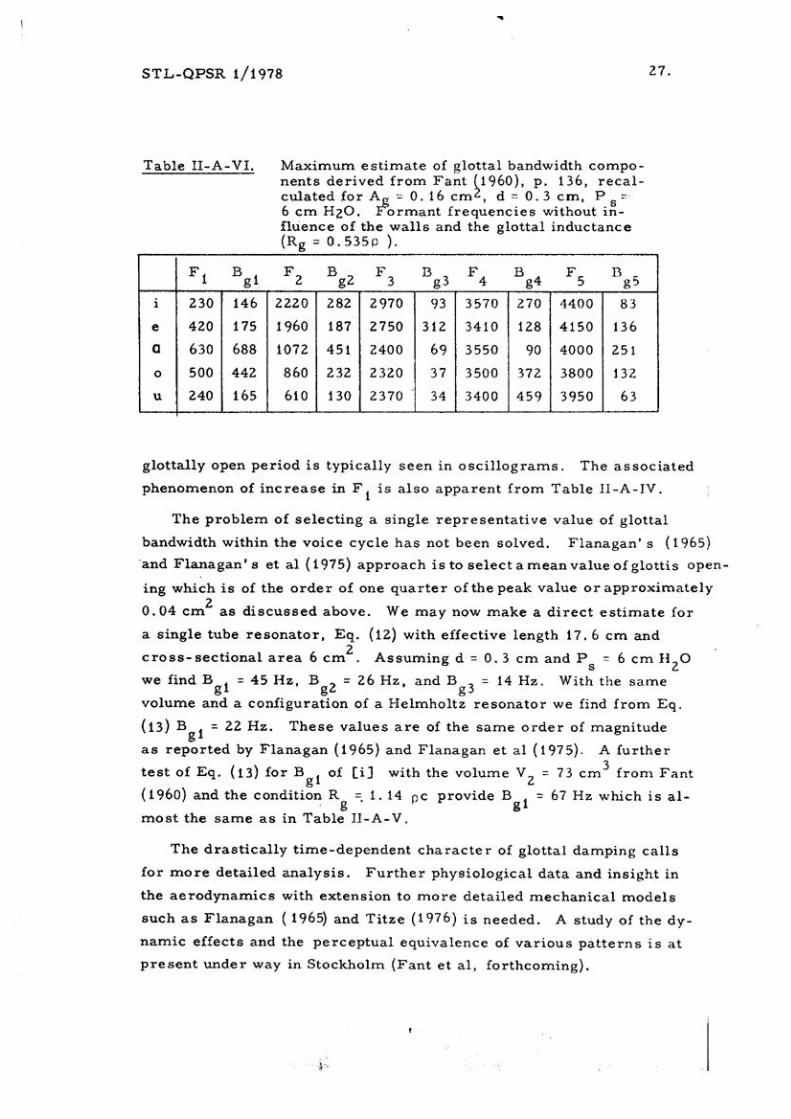
We may now approach the estimate of the maximal glottal damping
in voiced speech which occurs at the peak of the glottal pulse. A re-
presentative value of maximal glottal opening in a male voice i s A = 2 g 0.16 crn . At frequencies above 1000 Hz the choice of glottis thickness
d becomes crucial since the equivalent parallel glottis resistance I 2 R becomes proportional to d . Our choice of d = 0. 5 cm conforming g
to the quanta1 length of the transmission line analog LEA will thus
provide smaller values of glottal bandwidth for the upper formants
than the d = 0.3 cm adopted by Flanagan et a1 (1975).
In order to test the consequences of these conditions for maximal .
2 glottal damping, A = 0. 16 cm and d = 0 .3 cm we made a second re- g
calculation of glottal resistance R' and corresponding bandwidth B g 6
from the Fant (1960) data and Eq. (20) the results of which a r e shown
in Table 11-A-IV.
As expected the B of the vowels [o] and [a] approach F i which g 1
indicates a condition of approximate matching between the glottal re-
sistance and a mean value of the P c/2 characteristic impedance of
the pharynx. The exact values of these large B estimates a r e not in g
teresting, but we want to emphasize the esepcially high glottal damp-
ing effects of al l vowels produced with a pharyngeal constriction. This
condition of almost complete decay of formant oscillation within the
This subglottal pole has been neglected in the present analysis. Its prominence increases with A .
g
STL-QPSR 1/1978 28.
6. Conclusion
In this paper we have discussed the status of the a r t of vocal t rac t
modeling and some of the problems involved in i t . We constructed a
t ransmission line analog of the vocal t rac t model using a frequency-
domain algorithm,, and some of the crucial problems regarding energy
los ses were investigated. We feel that continuous effort should be
exerted toward a bet ter vocal t rac t model.
References
van den Berg, Jw . , Zantema, J . T . , and Boornenbal, J r . , P. (1957): "On the air resis tance and the Bernoulli effect of the human larynx", J. Acoust. Soc. Am, 29, pp. 62 6- 6 3 1.
Chiba, T . and Kajiyama, M , (1941): The Vowel - Its Nature and Structure, Tokyo.
Fant, G. (1960): Acoustic Theory of Speech Production. The Hague.
Fant, G. (1972): IrVocal t r a c t wall effects, l o s ses , and resonance bandwidths1', STL-QPSK 2-3/1972, pp. 28-52.
Fant , G. (1 975): "Vocal-tract a r e a and length perturbations", STL- QPSR 4/1975, pp. 1-14.
Fant , G. (1 976): l'Vocal t rac t energy functions and non-uniform scaling", J. Acoust. Soc . Japan, Dec. , pp. 1 - 1 1.
Fant, G. and Pauli , S. (1974): "Spatial charac ter i s t ics of vocal t rac t resonance modes", pp. 12 1 - 132 in Speech Communicationz Vol. 2 (Proc. of SCS-74), Stockholm 1975.
Fant , G . , Ishizaka, K . , Lindqvist, J . , and Sundberg, J . (1972): "Subglottal formants", STL-QPSK 1/1972, pp. 1 - 12.
Fant , G . , Nord, L . , and Branderud, P. ( 1976): "A note on the vocal t r ac t wall impedance", STL-QPSR 4/1976, pp. 13-20.
Fet tweis , A. (1 971): "Digital f i l ter s t ructure relaked to classi.cn1 f i l te r networkst ' , Arch. f . Elektronik u. Ubertragungstechn. , Vol. - 25, pp. 79-89.
Flanagan, J . L. (1965): Speech Analysis Synthesis and Perception, New York , Berl in .
Flanagan, J . L . , Ishizaka, K . , and Shipley, ~ . ( 1 9 7 5 ) : "Synthesis of speech f rom a dynamic model of the vocal cords and vocal t ract" , Bell System Techn. J . , Vol. 54, March, pp. 485-506. -
Fujimura, 0. and Lindqvist, J . ( 1971): "Sweep-tone measurements of vocal-tract character is t ics" , J . Acoust. Soc. Am. 5, pp. 541-558.
Ishizaka, K. and Flanagan, J . L. (1972): "Synthesis of voiced sounds f rom a two-mass model of the vocal cords", Bell System Techn. J . , Vol. 51, July-August, pp. 1233-1268.
STL-QPSR l/i 978
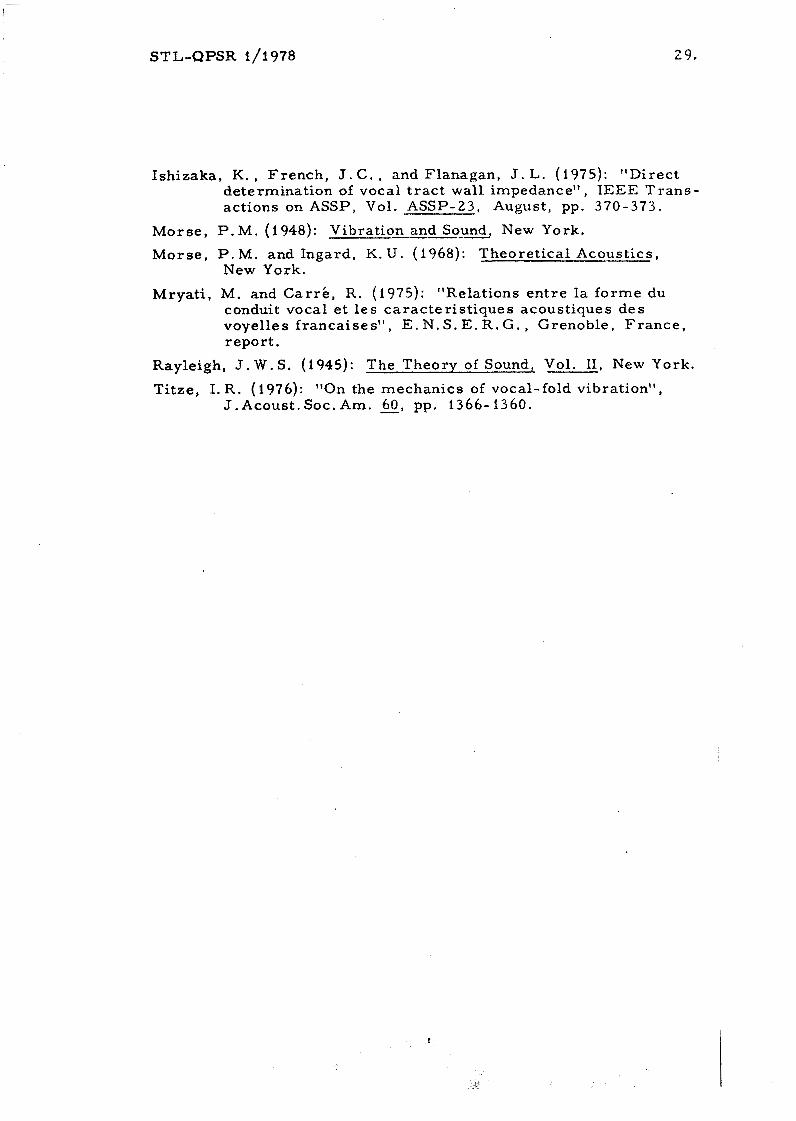
Ishizaka, K. , French , J . C. , and Flanagan, J . L. (1975): "Direct determination of vocal t r ac t wall impedancet' , IEEE Trane- actions on ASSP, Vol. ASSP-23, August, pp. 370-373.
Morse , P. M . (1 948): Vibration and Sound New York. I
Morse , P . M . and Ingard, K . U . (1968): Theoret ical Acoustics, .- New York.
Mryat i , M. and Car rk , R. (1975): "Relations en t r e la fo rme du conduit vocal e t l e s carac te r i s t iques acoustiques d e s voyelles f rancaises" , E . N. S. E. R . G . , Grenoble, F rance , report .
Rayleigh, J . W . S. (1 945): The Theory of Sound, Vol. 11, New York.
Titze, I. R. (1976): "On the mechanics of vocal-fold vibration", J .Acoust .Soc.Am. 60, pp. 1366-1360.