2020 Building Performance Analysis Conference and SimBuild co-organized by ASHRAE and IBPSA-USA
TOWARDS A STANDARDIZED FRAMEWORK FOR THERMAL RESILIENCE MODELING AND ANALYSIS
Ted Kesik1, William O’Brien2, and Aylin Ozkan1 1Daniels Faculty of Architecture, Landscape and Design, University of Toronto, Canada
2Department of Civil and Environmental Engineering, Carleton University, Ottawa, Canada
ABSTRACT Thermal resilience of buildings is commonly assessed using two metrics: thermal autonomy (TA) is a measure of the fraction of time during a year that a building can passively maintain comfort conditions without active system energy inputs; and passive habitability (PH) is a measure of the duration of time that an indoor space remains habitable following a prolonged power outage over an extended period of extreme weather. An emerging body of research has identified these two metrics as significant indicators of energy efficient building performance. However, there remains a need to achieve consensus about how to coherently model these metrics during the early stages of design to better inform decision making. This paper proposes a framework to establish a common set of conventions, protocols and benchmarks for TA and PH metrics. First, it attempts to address the comfort and habitability indoor temperature thresholds that presently vary considerably in the literature and then to define both comfort thresholds appropriate for the analysis of passive measures in naturally ventilated buildings, and habitability thresholds under extreme conditions of high temperatures and humidity. Second, a consistent methodology for compiling weather data that reflect the impacts of climate change on extreme weather events is advanced. Third, modeling assumptions address the most vulnerable occupants in terms of their age and state of health, but also reconcile, in the case of multi-unit residential housing, the correlation between individual suite behaviour and whole-building performance so that the ‘weakest links in the chain’ deliver acceptable levels of thermal resilience. This paper also advocates for the inclusion of minimum levels of thermal resilience in future codes and standards to futureproof buildings.
INTRODUCTION The requirements for building performance have evolved far beyond durability and energy efficiency to include occupant health and well being, embodied carbon and resilience. An increase in the frequency and severity of extreme weather events due to climate change, combined with aging energy infrastructure that
is highly vulnerable to extended power outages, has seen thermal resilience become a critical consideration in building design. Incorporating thermal resilience at the early stages of design is crucial because passive measures must be locked in before they are traded off against active systems to satisfy energy efficiency requirements in codes and standards. Thermal resilience metrics are correlated to other metrics like energy use intensity (EUI) and thermal energy demand intensity (TEDI), but require less complicated modelling and can serve as efficient indicators of high-performance at the early stages of design (Ozkan et al., 2017).
CRITICAL CONSIDERATIONS FOR THERMAL RESILIENCE SIMULATIONS The recognition of the need for thermal resilience in building codes and standards would logically require some standardization of the methods and underlying assumptions used in building performance simulation (BPS). More importantly, the need to validate simulation predictions with actual observed passive behaviour is a crucial parallel activity. The following critical considerations outline the challenges facing the BPS community: • Criteria for assessing mechanically versus naturally
ventilated buildings;• Thresholds for thermal autonomy and passive
habitability;• Climate change, urban heat island effect, and timing
and duration of the emergency; and• Whole building versus individual suite or zone
thermal resilience.The last point above is an important consideration because in multi-unit residential buildings, suites with single aspect facades facing unfavourable solar orientations may be much more vulnerable than whole buildings with open floor plans. It may also be desirable to create zones of refuge within a building where a higher level of thermal resilience is provided. This paper provides an overview of the literature and
recommendations, supplemented with several examples. It starts with thermal resilience definitions, followed by a discussion on suitable weather files and the period for which resilience should be tested. The critical considerations listed above are sytematically addressed in the sections that follow.
Thermal Resilience Definitions Throughout the literature, the most common types of metrics to assess thermal resilience in buildings involve either thresholds below or above which the building is penalized (e.g., passive habitability or overheating limit), or fraction of time that the building is comfortable (e.g., thermal autonomy). Overheating concerns seem to dominate rather than underheating (i.e., too cold) in the literature, with many of the papers emerging out of regions that recently suffered heatwaves. This is in part because a common argument is that overheating risk is an unwanted consequence of the trend towards well-insulated, air-tight dwellings. It may also be a result of the population distribution on earth – with the majority living in climates for which overheating is more likely. Table 1 summarizes some key studies that used simulation to evaluate building thermal resilience or overheating severity in buildings without availability of mechanical systems.
Table 1 Review of research on thermal resilience (overheating)
Paper Metric(s) explored Weather conditions
Lower threshold
Upper threshold
Mavrogianni, Wilkinson et al. (2012)
Peak and mean temperature during simulation period
Four warmest months in TMY and medium emissions scenario 2050 projected weather
N/A 25°C (77ºF) in living rooms and 23°C (73ºF) in bedrooms
Ren, Wang et al. (2014)
Number of hours above threshold
AMY for a year with a severe heat wave
N/A Discomfort Index (DI)1 of 28°C (82ºF)
Porritt, Cropper et al. (2012)
Number of degree-hours above threshold
9-day period during actual heatwave
N/A 28°C (82ºF) in living rooms and 26°C (79ºF) in bedrooms
Levitt, Ubbelohde et al. (2013)
TA Annual TMY -0.84 PMV (80% PPD)
+0.84 PMV (80% PPD)
Sailor (2014) Maximum indoor air temperature, average and maximum PMV and PPD
PS Warm/sunny and cold cloudy 10-day periods from TMY using visual inspection
-0.84 PMV (80% PPD)
+0.84 PMV (80% PPD)
PS: time to reach temperature
Annual TMY 15°C (59ºF) operative temperature
30°C (86ºF) operative temperature
Ozkan, Kesik et al. (2018)
TA Warm/sunny and cold cloudy 10-day periods from TMY using visual inspection
18°C (64ºF) operative temperature
25°C (77ºF) operative temperature
PS: time to reach temperature
Annual TMY 15°C (59ºF) operative temperature
30°C (86ºF) operative temperature
Baniassadi and Sailor (2018)
PS: degree-hours over threshold
Heat waves (warmest consecutive hot days) extracted from TMY
N/A – only warm climates considered
Discomfort Index (DI)1 of 28°C (82ºF)
1DI = 0.5Ta + 0.5 Twb
There are two major criteria for considering appropriate metrics and thresholds: 1) simplicity of computation; and 2) accuracy. On the first point, the main approaches havebeen the Fanger thermal comfort model-based ortemperature-based. The challenge with the Fanger modelis that it involves six inputs – only three of which (airtemperature, mean radiant temperature, and relativehumidity) are readily available from simulation tools.The others (airspeed, metabolic rate, and clothing level)require major assumptions. O’Brien and Bennet (2016)showed that results are highly sensitive to these unknownparameters and that occupants who actively adapt todiscomfort are much better at withstanding poweroutages. While the typical assumption is a seasonalclothing level of 1.0 clo in winter and 0.5 clo in summer(ASHRAE 2017), these assumptions were not aimed atresilience scenarios where staying comfortable or alivebecome the primary focus of occupants. In the idealsituation, occupants can adapt their clothing level withno constraints. However, the most vulnerable may not beable to adapt and/or have the available clothing to do sowhile still being able to maintain activities. The Fangerthermal comfort model is also limited to 1.5 clo or lessand 2.0 met or less (ASHRAE 2017). Similarly, typicalmetabolic rates may not apply to the most vulnerable(e.g., elderly) or those needed to actively thwart theemergency. According to the uncertainty and limits ofthe Fanger thermal comfort model, we advocate for theuse of thresholds that are independent of personalvariables. These may include some combination of airtemperature, radiant temperature, and relative humidity– all of which are readily available from simulation tools.Even with these parameters, simulation-basedexperiments can be used to quantify the impact and roleof occupant behaviour regarding use of moveableshading, operable windows, etc. For example, O’Brienand Bennet (2016) explored the impact of “active” and“passive” occupants on thermal resilience in homes thathad operable windows and blinds – both of which can beused to improve indoor comfort conditions.While passive measures should be considered first and foremost to address resilience, we also strongly recommend adaptive measures (e.g., operable windows and places of refuge, such as basements) be included in both design and simulation. The caveat here is that certain building types (e.g., hospitals, nursing homes) house vulnerable occupants and hence should not exclusively rely on passive measures. Table 1 illustrates both the commonality and diversity of fixed temperature thresholds for resilience. The papers and their metrics can be divided by comfort thresholds and emergency thresholds, with the latter being more severe and extreme. On the expectation of accuracy of thresholds, a widely-cited literature review is Epstein
and Moran (2006), which recommends the discomfort index (DI). DI is a weighted sum of air and wet-bulb temperatures. Inclusion of wet-bulb temperature effectively penalizes humid conditions, where sweating is a less effective means to reject heat from the body. While DI neglects radiant heat exchange with the surroundings (e.g., from warm or cold windows), the Epstein and Moran found it to correlate very well with the more common metric that does include radiation, wet-bulb globe temperature (WBGT). For an extreme threshold for DI, Epstein and Moran recommend 28°C (82°F); this value was since adopted by several resilience studies. We recommend WBGT because of the fact comfort in certain building types (e.g., highly-glazed MURBs) is influenced by mean radiant temperature.
Naturally Versus Mechanically Ventilated Buildings A final consideration to thresholds is whether the building is naturally or mechanically ventilated. It is now widely accepted that occupants in naturally ventilated buildings have a greater tolerance to wider temperature ranges – particularly warm conditions when it is warm outside – as a result of psychological, physiological, and behavioral adaptations. It is critical to note that presence of operable windows is merely one necessary component of naturally ventilated buildings (Brager and de Dear 2000). The other key criterion is lack of mechanical cooling. Occupants are only tolerant of the wider range of temperatures that the adaptive thermal comfort model affords because they have not become accustomed to tightly controlled conditions resulting from air-conditioning. Accordingly, it is not valid to assume that the adaptive comfort model’s comfort limits can suddenly be applied when an air-conditioned building that suddenly stops having air-conditioning at the point of failure. Accordingly, we recommend that a different set of thresholds be used for mechanically-cooled and naturally ventilated buildings.On the basis of the reviewed literature on resilience and thermal comfort and the discussion above, we recommend the limits in Table 2. For naturally ventilated buildings, we recommend the 80% acceptability limit for thermal autonomy from ASHRAE Std. 55 (2017). For passive habitability in naturally ventilated buildings, we propose to set the limit to 5°C (41°F) above the neutral temperature for the ASHRAE Standard 55-2017 adaptive thermal comfort model, on the basis that these temperatures are moderately outside the minimum of >4°C (39°F)for comfort Category IV in EN 15251 (CEN2007). The limits for mechanically cooled buildings arebased on the literature review summarized in Table 1 andthe North American and European thermal comfortstandards (CEN 2007, ASHRAE) 2017).
These recommendations are based on the current literature on comfort and thermal resilience. However, the review also identified a need for future research – particularly on the nuances between mechanically cooled and naturally ventilated buildings, as well as the lower threshold values. Further research should also focus on exposure duration, as a brief period of extreme temperatures is profoundly different than multi-day exposure (Conlon, Rajkovich et al. 2011).
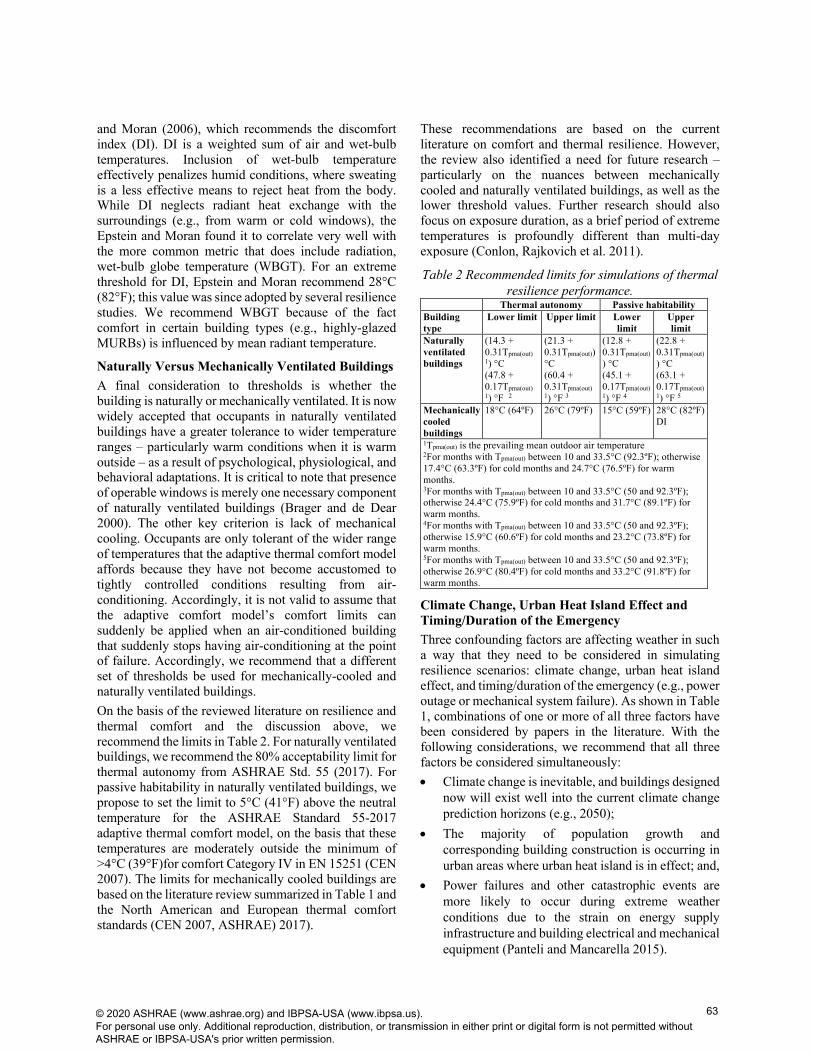
Table 2 Recommended limits for simulations of thermal resilience performance.
Thermal autonomy Passive habitability Building type
(21.3 + 0.31Tpma(out)) °C (60.4 + 0.31Tpma(out) 1) °F 3
(12.8 + 0.31Tpma(out)) °C (45.1 + 0.17Tpma(out) 1) °F 4
(22.8 + 0.31Tpma(out)) °C (63.1 + 0.17Tpma(out) 1) °F 5
Mechanically cooled buildings
18°C (64ºF) 26°C (79ºF) 15°C (59ºF) 28°C (82ºF) DI
1Tpma(out) is the prevailing mean outdoor air temperature 2For months with Tpma(out) between 10 and 33.5°C (92.3ºF); otherwise 17.4°C (63.3ºF) for cold months and 24.7°C (76.5ºF) for warm months. 3For months with Tpma(out) between 10 and 33.5°C (50 and 92.3ºF); otherwise 24.4°C (75.9ºF) for cold months and 31.7°C (89.1ºF) for warm months. 4For months with Tpma(out) between 10 and 33.5°C (50 and 92.3ºF); otherwise 15.9°C (60.6ºF) for cold months and 23.2°C (73.8ºF) for warm months. 5For months with Tpma(out) between 10 and 33.5°C (50 and 92.3ºF); otherwise 26.9°C (80.4ºF) for cold months and 33.2°C (91.8ºF) for warm months.
Climate Change, Urban Heat Island Effect and Timing/Duration of the Emergency Three confounding factors are affecting weather in such a way that they need to be considered in simulating resilience scenarios: climate change, urban heat island effect, and timing/duration of the emergency (e.g., power outage or mechanical system failure). As shown in Table 1, combinations of one or more of all three factors have been considered by papers in the literature. With the following considerations, we recommend that all three factors be considered simultaneously: • Climate change is inevitable, and buildings designed
now will exist well into the current climate changeprediction horizons (e.g., 2050);
• The majority of population growth andcorresponding building construction is occurring inurban areas where urban heat island is in effect; and,
• Power failures and other catastrophic events aremore likely to occur during extreme weatherconditions due to the strain on energy supplyinfrastructure and building electrical and mechanicalequipment (Panteli and Mancarella 2015).
The first two factors have been explored independently and together in the context of weather files for building simulation over the past several decades (Crawley 2008, Jentsch, Bahaj et al. 2008, Bueno, Norford et al. 2012, Ren, Wang et al. 2012). Moreover, online tools have been developed to modify EPW (EnergyPlus weather) files for climate change (Jentsch, Bahaj et al. 2008) and for urban heat island effect (Bueno, Norford et al. 2012). However, no known tools adapt current weather files to both effects simultaneously. Though it is logistically possible to sequentially use the tools to obtain a weather file that accounts for both climate change and urban heat island effect, validation of such an approach was not found in the literature; thus, we recommend this as an area for future work. A possible future exploration is the development and use of extreme weather data, such as the eXtreme Meteorological Year (XMY) weather files proposed by (Crawley and Lawrie 2019). Recently, researchers have advanced other practical approaches. The development of a methodology to build weather files for extreme reference years (Pernigotto et al.) is intended to assess energy needs under untypical boundary conditions, while reference summer weather years (Laouadi et al., 2020) is an aimed at assessing overheating risk in buildings due to historical heat waves. In order to take into account longer term climate change, climatic analogs (Fitzpatrick and Dunn, 2019) is a technique to forecast expected future climate expressed as a mapping to an analog location (e.g., Toronto becomes New York City). While these approaches are not well validated, they do enable a reasonable basis for sensitivity analyses. For annual analysis (e.g., to quantify thermal autonomy), the whole-year simulation can be performed using the standard TMY or a TMY file modified according to the above factors. However, for passive habitability, shorter simulations during simulated emergency events are performed. Conceivably, resilience could be codified by providing synthetic weather data files that contain the most extreme conditions. In the mean time, we recommend the following guidelines to select weather periods to quantify resilience. The benefit to using real weather data is that the relationships between all parameters are physically viable. For the cold period, select the seven-day period with the coldest average temperature whose average daily peak direct solar radiation is no more than 50% of the peak possible values ~ 1000 W/m2 (317 Btuh/ft2). For the warm period, select the seven-day period with the highest average wet-bulb temperature and that also as an average daily peak direct solar radiation of more than 50% of the peak possible values (approximately 1000 W/m2). A variation of this – particularly for highly-glazed buildings – is to select the week on the basis of
high solar radiation impacting the façade of interest. It is possible that a building is most prone to overheating outside of the summer period. For example, highly-glazed equator-facing facades tend to be most vulnerable in the shoulder season due to low solar altitude coupled with mild temperatures. In such cases, the most appropriate week to test resilience can be identified by running a whole-year simulation with HVAC disabled and identifying the period with the highest indoor temperatures. The above conditions may not exist for every climate (e.g., deserts are unlikely to have extended cloudy periods); modelers need to use their discretion.
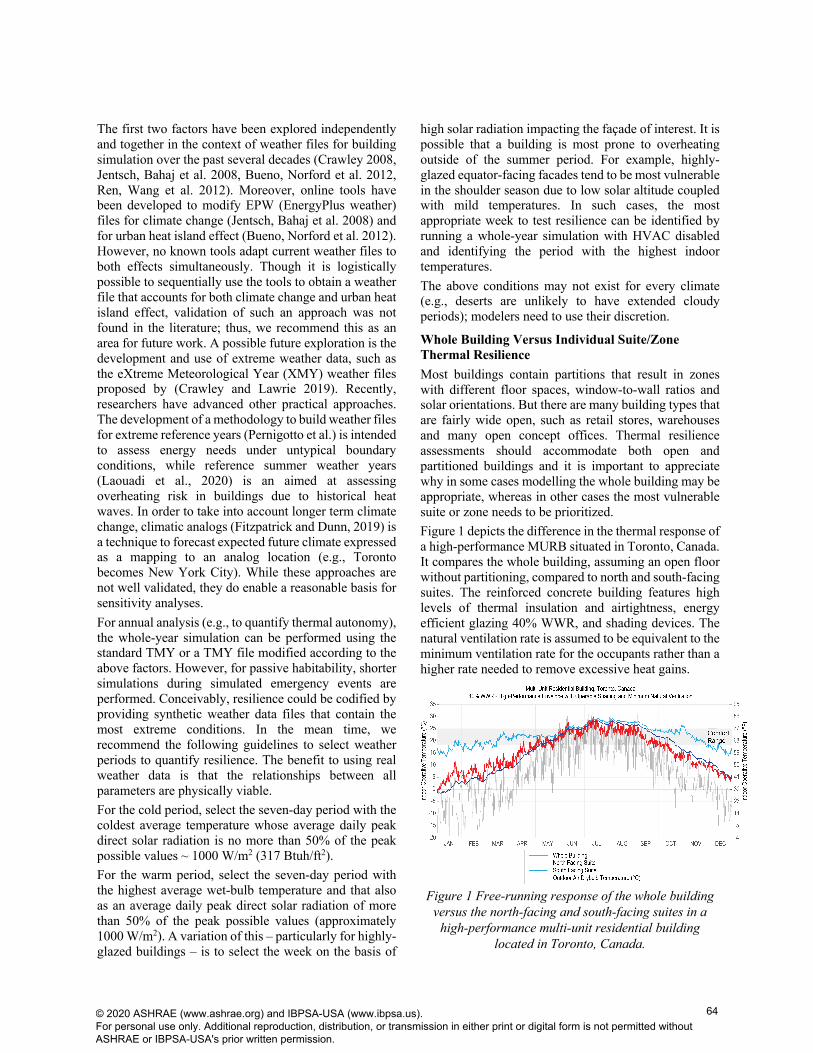
Whole Building Versus Individual Suite/Zone Thermal Resilience Most buildings contain partitions that result in zones with different floor spaces, window-to-wall ratios and solar orientations. But there are many building types that are fairly wide open, such as retail stores, warehouses and many open concept offices. Thermal resilience assessments should accommodate both open and partitioned buildings and it is important to appreciate why in some cases modelling the whole building may be appropriate, whereas in other cases the most vulnerable suite or zone needs to be prioritized. Figure 1 depicts the difference in the thermal response of a high-performance MURB situated in Toronto, Canada. It compares the whole building, assuming an open floor without partitioning, compared to north and south-facing suites. The reinforced concrete building features high levels of thermal insulation and airtightness, energy efficient glazing 40% WWR, and shading devices. The natural ventilation rate is assumed to be equivalent to the minimum ventilation rate for the occupants rather than a higher rate needed to remove excessive heat gains.
Figure 1 Free-running response of the whole building versus the north-facing and south-facing suites in a
high-performance multi-unit residential building located in Toronto, Canada.
The important phenomena to observe from the thermal responses are the effects of thermal mass, physical scale and heat distribution. The amplitude of diurnal temperature swings is greatest for the whole building due predominantly to insolation effects on the west exposure. The north and south-facing suites have much lower dirurnal temperature swings, and in general, the south-facing suite is much warmer than the whole building. The north-facing suite is always colder than the south-facing suite, but while colder than the whole building during winter, it is warmer in summer and fall. Figure 2 depicts a graphic representationn of thermal autonomy for the whole building and north and south-facing suites from Figure 1. If the acceptable temperature range from 18°C (64°F) to 25°C (77°F) is used to define the thermal autonomy (TA) threshold, then the north-facing suite has the lowest TA of 25%, while the whole building is better at 33%, and the south-facing suite the best at 52%.
Figure 2 Thermal autonomy of the whole building versus the north and south-facing suites in the high-
performance building from Figure 1. This example is based on a multi-unit residential building (MURB), but if it was an open concept office building with practically no partitions, but the same passive measures, it would only be too hot (i.e., require mechanical cooling) 10% of the time and 57% of the time space heating would be needed. It is important to note this is not an exact comparison since internal gains due to occupancy would differ between a MURB and an office building, however, partitioning zones is a significant factor that must be carefully considered when designing for thermal resilience. Interestingly, the north-facing suite benefits from a combination of the limited solar gains that are afforded during the shoulder months and the distribution of solar gains from the east, west and south glazing throughout the building’s mass. As a result, the north suite only requires space heating 53% of the time compared to 57%
of the time for the whole building. And it is too hot for 22% of the year compared to 10% for the whole building, which at first appears counterintuitive, but is supported by the physics. Looking at the south-facing suite, it exhibits the least space heating demand at 19%, but the most space cooling demand at 29%. The issue that surfaces from these analyses is whether thermal resilience design of passive measures should target the “weakest link in the chain” or the whole building? For climates like Toronto, Canada it is observed that the north-facing suite and the whole building exhibit comparable thermal responses, but it would require a large number of parametric analyses in different climate zones to arrive at the critical relationhips governing their space heating and space cooling thermal autonomy performance criteria. The practical implications for the difference between whole building and individual suite/zone thermal resilience become more critical when passive habitability is considered. While it has been established that different solar orientations require different facade design properties and features to optimize passive performance, this does not rule out the importance of the question regarding whether whole building or individual suite/zone criteria should govern thermal resistance ratings of buildings.
Timing/Duration of Extreme Weather Events As noted previously, climate change has generated an increase in the frequency and severity of extreme weather events, both summer heat waves and winter cold snaps. When designing for passive habitability performance as part of a thermal resilience adaptation strategy, this section focuses on maintaining habitable conditions for the inhabitants as opposed to passive survivability (Wilson, 2005), as it relates to the protection of infrastructure (i.e., protection against freezing of plumbing or overheating of stored foods and emergency supplies). The recommended timing and duration of extreme weather events used to properly assess passive habitability correspond to a prolonged extreme weather event coinciding with an extended power outage. Historically, power outages can last for periods ranging from several hours to several weeks and it must be recognized that in extremely hot and cold climates, it may not be possible to provide passive habitability for more than a few days. Ideally, the building should be able to provide habitable shelter until either power is restored or emergency evacuation of the inhabitants can be carried out. A third alternative is to provide a place of refuge within the building where displaced inhabitants can reside until such time as power can be restored, or evacuation to actively conditioned shelter is deployed.
The age, health and mobility of occupants, along with their access to a network of family, friends and/or caregivers, must be accounted for in developing a robust thermal resilience strategy. Table 3 provides guidelines on selecting appropriate target durations for passive habitability depending on whether typical weather data or extreme weather data are applied in the simulations. It is based on limited anecdotal accounts for Canadian events recently expereinced. Evidence-based durations of power outages and/or first-responder intervention times should be substituted for the values in Table 3 where such information is available. Table 3 Recommended duration of acceptable passive
Typical hot weather 3 to 5 days before exceeding threshold
Extreme heat wave 2 to 3 days before exceeding threshold
Typical cold weather 3 to 7 days before exceeding threshold
Extreme cold snap 3 to 5 days before exceeding threshold
NOTE: Low thermal mass buildings exhibit lower durations of passive habitability. Snow and/or freezing rain may restrict access by first responders, caregivers.
Figure 3 depicts hot weather passive habitability where both typical and extreme weather (artifically generated) are modelled for both the whole building and a south-facing suite. Adapting the approach advocated by Fitzpatrick and Dunn, 2019, for using a climatic analog, the typical weather for Toronto is compared to the extreme hot weather of New York City to assess long term risk of overheating. Regardless the weather data used, no less than a full week of simulation following a power failure is generally recommended when assessing passive habitability.
Figure 3 Passive habitability response of the whole building versus the south-facing suite during a
prolonged period of typical hot weather (Toronto) and climatic analog extreme weather (NYC).
Based on the simulated response of the whole building versus a south-facing suite, and taking into consideration the forecast long term changes to the Toronto climate, it may be concluded that the provision of natural ventilation and operable shading devices is critical to providing acceptable future thermal resilience. Based on the Toronto typical weather year data, the possibility of overheating is borderline. However, if Toronto begins to expereince the types of heat waves witnessed in New York City by the middle of this century, then overheating risk is significant. While the provision of operable shading devices may be implemented easily in the future, the natural ventilation design of the building is not an easy retrofit option. If this multi-unit residential building was intended to house a vulnerable population such as the elderly and/or ill persons, the provision of natural ventilation is clearly a critical early stage design decision deseving srious consideration.
THERMAL RESILIENCE PROVISIONS IN CODES AND STANDARDS There is a need for the building performance simulation community to establish a standardized framework of simulation assumptions and protocols before it will be possible to advocate for minimum thermal resilience provisions in codes and standards. The measurement and verification of performance resulting from voluntary and exemplary measures preclude standardization. Some of the related issues include: • Until such time as thermal resilience can be
standardized, it is important to implement building envelope backstops in codes and standards to prevent adverse tradeoffs of passive measures against active systems.
• A limit states design approach to thermal resilience is desirable so that an acceptable probability of failure can be ensured.
• The need to examine and model archetype buildings that correspond to new construction as well as the existing housing stock, to establish feasible targets across climate zones (Baniassadi et al., 2019).
• Mandatory requirements for thermal resilience in public buildings (passive survivability) can offset existing buildings that cannot be feasibly transformed to acceptable levels of passive habitability. This will provide places of refuge (different than active warming and cooling centres) serving as a passive safety net.
• Special considerations for thermal resilience in social housing and health care facilities are needed to protect our most vulnerable communities.
FUTURE RESEARCH In conducting the research associated with this paper, including our previous work undertaken in the area of thermal resilience, several crucial research areas have been identified. 1. Development of a consensus methodology to
assemble extreme weather event files for passive habitability assessments.
2. Measurement and verification of passive habitability in occupied buildings in order to validate and calibrate simulations.
3. Determination of statistically significant upper and lower thresholds for passive habitability in mechanically versus naturally ventilated buildings.
4. Establishment of methods to codify thermal resilience using both prescriptive and performance-based paths.
5. Understanding, and later codifying, the role of adaptive measures (e.g., operable windows, movable shading, back-up heating and electricity sources such as CHP), that empower inhabitants to improve the thermal resilience of their buildings.
CONCLUSION Thermal resilience is now recognized as a vital consideration related to passive survivability in buildings. If building codes and standards are intended to uphold minimum levels of health and safety, then thermal resilience in the face of climate change, in particular passive habitability, is a set of measures that should b required. If the management of peak and annual energy loads helps make a more sustainable energy grid, then thermal autonomy is a desirable attribute in our buildings. Thermal autonomy is an effective indicator of low energy building performance that may be efficiently applied during the early stages of design to implement robust passive measures. Passive habitability is a helpful indicator of the vulnerability of inhabitants to extended extreme weather events coinciding with prolonger power outages. By assessing passive habitability, appropriate emergency measures can be developed to ensure that vulnerable populations are monitored in a timely fashion in order to triage if they can safely remain in their abodes, be moved to a place of refuge within the building, or evacuated to facilities that offer emergency shelter. Minimum requirements for thermal resilience may one day find themselves into codes and standards provided the issues and major research questions raised in this paper can be satisfactorily addressed. The building performance simulation community is urged to work with agencies and stakeholders to gather data needed to
transform thermal resilience design from a purely simulation-based exercise, into an evidence-based approach to building design.
ACKNOWLEDGMENT The authors gratefully acknowledge the financial support of BC Housing and ROCKWOOL North America for the research underlying this paper. William O’Brien also acknowledges funding from his Ontario Early Researcher Award. Special thanks to Chris Mackey for making available scripting to create an EPW file for an Actual Meteorologic Year (AMY) from an existing Typical Meteorologic Year (TMY) EPW file and publicly available data downloaded from the National Climatic Data Center (NCDC). http://hydrashare.github.io/hydra/
REFERENCES American Society of Heating Refrigerating and Air
Conditioning Engineers (ASHRAE). 2017. Standard 55 - Thermal environmental conditions for human occupancy. Atlanta, GA.
Baniassadi, A. and D. J. Sailor. 2018. Synergies and trade-offs between energy efficiency and resiliency to extreme heat – A case study. Building and Environment 132: 263-272.
Baniassadi, A., D. J. Sailor, E. S. Krayenhoff, A. M. Broadbent, and M. Georgescu. 2019. Passive Survivability of buildings under changing urban climates across eight US cities. Environmental Research Letters, Volume 14, Number 7.
Brager, G. S. and R. de Dear. 2000. A standard for natural ventilation. ASHRAE Journal 42(10): 21-29.
Bueno, B., L. Norford, J. Hidalgo and G. Pigeon. 2012. The urban weather generator. Journal of Building Performance Simulation 6(4): 269-281.
CEN. 2007. EN 15251: Indoor Environmental Input Parameters for Design and Assessment of Energy Performance of Buildings Addressing Indoor Air Quality, Thermal Environment, Lighting and Acoustics. Brussels, Belgium, European Committee for Standardization.
Conlon, K. C., N. B. Rajkovich, J. L. White-Newsome, L. Larsen and M. S. O’Neill. 2011. Preventing cold-related morbidity and mortality in a changing climate. Maturitas 69(3): 197-202.
Crawley, D. and L. Lawrie. 2019. Should We Be Using Just 'Typical' Weather Data in Building Performance Simulation? Building Simulation 2019, Rome, Italy, 2-4 September.
Crawley, D. B. 2008. Estimating the impacts of climate change and urbanization on building performance. Journal of Building Performance Simulation 1(2): 91-115.
Fitzpatrick, M.C. and R. R. Dunn. 2019. Contemporary climatic analogs for 540 North American urban areas in the late 21st century. Nature Communications 10:614.
Jentsch, M. F., A. B. S. Bahaj and P. A. B. James. 2008. Climate change future proofing of buildings -Generation and assessment of building simulation weather files. Energy and Buildings 40(12): 2148-2168.
Levitt, B., M. Ubbelohde, G. Loisos and N. Brown. 2013. Thermal autonomy as metric and design process. CaGBC National Conference and Expo: Pushing the Boundary–Net Positive Buildings.
Laouadi, A., A. Gaur, M. A. Lacasse, M. Bartko & M. Armstrong (2020) Development of reference summer weather years for analysis of overheating risk in buildings. Journal of Building Performance Simulation, 13:3, 301-319.
Mavrogianni, A., P. Wilkinson, M. Davies, P. Biddulph and E. Oikonomou. 2012. Building characteristics as determinants of propensity to high indoor summer temperatures in London dwellings. Building and Environment 55: 117-130.
O'Brien, W. and I. Bennet. 2016. Simulation-Based Evaluation of High-Rise Residential Building Thermal Resilience. ASHRAE Transactions 122(1).
Ozkan, A., T. Kesik, A. Z. Yilmaz and W. O’Brien. 2019. Development and visualization of time-based building energy performance metrics. Building Research & Information 47(5): 493-517.
Ozkan, A., Z. Yilmaz, T. Kesik and W. O’Brien. 2017. The Time-Based Metrics of Thermal Autonomy and Passive Survivability and Their Correlation to Energy Use Intensity. International Conference on Building Envelope Science and Technology (ICBEST), Istanbul, Turkey, 15-18 May.
Panteli, M. and P. Mancarella. 2015. Modeling and evaluating the resilience of critical electrical power infrastructure to extreme weather events. IEEE Systems Journal 11(3): 1733-1742.
Pernigotto, Giovanni, Alessandro Prada & Andrea Gasparella. 2020. Extreme reference years for building energy performance simulation. Journal of Building Performance Simulation, 13:2, 152-166.
Porritt, S. M., P. C. Cropper, L. Shao and C. I. Goodier. 2012. Ranking of interventions to reduce dwelling overheating during heat waves. Energy and Buildings 55: 16-27.
Ren, Z., X. Wang and D. Chen. 2014. Heat stress within energy efficient dwellings in Australia. Architectural Science Review 57(3): 227-236.
Ren, Z., X. Wang, D. Chen, C. Wang and M. Thatcher. 2012. Constructing weather data for building simulation considering urban heat island. Building Services Engineering Research and Technology 35(1): 69-82.
Sailor, D. J. 2014. Risks of summertime extreme thermal conditions in buildings as a result of climate change and exacerbation of urban heat islands. Building and Environment 78: 81-88.
U.S. Green Building Council. 2018. RELi 2.0 Rating Guidelines for Resilient Design and Construction. https://www.usgbc.org/resources/reli-20-rating-guidelines-resilient-design-and-construction
Wilson, Alex. December 1, 2005. Passive Survivability. Building Green.