Towards algorithm-enabled home wound monitoring withsmartphone photography: A hue-saturation-value colour spacethresholding technique for wound content tracking
Runjie B. Shi1 | Jimmy Qiu2 | Vincent Maida3,4,5
1Institute of Biomaterials and BiomedicalEngineering (IBBME), University of Toronto,Toronto, Ontario, Canada2TECHNA Institute, University Health Network,Toronto, Ontario, Canada3Palliative Medicine, William Osler HealthSystem, Toronto, Ontario, Canada4Division of Palliative Medicine, University ofToronto, Toronto, Ontario, Canada5Michael G DeGroote School of Medicine,McMaster University, Hamilton, Ontario, Canada
CorrespondenceRunjie B. Shi, Room 7-1004, 101 College St,Princess Margaret Cancer Research Tower,Toronto, ON M5G 1L7, Canada.Email: [email protected]
Automated tracking of wound-healing progress using images from smartphonescan be useful and convenient for the patient to perform at home. To evaluate thefeasibility, 119 images were taken with an iPhone smartphone during the treatmentof a chronic wound at one patient's home. An image analysis algorithm was devel-oped to quantitatively classify wound content as an index of wound healing. Thecore of the algorithm involves transforming the colour image into hue-saturation-value colour space, after which a threshold can be reliably applied to produce seg-mentation using the Black-Yellow-Red wound model. Morphological transformsare used to refine the classification. This method was found to be accurate androbust with respect to lighting conditions for smartphone-captured photos. Thewound composition percentage showed a different trend from the wound area mea-surements, suggesting its role as a complementary metric. Overall, smartphonephotography and automated image analysis is a promising cost-effective way ofmonitoring patients. While the current setup limits our capability of measuringwound area, future smartphones equipped with depth-sensing technology willenable accurate volumetric evaluation in addition to composition analysis.
Information on the wound-healing process is clinicallyimportant. For example, it is recommended to monitor therate of wound healing in diabetic foot ulcers to determinewhether the treatment was optimal.1 With the recent rapiddevelopment and wide adoption of smartphone digital pho-tography technology, we explore the feasibility of trackingwound changes with smartphones at home. Our vision isthat, eventually, this image collection process can be per-formed by the patient him/herself. The benefit of using a por-table camera for telemedicine has been discussed long beforethe current generation of modern smartphones.2–4 In thesestudies, the potential of cell phones in tracking wound-
healing progress was recognised. They especiallyhighlighted camera phones' capability of storing and trans-mitting useful clinical data, that is, wound images. The sav-ing on transportation and clinician time was reported to besignificant and well-received.
However, most of these studies were performed at a timewhen camera phones took photos of much worse quality thaneven today's most affordable smartphones. Moreover, the oldtelemedicine setup still required clinicians to manually inter-pret individual images. In comparison, today's smartphonesare powered by high-quality imaging systems, fast Internetconnections, and powerful processors capable of performingsimple image analysis to produce useful quantitative wound-healing statistics. This may reduce the burden on clinicians
Received: 22 April 2018 Revised: 23 September 2018 Accepted: 25 September 2018
to manually review the images if the images are taken in amanner that allows automated wound area contouring andsegmentation. Our goal here is to develop and evaluate aworkflow to extract clinically relevant information from asmartphone wound image, with the hope that, in the future,patients can take these pictures themselves at home to savehospital visits and clinician time. This means that, for imageacquisition, no additional device or calibration should berequired, and the analysis methods should be agnostic to thecapturing device and robust under different lighting condi-tions. Then, the image will be processed by an algorithm toreport clinically useful information.
We recognised that two different types of output infor-mation are potentially useful: wound dimension and woundcomposition. Most wound image analysis research has beenfocused on the photogrammetric measurement of physicalwound dimensions. This usually relies on placing a cali-brated marker or grid next to the wound,5–9 from which thepixel dimensions can be approximately correlated to physi-cal dimensions. However, such a setup can become cumber-some and confusing if one would like to ask the patient toacquire the image him/herself. Moreover, each type of gridor marking needs to be individually segmented and cali-brated for image analysis, making the analysis ill-suited for anon-supervised workflow. Alternatively, it is also possible todirectly obtain approximate physical dimensions from 2Dimages if the intrinsic and extrinsic camera matrices are cali-brated and assuming the wound is planar, a reasonableassumption for small wounds. For instance, a calibrated, spe-cially constructed camera system is described in Reference10, and other commercial (usually expensive) devices arealso available. While this may be a feasible solution at a hos-pital clinic or research facility, it does not fit our ultimategoal of making the data collection process accessible foreveryone at home without special equipment. We would likeeach image to be acquired freehand from different poses anddifferent cameras. Moreover, each camera has a distinctintrinsic calibration, which can only be determined through anon-trivial camera calibration process.
On the other hand, wound composition (mixture ofslough, necrosis, granulation, epithelium, etc.) can be highlyvariable during healing processes like granulation and ree-pithelisation. Therefore, quantification and reporting of suchprocesses by calculating the percentage of each type of tis-sue can provide useful information.11 To report wound com-position, semantic segmentation of the wound must beperformed. Because physical dimensions are not required,this can be performed on physically uncalibrated images.One of the earliest attempts at this was performed by Arnq-vist et al9 who used a semi-automatic approach on red-green-blue (RGB) images, where an operator would manu-ally determine the best among 16 classifiers for classifica-tion. While the semi-automatic approach was a novelmethod then, later research focused more on automatic
methods because of the development in fields of digital pho-tography, machine learning, and computer vision. Themethod developed by Mekkes et al11 is based on colourcoordinates on the RGB cube scale. They realised the impor-tance of tissue colour inside the wound and proposed apply-ing the Black-Yellow-Red wound colour model to theanalysis. They semi-automatically generated a mappingmatrix for each possible RGB combination for classification.Hansen et al12 provided a related application for determiningthe severity of wound after injury using colour information.
With increased computational power and higher bitdepth acquired in digital colour images, more modernmethods have been developed. More researchers started con-sidering transforming the image colour space instead ofusing the colour cube classifier approach. Hoppe et al13,14
was one of the first to use the hue-saturation-intensity (HSI)colour model to quantify the overall colour into five differentgrades of slough content. Their method involved calibrationof the camera colour intensity. Their treated images includemostly red granulation and yellow slough. With recentadvancements in photography, especially much more robustwhite balancing algorithms today, the calibration step islikely no longer necessary. More recently, Mukherjee et al15
described a method where the saturation component of theHSI colour space is considered using fuzzy divergence-based thresholding and machine learning methods to classifythe percentage composition of different wound tissue. Suchmachine learning-based methods can often provide betterresults but are harder to implement on mobile devices wheresoftware frameworks are not as developed, and computa-tional power is limited. We would like to take an approachsimilar to Mukherjee's but develop a method that is(a) easily implementable on all of today's smartphone plat-forms, (b) does not involve calibration, and (c) is robustenough to work well under different lighting conditions. Asa secondary goal, we would like the algorithm to work wellon large chronic wounds (because of the population ofpatient we see at our clinic; see example images in Figure 1)as most literature mentioned above treats much smallerwounds.
Key Messages
• a classification algorithm was developed to quantitatively ana-
lyse changes in wound content from images captured with a
standard smartphone
• the algorithm was used to track the healing progress of a
patient and was found to be accurate for wound characterisa-
tion purposes and robust with respect to varying lighting
conditions
• new 3D depth-sensing technology on smartphones is a prom-
ising next step to add volumetric analysis capability to the cur-
rent setup
2 SHI ET AL.
Recently, given the consent of a patient seen at the Wil-liam Osler Health System (Toronto, Canada) Palliative Med-icine unit, we collected colour photos to track the healingprogress of a chronic wound on the patient's leg. Photoswere taken at the patient's home using the rear camera on anApple iPhone 7 Plus smartphone. The camera has a12-megapixel (4032 × 3024 pixels) sensor and f/1.8 aper-ture. Over the interval of the study, we saw visually signifi-cant healing of this wound. One aspect of the progress is theshrinking physical dimension. Therefore physical dimen-sions (ie, longest length and widest width) were recordedwith a ruler (because this information cannot be easily deter-mined from an uncalibrated camera system as discussedabove). The composition of the wound over the treatmentperiod has been highly variable and is the focus of our analy-sis that is described below.
2 | METHODS
A total of 119 wound images were collected for a chronicwound on the patient's leg during a 90-day treatment period.Patient consent was obtained in compliance with the Decla-ration of Helsinki. Wound boundaries were manually con-toured on each image. The use of the manual approach isbecause currently reliable non-supervised wound segmenta-tion methods available5,6,16–18 are based on machine learningapproaches, such as using support vector machine and con-volutional neural networks. These methods are well-understood but can only be trained and implemented whenlarge wound image datasets are available. Therefore, woundcontouring algorithms were deemed to not be the focus ofthe current study.
The wound area was extracted from the contour using apolygon area mask defined by the contour points. This areais defined as the region of interest (ROI). A colour spacetransformation from the RGB space to the hue-saturation-value (HSV) space was performed on the image. The HSVspace is commonly used to perform segmentation of differ-ent objects5,13–15 because of its much higher contrastbetween semantically different objects or tissues. The huespace value is, by convention, represented by a non-dimensional value from 0 to 360 and wraps around. Thevalues 0 and 360 represent the colour red, while green is at120 and blue is at 240. The algorithm for conversionbetween RGB colour space and HSV colour space is:
Because most of our colour of interest in the Black-Yel-low-Red model11 is centred around the red region, we took adifferent period in the hue space: H 2 (−180, 180). As aresult, 0 and 120 still represent red and green, respectively,but blue is shifted one negative period to(240 − 360) = − 120. Most importantly, all pixels with redcolour would now be next to each other for histogram analy-sis, allowing much more convenient binning and intuitivevisualisation. Finally, the range (−180, 180) is normalised to(−0.5, 0.5) for interoperability between different softwareplatforms, which may define a different range for hue space
(A) (B) (C)
-0.5 -0.4 -0.3 -0.2 -0.1 0 0.1 0.2 0.3 0.4 0.5
Normalized shifted hue
0
0.02
0.04
0.06
0.08
0.1
0.12
0.14
0.16
0.18
0.2
Co
un
t P
erc
en
tag
e
Day 59
Granulation:
Bright Red
Epithelium:
Red-Yellow
FIGURE 1 An example of the image analysis pipeline of image, taken on day 59 of treatment. A, Image converted to hue-saturation-value (HSV) space,with the hue space visualised with maximum saturation. The top black arrow points at the large red area, which corresponds to granulation tissue. The bottomblue arrow points at a yellow patch, which is new grown epithelial tissue. B, The distribution of hue values inside the green contour is counted and plotted inthe histogram shown. C, Thresholds are applied on the histogram result followed by morphological transforms and visualisation operation to produce the
wound classification shown. The vertical lines indicate thresholds found to be the best for red granulation at − 14360 , +
14360
� �and for yellow at 14
360 ,75360
� �
SHI ET AL. 3
(one of the most common alternatives being 0-255 to fitwithin an 8-bit image depth). The entire operation can beexpressed mathematically as:
Hshifted Hð Þ¼H360
, 0≤H <180
H−360360
, 180≤H <360
8><>:
ð2Þ
Notably, this is a different shifting approach from theone taken by Hoppe et al.13 Their approach, as described inthe Table 1 in their study, can be described as Hshifted =(H − 210) mod 360. Their goal was also to solve the sameissue of a discontinuous red value. The advantage of Hoppe'smethod is that all numbers are kept positive, thus making itsometimes easier for software implementation, but the disad-vantage is that the absolute location of the hue locations isshifted (eg, red is no longer at 0 or 360).
All pixels in the hue channel inside the ROI were countedon a histogram. The best thresholds were experimentallydetermined to classify the pixels inside the wound as“slough,” “epithelium,” and “no label.” Assuming each typeof area would be rather contiguous, morphological operationswere performed to improve the accuracy of classification.First, an image erosion structuring element of appropriate sizewas applied so that small misclassified regions would beeliminated. Then, a dilation filter using the same structuringelement is applied to recover the correct size of classifiedareas. For visualisation, a small dilation structuring elementwas applied to each area, followed by a subtraction of thearea. This series of operation allows drawing out the outercontour of the classified area. Areas of different classifica-tions were delineated by different contour colours.
Finally, the percentage of each type of pixel classifica-tion inside the wound was calculated to be interpreted as thepercent of the area inside the wound being the labelled typeof tissue:
%granulation¼ number of “granulation” pixelstotal number of pixels in wound
%epithelial¼ number of “epithelial” pixelstotal number of pixels in wound
ð3Þ
The entire pipeline of the analysis was implemented inthe Python programming language using the OpenCV com-puter vision library. A sample analysis procedure is illus-trated in Figure 1. Compared with some of the similarexisting methods, our method is friendly for different pro-gramming platforms and libraries (eg, no machine learninglibrary required), requiring only basic operations commonlyfound in image manipulation libraries. Moreover, we do notperform any physical or colour calibration procedure.
In addition to the image analysis data, an upper-boundestimate of the wound area is provided by the measured wid-est length and longest length for comparison:
wound area≈ longest length ×widest width ð4Þ
Statistical analysis was performed in Python (version 3.6.2,Anaconda Software Distribution) and MATLAB (version 9.0R2016a, The MathWorks, Inc.).
3 | RESULTS
The algorithm was run on all 119 images collected. Repre-sentative images on days 15, 41, and 87 and their analysesare shown in Figure 2. The wound was on the patient's rightleg. Multiple images were required to capture the full extentof the large wound. Before treatment (on day 0), the entirechronic wound area was covered by slough. As treatmentprogressed, we saw significant granulation in the woundarea. Around day 30, all the original slough had beenreplaced by granulation tissue, with signs of reepithelialisa-tion. Afterwards, we observed a significant epithelisationprocess. It was also during this period where significantshrinking of the overall wound boundary was observed.(Figure 3) Therefore, the wound-healing process can be dis-tinguished into roughly two distinct phases: the first phaseconsisting primarily of granulation before day 30 and thesecond phase after day 30 when granulation process has sat-urated inside the wound, and reepithelialisation starts.
To validate the effectiveness of using the HSV colourspace, we can observe the trend of hue histogram progres-sion through the treatment process and correlate the trendwith our expectation from visual inspection. As illustratedin Figure 2, the initial phase of granulation is characterisedby the narrowing of the histogram peak and the increasein magnitude of the peak. The narrowing of the peak rep-resents the decreasing amount of yellow slough, which hasa higher hue number than red granulation tissue, while theincrease of the peak corresponds to the increase in thenumber of pixels classified as red granulation tissue. In thesecond phase of healing, where granulation saturates andepithelium starts to form, the histogram gradually shiftsinto the yellow region with a decreased magnitude of peak.This represents granulation tissue turning into epithelial tis-sue. This overall trend of the hue distribution progressionis visualised in Figure 5, where all individual histogramsfrom the collected images on different dates are stacked onthe vertical axis, and the height of the histogram is repre-sented by the colour intensity. When the segmentation wasvisualised and checked on individual images manually, theresult appears accurate and is robust with respect to thedifferent lighting condition, which can be seen in the threeimages chosen in Figure 2.
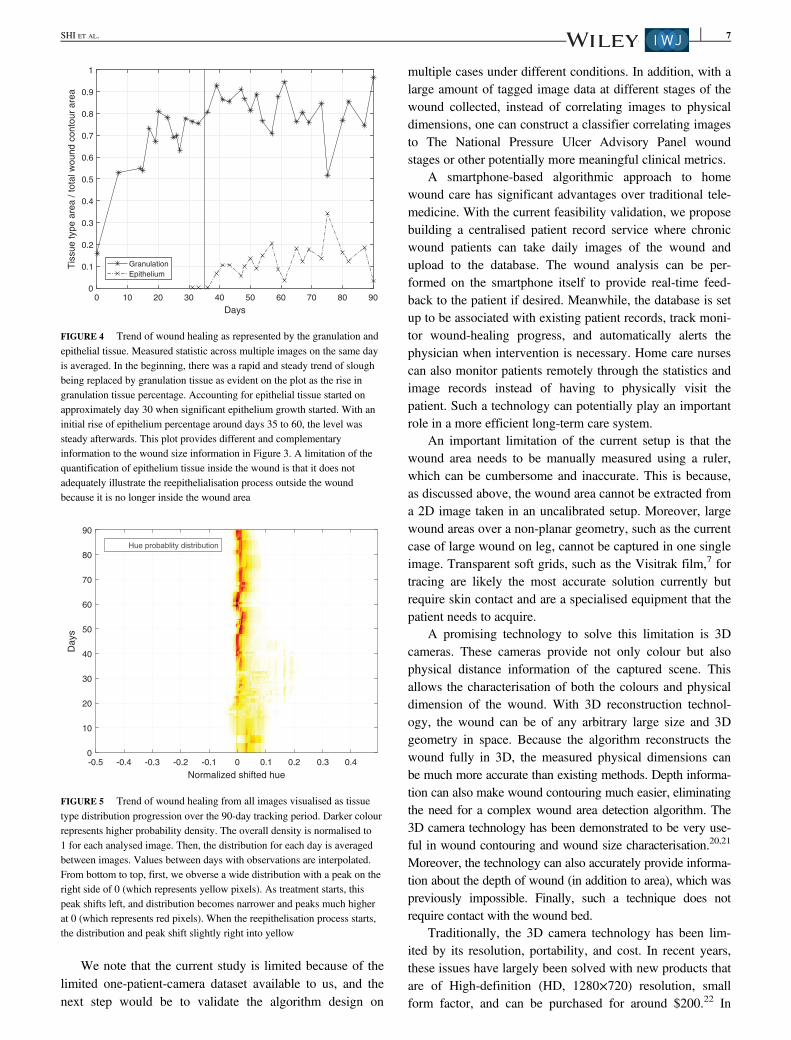
The trend of measured wound size is shown in Figure 3.There is a strong linear decreasing trend (wound area vs daysinto treatment, R2 = 0.903). In comparison, Figure 4 showsrapid initial granulation and epithelium growth and satura-tion of the growth after a few days and does not have a clearlinear trend. Therefore, it is clear that the two differentwound progression monitoring approaches quantifies two
4 SHI ET AL.
different aspects of the healing process. This suggests that,despite wound area being the more commonly cited metric,wound composition as calculated from our setup can provide
additional insight into the healing process. Such a segmenta-tion algorithm is especially suited for the current patient casebecause of the large, non-planar wound area (thus hard to
0
0.05
0.1
0.15
0.2
0.25
0.3
Co
un
t P
erc
en
tag
e
Day 15
-0.5 -0.4 -0.3 -0.2 -0.1 0 0.1 0.2 0.3 0.4 0.5
Normalized shifted hue
-0.5 -0.4 -0.3 -0.2 -0.1 0 0.1 0.2 0.3 0.4 0.5
Normalized shifted hue
-0.5 -0.4 -0.3 -0.2 -0.1 0 0.1 0.2 0.3 0.4 0.5
Normalized shifted hue
0
0.05
0.1
0.15
0.2
0.25
0.3C
ou
nt P
erc
en
tag
e
Day 41
0
0.05
0.1
0.15
0.2
0.25
0.3
Co
un
t P
erc
en
tag
e
Day 87
(A)
(B)
(C)
FIGURE 2 Representative analysis performed on (A) day 15, (B) day 41, and (C) day 87. The three images presented are chosen to represent different stagesin the treatment process and varying image lighting conditions. The left column shows the images taken with each classified area contoured (red: granulation,yellow: reepithelialised tissue). The right column shows the hue value histogram inside the wound area. Note the peak becomes significantly higher andnarrower from day 15 to 41 because of the much-increased percentage of granulation tissue, and the peak becomes slightly wider on day 87 because of thegrowing amount of epithelial tissue. The general trend is also visualised in Figure 5
SHI ET AL. 5
accurately measure) and the highly heterogeneous and vari-able wound composition (which makes the wound composi-tion analysis an ideal way of tracking the progression).
4 | DISCUSSION
We have demonstrated the feasibility to track wound-healingprocess using smartphone photography, where all imageswere acquired at the patient's home without special prepara-tion. The focus was to develop and evaluate an algorithm forthe quantification of different wound contents as an index totrack the healing progress.
Our approach of transforming the image into the HSVcolour space has been shown to be robust with respect tovarying lighting conditions and can be used to capture bothgranulation and epithelial growth for this case study. Intui-tively, our approach is similar to how humans distinguish dif-ferent tissue types by colour. The robustness of the algorithm
comes from the fact that, theoretically, the hue value shouldbe minimally affected by the overall luminance of the image.In practice, one needs to make sure that the ROI in the photois neither over-exposed or under-exposed. Fortunately, withthe advancement in smartphone technology, nowadays, theimage quality taken with an average smartphone is sufficientfor such analysis. In the future, we would also like to verifythe algorithm on subjects with different skin tones and tex-tures. An adaptive thresholding method might be required forsuch cases, such as the one described in Reference 19.
In addition, our current approach consisted of an erosionand then dilation morphological transformation process thatis designed to eliminate small pixel areas that are misclassi-fied. A common source of this misclassification is becauseof varying lighting conditions, such as specular reflections.The morphological transforms were found to be very effec-tive at removing the effect of such artefacts on the overallanalysis.
8
10
12
14
16
18
20
22L
on
ge
st
len
gth
(cm
)
Measurements
y=-0.106x+19.6
0
2
4
6
8
10
12
14
Wid
est
wid
th (
cm
)
MeasurementS
y=-0.059x+9.6
0 10 20 30 40 50 60 70 80 90
Days
0 10 20 30 40 50 60 70 80 90
Days
0 10 20 30 40 50 60 70 80 90
Days
0
20
40
60
80
100
120
140
160
180
200
Longest le
ngth
× w
idest w
idth
(cm
2)
Measurements
y=-1.545x+175.8
(A) (B)
(C)
FIGURE 3 Wound size as measured by (A) longest length, (B) widest width, and (C) product of longest length and widest width, an estimate of the totalwound area. Least squares linear regression is shown for each statistic: (A) R2 = 0.774, (B) R2 = 0.930, and (C) R2 = 0.903
6 SHI ET AL.
We note that the current study is limited because of thelimited one-patient-camera dataset available to us, and thenext step would be to validate the algorithm design on
multiple cases under different conditions. In addition, with alarge amount of tagged image data at different stages of thewound collected, instead of correlating images to physicaldimensions, one can construct a classifier correlating imagesto The National Pressure Ulcer Advisory Panel woundstages or other potentially more meaningful clinical metrics.
A smartphone-based algorithmic approach to homewound care has significant advantages over traditional tele-medicine. With the current feasibility validation, we proposebuilding a centralised patient record service where chronicwound patients can take daily images of the wound andupload to the database. The wound analysis can be per-formed on the smartphone itself to provide real-time feed-back to the patient if desired. Meanwhile, the database is setup to be associated with existing patient records, track moni-tor wound-healing progress, and automatically alerts thephysician when intervention is necessary. Home care nursescan also monitor patients remotely through the statistics andimage records instead of having to physically visit thepatient. Such a technology can potentially play an importantrole in a more efficient long-term care system.
An important limitation of the current setup is that thewound area needs to be manually measured using a ruler,which can be cumbersome and inaccurate. This is because,as discussed above, the wound area cannot be extracted froma 2D image taken in an uncalibrated setup. Moreover, largewound areas over a non-planar geometry, such as the currentcase of large wound on leg, cannot be captured in one singleimage. Transparent soft grids, such as the Visitrak film,7 fortracing are likely the most accurate solution currently butrequire skin contact and are a specialised equipment that thepatient needs to acquire.
A promising technology to solve this limitation is 3Dcameras. These cameras provide not only colour but alsophysical distance information of the captured scene. Thisallows the characterisation of both the colours and physicaldimension of the wound. With 3D reconstruction technol-ogy, the wound can be of any arbitrary large size and 3Dgeometry in space. Because the algorithm reconstructs thewound fully in 3D, the measured physical dimensions canbe much more accurate than existing methods. Depth informa-tion can also make wound contouring much easier, eliminatingthe need for a complex wound area detection algorithm. The3D camera technology has been demonstrated to be very use-ful in wound contouring and wound size characterisation.20,21
Moreover, the technology can also accurately provide informa-tion about the depth of wound (in addition to area), which waspreviously impossible. Finally, such a technique does notrequire contact with the wound bed.
Traditionally, the 3D camera technology has been lim-ited by its resolution, portability, and cost. In recent years,these issues have largely been solved with new products thatare of High-definition (HD, 1280×720) resolution, smallform factor, and can be purchased for around $200.22 In
-0.5 -0.4 -0.3 -0.2 -0.1 0 0.1 0.2 0.3 0.4
Normalized shifted hue
0
10
20
30
40
50
60
70
80
90
Days
Hue probablity distribution
FIGURE 5 Trend of wound healing from all images visualised as tissuetype distribution progression over the 90-day tracking period. Darker colourrepresents higher probability density. The overall density is normalised to1 for each analysed image. Then, the distribution for each day is averagedbetween images. Values between days with observations are interpolated.From bottom to top, first, we obverse a wide distribution with a peak on theright side of 0 (which represents yellow pixels). As treatment starts, thispeak shifts left, and distribution becomes narrower and peaks much higherat 0 (which represents red pixels). When the reepithelisation process starts,the distribution and peak shift slightly right into yellow
0 10 20 30 40 50 60 70 80 90
Days
0
0.1
0.2
0.3
0.4
0.5
0.6
0.7
0.8
0.9
1T
issue type a
rea / tota
l w
ound c
onto
ur
are
a
Granulation
Epithelium
FIGURE 4 Trend of wound healing as represented by the granulation andepithelial tissue. Measured statistic across multiple images on the same dayis averaged. In the beginning, there was a rapid and steady trend of sloughbeing replaced by granulation tissue as evident on the plot as the rise ingranulation tissue percentage. Accounting for epithelial tissue started onapproximately day 30 when significant epithelium growth started. With aninitial rise of epithelium percentage around days 35 to 60, the level wassteady afterwards. This plot provides different and complementaryinformation to the wound size information in Figure 3. A limitation of thequantification of epithelium tissue inside the wound is that it does notadequately illustrate the reepithelialisation process outside the woundbecause it is no longer inside the wound area
SHI ET AL. 7
addition, stereo rear camera and depth camera setups havestarted to appear on mainstream smartphones. This is partlybecause of the recent surge of interest in smartphone-basedaugmented reality and 3D facial recognition. For example,the Apple iPhone X has a depth camera using structured illu-mination technology for 3D facial recognition. Google Pro-ject Tango is another experimental project of incorporatingdepth-sensing technology into smartphones, which willenable “3D modeling on the go.”23 Once adopted, we canpotentially have the unprecedented capability to accuratelymeasure both wound volume and wound composition with asingle photo shot from smartphones. Therefore, we wouldlike to suggest this as a future direction in wound characteri-sation efforts.
ACKNOWLEDGEMENTS
The authors would like to thank members of the GuidedTherapeutics (GTx) Lab at University Health Network(UHN) for their support. The authors received no specificfunding for this work.
CONFLICTS OF INTEREST
The authors have no conflict of interest to declare.
ORCID
Runjie B. Shi http://orcid.org/0000-0001-5690-2394
REFERENCES
1. Steed DL, Attinger C, Colaizzi T, et al. Guidelines for the treatment of dia-betic ulcers. Wound Repair Regen. 2006;14(6):680-692. https://doi.org/10.1111/j.1524-475X.2006.00176.x.
2. Hofmann-Wellenhof R, Salmhofer W, Binder B, Okcu A, Kerl H, Soyer HP.Feasibility and acceptance of telemedicine for wound care in patients withchronic leg ulcers. J Telemed Telecare. 2006;12(1_suppl):15-17. https://doi.org/10.1258/135763306777978407.
3. Braun RP, Vecchietti JL, Thomas L, et al. Telemedical wound care using anew generation of mobile telephones. Arch Dermatol. 2005;141(2):254-258.https://doi.org/10.1001/archderm.141.2.254.
4. Terry M, Halstead LS, O'Hare P, et al. Feasibility study of home care woundmanagement using telemedicine. Adv Skin Wound Care. 2009;22(8):358-364. https://doi.org/10.1097/01.ASW.0000358638.38161.6b.
5. Perez AA, Gonzaga A, Alves JM. Segmentation and analysis of leg ulcerscolor images. Proceedings International Workshop on Medical Imaging andAugmented Reality; Shatin, Hong Kong, China. 2001:262-266. https://doi.org/10.1109/MIAR.2001.930300.
6. Wang C, Yan X, Smith M, et al. A unified framework for automatic woundsegmentation and analysis with deep convolutional neural networks. 201537th Annu Int Conf IEEE Eng Med Biol Soc; Milan. 2015:2415-2418.https://doi.org/10.1109/EMBC.2015.7318881.
7. Chang AC, Dearman B, Greenwood JE. A comparison of wound area mea-surement techniques: visitrak versus photography. Eplasty. 2011;11:e18.http://www.pubmedcentral.nih.gov/articlerender.fcgi?artid=3080766&tool=pmcentrez&rendertype=abstract.
8. Moustris GP, Hiridis SC, Deliparaschos KM, Konstantinidis KM. Evolutionof autnomous and semi-autnomous robotic surgical systems: a review of the
literature. Int J Med Robot. 2011;7(April):375-392. https://doi.org/10.1002/rcs.
9. Arnqvist J, Hellgren J, Vincent J. Semiautomatic classification of secondaryhealing ulcers in multispectral images. [1988 Proceedings] 9th InternationalConference on Pattern Recognition. IEEE Comput. Soc. Press; Rome, Italy.459-461. https://doi.org/10.1109/ICPR.1988.28266.
10. Krouskop TA, Baker R, Wilson MS. A noncontact wound measurement sys-tem. J Rehabil Res Dev. 2002;39(3):337-345. http://www.rehab.research.va.gov/jour/02/39/3/krouskop.htm.
11. Mekkes JR, Westerhof W. Image processing in the study of wound healing.Clin Dermatol. 1995;13(4):401-407. https://doi.org/10.1016/0738-081X(95)00071-M.
12. Hansen GL, Sparrow EM, Kokate JY, Leland KJ, Iaizzo PA. Wound statusevaluation using color image processing. IEEE Trans Med Imaging. 1997;16(1):78-86. https://doi.org/10.1109/42.552057.
13. Hoppe A, Wertheim D, Melhuish J, Morris H, Harding KG, Williams RJ.Computer assisted assessment of wound appearance using digital imaging.Annu Reports Res React Institute, Kyoto Univ. 2001;3:2595–2597. doi:https://doi.org/10.1109/IEMBS.2001.1017312
14. Oduncu H, Hoppe A, Clark M, Williams RJ, Harding KG. Analysis of skinwound images using digital color image processing: a preliminary communi-cation. Int J Low Extrem Wounds. 2004;3(3):151-156. https://doi.org/10.1177/1534734604268842.
15. Mukherjee R, Manohar DD, Das DK, Achar A, Mitra A, Chakraborty C.Automated tissue classification framework for reproducible chronic woundassessment. Biomed Res Int. 2014;2014:1-9. https://doi.org/10.1155/2014/851582.
16. Kolesnik M, Fexa A. How robust is the SVM wound segmentation? Proc7th Nord Signal Process Symp NORSIG 2006; 2007; Rejkjavik. (Section 4)::50-53. https://doi.org/10.1109/NORSIG.2006.275274.
17. Lu H, Li B, Zhu J, et al. Wound intensity correction and segmentation withconvolutional neural networks. Concurr Comput Pract Exp. 2017;29(6):1-10. https://doi.org/10.1002/cpe.3927.
18. Kolesnik M, Fexa A. Multi-dimensional color histograms for segmentationof wounds in images. In: Kamel M, Campilho A, eds. Image Analysis andRecognition. Berlin, Heidelberg: Springer Berlin Heidelberg; 2005:1014-1022.
19. Yang G, Li H, Zhang L, Cao Y. Research on a skin color detection algo-rithm based on self-adaptive skin color model. Int Conf Commun Intell InfSecur. Vol 2010; Nanning, Guangxi Province, China. 2010:266-270. https://doi.org/10.1109/ICCIIS.2010.67.
20. Gaur A, Sunkara R, Noel A, Raj J, Celik T. Efficient wound measurementsusing RGB and depth images. Int J Biomed Eng Technol. 2015;18(4):333-358. https://doi.org/10.1504/IJBET.2015.071009.
21. Plassmann P, Jones BF, Ring EFJ. A structured light system for measuringwounds. Photogramm Rec. 1995;15(86):197-204. https://doi.org/10.1111/0031-868X.00025.
22. Carfagni M, Furferi R, Governi L, Servi M, Uccheddu F, Volpe Y. On theperformance of the intel SR300 depth camera: metrological and critical char-acterization. IEEE Sens J. 2017;17(14):4508-4519. https://doi.org/10.1109/JSEN.2017.2703829.
23. Schops T, Sattler T, Hane C, Pollefeys M. 3D modeling on the go: interac-tive 3D reconstruction of large-scale scenes on mobile devices. Proc – 2015Int Conf 3D Vision, 3DV 2015; Lyon. 2015:291-299. https://doi.org/10.1109/3DV.2015.40.
How to cite this article: Shi RB, Qiu J, Maida V.Towards algorithm-enabled home wound monitoringwith smartphone photography: A hue-saturation-valuecolour space thresholding technique for wound con-tent tracking. Int Wound J. 2018;1–8. https://doi.org/10.1111/iwj.13011