The 2013 Annual Report provides the school community with detailed information pertaining to the academic position of the school over 2012 using system tools (NAPLAN) and for the first time Australian Council for Educational Research (ACER) standardised tests. Maida Vale Primary School provided a learning environment that met the needs of all students with a focus not only on students with ‘special needs’ or academically struggling but also those who excelled and needed to be challenged within the context of their classroom. All year 1-7 students participated in specialist areas from one hour or more each week. These included Music, Physical Education, Languages (Italian) and Library. The school acknowledged or celebrated events such as NAIDOC, ANZAC, Italian Week and a range of interschool sporting and academic events. By the end of the 2013 school year the final enrolment figure was 367 The $5 million upgrade of facilities did not commence when expected due to holds up beyond the control of the builders and departments involved. The project is now expected to be completed late February 2015. This will include a new Administration building, new 4 class cluster, canteen and a much needed carpark upgrade with works expected to commence mid-semester 2, 2013. Staff deliver a curriculum rich in learning activities that reflect current research in best practice for teaching. There is a focus upon school wide programs and teaching practice (explicit) to ensure missing key components of learning are drastically reduced. All students in every class are provided with appropriate learning tasks which best suit their ability and learning style. Numeracy skills are a key focus in Mathematics. Basic language conventions including letter sound recognition and reading strategies are essential in English. The development of reading skills is a priority throughout the school, supporting students to reach their full potential. Assessment and feedback are recognised as essential tools when planning and delivering appropriate curriculum for students in all learning areas and year levels. Formal and informal assessments are delivered in a variety of approaches; data collected is informative and relevant. It is systematic and is based on a variety of work, thereby becoming a natural part of the teaching and learning framework. Students are regularly measured against the school developed benchmarks in areas of Mathematics and English and individual targets are set from this. In addition the school uses ACER Standardise Tests in Mathematics and English to compliment the NAPLAN results and track student progress annually. In 2014 this testing regime will include Science. Teaching staff at Maida Vale Primary School demonstrate sound professional knowledge in all areas they are responsible for and are professional at all times. To maintain knowledge of current trends and research teaching staff attend regular professional development opportunities and have whole school professional discussions in relation to best practice. The varied expertise and strengths of staff is recognised and utilised to improve student learning in all eight areas of the curriculum. Staff work collaboratively across the entire school to ensure students are given every opportunity to achieve to the best of their ability. Staff accountability to student performance is high and all teachers participate in classroom audits to ensure consistency in meeting the agreed expectations as outlined in school operational plans. 2013 ANNUAL REPORT MAIDA VALE PRIMARY SCHOOL – ACADEMIC YEAR IN REVIEW At Maida Vale Primary School we believe that every child matters and can be a high achiever. We achieve this through; Strong relationships. High expectations. Excellent classroom practice Excellent bookwork Excellent classroom tone Quality feedback to students. OUR BELIEF 2013 P&C President Dee Cook 2013 School Council Chair Adam Sidebottom
Transcript
The 2013 Annual Report provides the school community with detailed information pertaining to the academic
position of the school over 2012 using system tools (NAPLAN) and for the first time Australian Council for Educational Research (ACER) standardised tests.
Maida Vale Primary School provided a learning environment that met the needs of all students with a focus not only on students with ‘special needs’ or academically struggling but also those who excelled and needed to be challenged within the context of their classroom. All year 1-7 students participated in specialist areas from one hour or more each week. These included Music, Physical Education, Languages (Italian) and Library. The school acknowledged or celebrated events such as NAIDOC, ANZAC, Italian Week and a range of interschool sporting and academic events. By the end of the 2013 school year the final enrolment figure was 367 The $5 million upgrade of facilities did not commence when expected due to holds up beyond the control of the builders and departments involved. The project is now expected to be completed late February 2015. This will include a new Administration building, new 4 class cluster, canteen and a much needed carpark upgrade with works expected to commence mid-semester 2, 2013. Staff deliver a curriculum rich in learning activities that reflect current research in best practice for teaching. There is a focus upon school wide programs and teaching practice (explicit) to ensure missing key components of learning are drastically reduced. All students in every class are provided with appropriate learning tasks which best suit their ability and learning style. Numeracy skills are a key focus in Mathematics. Basic language conventions including letter sound recognition and reading strategies are essential in English. The development of reading skills is a priority throughout the school, supporting students to reach their full potential. Assessment and feedback are recognised as essential tools when planning and delivering appropriate curriculum for students in all learning areas and year levels. Formal and informal assessments are delivered in a variety of approaches; data collected is informative and relevant. It is systematic and is based on a variety of work, thereby becoming a natural part of the teaching and learning framework. Students are regularly measured against the school developed benchmarks in areas of Mathematics and English and individual targets are set from this. In addition the school uses ACER Standardise Tests in Mathematics and English to compliment the NAPLAN results and track student progress annually. In 2014 this testing regime will include Science. Teaching staff at Maida Vale Primary School demonstrate sound professional knowledge in all areas they are responsible for and are professional at all times. To maintain knowledge of current trends and research teaching staff attend regular professional development opportunities and have whole school professional discussions in relation to best practice. The varied expertise and strengths of staff is recognised and utilised to improve student learning in all eight areas of the curriculum. Staff work collaboratively across the entire school to ensure students are given every opportunity to achieve to the best of their ability. Staff accountability to student performance is high and all teachers participate in classroom audits to ensure consistency in meeting the agreed expectations as outlined in school operational plans.
2013 ANNUAL REPORT MAIDA VALE PRIMARY SCHOOL – ACADEMIC YEAR IN REVIEW
At Maida Vale
Primary School we
believe that every
child matters and
can be a high
achiever.
We achieve this
through;
Strong
relationships.
High
expectations.
Excellent
classroom
practice
Excellent
bookwork
Excellent
classroom tone
Quality feedback
to students.
OUR BELIEF
2013
P&C President
Dee Cook
2013
School Council
Chair
Adam Sidebottom
ATTENDANCE 2013 – Overall
While the school experiences exceptional attendance rates parents of students who are absent on a regular basis are contacted early and where necessary case management and support occurs. Given the high percentage of attendance Maida Vale Primary School is no longer required to set annual targets for attendance. The focus for 2014 will be targeting students more regularly and seeking explanation for students with attendance concerns.
SCHOOL STATE
2010 94.4% 92.9%
2011 95.3% 92.7%
2012 94% 92.3%
2013 93.8% 92.6%
ATTENDANCE 2011 - 2013 – By Year Level
STAFFING 2013
The school received a teaching FTE of 19.8 to staff the school in 2013. This was broken down as:
ROLE FTE
Administration 2.0
Early Childhood 3.75
Primary 13.65
Language Other Than English (LOTE) 0.4
STUDENT BEHAVIOUR 2013
Behaviour of students at Maida Vale continues to be of a high standard. While there are occasions where students need to have a consequence imposed for their behaviour, which include detentions, In School Suspensions and Suspensions, the number of these is minimal. The school has a pastoral approach to managing behaviour not a punitive one. There are numerous incentives, rewards and individual recognitions that occur throughout the school to encourage and maintain positive behaviour.
In 2013 the school produced a Pastoral Care Policy that clearly articulates the schools actions in supporting the students’ pastoral needs.
2010 2011 2012 2013
Number of Suspensions 3 3 4 6
Total Days Lost 7 3 7.5 6
Number of Students 2 2 5 3
DESTINATION SCHOOLS (for year ending 2012)
Maida Vale PS students head to a range of secondary schools each year. The information below indicates these schools.
Destination Schools Male Female Total
Kalamunda Senior High School 8 8 16
Darling Range Sports College 1 0 1
Aranmore Catholic College 1 0 1
Lesmurdie Senior High School 1 3 4
Helena College 1 0 1
John Curtin College of the Arts 0 1 1
St Brigid’s College 0 1 1
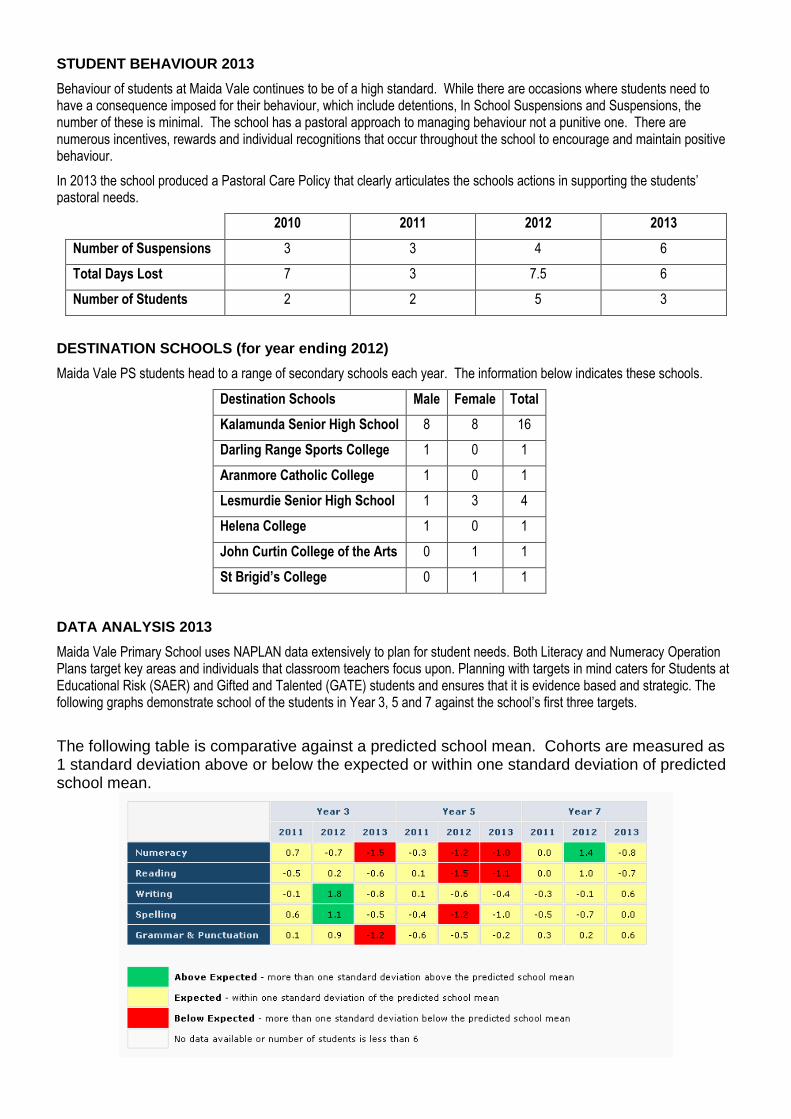
DATA ANALYSIS 2013
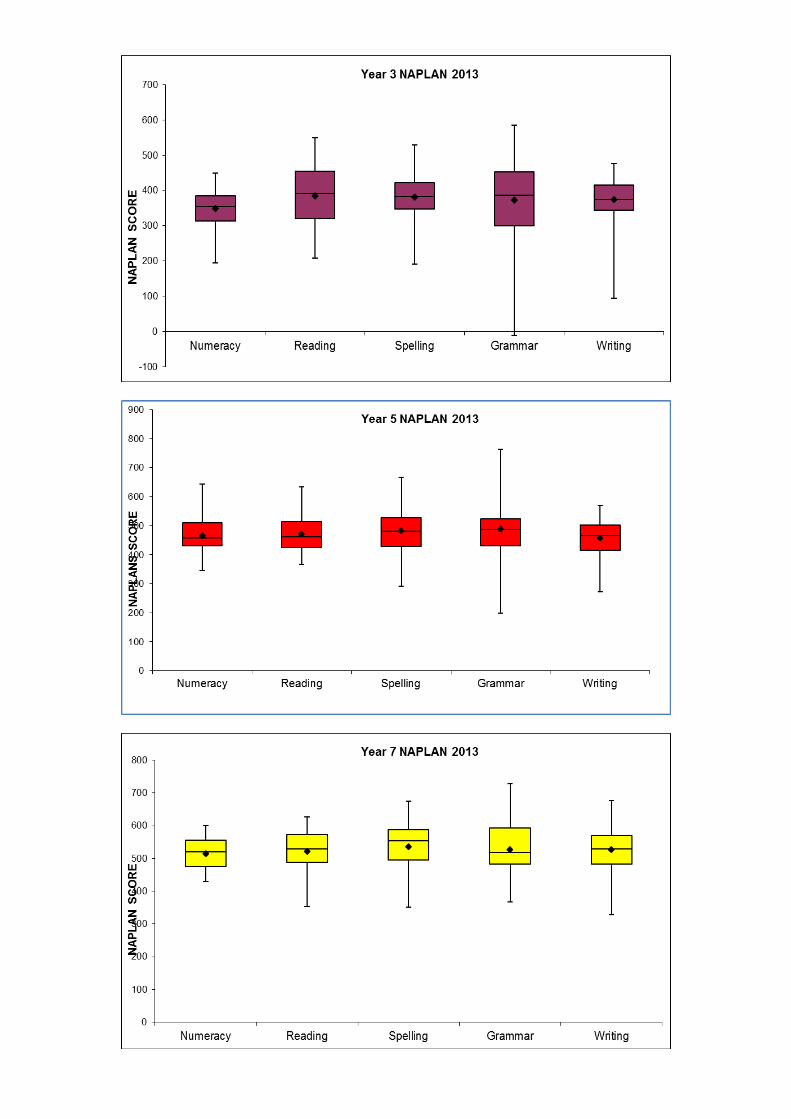
Maida Vale Primary School uses NAPLAN data extensively to plan for student needs. Both Literacy and Numeracy Operation Plans target key areas and individuals that classroom teachers focus upon. Planning with targets in mind caters for Students at Educational Risk (SAER) and Gifted and Talented (GATE) students and ensures that it is evidence based and strategic. The following graphs demonstrate school of the students in Year 3, 5 and 7 against the school’s first three targets.
The following table is comparative against a predicted school mean. Cohorts are measured as 1 standard deviation above or below the expected or within one standard deviation of predicted school mean.
Analysis Standing alone this data does not paint a very positive picture for 2012 or 2013 for Year 5 nor for Year 3. However this data is measuring movement against the mean and does not take into account other relevant pieces of information such as attendance, stable cohorts and formal withdrawals over informal, that is children who were expected but didn’t show for the test or failed to complete the test. The following pages will paint a slightly different picture to the achievement of the students and the direction of the school in working towards improving outcomes. School Targets
Target 1: INCREASE THE NUMBER OF STUDENTS IN THE TOP 20%
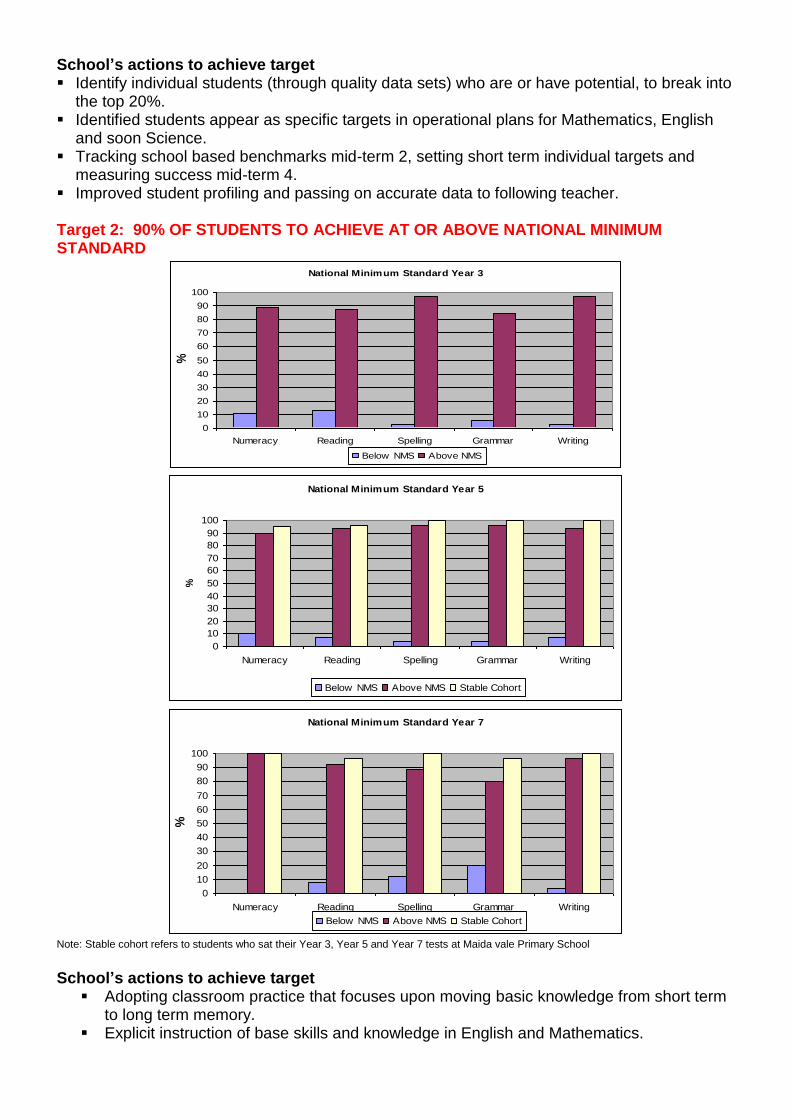
Target 2: 90% OF STUDENTS TO ACHIEVE AT OR ABOVE NATIONAL MINIMUM STANDARD
Target 3: SCHOOL MEAN TO BE AT OR ABOVE NATIONAL MEAN.
Target 4: CLOSE THE GAP IN GRADE DISTRIBUTION WITH LIKE SCHOOLS.
Target 1: INCREASE THE NUMBER OF STUDENTS IN THE TOP 20% There are two data sets to view for this target.
1. The percentage of students in the top 20% each year, per grade level. YEAR 3 2011 2012 2013
NUMERACY Top 20% 22% 11% 8%
READING Top 20% 22% 14% 13%
SPELIING Top 20% 30% 21% 11%
GRAMMAR Top 20% 26% 26% 24%
WRITING Top 20% 18% 48% 11%
YEAR 5 2011 2012 2013
NUMERACY Top 20% 8% 0% 19%
READING Top 20% 13% 7% 14%
SPELIING Top 20% 13% 10% 19%
GRAMMAR Top 20% 8% 13% 22%
WRITING Top 20% 26% 7% 16%
YEAR 7 2011 2012 2013
NUMERACY Top 20% 27% 17% 4%
READING Top 20% 30% 13% 21%
SPELIING Top 20% 20% 10% 21%
GRAMMAR Top 20% 30% 17% 25%
WRITING Top 20% 10% 13% 38%
2. The percentage of a cohort (same group) in the top 20% (value adding).
Value Adding YEAR 3-5 2011 2013 YEAR 5-7 2011 2013
NUMERACY Top 20% 22 19 -3%
Top 20% 8 4
-4
READING Top 20% 22 14 -8%
Top 20% 13 21
+8
SPELIING Top 20% 30 19 -11%
Top 20% 13 21
+8
GRAMMAR Top 20% 26 22 -4%
Top 20% 8 25
+17
WRITING Top 20% 18 16 -2%
Top 20% 26 38
+12
School’s actions to achieve target Identify individual students (through quality data sets) who are or have potential, to break into
the top 20%. Identified students appear as specific targets in operational plans for Mathematics, English
and soon Science. Tracking school based benchmarks mid-term 2, setting short term individual targets and
measuring success mid-term 4. Improved student profiling and passing on accurate data to following teacher. Target 2: 90% OF STUDENTS TO ACHIEVE AT OR ABOVE NATIONAL MINIMUM STANDARD
National Minimum Standard Year 3
0
10
20
30
40
50
60
70
80
90
100
Numeracy Reading Spelling Grammar Writing
%
Below NMS Above NMS
National Minimum Standard Year 5
0
10
20
30
40
50
60
70
80
90
100
Numeracy Reading Spelling Grammar Writing
%
Below NMS Above NMS Stable Cohort
National Minimum Standard Year 7
0
10
20
30
40
50
60
70
80
90
100
Numeracy Reading Spelling Grammar Writing
%
Below NMS Above NMS Stable Cohort
Note: Stable cohort refers to students who sat their Year 3, Year 5 and Year 7 tests at Maida vale Primary School
School’s actions to achieve target
Adopting classroom practice that focuses upon moving basic knowledge from short term to long term memory.
Explicit instruction of base skills and knowledge in English and Mathematics.
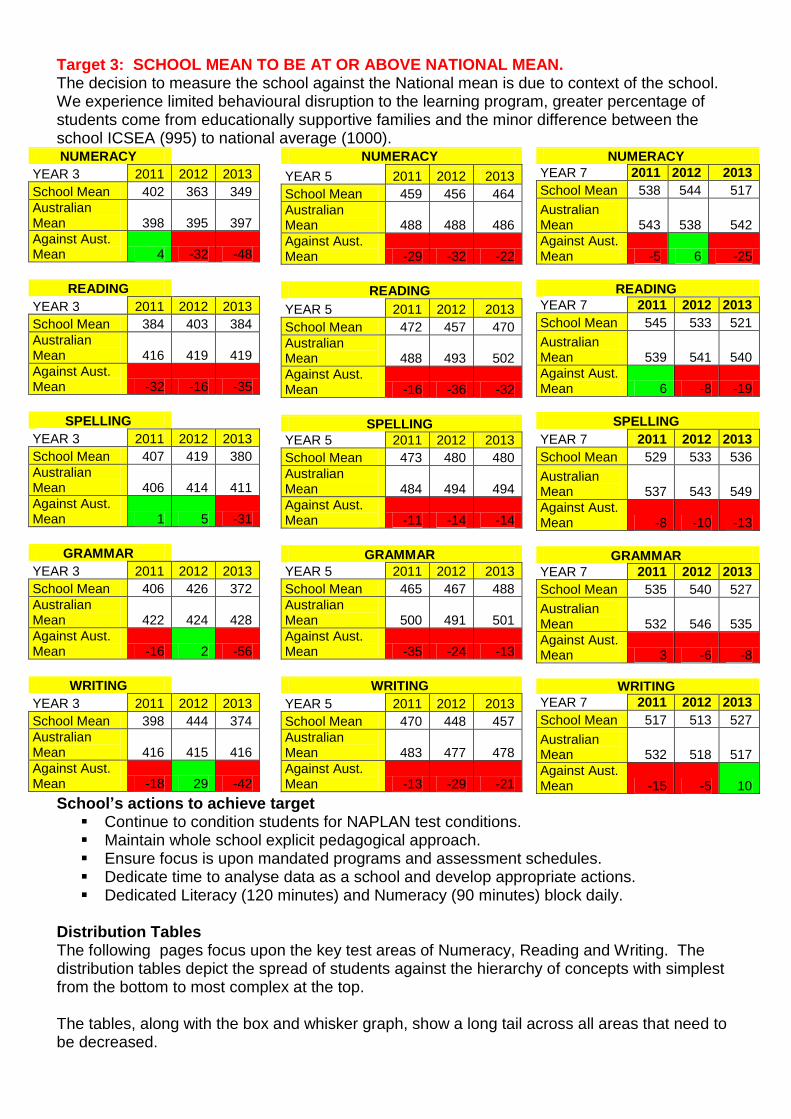
Target 3: SCHOOL MEAN TO BE AT OR ABOVE NATIONAL MEAN. The decision to measure the school against the National mean is due to context of the school. We experience limited behavioural disruption to the learning program, greater percentage of students come from educationally supportive families and the minor difference between the school ICSEA (995) to national average (1000). NUMERACY
YEAR 3 2011 2012 2013
School Mean 402 363 349
Australian Mean 398 395 397
Against Aust. Mean 4 -32 -48
READING
YEAR 3 2011 2012 2013
School Mean 384 403 384
Australian Mean 416 419 419
Against Aust. Mean -32 -16 -35
SPELLING
YEAR 3 2011 2012 2013
School Mean 407 419 380
Australian Mean 406 414 411
Against Aust. Mean 1 5 -31
GRAMMAR
YEAR 3 2011 2012 2013
School Mean 406 426 372
Australian Mean 422 424 428
Against Aust. Mean -16 2 -56
WRITING
YEAR 3 2011 2012 2013
School Mean 398 444 374
Australian Mean 416 415 416
Against Aust. Mean -18 29 -42
NUMERACY
YEAR 5 2011 2012 2013
School Mean 459 456 464
Australian Mean 488 488 486
Against Aust. Mean -29 -32 -22
READING
YEAR 5 2011 2012 2013
School Mean 472 457 470
Australian Mean 488 493 502
Against Aust. Mean -16 -36 -32
SPELLING
YEAR 5 2011 2012 2013
School Mean 473 480 480
Australian Mean 484 494 494
Against Aust. Mean -11 -14 -14
GRAMMAR
YEAR 5 2011 2012 2013
School Mean 465 467 488
Australian Mean 500 491 501
Against Aust. Mean -35 -24 -13
WRITING
YEAR 5 2011 2012 2013
School Mean 470 448 457
Australian Mean 483 477 478
Against Aust. Mean -13 -29 -21
NUMERACY
YEAR 7 2011 2012 2013
School Mean 538 544 517
Australian Mean 543 538 542
Against Aust. Mean -5 6 -25
READING
YEAR 7 2011 2012 2013
School Mean 545 533 521
Australian Mean 539 541 540
Against Aust. Mean 6 -8 -19
SPELLING
YEAR 7 2011 2012 2013
School Mean 529 533 536
Australian Mean 537 543 549
Against Aust. Mean -8 -10 -13
GRAMMAR
YEAR 7 2011 2012 2013
School Mean 535 540 527
Australian Mean 532 546 535
Against Aust. Mean 3 -6 -8
WRITING
YEAR 7 2011 2012 2013
School Mean 517 513 527
Australian Mean 532 518 517
Against Aust. Mean -15 -5 10
School’s actions to achieve target Continue to condition students for NAPLAN test conditions. Maintain whole school explicit pedagogical approach. Ensure focus is upon mandated programs and assessment schedules. Dedicate time to analyse data as a school and develop appropriate actions. Dedicated Literacy (120 minutes) and Numeracy (90 minutes) block daily.
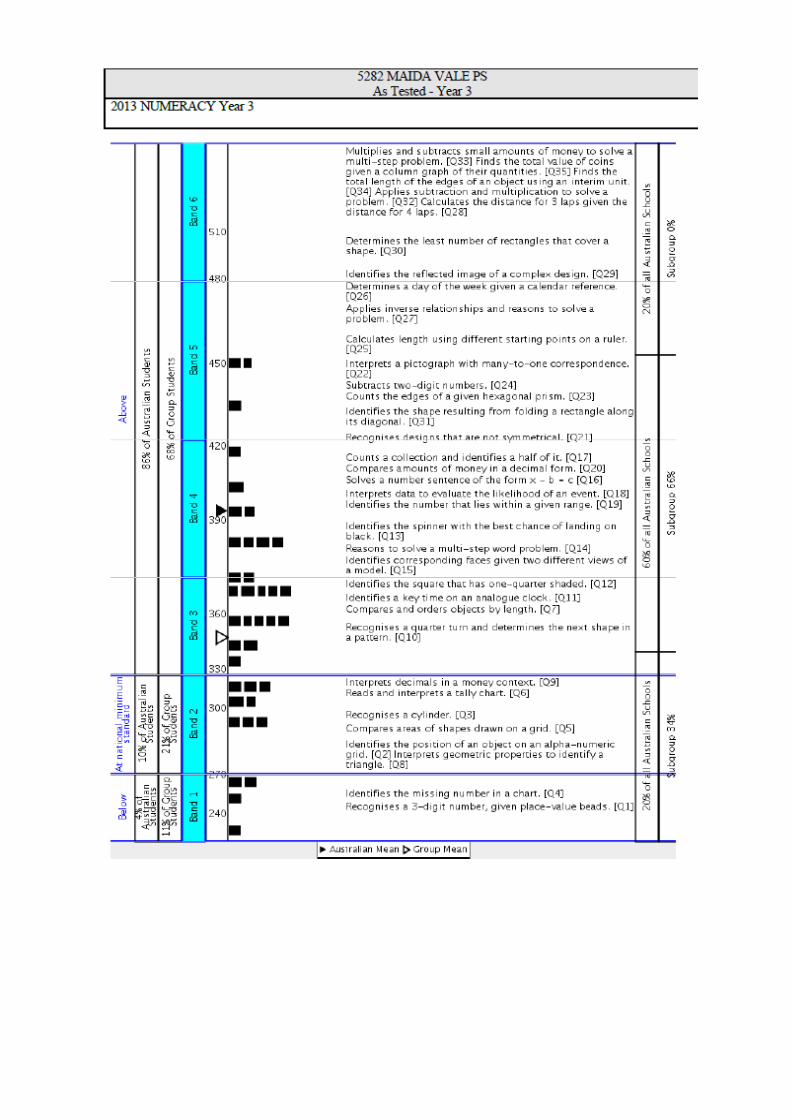
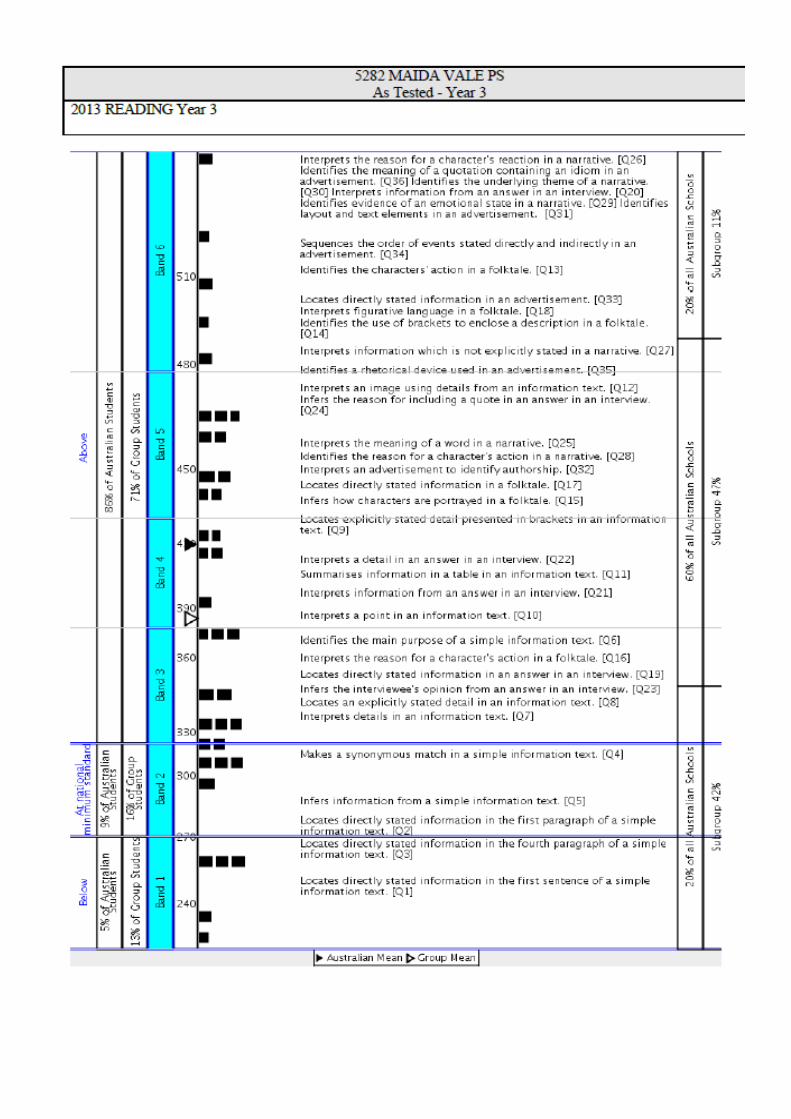
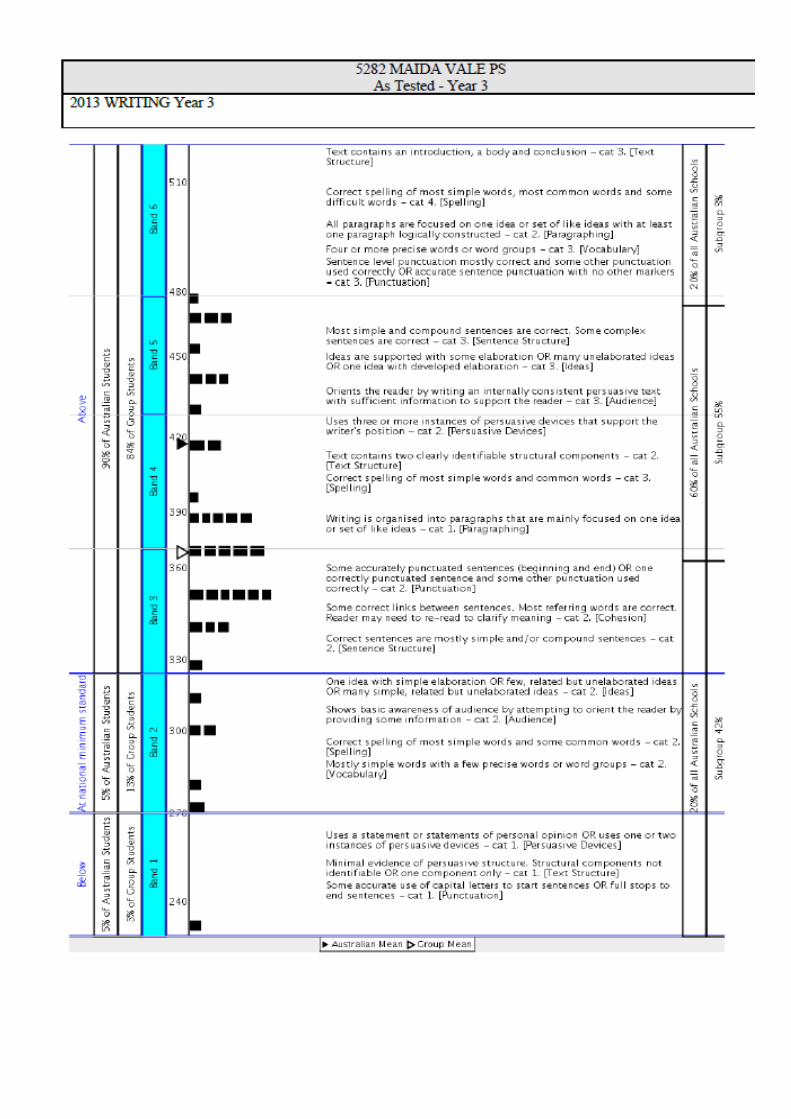
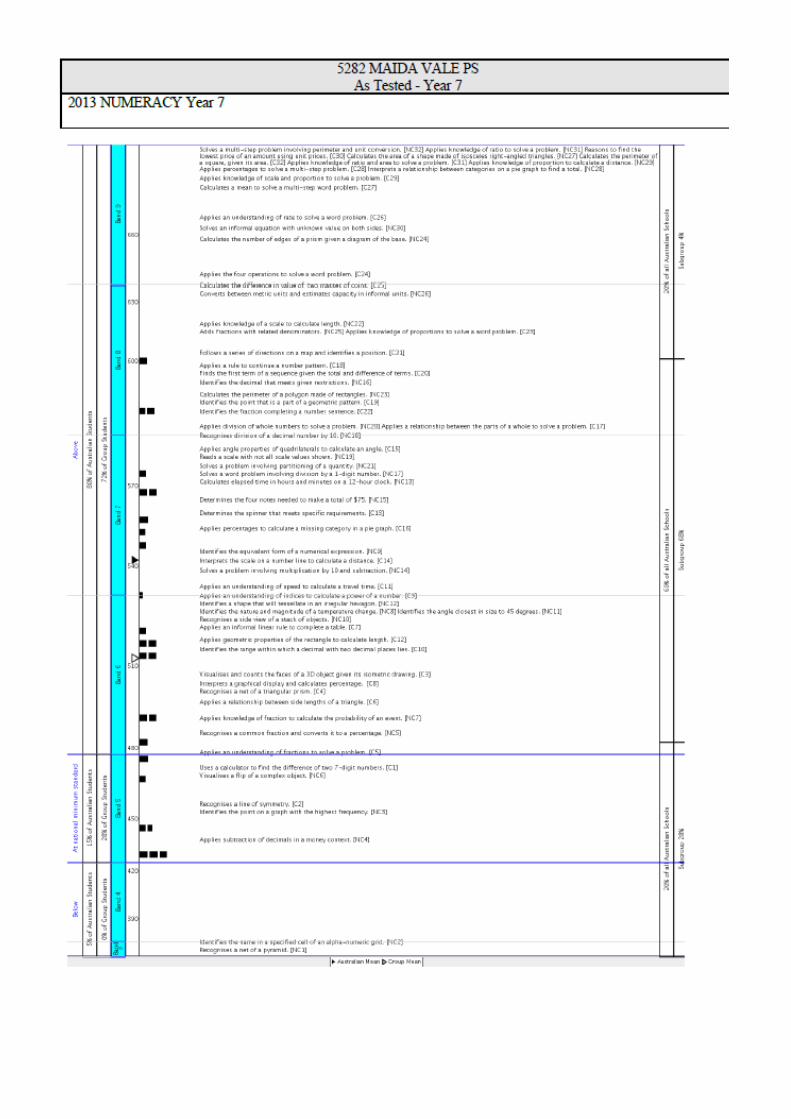
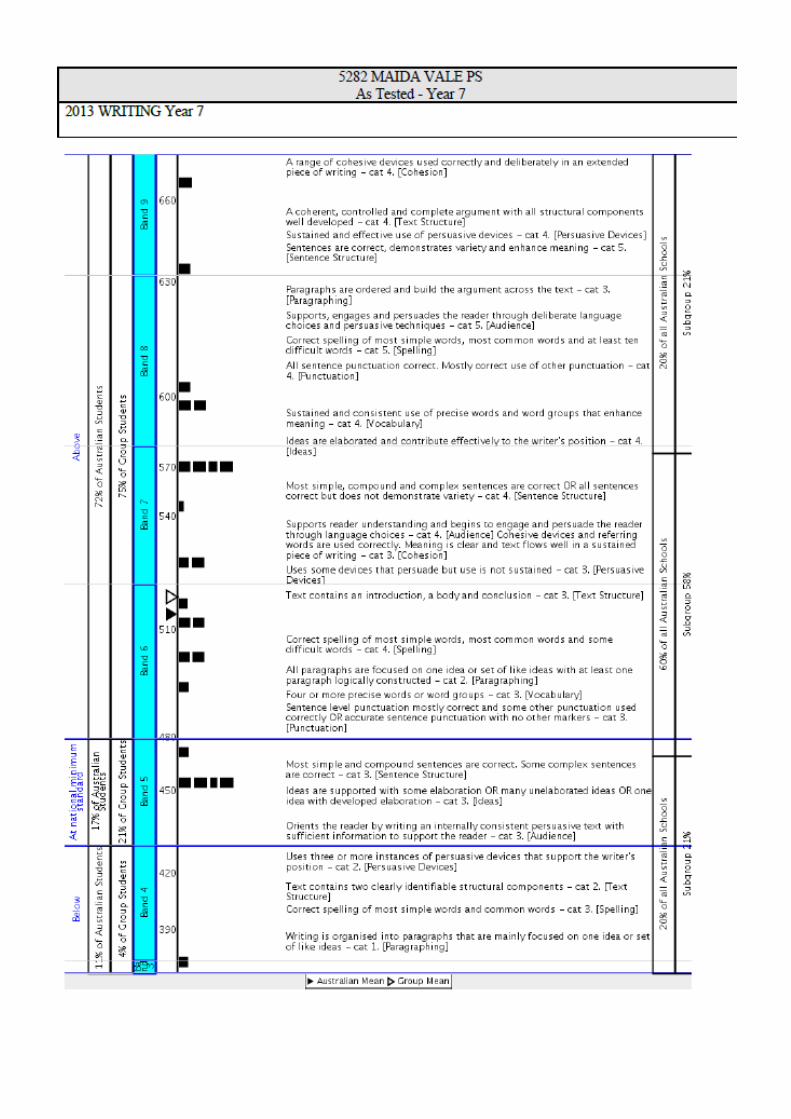
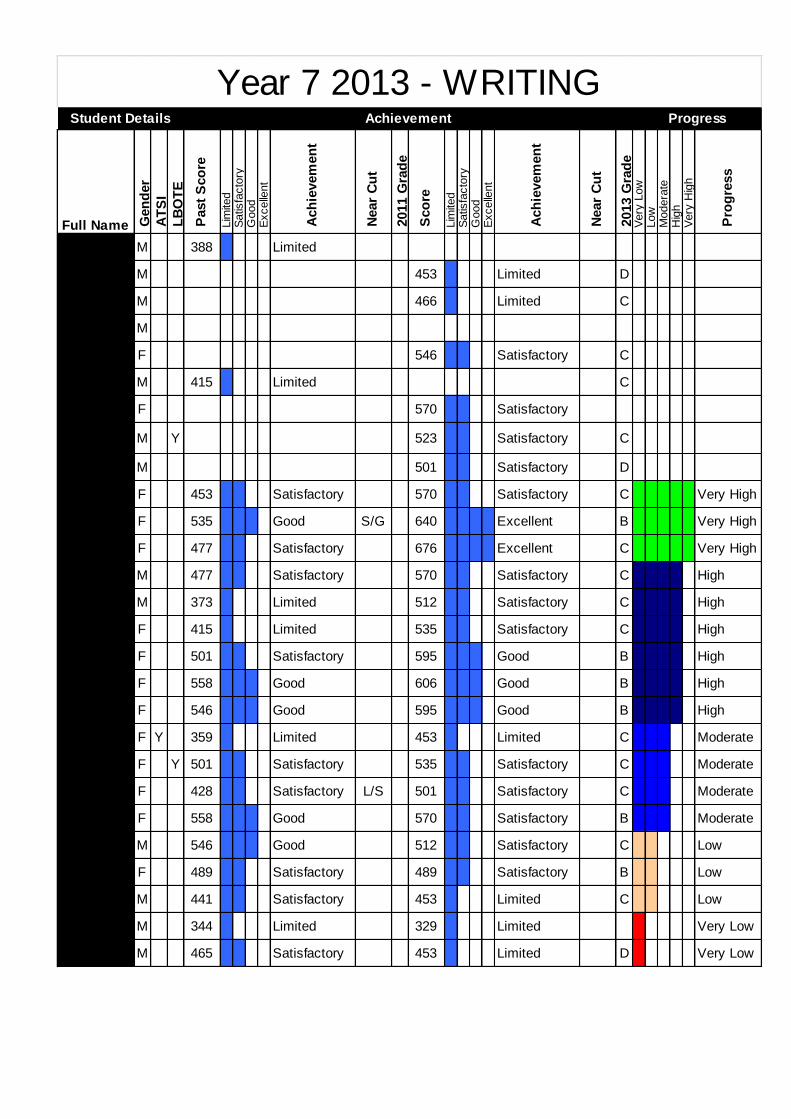
Distribution Tables The following pages focus upon the key test areas of Numeracy, Reading and Writing. The distribution tables depict the spread of students against the hierarchy of concepts with simplest from the bottom to most complex at the top. The tables, along with the box and whisker graph, show a long tail across all areas that need to be decreased.
In 2014, along with the already identified actions, the classes of NAPLAN years will;
Embrace the preparation program as outlined by Department of Education. Conduct mock test conditions using previous test, and Understanding of NAPLAN supervision and level of assistance by the teachers will be
enhanced in 2014. Teachers to teach specific problem solving strategies in Mathematics. Following a team review of 3 years of NAPLAN data the following areas were identified
as historically causing issues for students, they are now focus areas in the Operational Plan:
Fractions (equal parts, comparing, ordering etc) Time (analogue clock and variety of vocab use) Money (cents in a dollar, decimals and money, counting coin, giving
change) Measurement (using cm & mm) Space ( 2D & 3D concepts such as flip, slide, turn) Number lines (without calibration and decimals) Interpreting data in graphical/ table form with focus on reading keys and
relevant data.
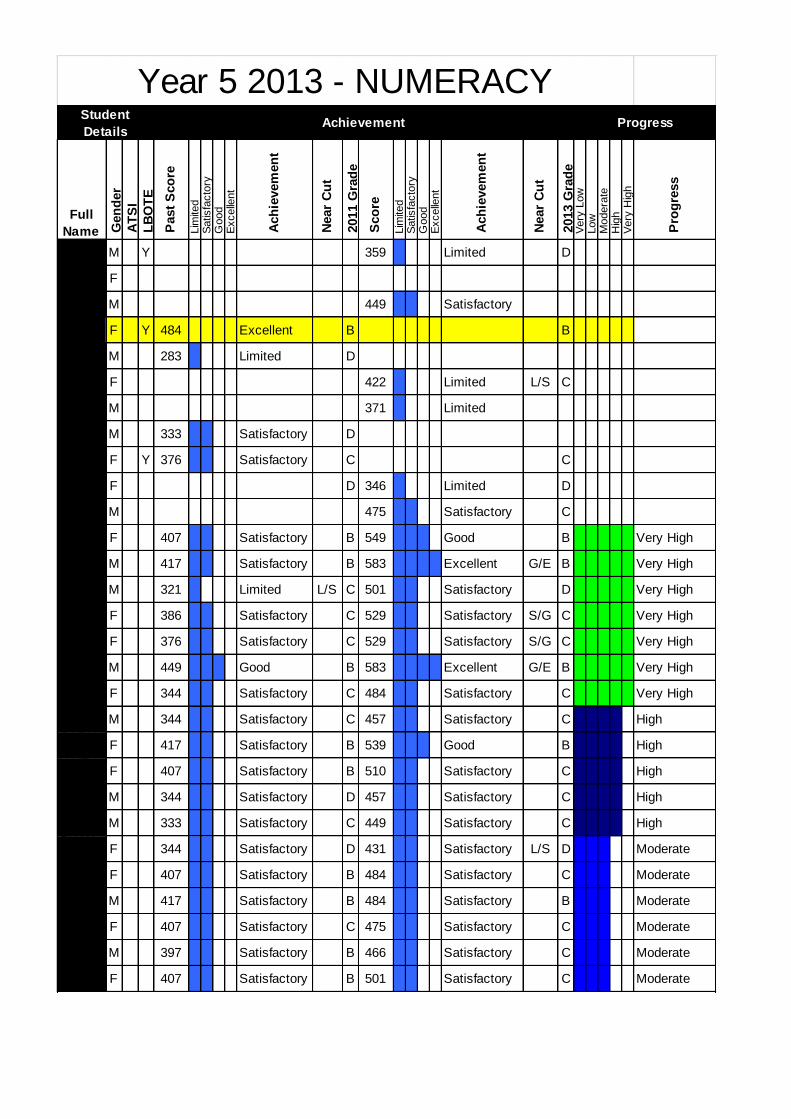
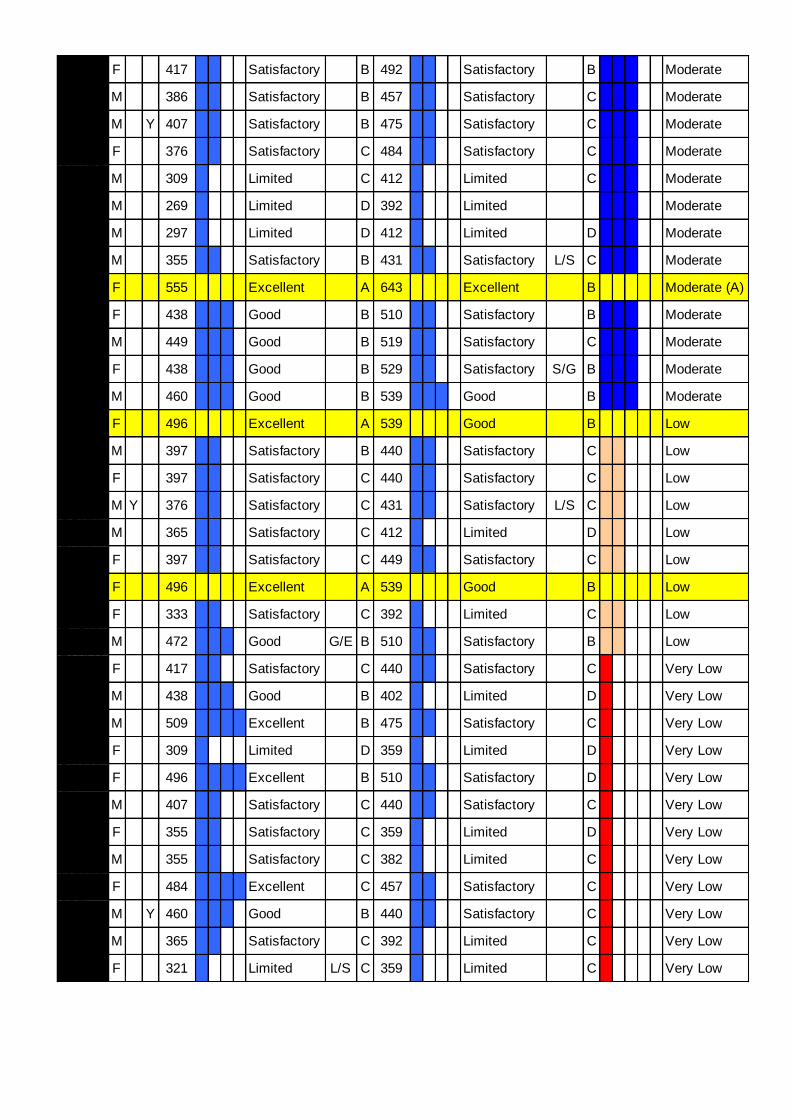
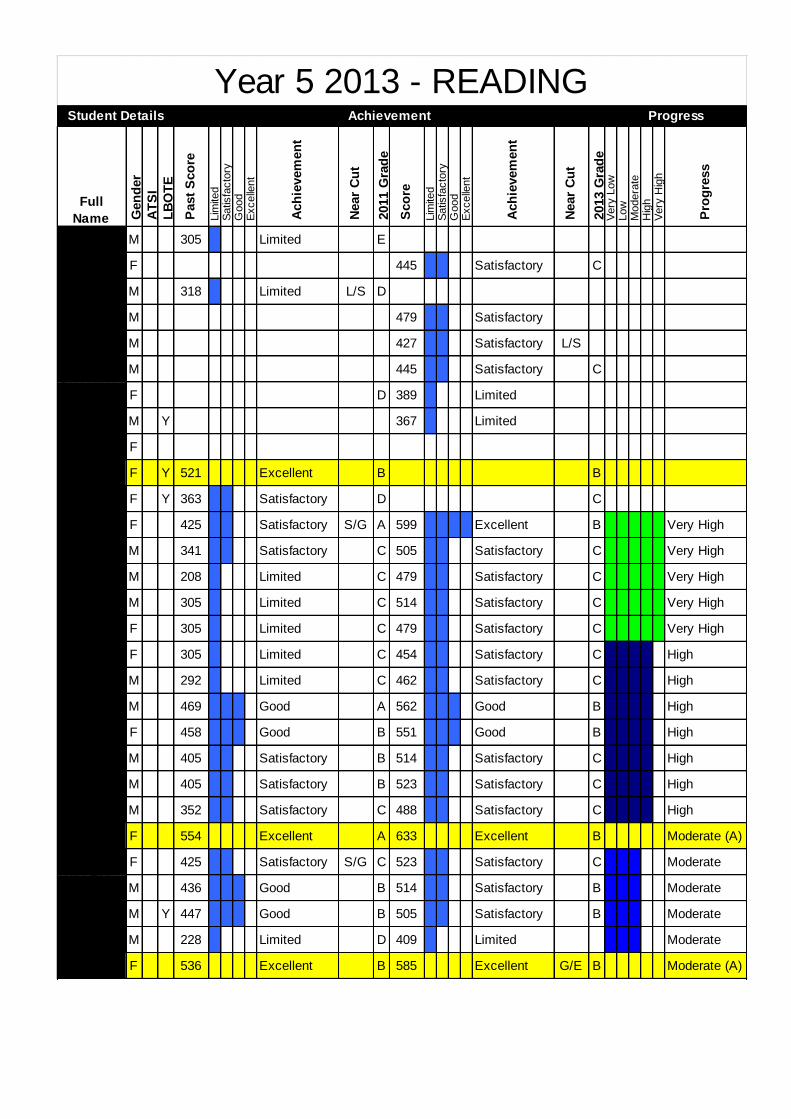
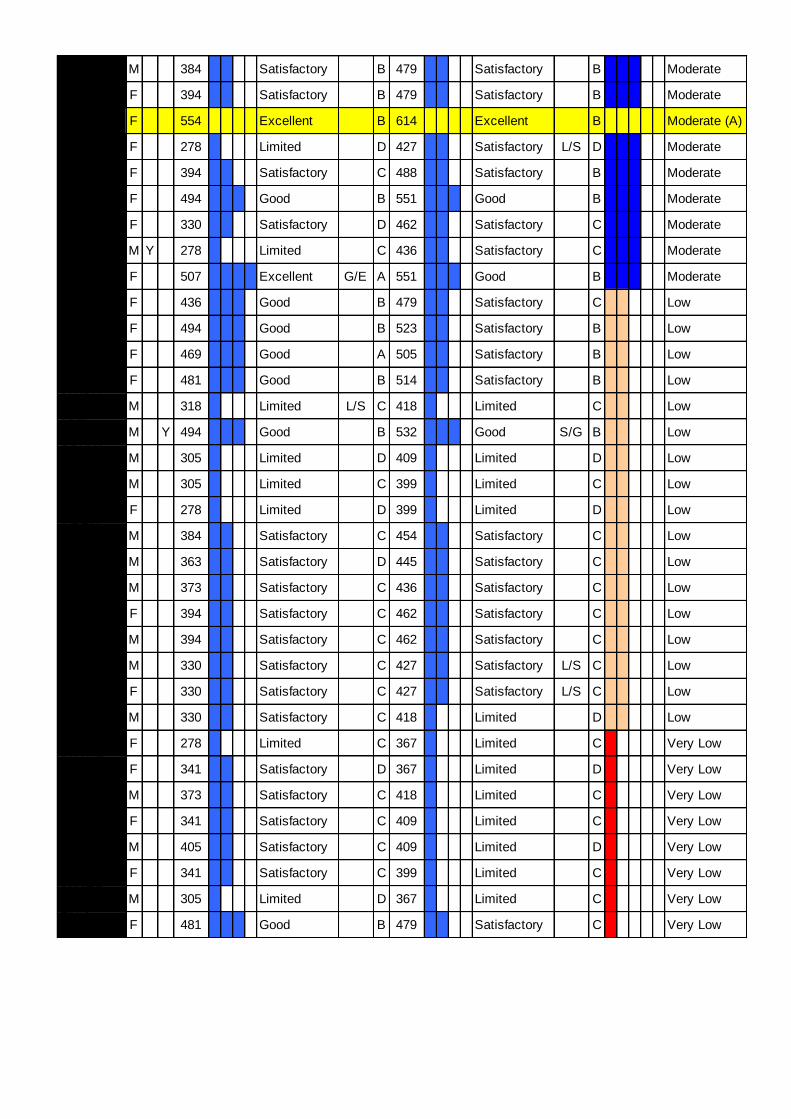
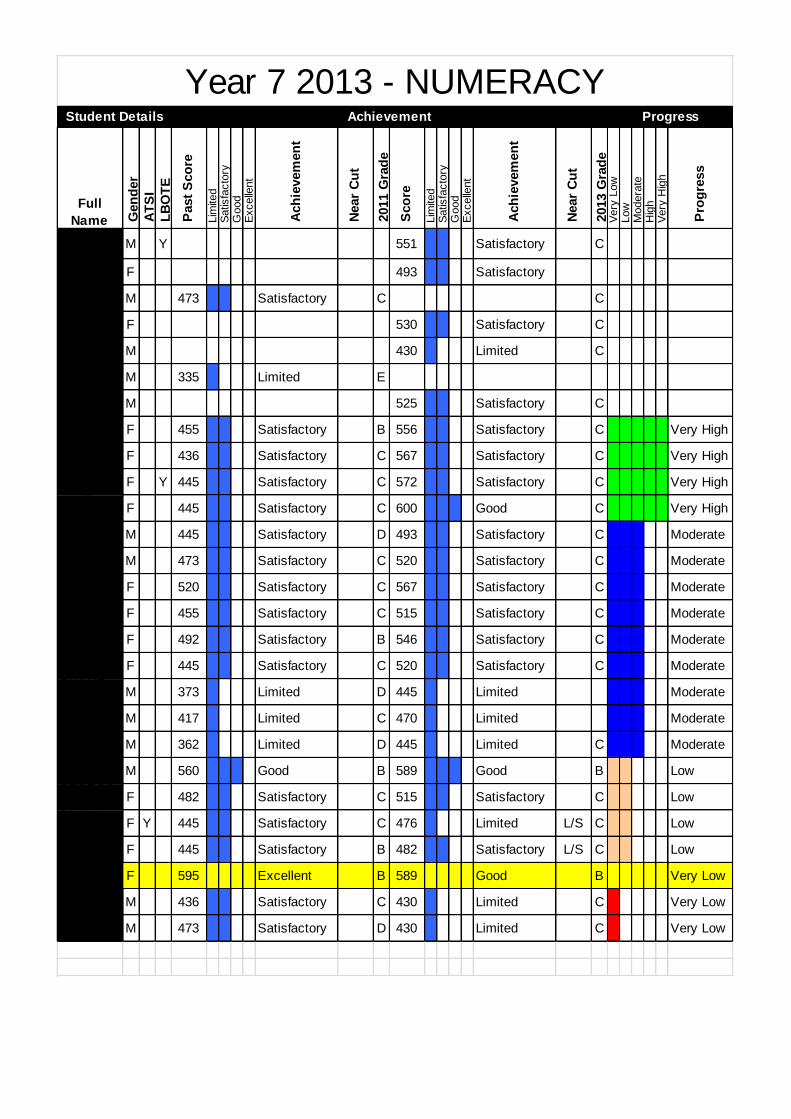
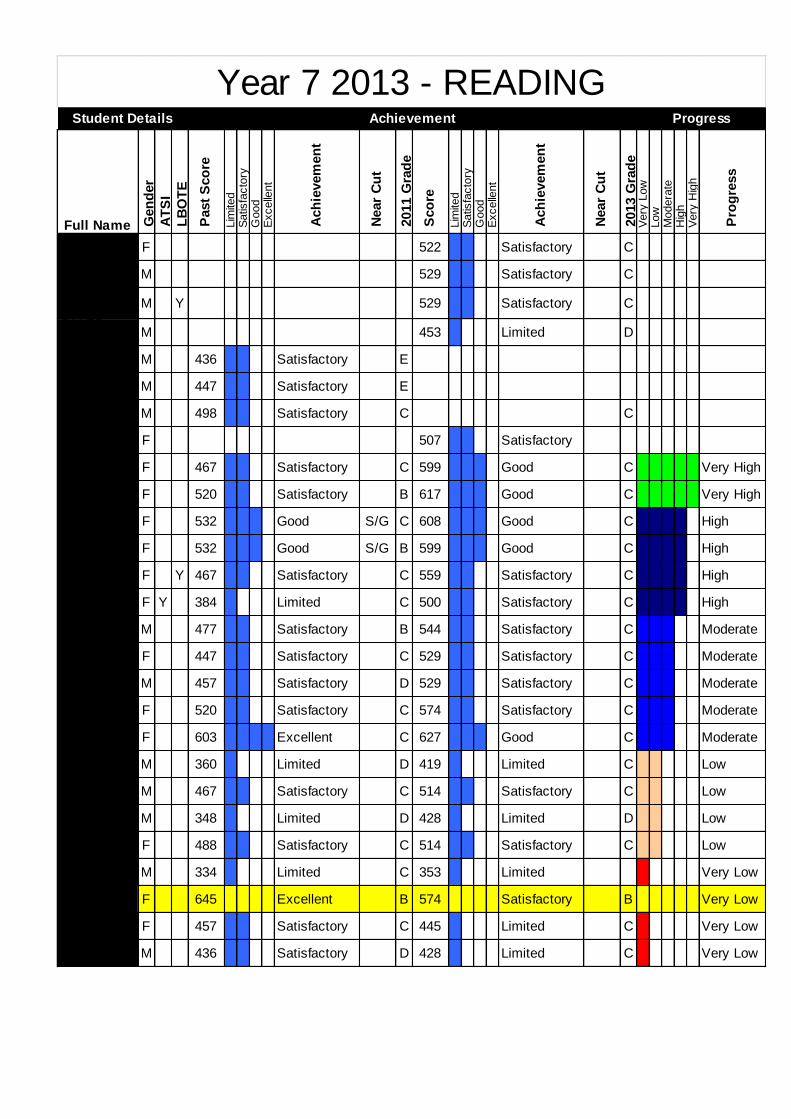
Value adding Table These tables show students with High Progress down to Very Low. Those students who have significantly increased their ‘value adding’ results. These results provide encouragement to teachers and comfort to parents as many of them are identified as students on the fringe of either top 20% or in the identified ‘push’ group. They also worked hard over the in between year and as a result lifted their results, particularly those identified in the Year 5 cohort. Also identified (yellow highlight) are students whose progress has not been deemed high however this as a result of their achievement in the previous NAPLAN cycle e.g. Year 5 to 7. Such identified students are a result of ‘topping’ out the test in an earlier grade. As a result progress appears limited however the reality is that they are still performing at peak performance. To increase the evidence of value adding for students the school has;
Established clear target students for reading and numeracy.
Created individual benchmarks for students to achieve (sight words, oral reading and comprehension, tables automaticity) that are measured in late Term 2, individualised targets set and then re-measured late Term 4.
Performance Management discussions around target students.
Full
Name Gen
der
AT
SI
LB
OT
E
Past
Sco
re
Lim
ited
Satis
facto
ry G
ood
Excelle
nt
Ach
ievem
en
t
Near
Cu
t
2011 G
rad
e
Sco
re
Lim
ited
Satis
facto
ry G
ood
Excelle
nt
Ach
ievem
en
t
Near
Cu
t
2013 G
rad
e V
ery
Low
Low
Modera
te H
igh
Very
Hig
h
Pro
gre
ss
IHAIA-
LEI M Y 359 Limited D
BRITTA
NY F
BLAKE
JELANM 449 Satisfactory
HOPE
JOSEPF Y 484 Excellent B B
SAMU
EL M 283 Limited D
MADE
LYN F 422 Limited L/S C
JAMIE
CROWM 371 Limited
COOP
ER M 333 Satisfactory D
BELIZ
OZDOF Y 376 Satisfactory C C
SHAMI
KA F D 346 Limited D
ROSS
KEARM 475 Satisfactory C
TAYA
DE LA F 407 Satisfactory B 549 Good B Very High
ZAINE
DUNCM 417 Satisfactory B 583 Excellent G/E B Very High
BAILE
Y-JAY M 321 Limited L/S C 501 Satisfactory D Very High
TE-
AROHF 386 Satisfactory C 529 Satisfactory S/G C Very High
IMOGE
N F 376 Satisfactory C 529 Satisfactory S/G C Very High
TYLER
JONESM 449 Good B 583 Excellent G/E B Very High
TAYLA
WOOLF 344 Satisfactory C 484 Satisfactory C Very High
CONN
OR M 344 Satisfactory C 457 Satisfactory C High
CARM
EN F 417 Satisfactory B 539 Good B High
KAITLY
N F 407 Satisfactory B 510 Satisfactory C High
NATHA
N M 344 Satisfactory D 457 Satisfactory C High
HARR
Y M 333 Satisfactory C 449 Satisfactory C High
SHAY
E F 344 Satisfactory D 431 Satisfactory L/S D Moderate
SHAN
NON F 407 Satisfactory B 484 Satisfactory C Moderate
REEC
E M 417 Satisfactory B 484 Satisfactory B Moderate
ELLAIN
A F 407 Satisfactory C 475 Satisfactory C Moderate
JAYDE
N M 397 Satisfactory B 466 Satisfactory C Moderate
ALYSS
A F 407 Satisfactory B 501 Satisfactory C Moderate
Student
DetailsAchievement Progress
Year 5 2013 - NUMERACY
ERIN
ROVAF 417 Satisfactory B 492 Satisfactory B Moderate
MATTH
EW M 386 Satisfactory B 457 Satisfactory C Moderate
STEFA
N M Y 407 Satisfactory B 475 Satisfactory C Moderate
ELLIE
TODDF 376 Satisfactory C 484 Satisfactory C Moderate
JAMES
BYRNM 309 Limited C 412 Limited C Moderate
BRAN
DON M 269 Limited D 392 Limited Moderate
MATTH
EW M 297 Limited D 412 Limited D Moderate
OWEN
HOWEM 355 Satisfactory B 431 Satisfactory L/S C Moderate
TAYLA
H F 555 Excellent A 643 Excellent B Moderate (A)
AARI
JOOSTF 438 Good B 510 Satisfactory B Moderate
CORBI
N M 449 Good B 519 Satisfactory C Moderate
LOUIS
A F 438 Good B 529 Satisfactory S/G B Moderate
WILLE
M M 460 Good B 539 Good B Moderate
EMMA
NANUTF 496 Excellent A 539 Good B Low
ZACK
HEARTM 397 Satisfactory B 440 Satisfactory C Low
OLIVIA
KUNSTF 397 Satisfactory C 440 Satisfactory C Low
HARRI
SON M Y 376 Satisfactory C 431 Satisfactory L/S C Low
CONN
A M 365 Satisfactory C 412 Limited D Low
ELLA
CONLEF 397 Satisfactory C 449 Satisfactory C Low
EBON
Y F 496 Excellent A 539 Good B Low
OLIVIA
MAZZUF 333 Satisfactory C 392 Limited C Low
THOM
AS M 472 Good G/E B 510 Satisfactory B Low
TAHLY
A F 417 Satisfactory C 440 Satisfactory C Very Low
AIDEN
DINELM 438 Good B 402 Limited D Very Low
JAXON
TROUM 509 Excellent B 475 Satisfactory C Very Low
ABBY
DE LA F 309 Limited D 359 Limited D Very Low
SHANI
A HILLF 496 Excellent B 510 Satisfactory D Very Low
JY
GARBIM 407 Satisfactory C 440 Satisfactory C Very Low
ELISE
ARMSF 355 Satisfactory C 359 Limited D Very Low
BENJA
MIN M 355 Satisfactory C 382 Limited C Very Low
MONIQ
UE F 484 Excellent C 457 Satisfactory C Very Low
JOEL
VERTEM Y 460 Good B 440 Satisfactory C Very Low
CHAN
DLER M 365 Satisfactory C 392 Limited C Very Low
CHEY
ENNE F 321 Limited L/S C 359 Limited C Very Low
Full
Name Gen
der
AT
SI
LB
OT
E
Past
Sco
re
Lim
ited
Satis
facto
ry G
ood
Excelle
nt
Ach
ievem
en
t
Near
Cu
t
2011 G
rad
e
Sco
re
Lim
ited
Satis
facto
ry G
ood
Excelle
nt
Ach
ievem
en
t
Near
Cu
t
2013 G
rad
e V
ery
Low
Low
Modera
te H
igh
Very
Hig
h
Pro
gre
ss
SAMUEL
WOOLAWM 305 Limited E
MADELYN
CARVOLTF 445 Satisfactory C
COOPER
BROWNM 318 Limited L/S D
JAMIE
CROWEM 479 Satisfactory
BLAKE
JELANCICM 427 Satisfactory L/S
ROSS
KEARNSM 445 Satisfactory C
SHAMIKA
PRIETOF D 389 Limited
IHAIA-LEI
KAMIZONM Y 367 Limited
BRITTANY
JOHNSONF
HOPE
JOSEPHF Y 521 Excellent B B
BELIZ
OZDOVENF Y 363 Satisfactory D C
CARMEN
DUGGANF 425 Satisfactory S/G A 599 Excellent B Very High
BAILEY-
JAY M 341 Satisfactory C 505 Satisfactory C Very High
HARRY
ZLAMAN-M 208 Limited C 479 Satisfactory C Very High
NATHAN
MARTINM 305 Limited C 514 Satisfactory C Very High
SHANIA
HILLF 305 Limited C 479 Satisfactory C Very High
IMOGEN
WILKEYF 305 Limited C 454 Satisfactory C High
CHANDLE
R M 292 Limited C 462 Satisfactory C High
TYLER
JONESM 469 Good A 562 Good B High
ELLIE
TODDF 458 Good B 551 Good B High
ZACK
HEARTM 405 Satisfactory B 514 Satisfactory C High
REECE
HUISMANM 405 Satisfactory B 523 Satisfactory C High
MATTHE
W M 352 Satisfactory C 488 Satisfactory C High
TAYLAH
KARRANF 554 Excellent A 633 Excellent B Moderate (A)
TE-
AROHA F 425 Satisfactory S/G C 523 Satisfactory C Moderate
WILLEM
BRODIEM 436 Good B 514 Satisfactory B Moderate
STEFAN
STEKOVIM Y 447 Good B 505 Satisfactory B Moderate
BRANDON
MASTERSM 228 Limited D 409 Limited Moderate
KAITLYN
GREYF 536 Excellent B 585 Excellent G/E B Moderate (A)
Year 5 2013 - READINGStudent Details Achievement Progress
ZAINE
DUNCANM 384 Satisfactory B 479 Satisfactory B Moderate
SHANNON
GRECHF 394 Satisfactory B 479 Satisfactory B Moderate
AARI
JOOSTE-F 554 Excellent B 614 Excellent B Moderate (A)
ABBY DE
LA PAIRF 278 Limited D 427 Satisfactory L/S D Moderate
ELLAINA
KANEF 394 Satisfactory C 488 Satisfactory B Moderate
TAYA DE
LA PAIRF 494 Good B 551 Good B Moderate
OLIVIA
MAZZUCCF 330 Satisfactory D 462 Satisfactory C Moderate
HARRISO
N WHITEM Y 278 Limited C 436 Satisfactory C Moderate
EMMA
NANUTF 507 Excellent G/E A 551 Good B Moderate
ALYSSA
ROBERTSF 436 Good B 479 Satisfactory C Low
ERIN
ROVACSEF 494 Good B 523 Satisfactory B Low
EBONY
ROWLANF 469 Good A 505 Satisfactory B Low
LOUISA
SIECZKAF 481 Good B 514 Satisfactory B Low
JAXON
TROUGHTM 318 Limited L/S C 418 Limited C Low
JOEL
VERTERAM Y 494 Good B 532 Good S/G B Low
CONNA
SCHMITZM 305 Limited D 409 Limited D Low
MATTHE
W M 305 Limited C 399 Limited C Low
CHEYENN
E F 278 Limited D 399 Limited D Low
AIDEN
DINELEYM 384 Satisfactory C 454 Satisfactory C Low
JY
GARBINM 363 Satisfactory D 445 Satisfactory C Low
THOMAS
HILDITCHM 373 Satisfactory C 436 Satisfactory C Low
OLIVIA
KUNSTLINF 394 Satisfactory C 462 Satisfactory C Low
JAYDEN
NIBLOCKM 394 Satisfactory C 462 Satisfactory C Low
BENJAMI
N SHIERM 330 Satisfactory C 427 Satisfactory L/S C Low
TAYLA
WOOLAWF 330 Satisfactory C 427 Satisfactory L/S C Low
OWEN
HOWELLSM 330 Satisfactory C 418 Limited D Low
TAHLYA
DICKSONF 278 Limited C 367 Limited C Very Low
SHAYE
DICKSONF 341 Satisfactory D 367 Limited D Very Low
CORBIN
MICHAELM 373 Satisfactory C 418 Limited C Very Low
ELISE
ARMSTEAF 341 Satisfactory C 409 Limited C Very Low
CONNOR
DAVEYM 405 Satisfactory C 409 Limited D Very Low
MONIQUE
INNAMORF 341 Satisfactory C 399 Limited C Very Low
JAMES
BYRNEM 305 Limited D 367 Limited C Very Low
ELLA
CONLEYF 481 Good B 479 Satisfactory C Very Low
Full
Name Gen
der
AT
SI
LB
OT
E
Past
Sco
re
Lim
ited
Satis
facto
ry G
ood
Excelle
nt
Ach
ievem
en
t
Near
Cu
t
2011 G
rad
e
Sco
re
Lim
ited
Satis
facto
ry G
ood
Excelle
nt
Ach
ievem
en
t
Near
Cu
t
2013 G
rad
e V
ery
Low
Low
Modera
te H
igh
Very
Hig
h
Pro
gre
ss
SAMU
EL M 95 Limited
MADE
LYN F 466 Satisfactory B
COOP
ER M 285 Limited
JAMIE
CROWM 466 Satisfactory
ABBY
DE LA F 466 Satisfactory D
BLAK
E M 388 Limited
ROSS
KEARM 402 Limited D
IHAIA-
LEI M Y 271 Limited
SHAMI
KA F 344 Limited
BRITT
ANY F
HOPE
JOSEF Y 453 Good B
BELIZ
OZDOF Y 359 Satisfactory C
TAYLA
WOOLF 285 Limited 535 Good S/G C Very High
TE-
AROHF 373 Satisfactory 570 Good C Very High
LOUIS
A F 501 Excellent 570 Good B High
ELLA
CONLF 477 Good G/E 546 Good C High
ERIN
ROVAF 465 Good 535 Good S/G B High
EBON
Y F 441 Good 523 Satisfactory B High
ELISE
ARMSF 373 Satisfactory 477 Satisfactory C High
ZAINE
DUNCM 402 Satisfactory 501 Satisfactory B High
KAITL
YN F 388 Satisfactory 489 Satisfactory B High
ELLAI
NA F 402 Satisfactory 501 Satisfactory C High
NATH
AN M 359 Satisfactory 477 Satisfactory C High
ELLIE
TODDF 373 Satisfactory 489 Satisfactory C High
JOEL
VERTM Y 402 Satisfactory 501 Satisfactory B High
IMOG
EN F 359 Satisfactory 466 Satisfactory C High
WILLE
M M 428 Good S/G 523 Satisfactory B High
CORBI
N M 202 Limited 374 Limited C High
TYLER
JONEM 428 Good S/G 501 Satisfactory B Moderate
SHANI
A HILLF 428 Good S/G 477 Satisfactory C Moderate
Year 5 2013 - WRITINGStudent
DetailsAchievement Progress
CHEY
ENNE F 359 Satisfactory 415 Limited C Moderate
AARI
JOOSF 489 Excellent 523 Satisfactory A Moderate
THOM
AS M 465 Good 523 Satisfactory C Moderate
BAILE
Y-JAY M 388 Satisfactory 466 Satisfactory D Moderate
CONN
OR M 373 Satisfactory 428 Satisfactory L/S D Moderate
TAHLY
A F 415 Satisfactory 466 Satisfactory C Moderate
AIDEN
DINELM 402 Satisfactory 477 Satisfactory D Moderate
JY
GARBIM 402 Satisfactory 453 Satisfactory C Moderate
SHAN
NON F 415 Satisfactory 477 Satisfactory C Moderate
ZACK
HEARM 402 Satisfactory 466 Satisfactory C Moderate
REEC
E M 415 Satisfactory 489 Satisfactory C Moderate
OLIVIA
KUNSF 415 Satisfactory 466 Satisfactory C Moderate
ALYS
SA F 373 Satisfactory 441 Satisfactory C Moderate
STEF
AN M Y 402 Satisfactory 477 Satisfactory C Moderate
JAXON
TROUM 402 Satisfactory 466 Satisfactory C Moderate
CARM
EN F 441 Good 501 Satisfactory B Moderate
JAME
S M 373 Satisfactory 441 Satisfactory C Moderate
TAYA
DE LA F 465 Good 466 Satisfactory B Low
OLIVIA
MAZZF 428 Good S/G 453 Satisfactory C Low
SHAY
E F 402 Satisfactory 428 Satisfactory L/S D Low
HARRI
SON M Y 359 Satisfactory 388 Limited B Low
OWEN
HOWEM 373 Satisfactory 415 Limited C Low
MATT
HEW M 314 Limited 374 Limited C Low
TAYLA
H F 489 Excellent 501 Satisfactory B Low
EMMA
NANUF 489 Excellent 501 Satisfactory B Low
BENJ
AMIN M 388 Satisfactory 402 Limited C Very Low
HARR
Y M 415 Satisfactory 402 Limited C Very Low
CHAN
DLER M 314 Limited 300 Limited C Very Low
MONI
QUE F 428 Good S/G 428 Satisfactory L/S C Very Low
CONN
A M 415 Satisfactory 415 Limited C Very Low
MATT
HEW M 415 Satisfactory 402 Limited D Very Low
BRAN
DON M 300 Limited 329 Limited Very Low
JAYD
EN M 512 Excellent 453 Satisfactory C Very Low
Full
Name Gen
der
AT
SI
LB
OT
E
Past
Sco
re
Lim
ited
Satis
facto
ry G
ood
Excelle
nt
Ach
ievem
en
t
Near
Cu
t
2011 G
rad
e
Sco
re
Lim
ited
Satis
facto
ry G
ood
Excelle
nt
Ach
ievem
en
t
Near
Cu
t
2013 G
rad
e V
ery
Low
Low
Modera
te H
igh
Very
Hig
h
Pro
gre
ss
JOSHUA-
JAMES M Y 551 Satisfactory C
CASSIE
CROWEF 493 Satisfactory
JAYDEN
TUNNICLIM 473 Satisfactory C C
ISAAK
JELANCIF 530 Satisfactory C
CALEB
RURIM 430 Limited C
MATTHE
W M 335 Limited E
MARCUS
JOHNSOM 525 Satisfactory C
KAY-LIN
MCDONAF 455 Satisfactory B 556 Satisfactory C Very High
BIANCA
MARTINF 436 Satisfactory C 567 Satisfactory C Very High
YEMSRA
CH F Y 445 Satisfactory C 572 Satisfactory C Very High
AMIE
ROGERSF 445 Satisfactory C 600 Good C Very High
DENZIL
BROWNM 445 Satisfactory D 493 Satisfactory C Moderate
ANTHON
Y BURKEM 473 Satisfactory C 520 Satisfactory C Moderate
PAIGE
DONALDF 520 Satisfactory C 567 Satisfactory C Moderate
KHAYLA
ELLIOTTF 455 Satisfactory C 515 Satisfactory C Moderate
CAITLIN
SUTHERLF 492 Satisfactory B 546 Satisfactory C Moderate
PAIGE
WILLIAMF 445 Satisfactory C 520 Satisfactory C Moderate
SHANE
BLOOMFIM 373 Limited D 445 Limited Moderate
ZACHAR
Y STIVEYM 417 Limited C 470 Limited Moderate
JESSE
SHIERM 362 Limited D 445 Limited C Moderate
JAKE
KAUFMAM 560 Good B 589 Good B Low
REBECC
A F 482 Satisfactory C 515 Satisfactory C Low
TAYLA
WOODINF Y 445 Satisfactory C 476 Limited L/S C Low
CHLOE
GRECHF 445 Satisfactory B 482 Satisfactory L/S C Low
CAITLYN
TURLEYF 595 Excellent B 589 Good B Very Low
ALEX
HARRISM 436 Satisfactory C 430 Limited C Very Low
CALEM
MELLOWM 473 Satisfactory D 430 Limited C Very Low
Year 7 2013 - NUMERACYStudent Details Achievement Progress
Full Name Gen
der
AT
SI
LB
OT
E
Past
Sco
re
Lim
ited
Satis
facto
ry G
ood
Excelle
nt
Ach
ievem
en
t
Near
Cu
t
2011 G
rad
e
Sco
re
Lim
ited
Satis
facto
ry G
ood
Excelle
nt
Ach
ievem
en
t
Near
Cu
t
2013 G
rad
e V
ery
Low
Low
Modera
te H
igh
Very
Hig
h
Pro
gre
ss
ISAAK
JELANCICF 522 Satisfactory C
MARCUS
JOHNSONM 529 Satisfactory C
JOSHUA-
JAMES M Y 529 Satisfactory C
CALEB
RURIM 453 Limited D
SHANE
BLOOMFIEM 436 Satisfactory E
MATTHEW
CHAPMANM 447 Satisfactory E
JAYDEN
TUNNICLIFFM 498 Satisfactory C C
CASSIE
CROWEF 507 Satisfactory
AMIE
ROGERSF 467 Satisfactory C 599 Good C Very High
PAIGE
DONALDSOF 520 Satisfactory B 617 Good C Very High
CAITLIN
SUTHERLAF 532 Good S/G C 608 Good C High
KAY-LIN
MCDONAGF 532 Good S/G B 599 Good C High
YEMSRAC
H F Y 467 Satisfactory C 559 Satisfactory C High
TAYLA
WOODINGF Y 384 Limited C 500 Satisfactory C High
JAKE
KAUFMANNM 477 Satisfactory B 544 Satisfactory C Moderate
KHAYLA
ELLIOTTF 447 Satisfactory C 529 Satisfactory C Moderate
DENZIL
BROWNM 457 Satisfactory D 529 Satisfactory C Moderate
REBECCA
HOWELLSF 520 Satisfactory C 574 Satisfactory C Moderate
BIANCA
MARTINF 603 Excellent C 627 Good C Moderate
JESSE
SHIERM 360 Limited D 419 Limited C Low
ANTHONY
BURKEM 467 Satisfactory C 514 Satisfactory C Low
CALEM
MELLOWSM 348 Limited D 428 Limited D Low
CHLOE
GRECHF 488 Satisfactory C 514 Satisfactory C Low
ZACHARY
STIVEYM 334 Limited C 353 Limited Very Low
CAITLYN
TURLEYF 645 Excellent B 574 Satisfactory B Very Low
PAIGE
WILLIAMSOF 457 Satisfactory C 445 Limited C Very Low
ALEX
HARRISM 436 Satisfactory D 428 Limited C Very Low
Year 7 2013 - READINGStudent Details Achievement Progress
Full Name Gen
der
AT
SI
LB
OT
E
Past
Sco
re
Lim
ited
Satis
facto
ry G
ood
Excelle
nt
Ach
ievem
en
t
Near
Cu
t
2011 G
rad
e
Sco
re
Lim
ited
Satis
facto
ry G
ood
Excelle
nt
Ach
ievem
en
t
Near
Cu
t
2013 G
rad
e V
ery
Low
Low
Modera
te H
igh
Very
Hig
h
Pro
gre
ss
MATTHEW
CHAPMANM 388 Limited
CALEM
MELLOWSM 453 Limited D
MARCUS
JOHNSONM 466 Limited C
SHANE
BLOOMFIEM
ISAAK
JELANCICF 546 Satisfactory C
JAYDEN
TUNNICLIFM 415 Limited C
CASSIE
CROWEF 570 Satisfactory
JOSHUA-
JAMES M Y 523 Satisfactory C
CALEB
RURIM 501 Satisfactory D
PAIGE
WILLIAMSF 453 Satisfactory 570 Satisfactory C Very High
CAITLYN
TURLEYF 535 Good S/G 640 Excellent B Very High
KAY-LIN
MCDONAGF 477 Satisfactory 676 Excellent C Very High
JAKE
KAUFMANM 477 Satisfactory 570 Satisfactory C High
DENZIL
BROWNM 373 Limited 512 Satisfactory C High
CHLOE
GRECHF 415 Limited 535 Satisfactory C High
BIANCA
MARTINF 501 Satisfactory 595 Good B High
PAIGE
DONALDSF 558 Good 606 Good B High
AMIE
ROGERSF 546 Good 595 Good B High
TAYLA
WOODINGF Y 359 Limited 453 Limited C Moderate
YEMSRAC
H F Y 501 Satisfactory 535 Satisfactory C Moderate
KHAYLA
ELLIOTTF 428 Satisfactory L/S 501 Satisfactory C Moderate
REBECCA
HOWELLSF 558 Good 570 Satisfactory B Moderate
ANTHONY
BURKEM 546 Good 512 Satisfactory C Low
CAITLIN
SUTHERLAF 489 Satisfactory 489 Satisfactory B Low
ALEX
HARRISM 441 Satisfactory 453 Limited C Low
ZACHARY
STIVEYM 344 Limited 329 Limited Very Low
JESSE
SHIERM 465 Satisfactory 453 Limited D Very Low
Year 7 2013 - WRITINGStudent Details Achievement Progress
Target 4: CLOSE THE GAP IN GRADE DISTRIBUTION WITH LIKE SCHOOLS.
Teachers have been conscious in comparing and judging student work to the standards as set by the Department of Education. In addition to this the school has participated in two ‘consistent judgement exercises’ in Literacy and Mathematic with schools from the Darling Range Network over 2012 and 2013.
This practice will continue in 2014 and will include an additional common assessment and judgement task in the Science learning area.
Results possibly reflect the lack of experience shown in two year levels due to a Graduate being in one and another teaching that year level for the first time along with only three full years experience. READING GRADE ALLOCATION Semester 2 2013
Year 1
GRADE
NA E D C B A
School 0%
(0)
0%
(0)
14.9%
(7)
46.8%
(22)
36.2%
(17)
2.1%
(1)
Like School
2.3%
(6)
0.4%
(1)
18.2%
(47)
50.4%
(130)
25.2%
(65)
3.5%
(9)
DoE 2.7%
(332)
3.1%
(381)
15.2%
(1880)
50.6%
(6259)
23.2%
(2870)
5.3%
(657)
Year 2
GRADE
NA E D C B A
School 2.2%
(1)
2.2%
(1)
13.3%
(6)
51.1%
(23)
28.9%
(13)
2.2%
(1)
Like School
0.8%
(2)
2%
(5)
14.6%
(36)
54.5%
(134)
22.4%
(55)
5.7%
(14)
DoE 2.3%
(259)
3%
(348)
14.9%
(1703)
50.1%
(5743)
23.8%
(2734)
5.9%
(680)
Year 3
GRADE
NA E D C B A
School 2.6%
(1)
0%
(0)
15.4%
(6)
41%
(16)
41%
(16)
0%
(0)
Like School
0.4%
(1)
3.8%
(10)
14.3%
(38)
54.5%
(145)
20.3%
(54)
6.8%
(18)
DoE 1.9%
(210)
2.6%
(290)
15.6%
(1731)
47.9%
(5329)
25.2%
(2801)
6.9%
(768)
Year 4
GRADE
NA E D C B A
School 3%
(1)
0%
(0)
21.2%
(7)
51.5%
(17)
18.2%
(6)
6.1%
(2)
Like School
3.8%
(10)
3.1%
(8)
18.3%
(48)
53.8%
(141)
18.7%
(49)
2.3%
(6)
DoE 2.9%
(310)
2.4%
(255)
15.1%
(1622)
48.7%
(5237)
24.8%
(2663)
6.1%
(660)
Year 5
GRADE
NA E D C B A
School 0%
(0)
0%
(0)
13.8%
(8)
60.3%
(35)
24.1%
(14)
1.7%
(1)
Like School
1.7%
(5)
1.4%
(4)
13.8%
(40)
53.3%
(154)
24.9%
(72)
4.8%
(14)
DoE 2%
(209)
2.3%
(239)
14.1%
(1453)
49.7%
(5121)
25%
(2571)
6.8%
(705)
Year 6
GRADE
NA E D C B A
School 0%
(0)
0%
(0)
12.5%
(4)
68.8%
(22)
15.6%
(5)
3.1%
(1)
Like School
2.7%
(8)
3%
(9)
16.2%
(48)
52%
(154)
20.9%
(62)
5.1%
(15)
DoE 2.6%
(268)
1.9%
(192)
14.1%
(1426)
49.3%
(4996)
25.2%
(2550)
7%
(706)
Year 7
GRADE
NA E D C B A
School 3.8%
(1)
0%
(0)
15.4%
(4)
50%
(13)
30.8%
(8)
0%
(0)
Like School
3.3%
(5)
2%
(3)
17%
(26)
48.4%
(74)
26.1%
(40)
3.3%
(5)
DoE 2.6%
(235)
2.3%
(212)
14.5%
(1328)
46.3%
(4250)
25.8%
(2373)
8.5%
(785)
NUMERACY GRADE ALLOCATION Semester 2 2013 Year 1
GRADE
NA E D C B A
School 2.1%
(1)
0%
(0)
6.4%
(3)
68.1%
(32)
21.3%
(10)
2.1%
(1)
Like School
2.1%
(7)
0.3%
(1)
10%
(34)
66.2%
(225)
18.5%
(63)
2.9%
(10)
DoE 2.3%
(273)
2.1%
(251)
12.4%
(1498)
55.9%
(6740)
22.3%
(2692)
5.1%
(610)
Year 2
GRADE
NA E D C B A
School 0%
(0)
0%
(0)
8.9%
(4)
53.3%
(24)
28.9%
(13)
8.9%
(4)
Like School
0.9%
(3)
1.9%
(6)
11.4%
(37)
62%
(201)
20.1%
(65)
3.7%
(12)
DoE 2.1%
(233)
2.4%
(266)
14.6%
(1643)
52.2%
(5859)
23.2%
(2602)
5.6%
(624)
Year 3
GRADE
NA E D C B A
School 2.6%
(1)
0%
(0)
20.5%
(8)
51.3%
(20)
25.6%
(10)
0%
(0)
Like School
0.6%
(2)
2.1%
(7)
12.1%
(40)
60.7%
(201)
20.8%
(69)
3.6%
(12)
DoE 1.9%
(204)
2.7%
(297)
15.7%
(1697)
50.4%
(5452)
22.4%
(2426)
6.8%
(731)
Year 4
GRADE
NA E D C B A
School 3%
(1)
0%
(0)
27.3%
(9)
45.5%
(15)
24.2%
(8)
0%
(0)
Like School
0.6%
(2)
3.3%
(11)
19.1%
(64)
55.5%
(186)
20.3%
(68)
1.2%
(4)
DoE 2.7%
(276)
2.8%
(296)
16.7%
(1736)
47.9%
(4977)
23.3%
(2423)
6.6%
(686)
Year 5
GRADE
NA E D C B A
School 0%
(0)
0%
(0)
12.1%
(7)
67.2%
(39)
19%
(11)
1.7%
(1)
Like School
1.1%
(4)
1.3%
(5)
18%
(68)
52.3%
(197)
23.1%
(87)
4.2%
(16)
DoE 2.4%
(241)
2.8%
(279)
17.2%
(1705)
46.8%
(4642)
22.7%
(2253)
8%
(792)
Year 6
GRADE
NA E D C B A
School 0%
(0)
0%
(0)
21.9%
(7)
59.4%
(19)
18.8%
(6)
0%
(0)
Like School
0.3%
(1)
4%
(15)
14.2%
(53)
54.4%
(203)
21.2%
(79)
5.9%
(22)
DoE 2.2%
(217)
3%
(288)
16.8%
(1629)
47.1%
(4570)
23.4%
(2268)
7.6%
(739)
Year 7
GRADE
NA E D C B A
School 3.8%
(1)
0%
(0)
3.8%
(1)
73.1%
(19)
19.2%
(5)
0%
(0)
Like School
0.9%
(2)
4.9%
(11)
19.1%
(43)
43.6%
(98)
24%
(54)
7.6%
(17)
DoE 3.1%
(274)
3%
(267)
17.5%
(1538)
41.5%
(3651)
23.9%
(2105)
10.9%
(956)
1 16,920.00$ 14,905.90$
2 30,137.00$ 30,137.19$
3 -$ -$
4 18,833.00$ 18,832.64$
5 1,189.00$ 1,189.45$
6 182,068.39$ 182,069.31$
7 -$ -$
8 -$ -$
9 4,794.00$ 4,794.22$
10 17,710.00$ 17,710.13$
11 50,398.00$ 50,397.60$
322,049.39$ 320,036.44$
35,244.00$ 35,243.95$
357,293.39$ 355,280.39$
Locally Generated Revenue69,859.40$
DoE Grants 182,069.31$
Other Govt Grants -$
Other 17,710.13$
Transfers 50,397.60$
320,036.44$
1 10,987.00$ 9,225.07$
2 -$ -$
3 52,609.84$ 53,516.18$
4 20,199.00$ 24,207.03$
5 13,397.00$ 13,396.90$
6 42,949.00$ 42,617.85$
7 119,705.00$ 104,677.74$
8 500.00$ 284.78$
9 5,045.00$ 5,045.45$
10 -$ -$
11 8,722.00$ 8,764.93$
12 78,809.00$ 78,809.00$
352,922.84$ 340,544.93$
Bank Balance 115,241.18$ Made up of: -$
1 General Fund Balance 14,735.46$ 2 Deductible Gift Funds -$ 3 Trust Funds -$ 4 Asset Replacement Reserves 101,093.82$ 5 Suspense Accounts 980.90$ 6 Cash Advances -$ 7 Tax Position 1,569.00-$