The Transition Takes Hold 2017 TRACKING THE ENERGY REVOLUTION e Point of Great Returns WHY THE CLEAN ENERGY TRANSITION NOW APPEARS IRREVERSIBLE P.1 Clean Power Holds its Edge SOLAR OUTSHINES ITS COMPETITION IN THE WORLD’S BIGGEST ELECTRICITY SYSTEMS P.2 Watch Out for Falling Prices RENEWABLES BECOME MORE COST COMPETITIVE P.6 Markets to Watch CHINA, THE U.S. AND INDIA EXAMINED P.8
Transcript
The Transition Takes Hold
2017
TRACKINGTHE ENERGYREVOLUTION
The Point of Great Returns Why the clean energy transition noW appears irreversible P.1
Clean Power Holds its Edge solar outshines its competition in the World’s biggest electricity systems P.2
Watch Out for Falling PricesreneWables become more cost competitive P.6
Markets to Watchchina, the u.s. and india examined P.8
Join the dialogue
each monday we publish the Clean Energy Review, a free digest of must-read climate and clean energy stories from across canada and around the world.
subscribe cleanenergycanada.org/review/
FolloW @cleanenergycan
liKe facebook.com/cleanenergycanada
visit cleanenergycanada.org
A Growing Global Workforce
8Markets to Watch
looking ahead
Canada’s Niche in the Clean Energy Transition
The Transition Takes Hold tracking the energy revolution 2017
All rights reserved. Permission is granted to reproduce all or part of this publication for non-commercial purposes, as long as the source is cited as “Clean Energy Canada.”
Available digitally at cleanenergycanada.org.
Source Data: All data referenced are accurate as of February 24, 2017. Financial figures are stated in 2016 Canadian dollars (unless otherwise indicated).
about Clean energy CanadaClean Energy Canada works to accelerate Canada’s transition to a clean and renewable energy system. We collaborate with civil society, governments and the private sector to build awareness of and support for solutions that address climate disruption and foster an energy-efficient, environmentally responsible and prosperous economy.
Clean Energy Canada is an initiative of the Centre for Dialogue at Simon Fraser University.
Contents1exeCutive Summary
The Point of Great Returns
2
7
Renewable Power Holds its Edge
4Leading Nations Ease Off Investment
6Watch Out for Falling Prices 12Cover photo: Monty Rakusen/Getty
TRACKING THE ENERGY REVOLUTION 2017 1
ipping points: those elusive moments when a technol-ogy goes mainstream.
Much has been written in the debate over whether renew-able energy has passed, is fast-ap-proaching, or is still a ways from crossing that threshold.
The true tipping point will only become apparent in the rearview mirror, and it won’t be defined by a single moment or
breakthrough. It will be crossed at different times, in different countries, driven by different forces. But the clean energy transi-tion now appears irreversible.
In developed and developing countries alike, fossil fuels are falling out of favour as a source of electricity. They are being beat out by renewable power that is clean, increasingly cost-competitive and a fast-growing source of economic opportunity.
The world’s three largest electric-ity markets—China, the United States and India—have aggressively pursued renewable power and were collectively responsible for half of global clean energy investment in 2016.
In both China and India, renew-able energy offers a critical solution to the pollution choking fast-growing cities. Smog has become increasingly disruptive—socially, economically and politically—closing schools in Delhi, grounding airplanes in China and contributing to the premature deaths of millions of citizens.
In the U.S., the renewable energy sector has become a major job creator: since 2009, the solar industry created one out of every 80 new jobs, and the country’s fastest-growing occupation is wind turbine technician. While President Donald Trump may have promised to bring back coal jobs, he will no doubt find re-sistance—in both Congress and statehouses—should his efforts come at the expense of clean energy jobs.
While total clean energy investment fell in 2016 from the record-breaking total in 2015, new renewable electricity capacity rivalled the previous year. Sustained policy efforts by governments, coupled with the continued drop in clean energy
technology costs, have created the conditions for more clean electrons to be squeezed out of every dollar spent.
Global growth in renewable energy remains policy-driven, but increasingly that policy is harnessing the competitive forces of the market. This approach has further driven down costs and inspired technology innovation, new business models and market design. Competitive auctions for contracts to build new renewable energy projects are leading to record-low prices that increasingly undercut their fossil fuel competitors.
But the evolution of our electricity system is not without its challenges. They range from decentralizing supply, to integrating variable sources of power like wind and solar, to building new transmission lines connecting power-rich regions with those in need of clean electrons. China serves as a good example: in some regions, wind farms and solar fields are being built faster than they can be integrated, leaving them stranded from the grid or forced to reduce output.
Investment in renewable power waned in Canada in 2016, as our electricity system is already dominated by power from fossil-free sources and electricity demand is relatively stable. But we know from experience how to harness and maximize the value of renewable electricity. We have a clean energy technology sector that punches above its weight and companies hun-gry to sell their solutions beyond our
borders. Helping other countries increase their use of renewable power may be where Canada finds its niche—and economic opportunity—in the global clean energy transition.
As the U.S. government retreats from international climate diplomacy, clean energy innovation and free trade, it leaves a gap that Canada is well-positioned to fill. And it’s clear that if we don’t step up, somebody else will.
Merran SmithExecutive DirectorClean Energy Canada
ExECUTIVE sUMMARY
The Point of Great Returns
The world’s three largest electricity markets—China, the United States and India—have aggressively pursued renewable power and were collectively responsible for half of global clean energy investment in 2016.
t
2 THE TRANsITION TAKEs HOLd
ince 2012, the world has brought more power online from renewables than fossil fuels each
year—and that trend continued in 2016. Solar had a record-breaking year, with 73 gigawatts (GW) of new capacity coming online—nearly half of the total renewable power added globally. Meanwhile, wind power had its second-best year ever, delivering over 56 GW of new capacity. Overall, the amount of new renewable power capacity installed in 2016 came in just shy of the record set in 2015, with 150 GW installed.
Renewable Power Holds its Edge
* data not yet available for Canada or globally.
source: data from Bloomberg New Energy Finance
source: Wind Europe; U.s. Energy Information Administration; China Electricity Council; Government of India, Ministry of Power, Central Electricity Authority
0
40
80
120
160
Capa
city
(GW
)
RENEWABLE ENERGY
FOSSILFUELS
2001 2008 2015
neW CaPaCity From reneWaBleS and FoSSil FuelS
Share oF neW eleCtriCity CaPaCity From reneWaBle SourCeS in 2016*
52%+21 GW +13 GW+16 GW
EU IndiaChinaUnited States86% 44%61%
+64 GW
Worldwide capacity added: 150 GW
Last year alone, the world added more clean power than we have in all of Canada today, from all sources.
S
Solar outShineS itS ComPetition in World’S largeSt eleCtriCity SyStemS
in 2015, the amount of solar power installed in china set a world record. china smashed that record again in 2016, adding 30 gW of new capacity—or roughly enough solar panels to cover three soccer fields every hour.
china wasn’t alone in the record-breaking department in 2016. in the u.s., solar installations—including both rooftop and utility-scale—nearly doubled over 2015, adding 14 gW. utility-scale solar additions of 8 gW represented 39% of new utility-scale capacity in the u.s., taking the crown as the top new source of power in the country.
in india, remarkably low-cost renewable auction bids drove new solar capacity, which more than doubled relative to 2015 to become the second-largest source of new power in the country. india also built the world’s largest solar plant, covering 10 square kilometres and providing 648 mW of clean electricity capacity.
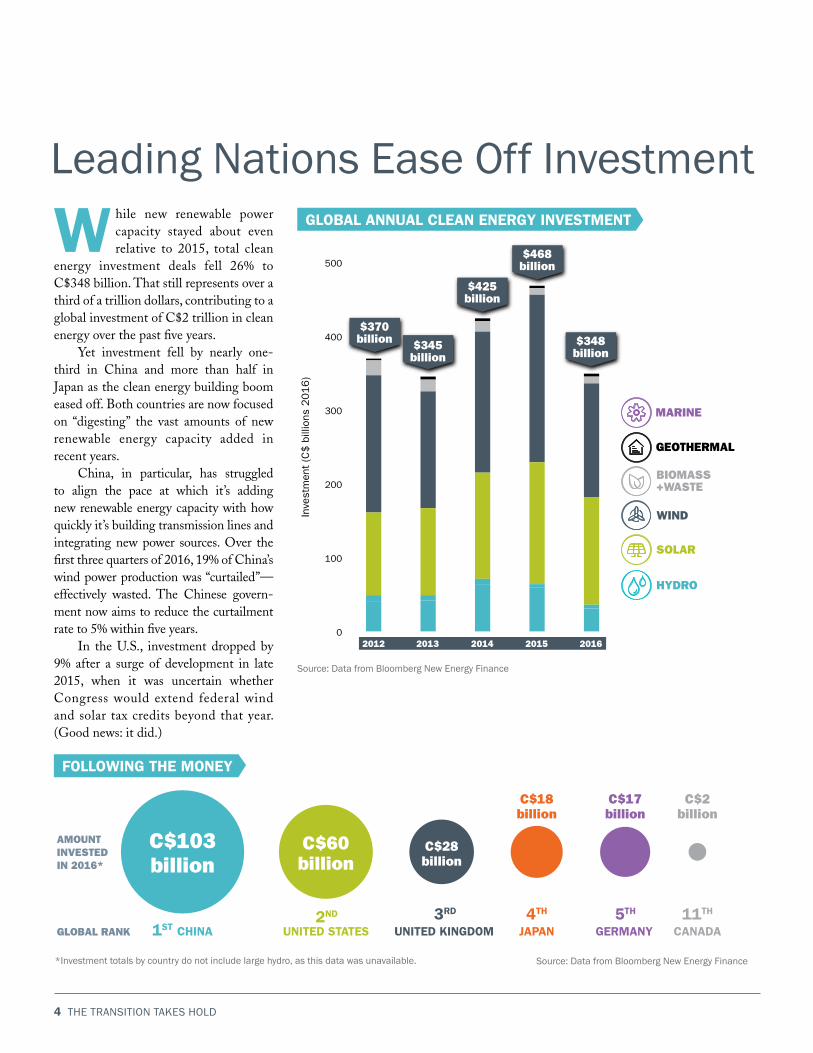
hile new renewable power capacity stayed about even relative to 2015, total clean
energy investment deals fell 26% to C$348 billion. That still represents over a third of a trillion dollars, contributing to a global investment of C$2 trillion in clean energy over the past five years.
Yet investment fell by nearly one-third in China and more than half in Japan as the clean energy building boom eased off. Both countries are now focused on “digesting” the vast amounts of new renewable energy capacity added in recent years.
China, in particular, has struggled to align the pace at which it’s adding new renewable energy capacity with how quickly it’s building transmission lines and integrating new power sources. Over the first three quarters of 2016, 19% of China’s wind power production was “curtailed”—effectively wasted. The Chinese govern-ment now aims to reduce the curtailment rate to 5% within five years.
In the U.S., investment dropped by 9% after a surge of development in late 2015, when it was uncertain whether Congress would extend federal wind and solar tax credits beyond that year. (Good news: it did.)
2012 2013 2014 2015 20160
100
200
300
400
500
Inve
stm
ent
(C$ b
illio
ns 2
016)
$370billion $345
billion
$425billion
$468billion
$348billion
HYDRO
BIOMASS+WASTE
WIND
GEOTHERMAL
SOLAR
MARINE
Leading Nations Ease Off InvestmentgloBal annual Clean energy inveStment
*Investment totals by country do not include large hydro, as this data was unavailable.
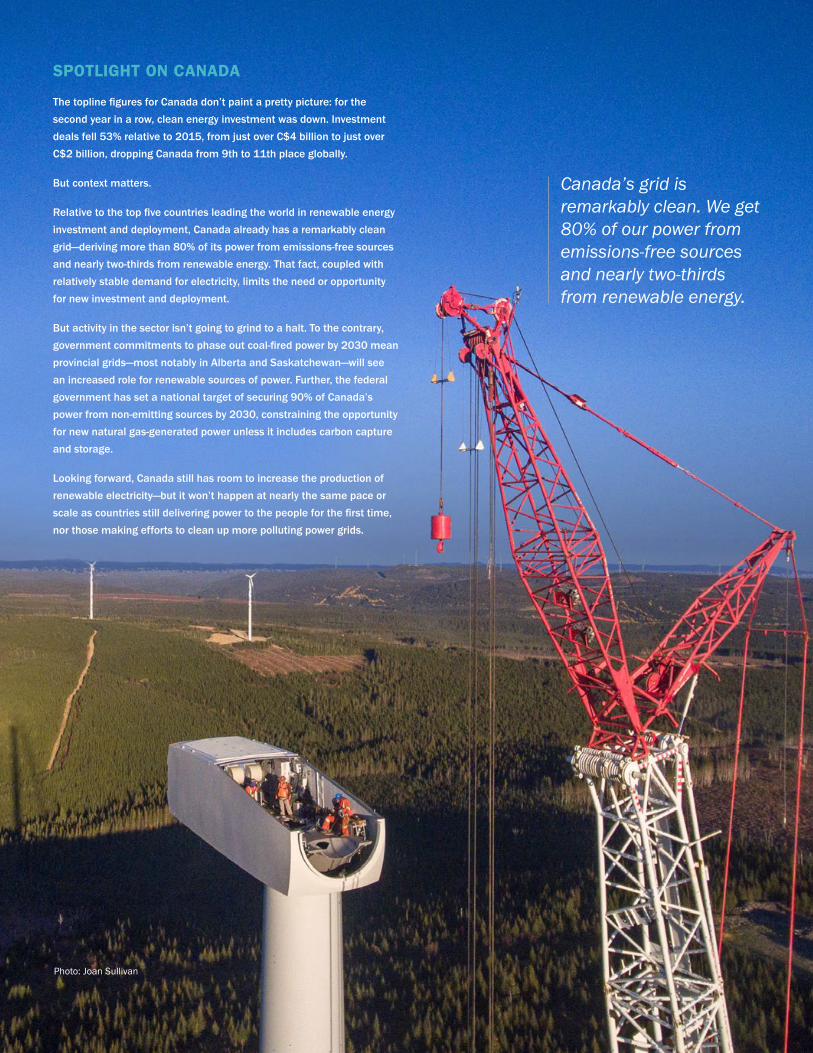
The topline figures for Canada don’t paint a pretty picture: for the second year in a row, clean energy investment was down. investment deals fell 53% relative to 2015, from just over c$4 billion to just over c$2 billion, dropping canada from 9th to 11th place globally.
but context matters.
Relative to the top five countries leading the world in renewable energy investment and deployment, canada already has a remarkably clean grid—deriving more than 80% of its power from emissions-free sources and nearly two-thirds from renewable energy. that fact, coupled with relatively stable demand for electricity, limits the need or opportunity for new investment and deployment.
but activity in the sector isn’t going to grind to a halt. to the contrary, government commitments to phase out coal-fired power by 2030 mean provincial grids—most notably in alberta and saskatchewan—will see an increased role for renewable sources of power. Further, the federal government has set a national target of securing 90% of canada’s power from non-emitting sources by 2030, constraining the opportunity for new natural gas-generated power unless it includes carbon capture and storage.
looking forward, canada still has room to increase the production of renewable electricity—but it won’t happen at nearly the same pace or scale as countries still delivering power to the people for the first time, nor those making efforts to clean up more polluting power grids.
Canada’s grid is remarkably clean. We get 80% of our power from emissions-free sources and nearly two-thirds from renewable energy.
Photo: Joan sullivan
6 THE TRANsITION TAKEs HOLd
ossil fuel prices are notoriously volatile and unpredictable. But there’s a new market dynamic at
play in the energy sector. Renewables are increasingly going head-to-head with fossils to produce the lowest-cost electricity, and they’re winning. Global trends show some renewable energy tech-nologies have reached “grid parity” with fossil fuels—thanks to falling technology costs—meaning no financial support is required to make their cost equal to, or cheaper than, their fossil fuel competitors.
A fundamental benefit of clean en-ergy technologies is that they, like other technologies, follow relatively predictable declines in cost. As production and experience scale up, costs come down. Looking to the future, these trends will continue. Between 2015 and 2025, the International Renewable Energy Agency projects generation costs for onshore wind to fall another 26%, while offshore wind generation costs fall 35% and utility-scale solar PV costs drop 57%.
Changes in policy are also driving down renewable power project costs, notably as governments shift towards competitive auctions. Rather than setting a fixed price that governments or utilities will pay for renewable power, auctions in-troduce competition for contracts between would-be project developers. Given how quickly technology and other project costs are falling, auctions allow governments to capitalize on these trends.
In 2016, prices resulting from solar and wind energy auctions fell significantly. For onshore wind power, Morocco received a record-low bid price of C$40/MWh; for offshore wind, Denmark received a re-cord-low bid price of C$107/MWh; while for solar PV, Abu Dhabi announced a record-low bid price of C$32/MWh. The
shift from tariffs to competitive auction also delivered lower prices in Ontario, with wind projects coming in 33% lower and solar projects 61% lower than the previous tariffs paid.
Watch Out for Falling Prices
Fossil Fuel Cost Range
2010 2016 2010 2016 2010 20160
100
200
300
400
500
600
SOLARPV
ONSHOREWIND
OFFSHOREWIND
Leve
lized
cos
t of
ele
ctric
ity (
C$
/MW
h)
Global levelized cost of electricity for utility-scale power (ranges), 2010 and 2016
source: REThinking Energy 2017. International Renewable Energy Agency (2017)
india’s aggressive targets for building up renewable energy supply are translating into significant investment—and putting people to work. in 2015, solar pv employed an estimated 103,000 people in grid-connected (31,000) and off-grid (72,000) applications. the push for 100 gW of cumulative solar pv installations by 2022 will add to this total, generating up to 1.1 million jobs.
souce: International Renewable Energy Agency, 2016
A Growing Global WorkforceSolar leadS gloBal reneWaBle energy emPloyments the role of renewable energy
in the global energy system has expanded, its workforce has
grown apace. By 2015, renewable elec-tricity employment is estimated to have grown to 6.7 million direct and indirect jobs globally, with solar PV the leading technology, employing nearly 2.8 million people. It is estimated that in 2015 Canada was home to 10,500 jobs in wind and 8,100 in solar PV.*
* Note: Jobs estimates for other renewable energy technologies are not available.
HYDRO
SOLIDBIOMASS
BIOGAS
WIND
GEOTHERMAL
SOLAR
CONCENTRATEDSOLAR POWER
2.8 millionjobs
1.1 millionjobs
822,000jobs
1.5 millionjobs
382,000jobs
160,000jobs
14,000jobs
6.7 million
clean energy
jobs worldwide
in 2015
Photo: Robert Wallis / Getty
source: Renewable Energy and Jobs - Annual Review 2016. International Renewable Energy Agency (2016)
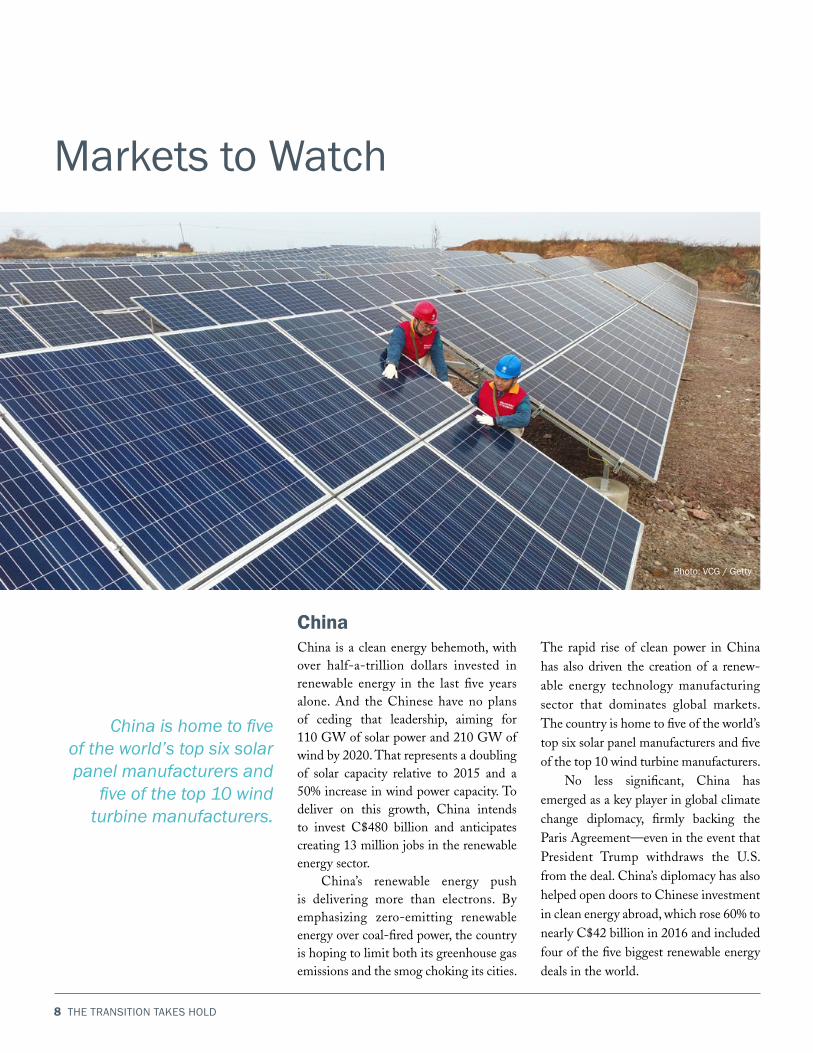
China is a clean energy behemoth, with over half-a-trillion dollars invested in renewable energy in the last five years alone. And the Chinese have no plans of ceding that leadership, aiming for 110 GW of solar power and 210 GW of wind by 2020. That represents a doubling of solar capacity relative to 2015 and a 50% increase in wind power capacity. To deliver on this growth, China intends to invest C$480 billion and anticipates creating 13 million jobs in the renewable energy sector.
China’s renewable energy push is delivering more than electrons. By emphasizing zero-emitting renewable energy over coal-fired power, the country is hoping to limit both its greenhouse gas emissions and the smog choking its cities.
The rapid rise of clean power in China has also driven the creation of a renew-able energy technology manufacturing sector that dominates global markets. The country is home to five of the world’s top six solar panel manufacturers and five of the top 10 wind turbine manufacturers.
No less significant, China has emerged as a key player in global climate change diplomacy, firmly backing the Paris Agreement—even in the event that President Trump withdraws the U.S. from the deal. China’s diplomacy has also helped open doors to Chinese investment in clean energy abroad, which rose 60% to nearly C$42 billion in 2016 and included four of the five biggest renewable energy deals in the world.
China
China is home to five of the world’s top six solar panel manufacturers and
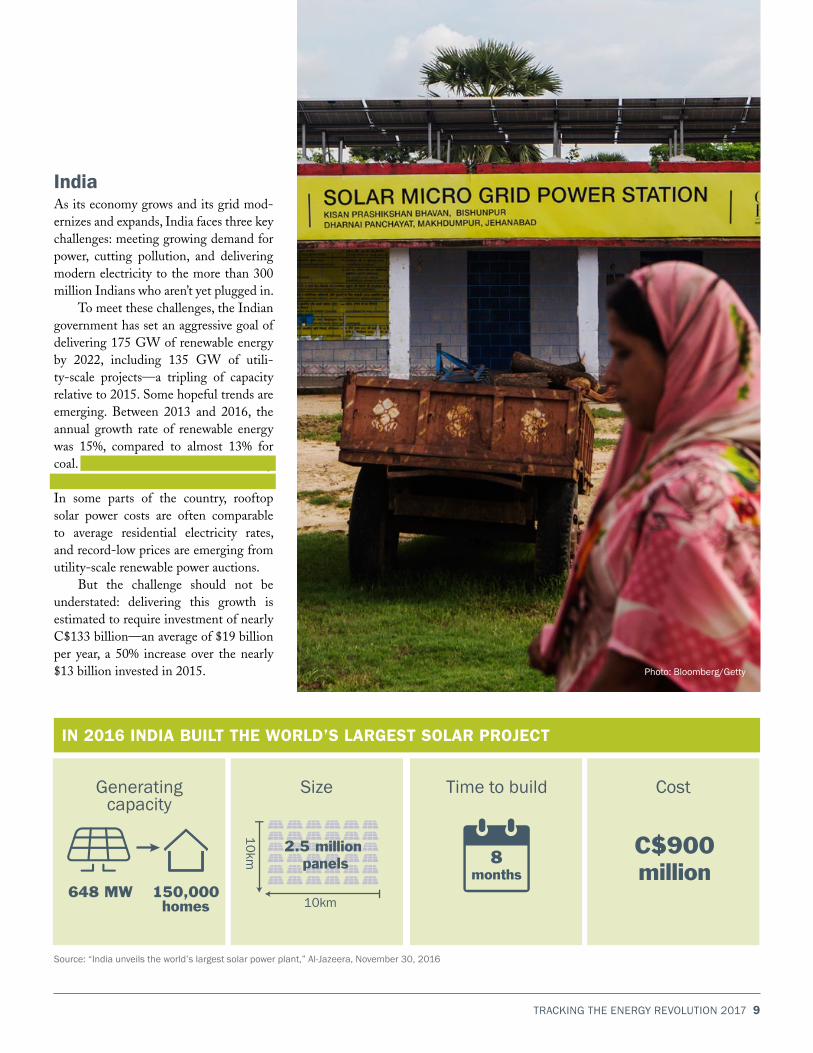
indiaAs its economy grows and its grid mod-ernizes and expands, India faces three key challenges: meeting growing demand for power, cutting pollution, and delivering modern electricity to the more than 300 million Indians who aren’t yet plugged in.
To meet these challenges, the Indian government has set an aggressive goal of delivering 175 GW of renewable energy by 2022, including 135 GW of utili-ty-scale projects—a tripling of capacity relative to 2015. Some hopeful trends are emerging. Between 2013 and 2016, the annual growth rate of renewable energy was 15%, compared to almost 13% for coal. And in 2016, 44% of new electricity capacity came from renewable sources. In some parts of the country, rooftop solar power costs are often comparable to average residential electricity rates, and record-low prices are emerging from utility-scale renewable power auctions.
But the challenge should not be understated: delivering this growth is estimated to require investment of nearly C$133 billion—an average of $19 billion per year, a 50% increase over the nearly $13 billion invested in 2015.
in 2016 india Built the World’S largeSt Solar ProJeCt
8months
2.5 million panels
150,000homes
enough to power about 150,000 homes in the region
C$900 million
10km
10
km
648 MW
8months
2.5 million panels
150,000homes
enough to power about 150,000 homes in the region
C$900 million
10km
10
km
648 MW
Generating capacity
size Time to build Cost
source: “India unveils the world’s largest solar power plant,” Al-Jazeera, November 30, 2016
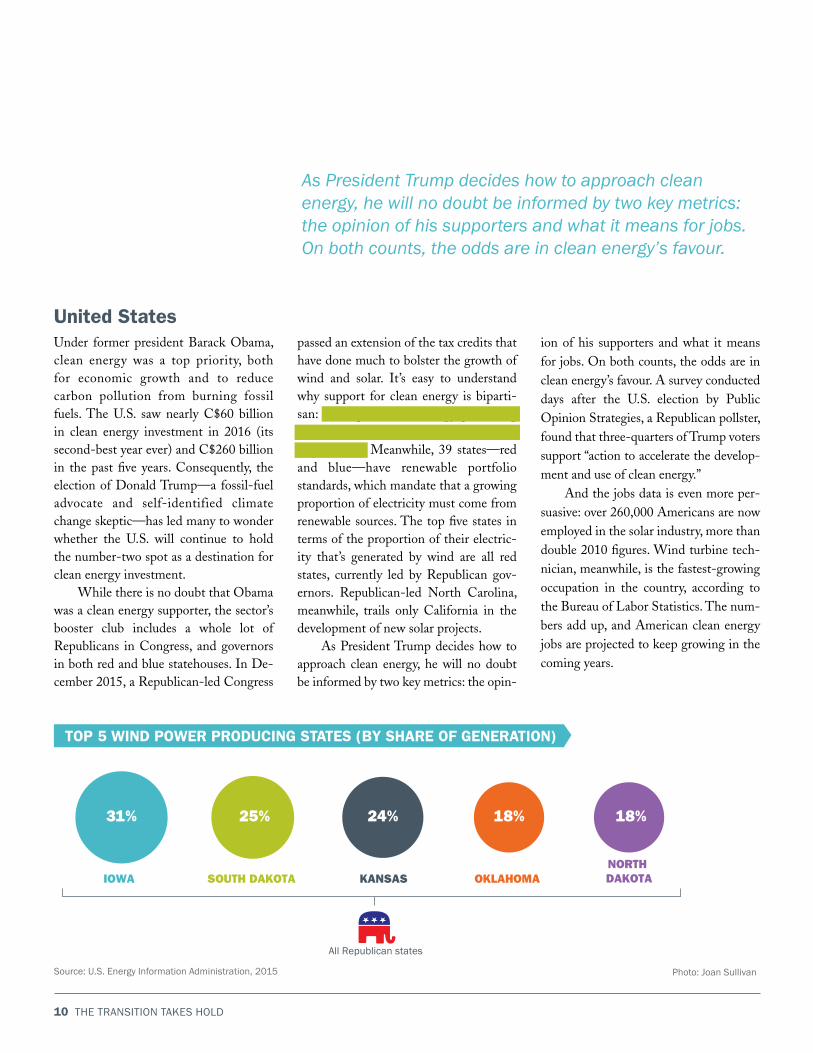
Under former president Barack Obama, clean energy was a top priority, both for economic growth and to reduce carbon pollution from burning fossil fuels. The U.S. saw nearly C$60 billion in clean energy investment in 2016 (its second-best year ever) and C$260 billion in the past five years. Consequently, the election of Donald Trump—a fossil-fuel advocate and self-identified climate change skeptic—has led many to wonder whether the U.S. will continue to hold the number-two spot as a destination for clean energy investment.
While there is no doubt that Obama was a clean energy supporter, the sector’s booster club includes a whole lot of Republicans in Congress, and governors in both red and blue statehouses. In De-cember 2015, a Republican-led Congress
passed an extension of the tax credits that have done much to bolster the growth of wind and solar. It’s easy to understand why support for clean energy is biparti-san: the top 10 wind-energy producing congressional districts are represented by Republicans. Meanwhile, 39 states—red and blue—have renewable portfolio standards, which mandate that a growing proportion of electricity must come from renewable sources. The top five states in terms of the proportion of their electric-ity that’s generated by wind are all red states, currently led by Republican gov-ernors. Republican-led North Carolina, meanwhile, trails only California in the development of new solar projects.
As President Trump decides how to approach clean energy, he will no doubt be informed by two key metrics: the opin-
ion of his supporters and what it means for jobs. On both counts, the odds are in clean energy’s favour. A survey conducted days after the U.S. election by Public Opinion Strategies, a Republican pollster, found that three-quarters of Trump voters support “action to accelerate the develop-ment and use of clean energy.”
And the jobs data is even more per-suasive: over 260,000 Americans are now employed in the solar industry, more than double 2010 figures. Wind turbine tech-nician, meanwhile, is the fastest-growing occupation in the country, according to the Bureau of Labor Statistics. The num-bers add up, and American clean energy jobs are projected to keep growing in the coming years.
united States
As President Trump decides how to approach clean energy, he will no doubt be informed by two key metrics: the opinion of his supporters and what it means for jobs. On both counts, the odds are in clean energy’s favour.
Photo: Joan sullivan
IOWA SOUTH DAKOTA KANSAS OKLAHOMANORTH DAKOTA
18%18%24%25%31%
All Republican states
toP 5 Wind PoWer ProduCing StateS (By Share oF generation)
source: U.s. Energy Information Administration, 2015
source: U.s department of Energy, solar Energy Industry Association, The solar Foundation
JoBS, JoBS, JoBS
Since 2009, the solar industry has created
one out of every 80 new jobs in the u.S. in 2016,
it was one out of every 50 new jobs.
LOOKING AHEAd
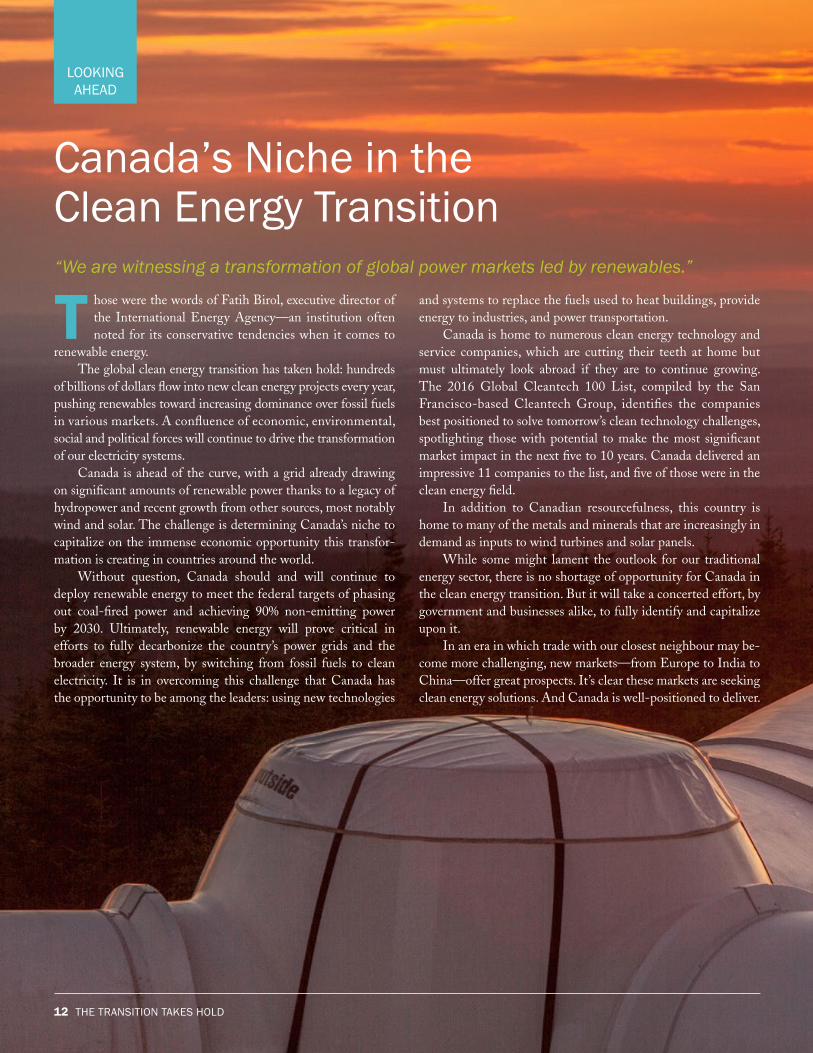
Canada’s Niche in the Clean Energy Transition
hose were the words of Fatih Birol, executive director of the International Energy Agency—an institution often noted for its conservative tendencies when it comes to
renewable energy. The global clean energy transition has taken hold: hundreds
of billions of dollars flow into new clean energy projects every year, pushing renewables toward increasing dominance over fossil fuels in various markets. A confluence of economic, environmental, social and political forces will continue to drive the transformation of our electricity systems.
Canada is ahead of the curve, with a grid already drawing on significant amounts of renewable power thanks to a legacy of hydropower and recent growth from other sources, most notably wind and solar. The challenge is determining Canada’s niche to capitalize on the immense economic opportunity this transfor-mation is creating in countries around the world.
Without question, Canada should and will continue to deploy renewable energy to meet the federal targets of phasing out coal-fired power and achieving 90% non-emitting power by 2030. Ultimately, renewable energy will prove critical in efforts to fully decarbonize the country’s power grids and the broader energy system, by switching from fossil fuels to clean electricity. It is in overcoming this challenge that Canada has the opportunity to be among the leaders: using new technologies
and systems to replace the fuels used to heat buildings, provide energy to industries, and power transportation.
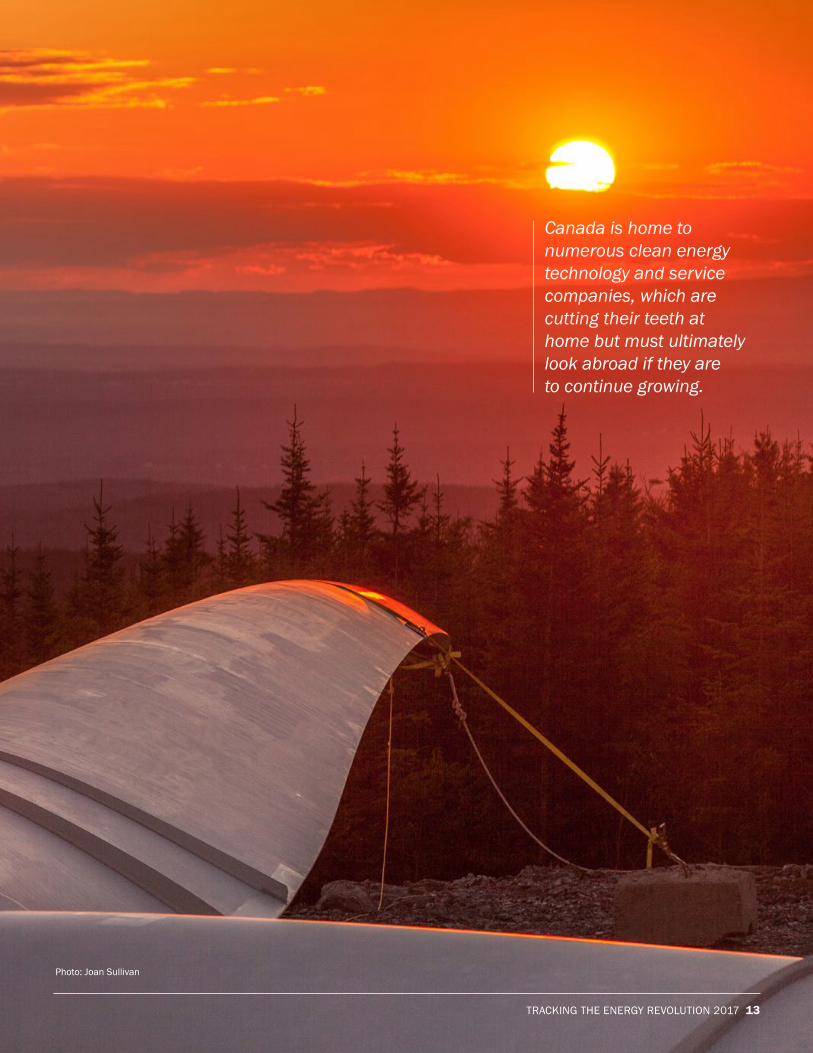
Canada is home to numerous clean energy technology and service companies, which are cutting their teeth at home but must ultimately look abroad if they are to continue growing. The 2016 Global Cleantech 100 List, compiled by the San Francisco-based Cleantech Group, identifies the companies best positioned to solve tomorrow’s clean technology challenges, spotlighting those with potential to make the most significant market impact in the next five to 10 years. Canada delivered an impressive 11 companies to the list, and five of those were in the clean energy field.
In addition to Canadian resourcefulness, this country is home to many of the metals and minerals that are increasingly in demand as inputs to wind turbines and solar panels.
While some might lament the outlook for our traditional energy sector, there is no shortage of opportunity for Canada in the clean energy transition. But it will take a concerted effort, by government and businesses alike, to fully identify and capitalize upon it.
In an era in which trade with our closest neighbour may be-come more challenging, new markets—from Europe to India to China—offer great prospects. It’s clear these markets are seeking clean energy solutions. And Canada is well-positioned to deliver.
“We are witnessing a transformation of global power markets led by renewables.”
Canada is home to numerous clean energy technology and service companies, which are cutting their teeth at home but must ultimately look abroad if they are to continue growing.
Photo: Joan sullivan
Clean Energy Canada
suite 721, 602 West Hastings street Vancouver, B.C. V6B 1P2