Trade Profiles T r a d e f o w s a n d t r a d e p o l i c y m e a s u r e s Merchandise trade Duty free imports Outstanding notifications Disputes Trade to GDP WTO budget contribution Tariffs Commercial services trade Trade ranking
Trade Profiles 2011 provides the latest information on the trade flows and trade policy measures of WTO members, observers and other selected economies. With information for each economy provided in a standardized format, the publication is an invaluable quick reference tool for anyone looking for essential trade statistics. The data provided for each economy include basic economic indicators (such as GDP), trade policy indicators (such as tariffs, import duties, number of disputes, notifications outstanding and contingency measures in force), merchandise trade flows (broken down by broad product categories and major origins and destinations), services trade flows (with a breakdown by major components) and industrial property indicators. With one page devoted to each economy, Trade Profiles offers a concise overview of global trade.
Trade Profiles
Tra
de
f ow
s an
d tra
de policy measures
Merchandise trade
Duty free imports
Outstanding notifications
Disputes
Trade to GDP
WTO budget contribution
Tariffs
Commercial services trade
Trade ranking
Trad
e Pro
files 2
011
About the WTO
The World Trade Organization deals with the global rules of trade between nations. Its main function is to ensure that trade flows as smoothly, predictably and freely as possible.
About this publication
Trade Profiles combine information on trade flows and trade policy measures of members, observers and other selected economies. The information is retrieved from various WTO Divisions and external sources and presented in standardized format for quick reference.
For more information
The statistical tables included in this report can be downloaded from the WTO web site at www.wto.org/statistics
To order, please contact:WTO Publications World Trade Organization 154, rue de Lausanne CH-1211 Geneva 21Tel: +41 (0)22 739 52 08 Fax: +41 (0)22 739 54 58 Email: [email protected] WTO bookshophttp://onlinebookshop.wto.org
This publication is available online at:www.wto.org/statisticsIf you would like more information on the contents of this report or if you have any comments or suggestions for improvement please contact the International Trade Statistics Section ([email protected]).
ISBN 978-92-870-3795-4Also available in French and Spanish:Profils commerciaux 2011 ISBN 978-92-870-3796-1Perfiles comerciales 2011 ISBN 978-92-870-3797-8
Printed in Switzerland, 2011
Where to find more online: www.wto.org/statistics
World Trade OrganizationTrade Profiles 2011
Download the data:www.wto.org/statistics 1
Contents
Introduction 2
WTO members and observers 3
Technical notes 4
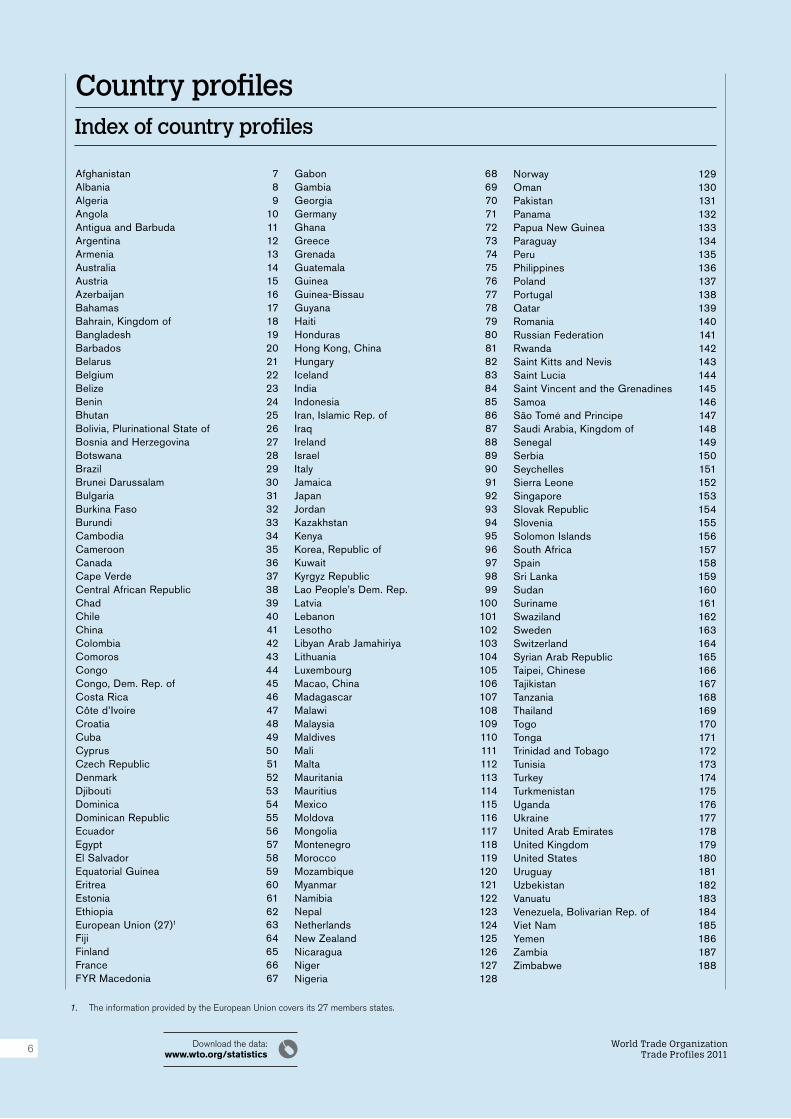
Country profiles 6Index of country profiles 6
Acknowledgements 189
World Trade OrganizationTrade Profiles 2011
Download the data:www.wto.org/statistics2
These Trade Profiles combine information on trade flows and trade policy measures of WTO members, observers and other selected economies. The information is retrieved from various WTO Divisions and external sources and presented in standardized format for quick reference.
Introduction
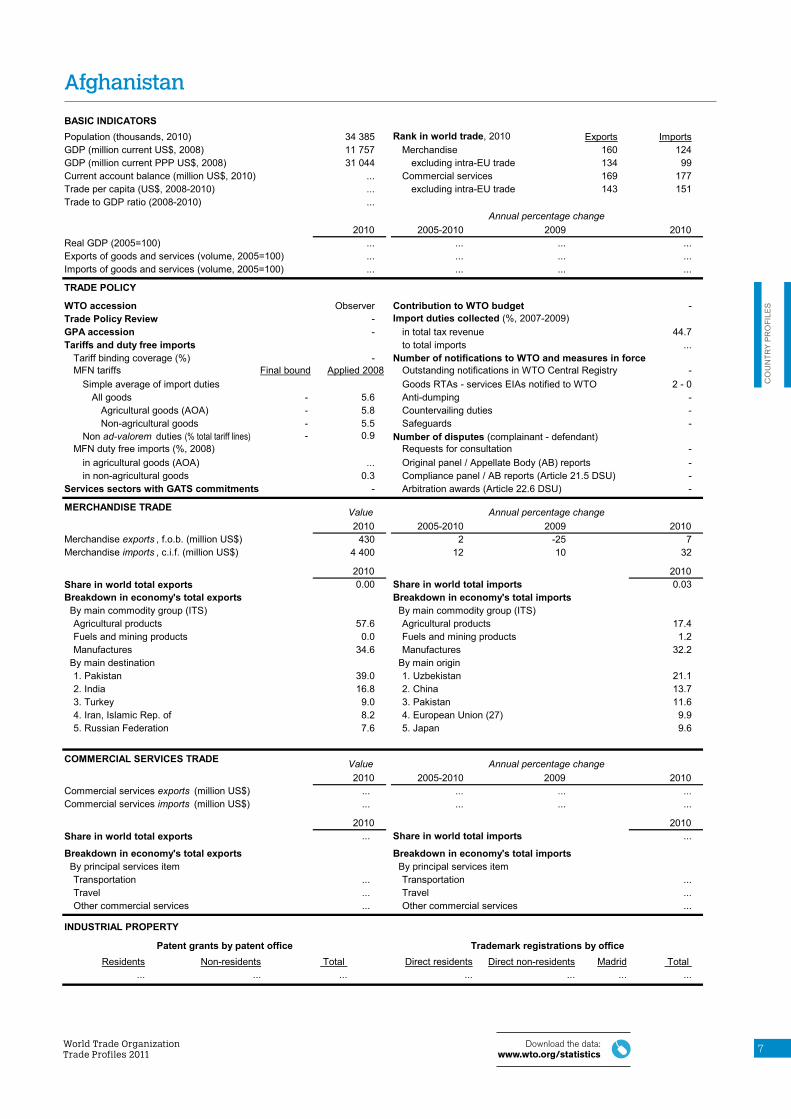
The indicators are divided into five categories:
I. Basic economic indicators – population, GDP, current account balance, etc.
II. Trade policy indicators – specific WTO relevant information, including tariff binding information, import duties collected in total tax revenue, the number of dispute rulings (complainant, defendant), notifications outstanding and contingency measures in force.
III. Merchandise trade indicators (customs-based statistics) – information on total trade flows broken down by broad product categories and major origins and destinations.
IV. Commercial services indicators (balance of payments based statistics) – trends in total trade flows and a breakdown by major components.
V. Industrial property indicators – annual number of patents granted and marks registered in the name of residents and non-residents in the economy.
Data are currently provided for as many members and observers for which adequate information is available in the WTO Secretariat and other national and international bodies.
For updates, see the Statistics Database at www.wto.org/statistics
For sources and methodology, see the Technical Notes on page 4.
The definition of economies in this booklet does not imply an expression of opinion by the WTO Secretariat concerning the status of any country or territory, the delimitation of its frontiers, nor regarding the rights and obligations of any WTO member in respect of WTO Agreements.
Throughout this report, the Bolivarian Republic of Venezuela, the Republic of Korea and the Separate Customs Territory of Taiwan, Penghu, Kinmen and Matsu are referenced as Venezuela, Bolivarian Rep. of, Korea, Republic of and Taipei, Chinese respectively.
World Trade OrganizationTrade Profiles 2011
Download the data:www.wto.org/statistics 3
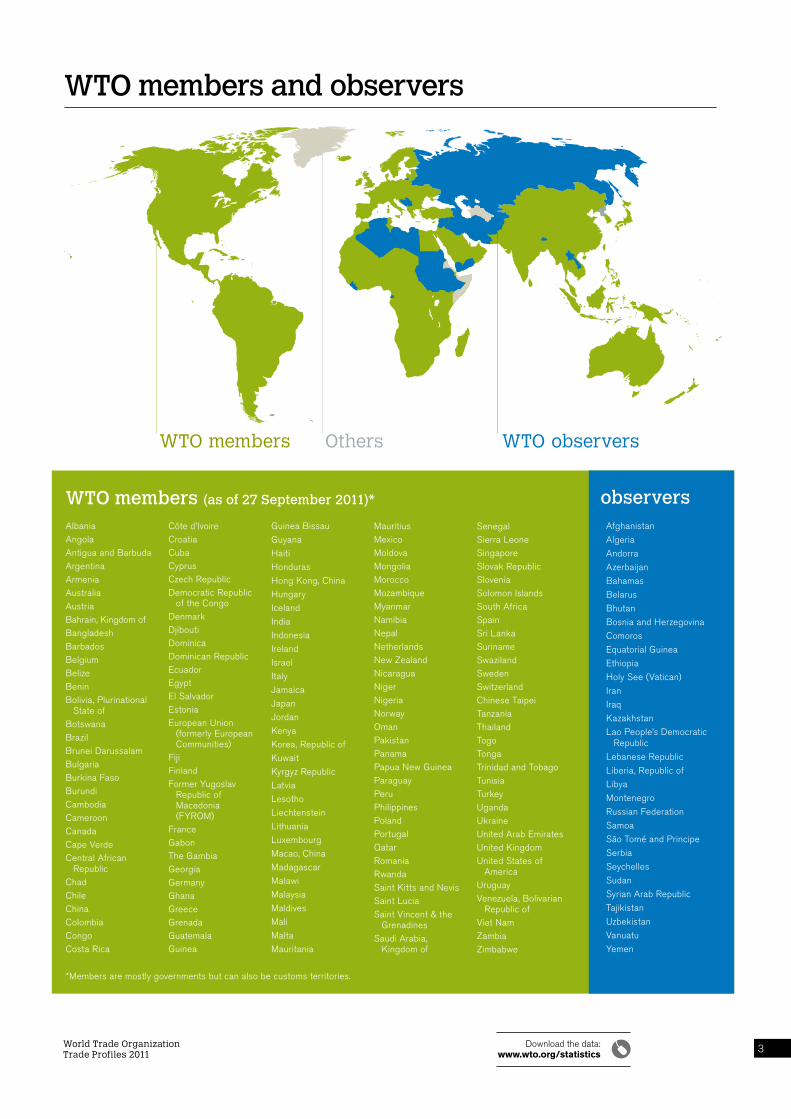
WTO members and observers
WTO members Others WTO observers
AlbaniaAngolaAntigua and BarbudaArgentinaArmeniaAustraliaAustriaBahrain, Kingdom ofBangladeshBarbadosBelgiumBelizeBeninBolivia, Plurinational
State ofBotswanaBrazilBrunei DarussalamBulgariaBurkina FasoBurundiCambodiaCameroonCanadaCape VerdeCentral African
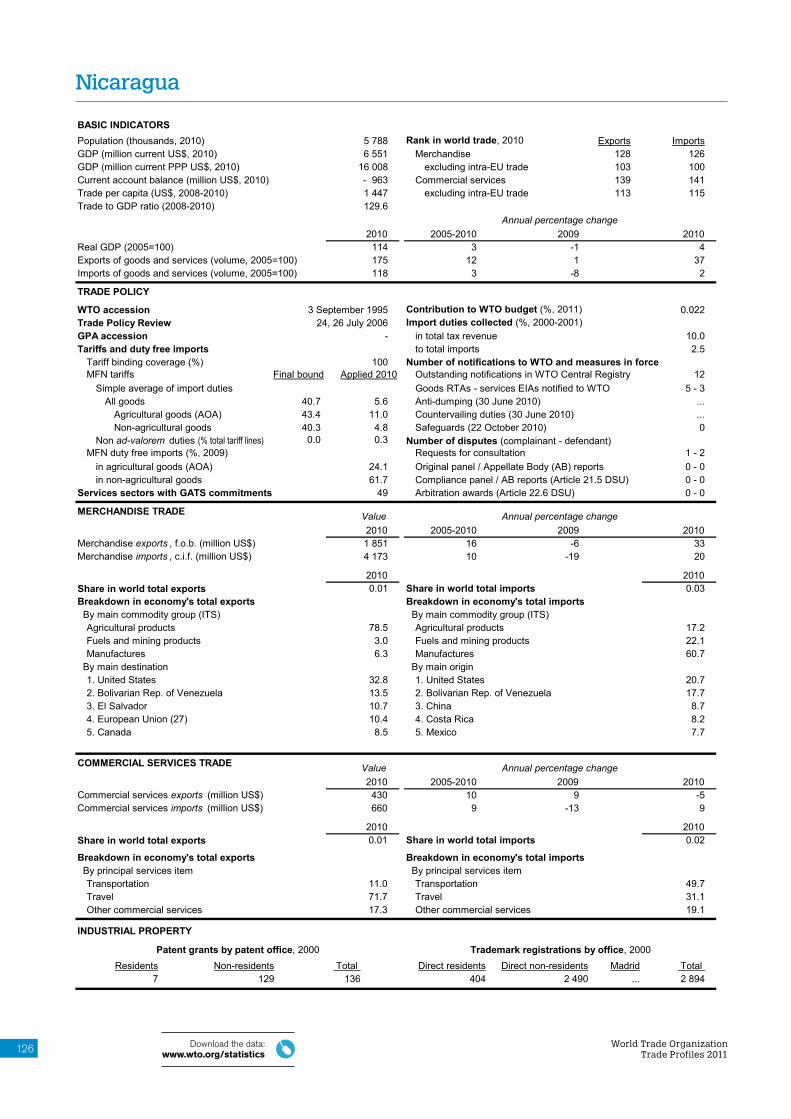
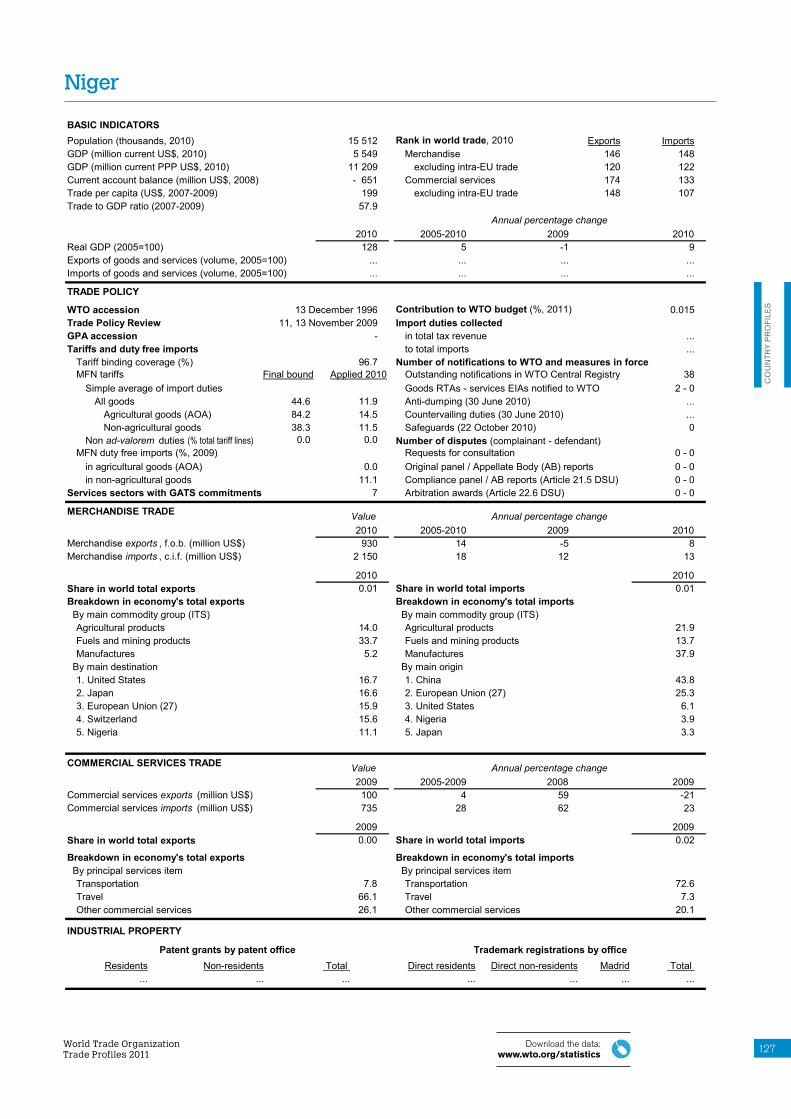
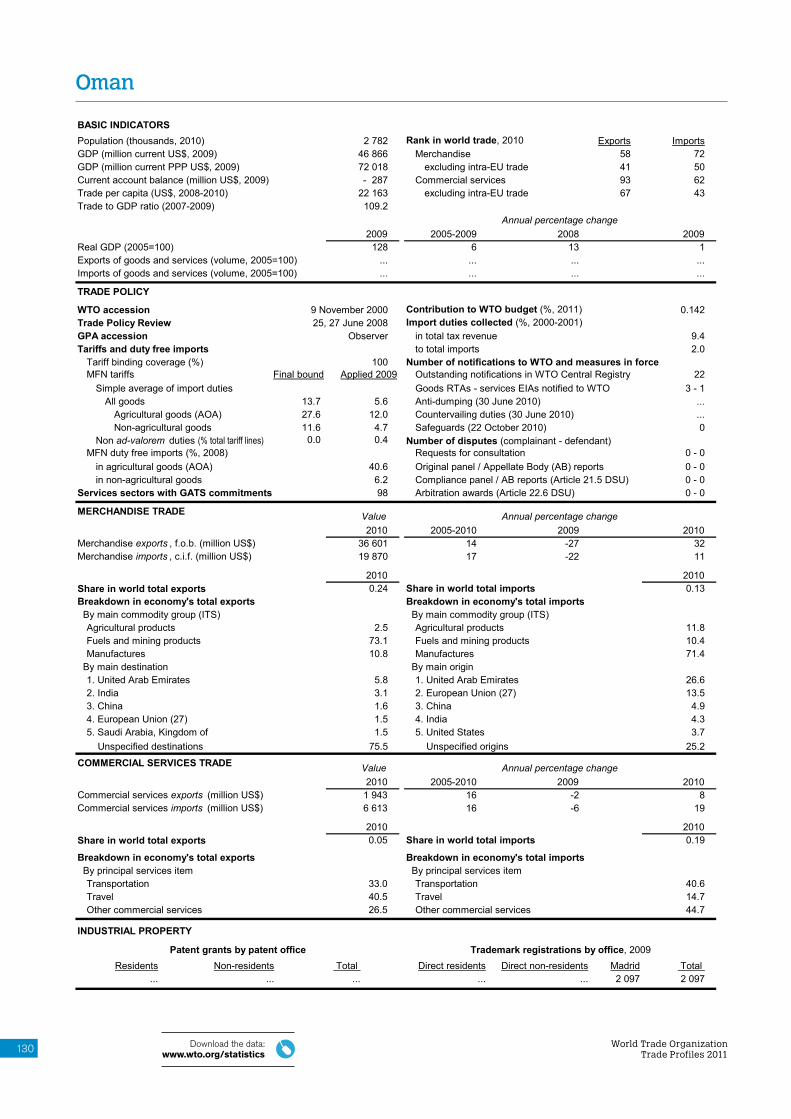
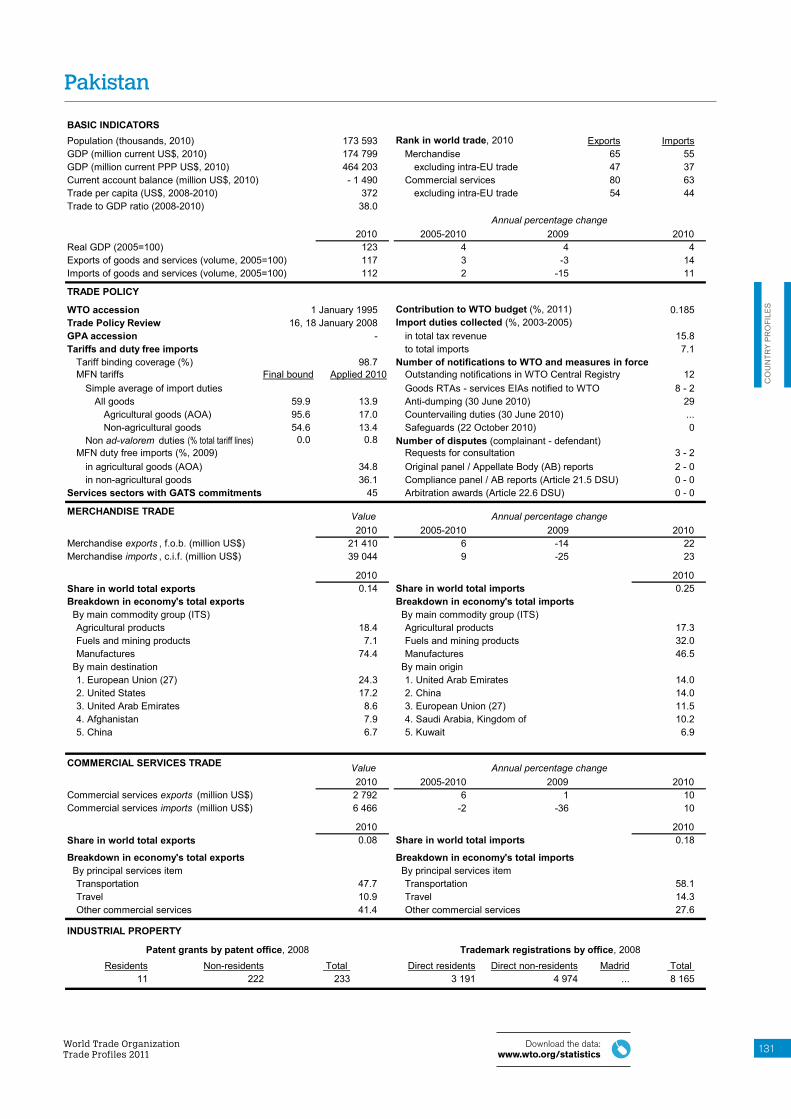
MauritiusMexicoMoldovaMongoliaMoroccoMozambiqueMyanmarNamibiaNepalNetherlandsNew ZealandNicaraguaNigerNigeriaNorwayOmanPakistanPanamaPapua New GuineaParaguayPeruPhilippinesPolandPortugalQatarRomaniaRwandaSaint Kitts and NevisSaint LuciaSaint Vincent & the
GrenadinesSaudi Arabia,
Kingdom of
SenegalSierra LeoneSingaporeSlovak RepublicSloveniaSolomon IslandsSouth AfricaSpainSri LankaSurinameSwazilandSwedenSwitzerlandChinese TaipeiTanzaniaThailandTogoTongaTrinidad and TobagoTunisiaTurkeyUgandaUkraineUnited Arab EmiratesUnited KingdomUnited States of
AmericaUruguayVenezuela, Bolivarian
Republic ofViet NamZambiaZimbabwe
WTO members (as of 27 September 2011)*
*Members are mostly governments but can also be customs territories.
Afghanistan
Algeria
Andorra
Azerbaijan
Bahamas
Belarus
Bhutan
Bosnia and Herzegovina
Comoros
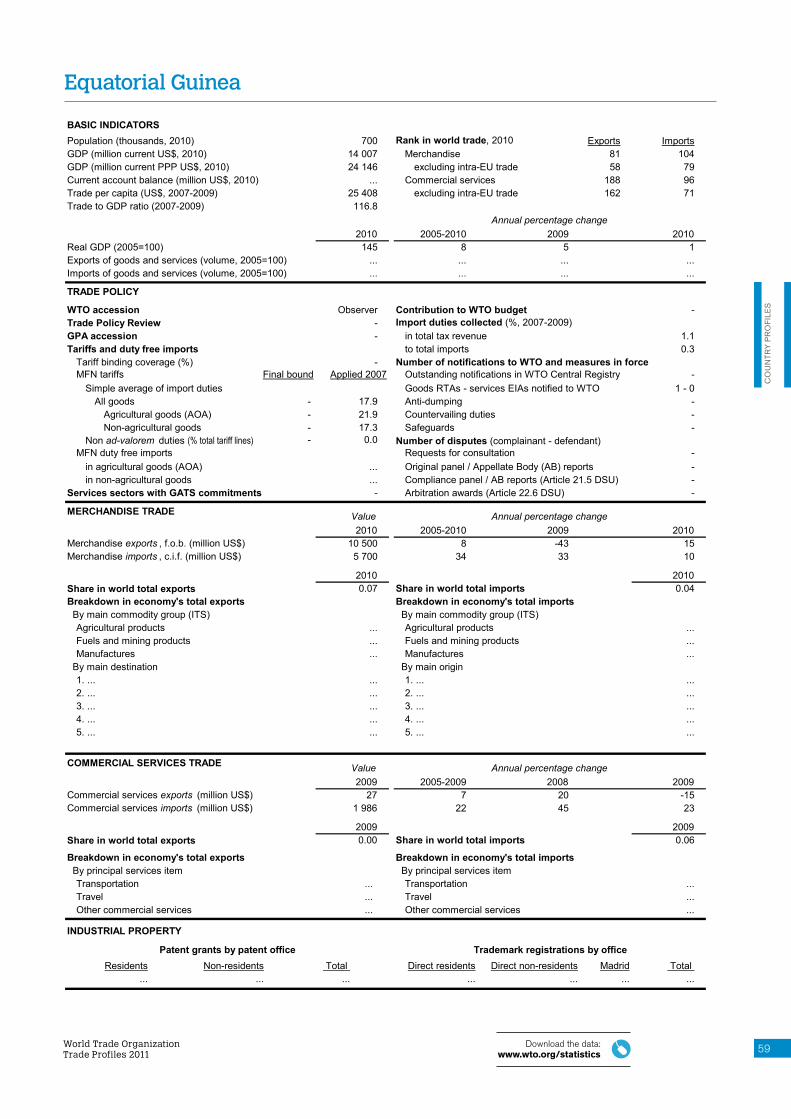
Equatorial Guinea
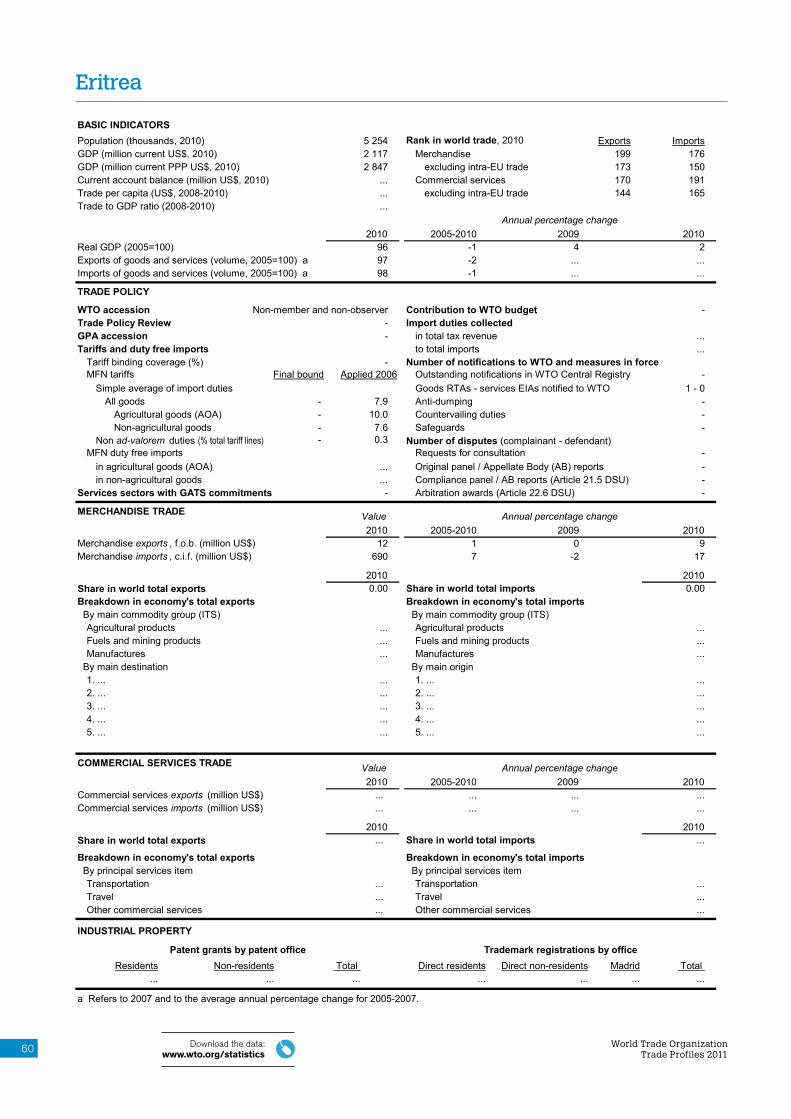
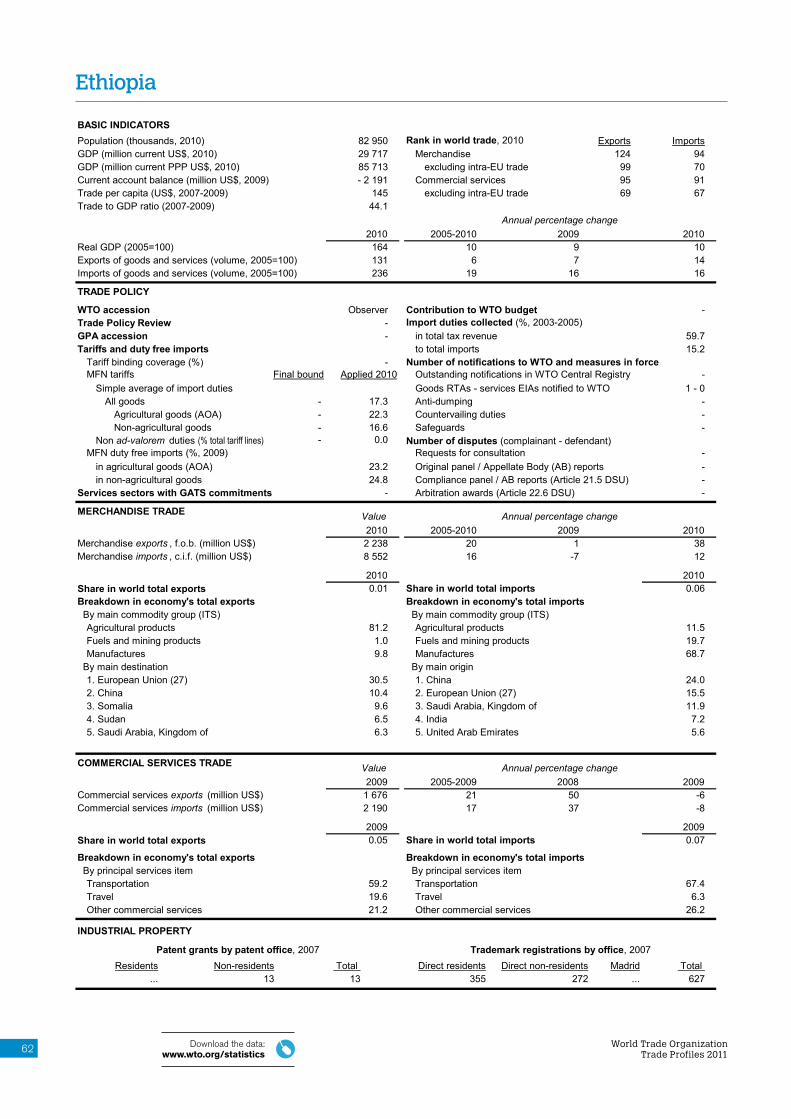
Ethiopia
Holy See (Vatican)
Iran
Iraq
Kazakhstan
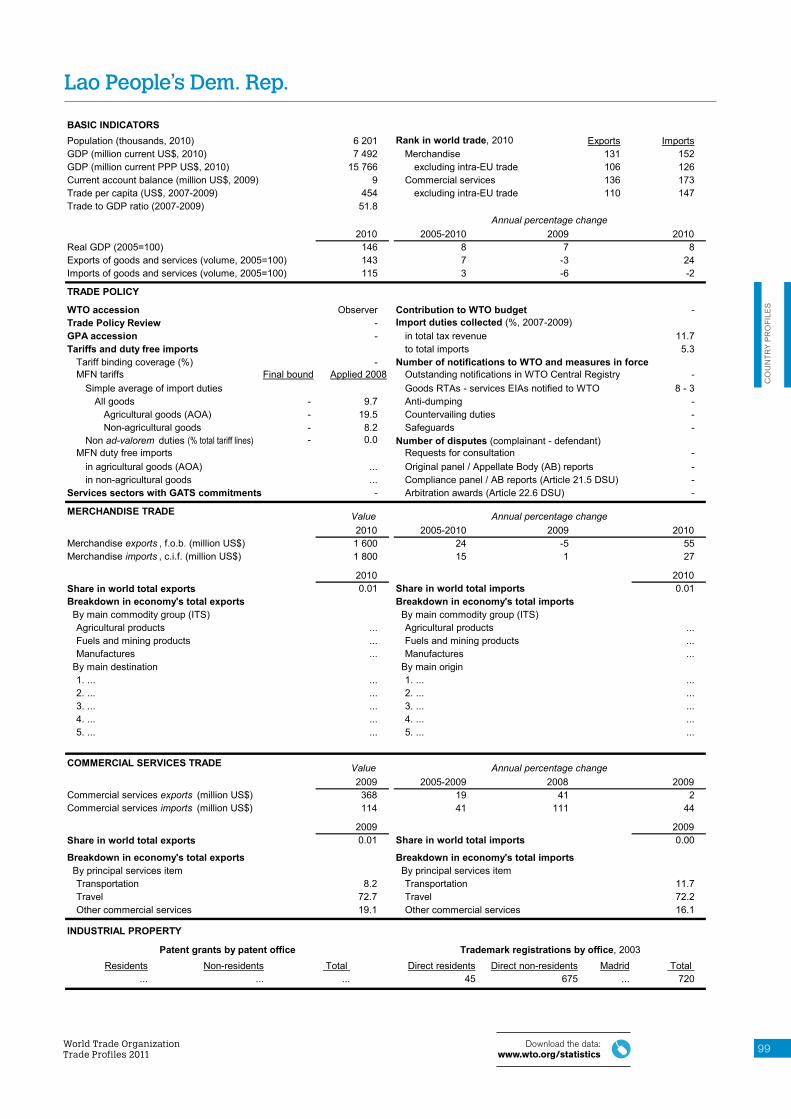
Lao People’s Democratic Republic
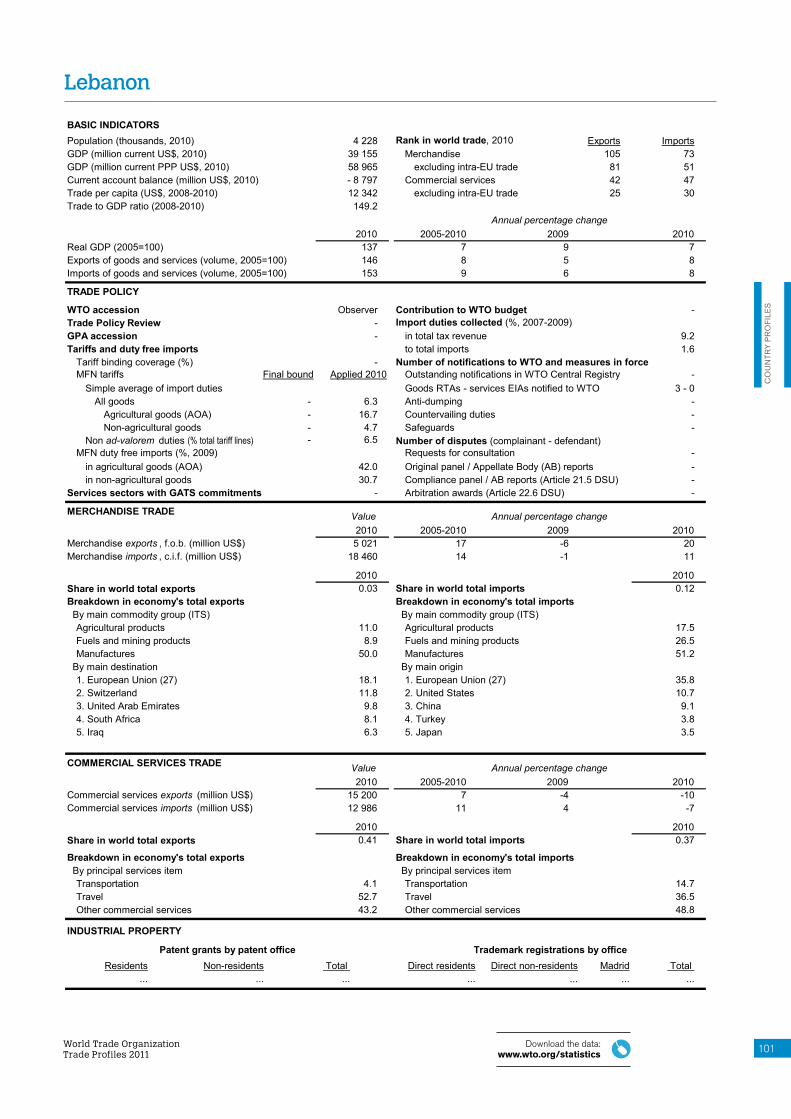
Lebanese Republic
Liberia, Republic of
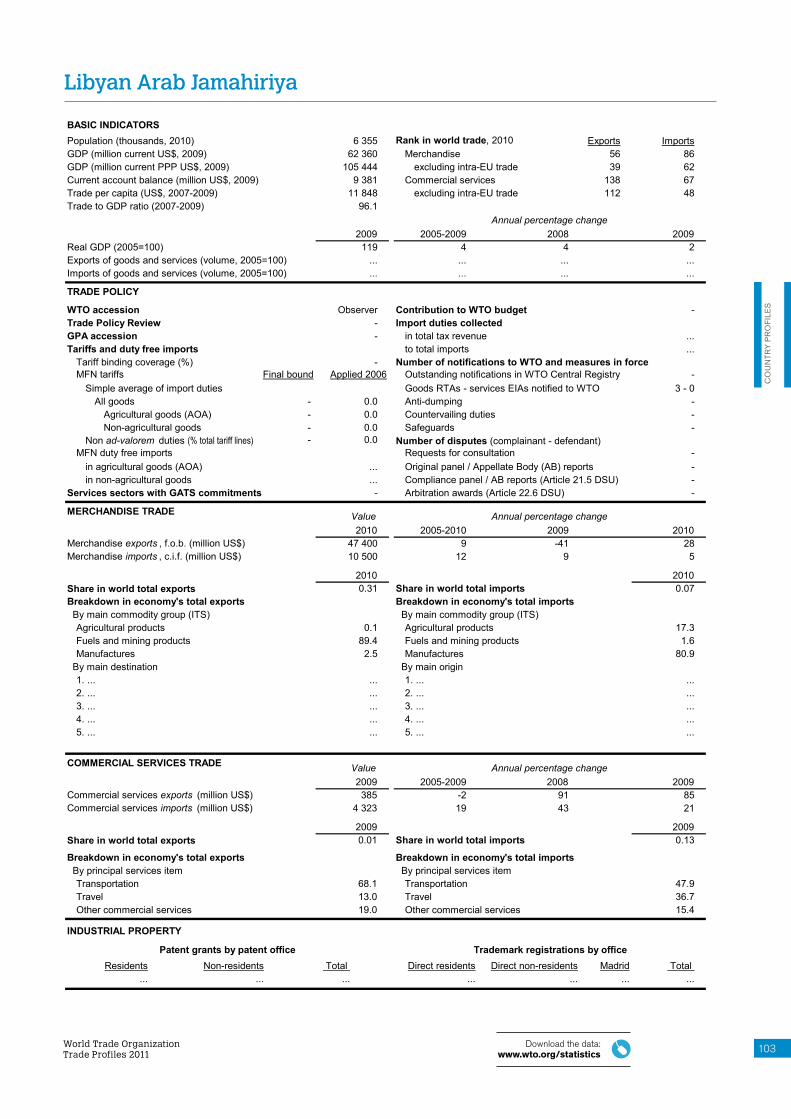
Libya
Montenegro
Russian Federation
Samoa
São Tomé and Principe
Serbia
Seychelles
Sudan
Syrian Arab Republic
Tajikistan
Uzbekistan
Vanuatu
Yemen
observers
World Trade OrganizationTrade Profiles 2011
Download the data:www.wto.org/statistics4
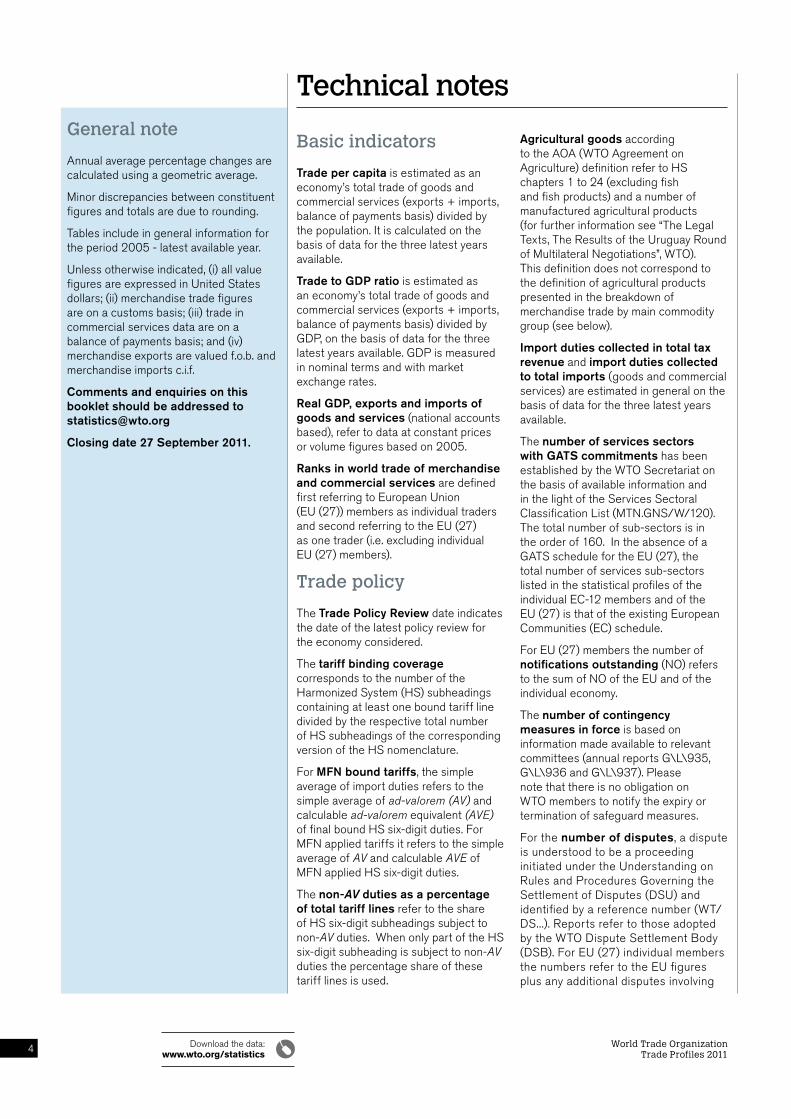
General note
Annual average percentage changes are calculated using a geometric average.
Minor discrepancies between constituent figures and totals are due to rounding.
Tables include in general information for the period 2005 - latest available year.
Unless otherwise indicated, (i) all value figures are expressed in United States dollars; (ii) merchandise trade figures are on a customs basis; (iii) trade in commercial services data are on a balance of payments basis; and (iv) merchandise exports are valued f.o.b. and merchandise imports c.i.f.
Comments and enquiries on this booklet should be addressed to [email protected]
Closing date 27 September 2011.
Technical notes
Basic indicators
Trade per capita is estimated as an economy’s total trade of goods and commercial services (exports + imports, balance of payments basis) divided by the population. It is calculated on the basis of data for the three latest years available.
Trade to GDP ratio is estimated as an economy’s total trade of goods and commercial services (exports + imports, balance of payments basis) divided by GDP, on the basis of data for the three latest years available. GDP is measured in nominal terms and with market exchange rates.
Real GDP, exports and imports of goods and services (national accounts based), refer to data at constant prices or volume figures based on 2005.
Ranks in world trade of merchandise and commercial services are defined first referring to European Union (EU (27)) members as individual traders and second referring to the EU (27) as one trader (i.e. excluding individual EU (27) members).
Trade policy
The Trade Policy Review date indicates the date of the latest policy review for the economy considered.
The tariff binding coverage corresponds to the number of the Harmonized System (HS) subheadings containing at least one bound tariff line divided by the respective total number of HS subheadings of the corresponding version of the HS nomenclature.
For MFN bound tariffs, the simple average of import duties refers to the simple average of ad-valorem (AV) and calculable ad-valorem equivalent (AVE) of final bound HS six-digit duties. For MFN applied tariffs it refers to the simple average of AV and calculable AVE of MFN applied HS six-digit duties.
The non-AV duties as a percentage of total tariff lines refer to the share of HS six-digit subheadings subject to non-AV duties. When only part of the HS six-digit subheading is subject to non-AV duties the percentage share of these tariff lines is used.
Agricultural goods according to the AOA (WTO Agreement on Agriculture) definition refer to HS chapters 1 to 24 (excluding fish and fish products) and a number of manufactured agricultural products (for further information see “The Legal Texts, The Results of the Uruguay Round of Multilateral Negotiations”, WTO). This definition does not correspond to the definition of agricultural products presented in the breakdown of merchandise trade by main commodity group (see below).
Import duties collected in total tax revenue and import duties collected to total imports (goods and commercial services) are estimated in general on the basis of data for the three latest years available.
The number of services sectors with GATS commitments has been established by the WTO Secretariat on the basis of available information and in the light of the Services Sectoral Classification List (MTN.GNS/W/120). The total number of sub-sectors is in the order of 160. In the absence of a GATS schedule for the EU (27), the total number of services sub-sectors listed in the statistical profiles of the individual EC-12 members and of the EU (27) is that of the existing European Communities (EC) schedule.
For EU (27) members the number of notifications outstanding (NO) refers to the sum of NO of the EU and of the individual economy.
The number of contingency measures in force is based on information made available to relevant committees (annual reports G\L\935, G\L\936 and G\L\937). Please note that there is no obligation on WTO members to notify the expiry or termination of safeguard measures.
For the number of disputes, a dispute is understood to be a proceeding initiated under the Understanding on Rules and Procedures Governing the Settlement of Disputes (DSU) and identified by a reference number (WT/DS...). Reports refer to those adopted by the WTO Dispute Settlement Body (DSB). For EU (27) individual members the numbers refer to the EU figures plus any additional disputes involving
World Trade OrganizationTrade Profiles 2011
Download the data:www.wto.org/statistics 5
Symbols and abbreviations
... Not available or not reported
- Not applicable
AOA WTO Agreement on Agriculture
CRN Central Registry of Notifications
DSU Dispute Settlement Understanding
EIA Economic Integration Agreement
EU European Union
GATS General Agreement on Trade in Services
GDP Gross Domestic Product
GPA Government Procurement Agreement
ITS WTO International Trade Statistics
MFN Most Favoured Nation
PPP Purchasing Power Parity
RTA Regional Trade Agreement
only the member considered. For more information refer to www.wto.org/disputes.
Merchandise trade (customs-based statistics)
The share in world total exports and imports of merchandise for individual economies is calculated using world trade including intra-EU (27) trade. For the EU (27) as one trading reporter the share is calculated on the basis of world trade excluding intra-EU (27) trade.
Breakdown by main commodity group according to the ITS (WTO International Trade Statistics) definitions: Agricultural products refer to food (SITC Rev. 3 sections 0, 1, 4 and division 22) and raw materials (SITC Rev. 3 divisions 21, 23, 24, 25 and 26). It differs from the Agricultural goods AOA definition (see above). Fuels and mining products include ores and other minerals; fuels and non-ferrous metals. Manufactures refer to iron and steel, chemicals, other semi-manufactures, machinery and transport equipment, textiles, clothing and other consumer goods. Please note that due to the products not classified in the three main product groups, the sum of shares may not add up to 100.
Breakdown by main destination and origin: EU (27) members are grouped as one trading partner. Shares for unspecified destinations/origins are presented when at least one of the shares is greater than the share of the fifth main destination/origin. Re-imports are also included.
Commercial services (balance of payments based statistics)
The share in world total exports and imports of commercial services for individual economies is calculated using world trade including intra-EU (27) trade. For the EU (27) as one trading reporter the share is calculated on the basis of world trade excluding intra-EU (27) trade.
Breakdown by principal services items: Other commercial services refer to communication, construction, insurance, financial, computer, information, other business, and personal, cultural and recreational services, and royalties and license fees.
Industrial property
Data refer to the annual number of patents granted to (including those based on PCT international applications) and trademark registrations effected (including designations under the Madrid Agreement or Protocol) in the name of residents and non-residents of the considered economy.
Statistical sources:
Eurostat, online database; IMF, Balance of Payments Statistics and Government Finance Statistics; UNCTAD, TRAINS database; UNSD, Comtrade database (for OECD members, UNSD-OECD Joint Trade Data Collection and Processing System); World Bank, World Development Indicators; WIPO, Industrial Property Statistics; WTO and national statistics.
EU (27) refers to the EU members as of January 2007, including EC-12 members (Belgium, Denmark, France, Germany, Greece, Ireland, Italy, Luxembourg, Netherlands, Portugal, Spain and United Kingdom) and Austria, Bulgaria, Cyprus, Czech Republic, Estonia, Finland, Hungary, Latvia, Lithuania, Malta, Poland, Romania, Slovak Republic, Slovenia and Sweden. The Separate Customs Territory of Taiwan, Penghu, Kinmen and Matsu is referred to as Taipei, Chinese in the tables.
World Trade OrganizationTrade Profiles 20116 Download the data:
2010Share in world total exports Share in world total imports
Breakdown in economy's total imports By principal services item
Transportation Transportation
Direct residents Direct non-residents
Travel Travel Other commercial services Other commercial services
... ... ... ... ...
Patent grants by patent office Trademark registrations by officeResidents Non-residents Total
Outstanding notifications in WTO Central Registry
MFN duty free imports (%, 2008)
World Trade OrganizationTrade Profiles 2011
8 Download the data:www.wto.org/statistics
Albania
BASIC INDICATORS Population (thousands, 2010) 3 204 Rank in world trade, 2010 Exports ImportsGDP (million current US$, 2010) 11 786 Merchandise 134 118GDP (million current PPP US$, 2010) 28 252 excluding intra-EU trade 109 93Current account balance (million US$, 2010) - 1 404 Commercial services 89 100Trade per capita (US$, 2008-2010) 3 232 excluding intra-EU trade 63 74Trade to GDP ratio (2008-2010) 84.1
2010 128
Exports of goods and services (volume, 2005=100) 134Imports of goods and services (volume, 2005=100) 134
TRADE POLICY
WTO accession 8 September 2000 Contribution to WTO budget (%, 2011) 0.026Trade Policy Review 28, 30 April 2010 Import duties collected (%, 2007-2009) GPA accession Observer in total tax revenue 4.3Tariffs and duty free imports to total imports 1.5
Tariff binding coverage (%) 100 Number of notifications to WTO and measures in force MFN tariffs Applied 2010 10
Simple average of import duties Goods RTAs - services EIAs notified to WTO 4 - 1All goods 7.0 5.0 Anti-dumping (30 June 2010) ...
Agricultural goods (AOA) 9.5 7.9 Countervailing duties (30 June 2010) ...Non-agricultural goods 6.6 4.6 Safeguards (22 October 2010) 0
0.0 0.00 - 0
14.1 Original panel / Appellate Body (AB) reports 0 - 0 53.2 Compliance panel / AB reports (Article 21.5 DSU) 0 - 0
Agricultural products 6.9 Agricultural products 19.0Fuels and mining products 30.8 Fuels and mining products 17.4Manufactures 62.0 Manufactures 63.6
1. European Union (27) 70.0 1. European Union (27) 64.62. Serbia 8.3 2. China 6.33. Turkey 6.0 3. Turkey 5.74. China 5.5 4. Serbia 4.75. Switzerland 4.1 5. Russian Federation 2.2
COMMERCIAL SERVICES TRADE Value2010 2009
2 192 1 992
2010 0.06 0.06
Breakdown in economy's total exports By principal services item
11.3 15.9 73.6 68.3 15.1 15.8
INDUSTRIAL PROPERTY
Madrid Total 3 070 3 070
October 2011
Albania
Annual percentage change2005-2010 2009 2010
Real GDP (2005=100) 5 3 36 6 46 -12 -9
Final bound
Non ad-valorem duties (% total tariff lines) Number of disputes (complainant - defendant) Requests for consultation
in agricultural goods (AOA) in non-agricultural goods
Agricultural products 0.6 Agricultural products 18.3Fuels and mining products 98.6 Fuels and mining products 3.7Manufactures 0.8 Manufactures 78.0
1. European Union (27) 49.1 1. European Union (27) 50.32. United States 24.2 2. China 11.23. Canada 5.2 3. United States 5.24. Turkey 4.7 4. Korea, Republic of 4.85. Brazil 4.2 5. Japan 3.8
COMMERCIAL SERVICES TRADE Value2010 2009
3 373 11 376
2010 b 0.09 0.32
Breakdown in economy's total exports By principal services item
27.6 26.3 9.6 4.1
62.9 69.6
INDUSTRIAL PROPERTY
Madrid Total 1 976 1 976
October 2011
Algeria
Annual percentage change2005-2010 2009 2010
Real GDP (2005=100) 3 2 3-1 -3 ...7 17 ...
Final bound
Non ad-valorem duties (% total tariff lines) Number of disputes (complainant - defendant) Requests for consultation
in agricultural goods (AOA) in non-agricultural goods
2010 bShare in world total exports Share in world total imports
Breakdown in economy's total imports By principal services item
Transportation Transportation
Direct residents Direct non-residents
Travel Travel Other commercial services Other commercial services
... ... 214 ... ...
Patent grants by patent office, 2007 Trademark registrations by office, 2009Residents Non-residents Total
Outstanding notifications in WTO Central Registry
MFN duty free imports (%, 2009)
a Refers to 2009 and to the average annual percentage change for 2005-2009. b Breakdowns by services items refer to 2009.
Algeria
World Trade OrganizationTrade Profiles 2011
10 Download the data:www.wto.org/statistics
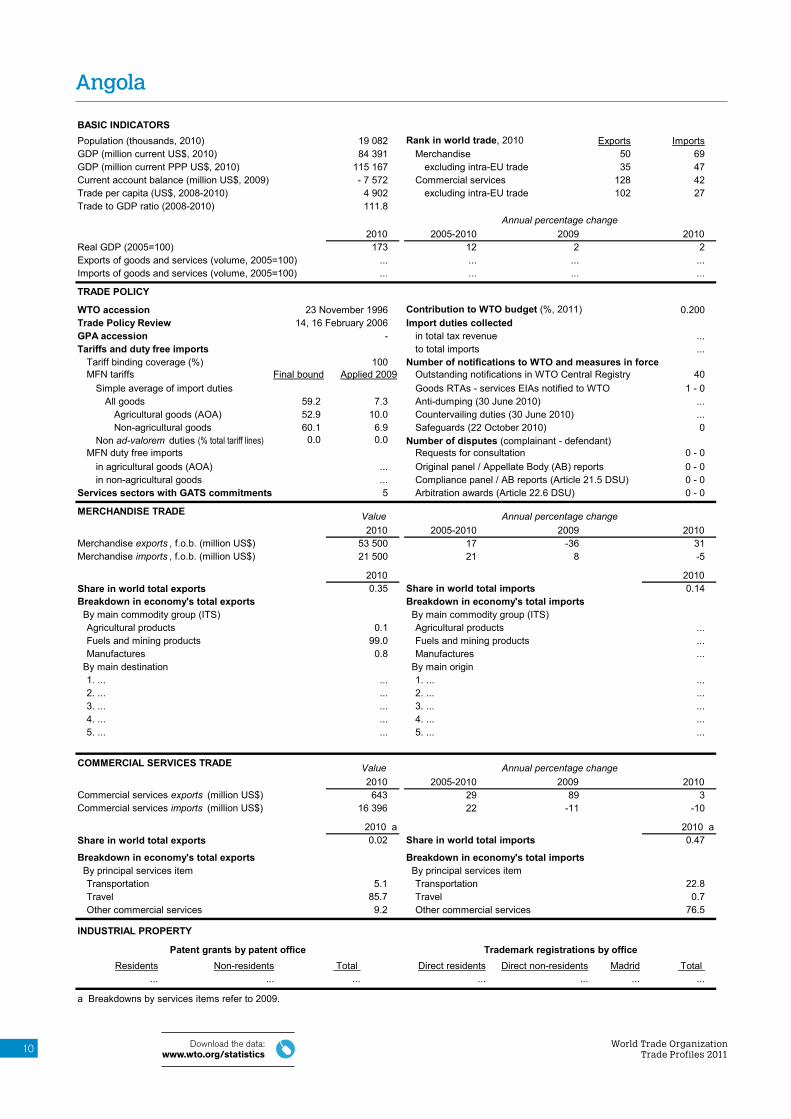
Angola
BASIC INDICATORS Population (thousands, 2010) 19 082 Rank in world trade, 2010 Exports ImportsGDP (million current US$, 2010) 84 391 Merchandise 50 69GDP (million current PPP US$, 2010) 115 167 excluding intra-EU trade 35 47Current account balance (million US$, 2009) - 7 572 Commercial services 128 42Trade per capita (US$, 2008-2010) 4 902 excluding intra-EU trade 102 27Trade to GDP ratio (2008-2010) 111.8
2010 173
Exports of goods and services (volume, 2005=100) ...Imports of goods and services (volume, 2005=100) ...
TRADE POLICY
WTO accession 23 November 1996 Contribution to WTO budget (%, 2011) 0.200Trade Policy Review 14, 16 February 2006 Import duties collected GPA accession - in total tax revenue ...Tariffs and duty free imports to total imports ...
Tariff binding coverage (%) 100 Number of notifications to WTO and measures in force MFN tariffs Applied 2009 40
Simple average of import duties Goods RTAs - services EIAs notified to WTO 1 - 0All goods 59.2 7.3 Anti-dumping (30 June 2010) ...
Agricultural goods (AOA) 52.9 10.0 Countervailing duties (30 June 2010) ...Non-agricultural goods 60.1 6.9 Safeguards (22 October 2010) 0
0.0 0.00 - 0
... Original panel / Appellate Body (AB) reports 0 - 0
2010 aShare in world total exports Share in world total imports
Breakdown in economy's total imports By principal services item
Transportation Transportation
Direct residents Direct non-residents
Travel Travel Other commercial services Other commercial services
... ... ... ... ...
Patent grants by patent office Trademark registrations by officeResidents Non-residents Total
Outstanding notifications in WTO Central Registry
MFN duty free imports
a Breakdowns by services items refer to 2009.
World Trade OrganizationTrade Profiles 2011
11Download the data:www.wto.org/statistics
CO
UN
TRY
PR
OFI
LES
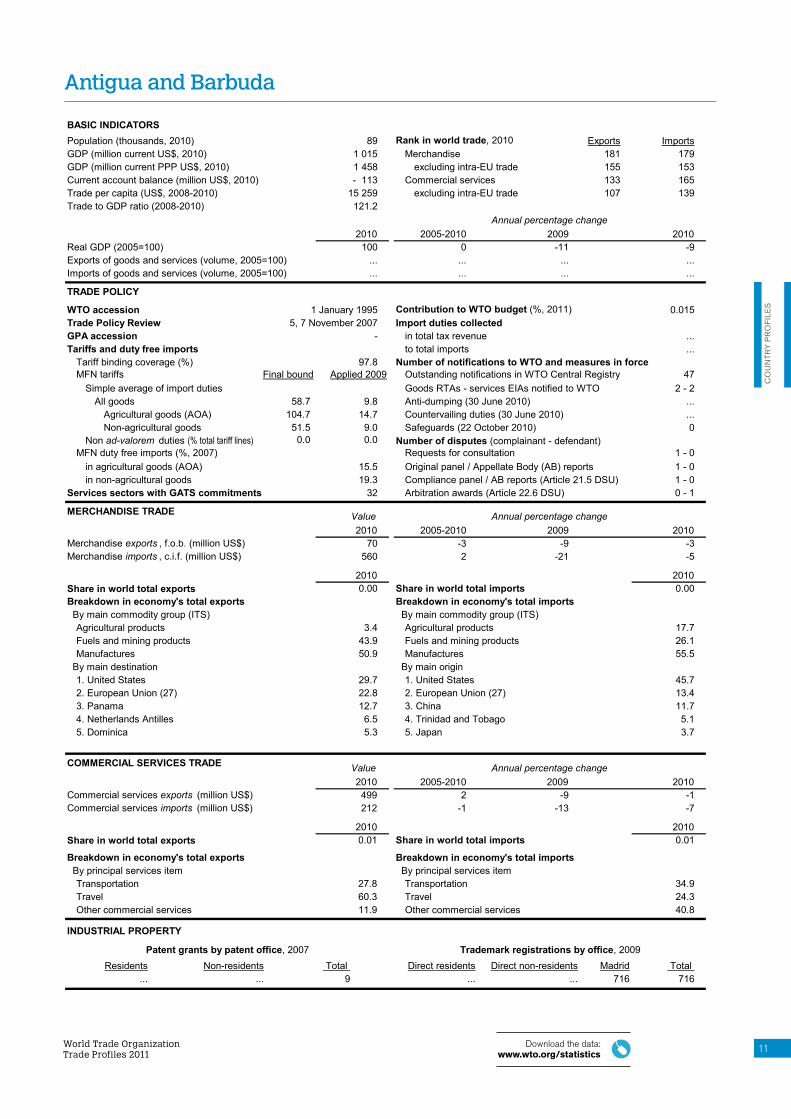
BASIC INDICATORS Population (thousands, 2010) 89 Rank in world trade, 2010 Exports ImportsGDP (million current US$, 2010) 1 015 Merchandise 181 179GDP (million current PPP US$, 2010) 1 458 excluding intra-EU trade 155 153Current account balance (million US$, 2010) - 113 Commercial services 133 165Trade per capita (US$, 2008-2010) 15 259 excluding intra-EU trade 107 139Trade to GDP ratio (2008-2010) 121.2
2010 100
Exports of goods and services (volume, 2005=100) ...Imports of goods and services (volume, 2005=100) ...
TRADE POLICY
WTO accession 1 January 1995 Contribution to WTO budget (%, 2011) 0.015Trade Policy Review 5, 7 November 2007 Import duties collected GPA accession - in total tax revenue ...Tariffs and duty free imports to total imports ...
Tariff binding coverage (%) 97.8 Number of notifications to WTO and measures in force MFN tariffs Applied 2009 47
Simple average of import duties Goods RTAs - services EIAs notified to WTO 2 - 2All goods 58.7 9.8 Anti-dumping (30 June 2010) ...
Agricultural goods (AOA) 104.7 14.7 Countervailing duties (30 June 2010) ...Non-agricultural goods 51.5 9.0 Safeguards (22 October 2010) 0
0.0 0.01 - 0
15.5 Original panel / Appellate Body (AB) reports 1 - 0 19.3 Compliance panel / AB reports (Article 21.5 DSU) 1 - 0
Agricultural products 3.4 Agricultural products 17.7Fuels and mining products 43.9 Fuels and mining products 26.1Manufactures 50.9 Manufactures 55.5
1. United States 29.7 1. United States 45.72. European Union (27) 22.8 2. European Union (27) 13.43. Panama 12.7 3. China 11.74. Netherlands Antilles 6.5 4. Trinidad and Tobago 5.15. Dominica 5.3 5. Japan 3.7
COMMERCIAL SERVICES TRADE Value2010 2009 499 212
2010 0.01 0.01
Breakdown in economy's total exports By principal services item
27.8 34.9 60.3 24.3 11.9 40.8
INDUSTRIAL PROPERTY
Madrid Total 716 716
October 2011
Antigua and Barbuda
Annual percentage change2005-2010 2009 2010
Real GDP (2005=100) 0 -11 -9... ... ...... ... ...
Final bound
Non ad-valorem duties (% total tariff lines) Number of disputes (complainant - defendant) Requests for consultation
in agricultural goods (AOA) in non-agricultural goods
2010Share in world total exports Share in world total imports
Breakdown in economy's total imports By principal services item
Transportation Transportation
Direct residents Direct non-residents
Travel Travel Other commercial services Other commercial services
... ... 9 ... ...
Patent grants by patent office, 2007 Trademark registrations by office, 2009Residents Non-residents Total
Outstanding notifications in WTO Central Registry
MFN duty free imports (%, 2007)
Antigua and Barbuda
World Trade OrganizationTrade Profiles 2011
12 Download the data:www.wto.org/statistics
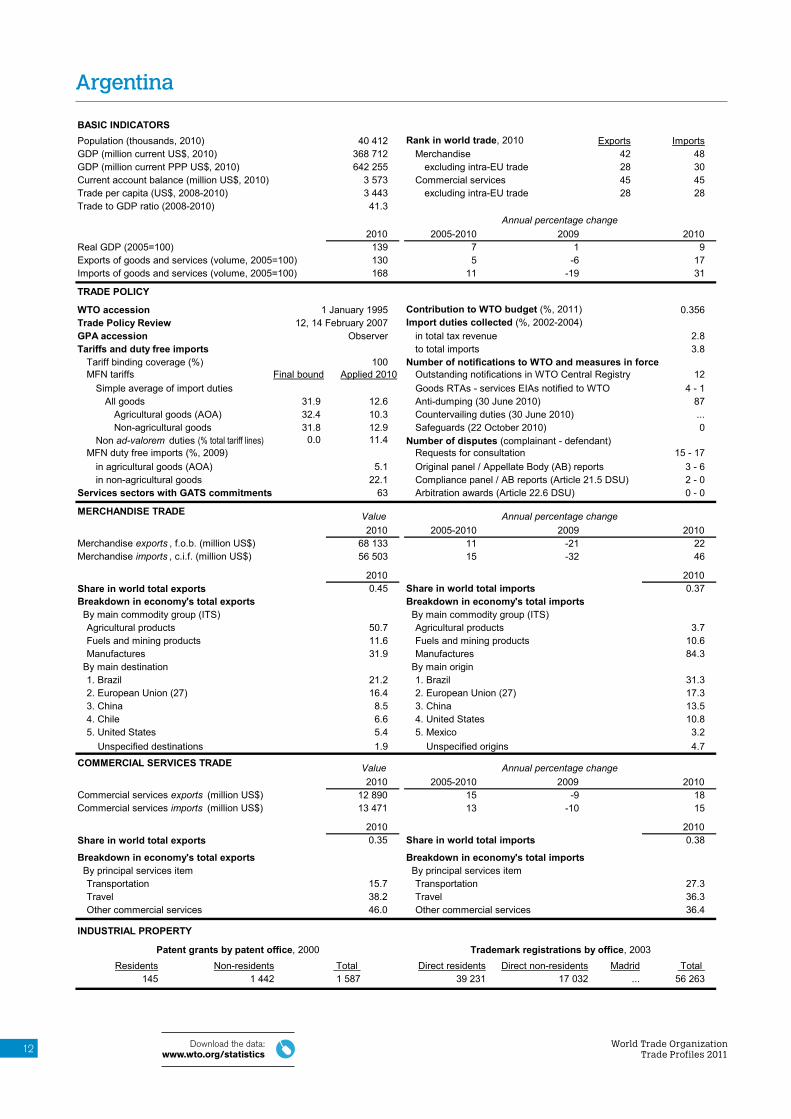
Argentina
BASIC INDICATORS Population (thousands, 2010) 40 412 Rank in world trade, 2010 Exports ImportsGDP (million current US$, 2010) 368 712 Merchandise 42 48GDP (million current PPP US$, 2010) 642 255 excluding intra-EU trade 28 30Current account balance (million US$, 2010) 3 573 Commercial services 45 45Trade per capita (US$, 2008-2010) 3 443 excluding intra-EU trade 28 28Trade to GDP ratio (2008-2010) 41.3
2010 139
Exports of goods and services (volume, 2005=100) 130Imports of goods and services (volume, 2005=100) 168
TRADE POLICY
WTO accession 1 January 1995 Contribution to WTO budget (%, 2011) 0.356Trade Policy Review 12, 14 February 2007 Import duties collected (%, 2002-2004) GPA accession Observer in total tax revenue 2.8Tariffs and duty free imports to total imports 3.8
Tariff binding coverage (%) 100 Number of notifications to WTO and measures in force MFN tariffs Applied 2010 12
Simple average of import duties Goods RTAs - services EIAs notified to WTO 4 - 1All goods 31.9 12.6 Anti-dumping (30 June 2010) 87
Agricultural goods (AOA) 32.4 10.3 Countervailing duties (30 June 2010) ...Non-agricultural goods 31.8 12.9 Safeguards (22 October 2010) 0
0.0 11.415 - 17
5.1 Original panel / Appellate Body (AB) reports 3 - 6 22.1 Compliance panel / AB reports (Article 21.5 DSU) 2 - 0
Agricultural products 50.7 Agricultural products 3.7Fuels and mining products 11.6 Fuels and mining products 10.6Manufactures 31.9 Manufactures 84.3
1. Brazil 21.2 1. Brazil 31.32. European Union (27) 16.4 2. European Union (27) 17.33. China 8.5 3. China 13.54. Chile 6.6 4. United States 10.85. United States 5.4 5. Mexico 3.2 Unspecified destinations 1.9 Unspecified origins 4.7
COMMERCIAL SERVICES TRADE Value2010 2009
12 890 13 471
2010 0.35 0.38
Breakdown in economy's total exports By principal services item
15.7 27.3 38.2 36.3 46.0 36.4
INDUSTRIAL PROPERTY
Madrid Total ... 56 263
October 2011
Argentina
Annual percentage change2005-2010 2009 2010
Real GDP (2005=100) 7 1 95 -6 17
11 -19 31
Final bound
Non ad-valorem duties (% total tariff lines) Number of disputes (complainant - defendant) Requests for consultation
in agricultural goods (AOA) in non-agricultural goods
2010Share in world total exports Share in world total imports
Breakdown in economy's total imports By principal services item
Transportation Transportation
Direct residents Direct non-residents
Travel Travel Other commercial services Other commercial services
145 1 442 1 587 39 231 17 032
Patent grants by patent office, 2000 Trademark registrations by office, 2003Residents Non-residents Total
Outstanding notifications in WTO Central Registry
MFN duty free imports (%, 2009)
World Trade OrganizationTrade Profiles 2011
13Download the data:www.wto.org/statistics
CO
UN
TRY
PR
OFI
LES
BASIC INDICATORS Population (thousands, 2010) 3 092 Rank in world trade, 2010 Exports ImportsGDP (million current US$, 2010) 9 265 Merchandise 145 131GDP (million current PPP US$, 2010) 16 556 excluding intra-EU trade 119 105Current account balance (million US$, 2010) - 1 301 Commercial services 123 125Trade per capita (US$, 2008-2010) 1 896 excluding intra-EU trade 97 99Trade to GDP ratio (2008-2010) 59.6
2010 119
Exports of goods and services (volume, 2005=100) 53Imports of goods and services (volume, 2005=100) 100
TRADE POLICY
WTO accession 5 February 2003 Contribution to WTO budget (%, 2011) 0.015Trade Policy Review 6, 8 April 2010 Import duties collected (%, 2007-2009) GPA accession Observer in total tax revenue 5.1Tariffs and duty free imports to total imports 2.2
Tariff binding coverage (%) 100 Number of notifications to WTO and measures in force MFN tariffs Applied 2008 9
Simple average of import duties Goods RTAs - services EIAs notified to WTO 8 - 0All goods 8.5 2.8 Anti-dumping (30 June 2010) ...
Agricultural goods (AOA) 14.7 6.8 Countervailing duties (30 June 2010) ...Non-agricultural goods 7.6 2.2 Safeguards (22 October 2010) 0
0.0 0.40 - 1
27.9 Original panel / Appellate Body (AB) reports 0 - 0 77.4 Compliance panel / AB reports (Article 21.5 DSU) 0 - 0
Agricultural products 16.4 Agricultural products 18.4Fuels and mining products 47.8 Fuels and mining products 20.8Manufactures 31.0 Manufactures 55.5
1. European Union (27) 49.5 1. European Union (27) 25.42. Russian Federation 15.8 2. Russian Federation 21.93. United States 8.1 3. China 10.64. Georgia 4.8 4. Ukraine 6.15. Iran, Islamic Rep. of 3.9 5. Iran, Islamic Rep. of 5.8
COMMERCIAL SERVICES TRADE Value2010 2009 737 973
2010 0.02 0.03
Breakdown in economy's total exports By principal services item
20.2 45.9 54.7 40.3 25.0 13.8
INDUSTRIAL PROPERTY
Madrid Total 2 596 3 892
October 2011
Armenia
Annual percentage change2005-2010 2009 2010
Real GDP (2005=100) 4 -14 1-12 -33 2
0 -21 1
Final bound
Non ad-valorem duties (% total tariff lines) Number of disputes (complainant - defendant) Requests for consultation
in agricultural goods (AOA) in non-agricultural goods
2010Share in world total exports Share in world total imports
Breakdown in economy's total imports By principal services item
Transportation Transportation
Direct residents Direct non-residents
Travel Travel Other commercial services Other commercial services
149 7 156 773 523
Patent grants by patent office, 2009 Trademark registrations by office, 2009Residents Non-residents Total
Outstanding notifications in WTO Central Registry
MFN duty free imports (%, 2008)
Armenia
World Trade OrganizationTrade Profiles 2011
14 Download the data:www.wto.org/statistics
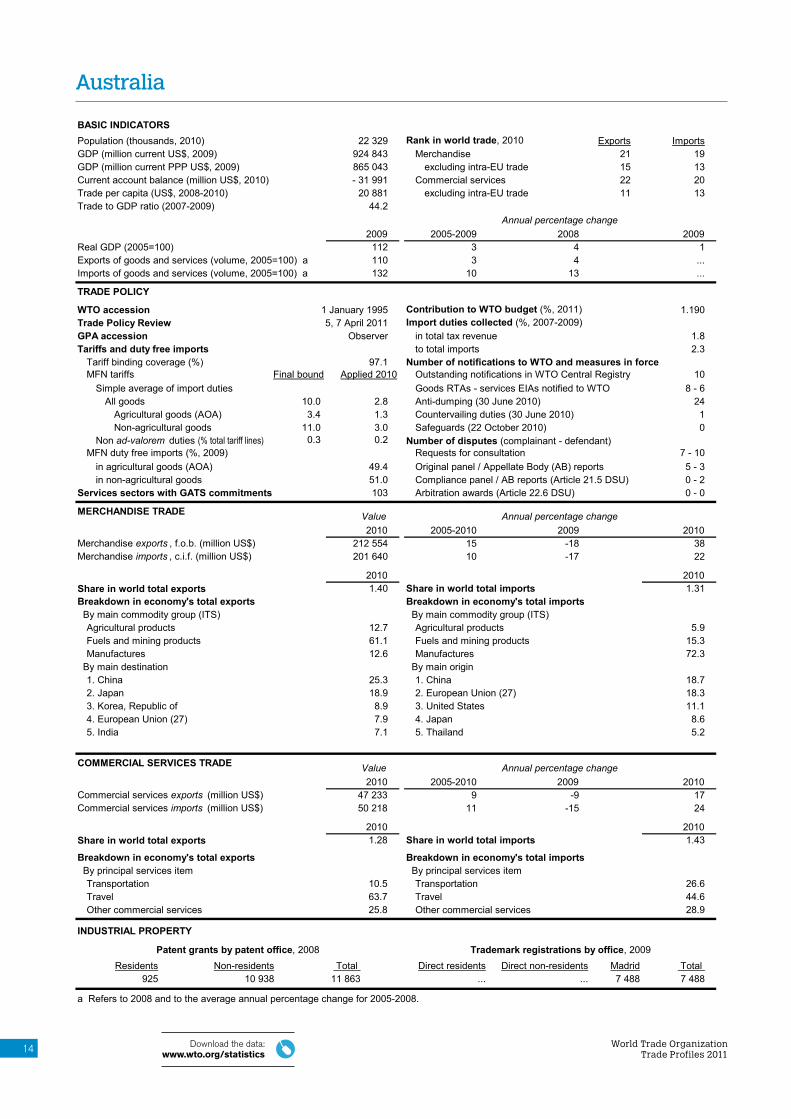
Australia
BASIC INDICATORS Population (thousands, 2010) 22 329 Rank in world trade, 2010 Exports ImportsGDP (million current US$, 2009) 924 843 Merchandise 21 19GDP (million current PPP US$, 2009) 865 043 excluding intra-EU trade 15 13Current account balance (million US$, 2010) - 31 991 Commercial services 22 20Trade per capita (US$, 2008-2010) 20 881 excluding intra-EU trade 11 13Trade to GDP ratio (2007-2009) 44.2
2009 112
Exports of goods and services (volume, 2005=100) a 110Imports of goods and services (volume, 2005=100) a 132
TRADE POLICY
WTO accession 1 January 1995 Contribution to WTO budget (%, 2011) 1.190Trade Policy Review 5, 7 April 2011 Import duties collected (%, 2007-2009) GPA accession Observer in total tax revenue 1.8Tariffs and duty free imports to total imports 2.3
Tariff binding coverage (%) 97.1 Number of notifications to WTO and measures in force MFN tariffs Applied 2010 10
Simple average of import duties Goods RTAs - services EIAs notified to WTO 8 - 6All goods 10.0 2.8 Anti-dumping (30 June 2010) 24
Agricultural goods (AOA) 3.4 1.3 Countervailing duties (30 June 2010) 1Non-agricultural goods 11.0 3.0 Safeguards (22 October 2010) 0
0.3 0.27 - 10
49.4 Original panel / Appellate Body (AB) reports 5 - 3 51.0 Compliance panel / AB reports (Article 21.5 DSU) 0 - 2
Agricultural products 12.7 Agricultural products 5.9Fuels and mining products 61.1 Fuels and mining products 15.3Manufactures 12.6 Manufactures 72.3
1. China 25.3 1. China 18.72. Japan 18.9 2. European Union (27) 18.33. Korea, Republic of 8.9 3. United States 11.14. European Union (27) 7.9 4. Japan 8.65. India 7.1 5. Thailand 5.2
COMMERCIAL SERVICES TRADE Value2010 2009
47 233 50 218
2010 1.28 1.43
Breakdown in economy's total exports By principal services item
10.5 26.6 63.7 44.6 25.8 28.9
INDUSTRIAL PROPERTY
Madrid Total 7 488 7 488
October 2011
Australia
Annual percentage change2005-2009 2008 2009
Real GDP (2005=100) 3 4 13 4 ...
10 13 ...
Final bound
Non ad-valorem duties (% total tariff lines) Number of disputes (complainant - defendant) Requests for consultation
in agricultural goods (AOA) in non-agricultural goods
2010Share in world total exports Share in world total imports
Breakdown in economy's total imports By principal services item
Transportation Transportation
Direct residents Direct non-residents
Travel Travel Other commercial services Other commercial services
925 10 938 11 863 ... ...
Patent grants by patent office, 2008 Trademark registrations by office, 2009Residents Non-residents Total
Outstanding notifications in WTO Central Registry
MFN duty free imports (%, 2009)
a Refers to 2008 and to the average annual percentage change for 2005-2008.
World Trade OrganizationTrade Profiles 2011
15Download the data:www.wto.org/statistics
CO
UN
TRY
PR
OFI
LES
BASIC INDICATORS Population (thousands, 2010) 8 385 Rank in world trade, 2010 Exports ImportsGDP (million current US$, 2010) 376 162 Merchandise 29 27GDP (million current PPP US$, 2010) 332 861 excluding intra-EU trade - -Current account balance (million US$, 2010) 10 278 Commercial services 21 29Trade per capita (US$, 2008-2010) 48 465 excluding intra-EU trade - -Trade to GDP ratio (2008-2010) 103.7
2010 108
Exports of goods and services (volume, 2005=100) a 99Imports of goods and services (volume, 2005=100) a 96
TRADE POLICY
WTO accession 1 January 1995 Contribution to WTO budget (%, 2011) 1.267Trade Policy Review 6, 8 July 2011 Import duties collected GPA accession 1 January 1996 in total tax revenue ...Tariffs and duty free imports to total imports ...
Tariff binding coverage (%) 100 Number of notifications to WTO and measures in force MFN tariffs Applied 2010 18
Simple average of import duties Goods RTAs - services EIAs notified to WTO 31 - 10All goods 5.0 5.1 Anti-dumping (30 June 2010) 149
Agricultural goods (AOA) 12.3 12.8 Countervailing duties (30 June 2010) 8Non-agricultural goods 3.9 4.0 Safeguards (22 October 2010) 0
4.8 4.785 - 70
41.1 Original panel / Appellate Body (AB) reports 33 - 32 51.4 Compliance panel / AB reports (Article 21.5 DSU) 4 - 4
Agricultural products 9.5 Agricultural products 9.7Fuels and mining products 6.9 Fuels and mining products 15.5Manufactures 81.8 Manufactures 73.1
1. European Union (27) 70.5 1. European Union (27) 72.32. Switzerland 5.1 2. Switzerland 5.43. United States 4.5 3. China 4.84. China 2.6 4. United States 2.95. Russian Federation 2.3 5. Russian Federation 2.0
COMMERCIAL SERVICES TRADE Value2010 2009
53 990 36 756
2010 1.46 1.05
Breakdown in economy's total exports By principal services item
23.7 32.6 34.5 27.8 41.8 39.6
INDUSTRIAL PROPERTY
Madrid Total 3 861 9 842
October 2011
Austria
Annual percentage change2005-2010 2009 2010
Real GDP (2005=100) 1 -4 20 -16 ...
-1 -14 ...
Final bound
Non ad-valorem duties (% total tariff lines) Number of disputes (complainant - defendant) Requests for consultation
in agricultural goods (AOA) in non-agricultural goods
2010Share in world total exports Share in world total imports
Breakdown in economy's total imports By principal services item
Transportation Transportation
Direct residents Direct non-residents
Travel Travel Other commercial services Other commercial services
1 327 237 1 564 5 324 657
Patent grants by patent office, 2006 Trademark registrations by office, 2009Residents Non-residents Total
Outstanding notifications in WTO Central Registry
MFN duty free imports (%, 2009)
a Refers to 2009 and to the average annual percentage change for 2005-2009.
Austria
World Trade OrganizationTrade Profiles 2011
16 Download the data:www.wto.org/statistics
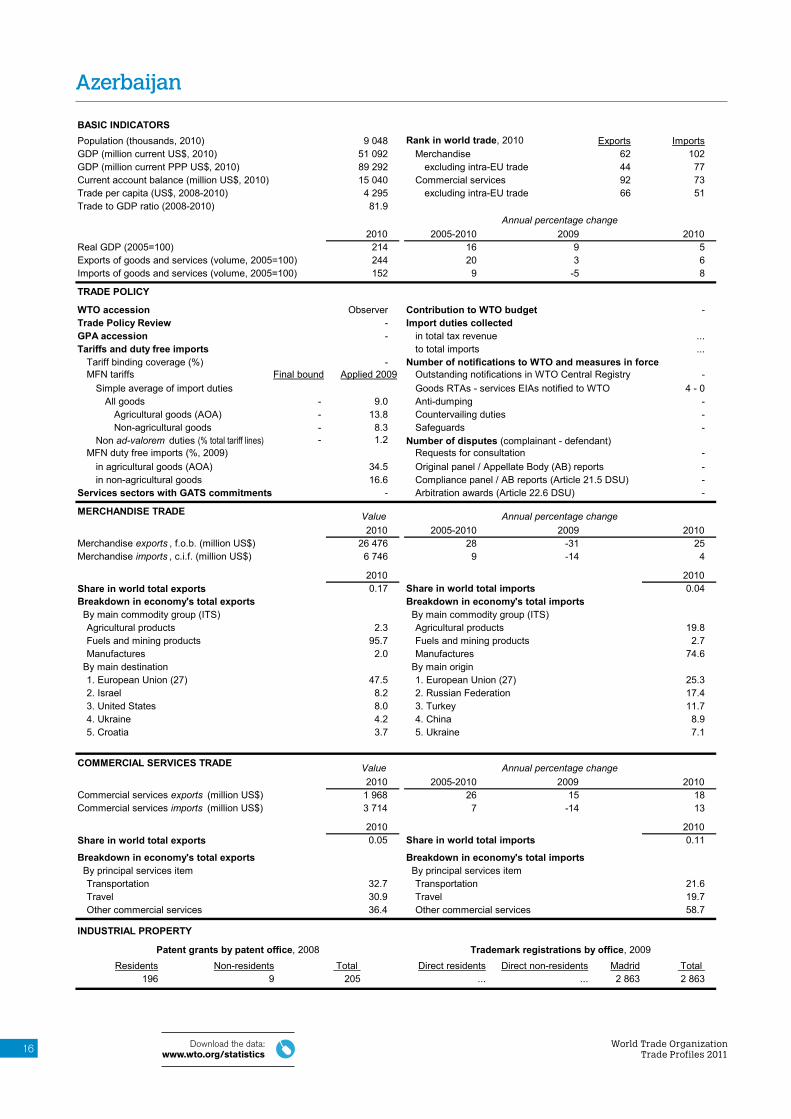
Azerbaijan
BASIC INDICATORS Population (thousands, 2010) 9 048 Rank in world trade, 2010 Exports ImportsGDP (million current US$, 2010) 51 092 Merchandise 62 102GDP (million current PPP US$, 2010) 89 292 excluding intra-EU trade 44 77Current account balance (million US$, 2010) 15 040 Commercial services 92 73Trade per capita (US$, 2008-2010) 4 295 excluding intra-EU trade 66 51Trade to GDP ratio (2008-2010) 81.9
2010 214
Exports of goods and services (volume, 2005=100) 244Imports of goods and services (volume, 2005=100) 152
TRADE POLICY
WTO accession Observer Contribution to WTO budget -Trade Policy Review - Import duties collected GPA accession - in total tax revenue ...Tariffs and duty free imports to total imports ...
Tariff binding coverage (%) - Number of notifications to WTO and measures in force MFN tariffs Applied 2009 -
Simple average of import duties Goods RTAs - services EIAs notified to WTO 4 - 0All goods - 9.0 Anti-dumping -
Agricultural products 2.3 Agricultural products 19.8Fuels and mining products 95.7 Fuels and mining products 2.7Manufactures 2.0 Manufactures 74.6
1. European Union (27) 47.5 1. European Union (27) 25.32. Israel 8.2 2. Russian Federation 17.43. United States 8.0 3. Turkey 11.74. Ukraine 4.2 4. China 8.95. Croatia 3.7 5. Ukraine 7.1
COMMERCIAL SERVICES TRADE Value2010 2009
1 968 3 714
2010 0.05 0.11
Breakdown in economy's total exports By principal services item
32.7 21.6 30.9 19.7 36.4 58.7
INDUSTRIAL PROPERTY
Madrid Total 2 863 2 863
October 2011
Azerbaijan
Annual percentage change2005-2010 2009 2010
Real GDP (2005=100) 16 9 520 3 69 -5 8
Final bound
Non ad-valorem duties (% total tariff lines) Number of disputes (complainant - defendant) Requests for consultation
in agricultural goods (AOA) in non-agricultural goods
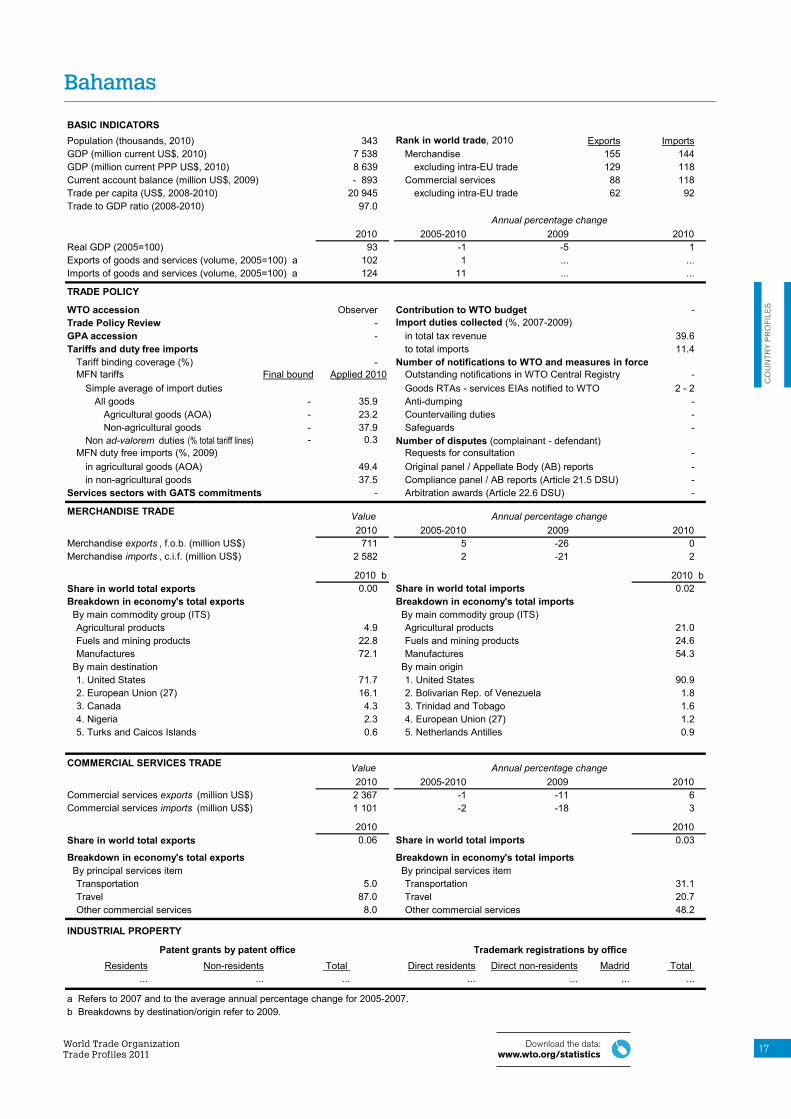
Agricultural products 4.9 Agricultural products 21.0Fuels and mining products 22.8 Fuels and mining products 24.6Manufactures 72.1 Manufactures 54.3
1. United States 71.7 1. United States 90.92. European Union (27) 16.1 2. Bolivarian Rep. of Venezuela 1.83. Canada 4.3 3. Trinidad and Tobago 1.64. Nigeria 2.3 4. European Union (27) 1.25. Turks and Caicos Islands 0.6 5. Netherlands Antilles 0.9
COMMERCIAL SERVICES TRADE Value2010 2009
2 367 1 101
2010 0.06 0.03
Breakdown in economy's total exports By principal services item
5.0 31.1 87.0 20.7 8.0 48.2
INDUSTRIAL PROPERTY
Madrid Total ... ...
October 2011
Bahamas
Annual percentage change2005-2010 2009 2010
Real GDP (2005=100) -1 -5 11 ... ...
11 ... ...
Final bound
Non ad-valorem duties (% total tariff lines) Number of disputes (complainant - defendant) Requests for consultation
in agricultural goods (AOA) in non-agricultural goods
2010Share in world total exports Share in world total imports
Breakdown in economy's total imports By principal services item
Transportation Transportation
Direct residents Direct non-residents
Travel Travel Other commercial services Other commercial services
... ... ... ... ...
Patent grants by patent office Trademark registrations by officeResidents Non-residents Total
Outstanding notifications in WTO Central Registry
MFN duty free imports (%, 2009)
a Refers to 2007 and to the average annual percentage change for 2005-2007. b Breakdowns by destination/origin refer to 2009.
Bahamas
World Trade OrganizationTrade Profiles 2011
18 Download the data:www.wto.org/statistics
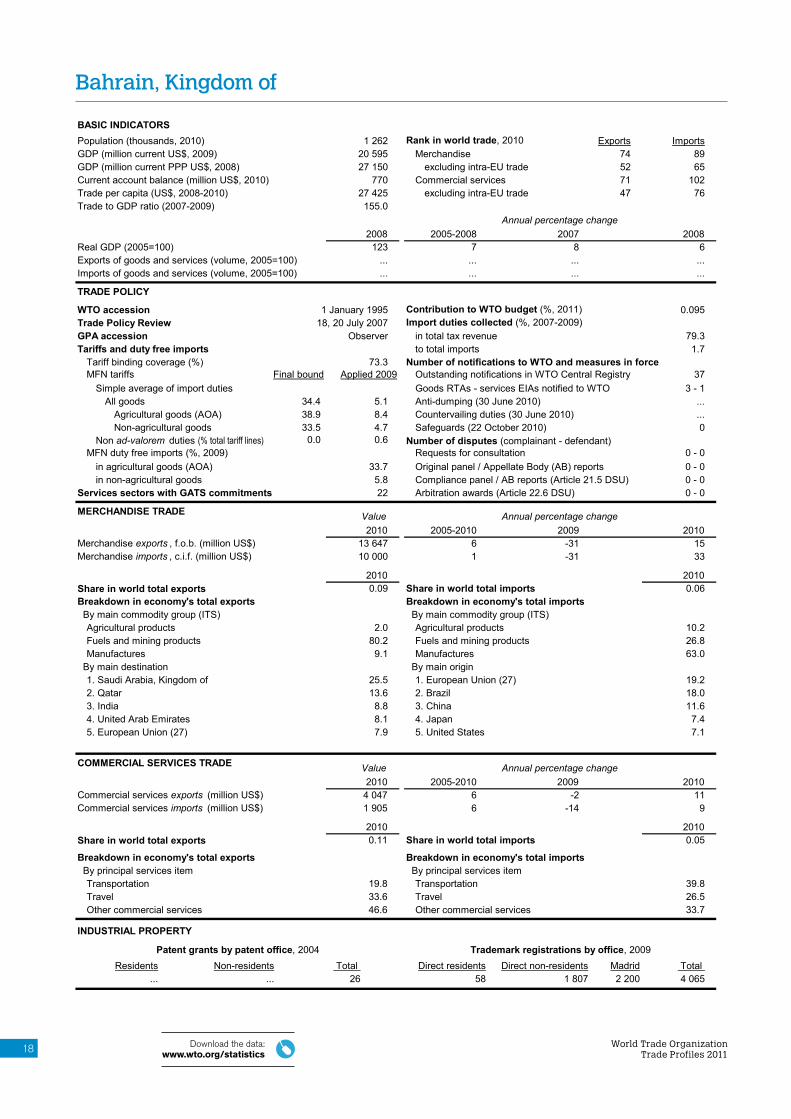
Bahrain, Kingdom of
BASIC INDICATORS Population (thousands, 2010) 1 262 Rank in world trade, 2010 Exports ImportsGDP (million current US$, 2009) 20 595 Merchandise 74 89GDP (million current PPP US$, 2008) 27 150 excluding intra-EU trade 52 65Current account balance (million US$, 2010) 770 Commercial services 71 102Trade per capita (US$, 2008-2010) 27 425 excluding intra-EU trade 47 76Trade to GDP ratio (2007-2009) 155.0
2008 123
Exports of goods and services (volume, 2005=100) ...Imports of goods and services (volume, 2005=100) ...
TRADE POLICY
WTO accession 1 January 1995 Contribution to WTO budget (%, 2011) 0.095Trade Policy Review 18, 20 July 2007 Import duties collected (%, 2007-2009) GPA accession Observer in total tax revenue 79.3Tariffs and duty free imports to total imports 1.7
Tariff binding coverage (%) 73.3 Number of notifications to WTO and measures in force MFN tariffs Applied 2009 37
Simple average of import duties Goods RTAs - services EIAs notified to WTO 3 - 1All goods 34.4 5.1 Anti-dumping (30 June 2010) ...
Agricultural goods (AOA) 38.9 8.4 Countervailing duties (30 June 2010) ...Non-agricultural goods 33.5 4.7 Safeguards (22 October 2010) 0
0.0 0.60 - 0
33.7 Original panel / Appellate Body (AB) reports 0 - 0 5.8 Compliance panel / AB reports (Article 21.5 DSU) 0 - 0
Agricultural products 2.0 Agricultural products 10.2Fuels and mining products 80.2 Fuels and mining products 26.8Manufactures 9.1 Manufactures 63.0
1. Saudi Arabia, Kingdom of 25.5 1. European Union (27) 19.22. Qatar 13.6 2. Brazil 18.03. India 8.8 3. China 11.64. United Arab Emirates 8.1 4. Japan 7.45. European Union (27) 7.9 5. United States 7.1
COMMERCIAL SERVICES TRADE Value2010 2009
4 047 1 905
2010 0.11 0.05
Breakdown in economy's total exports By principal services item
19.8 39.8 33.6 26.5 46.6 33.7
INDUSTRIAL PROPERTY
Madrid Total 2 200 4 065
October 2011
Bahrain
Annual percentage change2005-2008 2007 2008
Real GDP (2005=100) 7 8 6... ... ...... ... ...
Final bound
Non ad-valorem duties (% total tariff lines) Number of disputes (complainant - defendant) Requests for consultation
in agricultural goods (AOA) in non-agricultural goods
2010Share in world total exports Share in world total imports
Breakdown in economy's total imports By principal services item
Transportation Transportation
Direct residents Direct non-residents
Travel Travel Other commercial services Other commercial services
... ... 26 58 1 807
Patent grants by patent office, 2004 Trademark registrations by office, 2009Residents Non-residents Total
Outstanding notifications in WTO Central Registry
MFN duty free imports (%, 2009)
World Trade OrganizationTrade Profiles 2011
19Download the data:www.wto.org/statistics
CO
UN
TRY
PR
OFI
LES
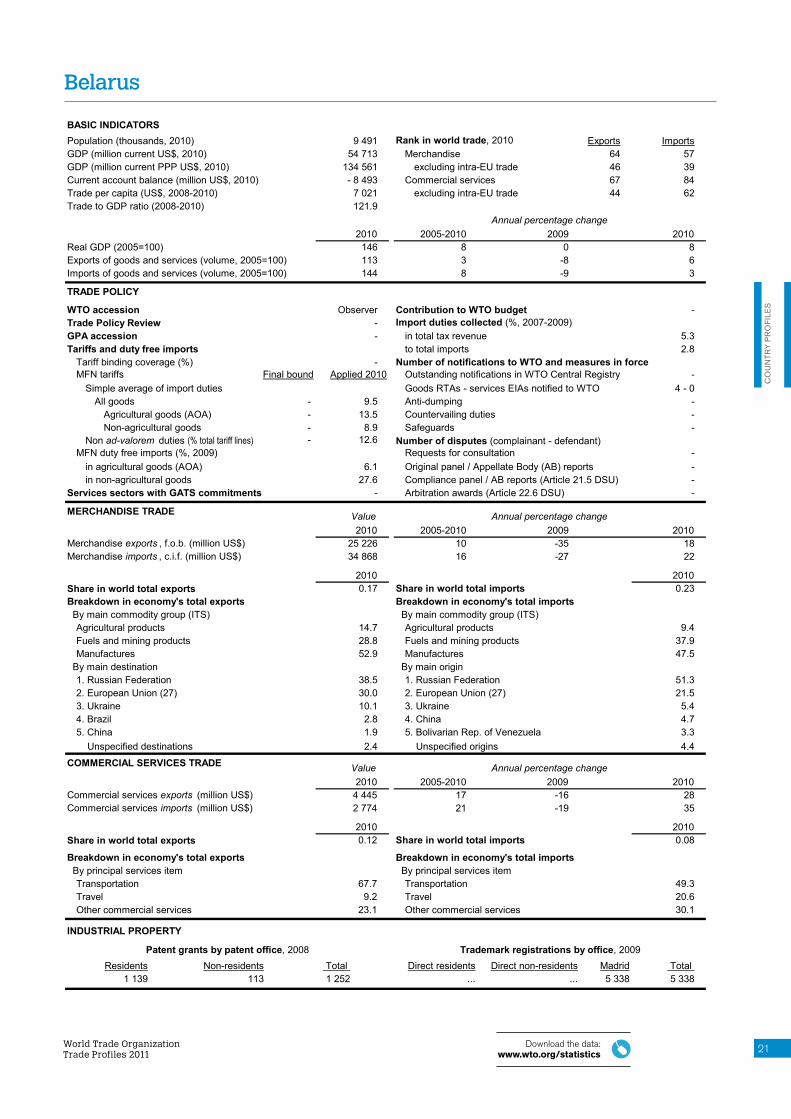
BASIC INDICATORS Population (thousands, 2010) 148 692 Rank in world trade, 2010 Exports ImportsGDP (million current US$, 2010) 100 076 Merchandise 70 62GDP (million current PPP US$, 2010) 244 328 excluding intra-EU trade 48 43Current account balance (million US$, 2010) 2 502 Commercial services 107 71Trade per capita (US$, 2008-2010) 294 excluding intra-EU trade 81 50Trade to GDP ratio (2008-2010) 48.2
2010 135
Exports of goods and services (volume, 2005=100) 153Imports of goods and services (volume, 2005=100) 130
TRADE POLICY
WTO accession 1 January 1995 Contribution to WTO budget (%, 2011) 0.103Trade Policy Review 13, 15 September 2006 Import duties collected (%, 2005-2007) GPA accession - in total tax revenue 39.1Tariffs and duty free imports to total imports 11.8
Tariff binding coverage (%) 15.5 Number of notifications to WTO and measures in force MFN tariffs Applied 2008 24
Simple average of import duties Goods RTAs - services EIAs notified to WTO 5 - 0All goods 169.2 14.7 Anti-dumping (30 June 2010) ...
Agricultural goods (AOA) 192.0 17.6 Countervailing duties (30 June 2010) ...Non-agricultural goods 34.4 14.3 Safeguards (22 October 2010) 0
0.0 0.41 - 0
27.8 Original panel / Appellate Body (AB) reports 0 - 0 16.6 Compliance panel / AB reports (Article 21.5 DSU) 0 - 0
Agricultural products 5.3 Agricultural products 21.5Fuels and mining products 1.3 Fuels and mining products 9.8Manufactures 93.3 Manufactures 68.0
1. European Union (27) 51.2 1. China 15.62. United States 25.7 2. India 13.23. India 4.0 3. European Union (27) 9.74. Canada 3.5 4. Kuwait 7.25. China 1.7 5. Indonesia 5.1
COMMERCIAL SERVICES TRADE Value2010 2009
1 213 4 099
2010 0.03 0.12
Breakdown in economy's total exports By principal services item
14.3 83.0 6.7 6.4
79.0 10.7
INDUSTRIAL PROPERTY
Madrid Total ... 619
October 2011
Bangladesh
Annual percentage change2005-2010 2009 2010
Real GDP (2005=100) 6 6 69 0 15 -3 -1
Final bound
Non ad-valorem duties (% total tariff lines) Number of disputes (complainant - defendant) Requests for consultation
in agricultural goods (AOA) in non-agricultural goods
2010Share in world total exports Share in world total imports
Breakdown in economy's total imports By principal services item
Transportation Transportation
Direct residents Direct non-residents
Travel Travel Other commercial services Other commercial services
27 269 296 126 493
Patent grants by patent office, 2007 Trademark registrations by office, 2007Residents Non-residents Total
Outstanding notifications in WTO Central Registry
MFN duty free imports (%, 2007)
a Breakdowns by destination/origin refer to 2007.
Bangladesh
World Trade OrganizationTrade Profiles 2011
20 Download the data:www.wto.org/statistics
Barbados
BASIC INDICATORS Population (thousands, 2010) 273 Rank in world trade, 2010 Exports ImportsGDP (million current US$, 2010) 3 203 Merchandise 161 155GDP (million current PPP US$, 2009) 5 251 excluding intra-EU trade 135 129Current account balance (million US$, 2009) - 302 Commercial services 100 148Trade per capita (US$, 2008-2010) 14 085 excluding intra-EU trade 74 122Trade to GDP ratio (2008-2010) 110.1
2009 99
Exports of goods and services (volume, 2005=100) ...Imports of goods and services (volume, 2005=100) ...
TRADE POLICY
WTO accession 1 January 1995 Contribution to WTO budget (%, 2011) 0.015Trade Policy Review 17, 19 September 2008 Import duties collected (%, 2003-2004) GPA accession - in total tax revenue 10.6Tariffs and duty free imports to total imports 5.4
Tariff binding coverage (%) 97.8 Number of notifications to WTO and measures in force MFN tariffs Applied 2007 39
Simple average of import duties Goods RTAs - services EIAs notified to WTO 2 - 2All goods 78.1 13.5 Anti-dumping (30 June 2010) ...
Agricultural goods (AOA) 110.8 31.0 Countervailing duties (30 June 2010) ...Non-agricultural goods 73.0 10.8 Safeguards (22 October 2010) 0
0.0 0.50 - 0
12.4 Original panel / Appellate Body (AB) reports 0 - 0 4.0 Compliance panel / AB reports (Article 21.5 DSU) 0 - 0
Agricultural products 21.4 Agricultural products 20.3Fuels and mining products 0.6 Fuels and mining products 2.1Manufactures 50.4 Manufactures 53.4
1. United States 24.9 1. United States 43.92. European Union (27) 20.4 2. European Union (27) 15.03. Trinidad and Tobago 8.4 3. Trinidad and Tobago 7.24. Saint Lucia 5.8 4. China 4.85. Jamaica 5.6 5. Canada 4.4
COMMERCIAL SERVICES TRADE Value2010 2009
1 420 546
2010 a 0.04 0.02
Breakdown in economy's total exports By principal services item
2.9 26.4 77.1 12.9 20.0 60.7
INDUSTRIAL PROPERTY
Madrid Total ... 751
October 2011
Barbados
Annual percentage change2005-2009 2008 2009
Real GDP (2005=100) 0 0 -5... ... ...... ... ...
Final bound
Non ad-valorem duties (% total tariff lines) Number of disputes (complainant - defendant) Requests for consultation
in agricultural goods (AOA) in non-agricultural goods
2010Share in world total exports Share in world total imports
Breakdown in economy's total imports By principal services item
Transportation Transportation
Direct residents Direct non-residents
Travel Travel Other commercial services Other commercial services
1 139 113 1 252 ... ...
Patent grants by patent office, 2008 Trademark registrations by office, 2009Residents Non-residents Total
Outstanding notifications in WTO Central Registry
MFN duty free imports (%, 2009)
Belarus
World Trade OrganizationTrade Profiles 2011
22 Download the data:www.wto.org/statistics
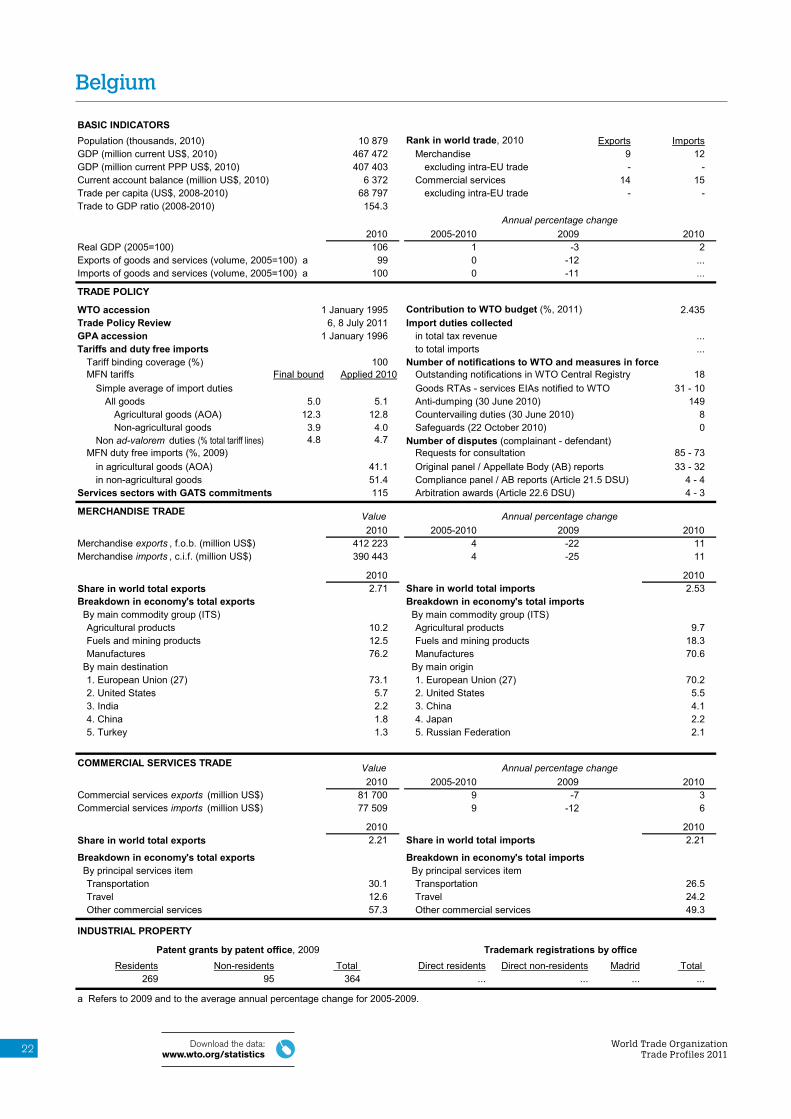
Belgium
BASIC INDICATORS Population (thousands, 2010) 10 879 Rank in world trade, 2010 Exports ImportsGDP (million current US$, 2010) 467 472 Merchandise 9 12GDP (million current PPP US$, 2010) 407 403 excluding intra-EU trade - -Current account balance (million US$, 2010) 6 372 Commercial services 14 15Trade per capita (US$, 2008-2010) 68 797 excluding intra-EU trade - -Trade to GDP ratio (2008-2010) 154.3
2010 106
Exports of goods and services (volume, 2005=100) a 99Imports of goods and services (volume, 2005=100) a 100
TRADE POLICY
WTO accession 1 January 1995 Contribution to WTO budget (%, 2011) 2.435Trade Policy Review 6, 8 July 2011 Import duties collected GPA accession 1 January 1996 in total tax revenue ...Tariffs and duty free imports to total imports ...
Tariff binding coverage (%) 100 Number of notifications to WTO and measures in force MFN tariffs Applied 2010 18
Simple average of import duties Goods RTAs - services EIAs notified to WTO 31 - 10All goods 5.0 5.1 Anti-dumping (30 June 2010) 149
Agricultural goods (AOA) 12.3 12.8 Countervailing duties (30 June 2010) 8Non-agricultural goods 3.9 4.0 Safeguards (22 October 2010) 0
4.8 4.785 - 73
41.1 Original panel / Appellate Body (AB) reports 33 - 32 51.4 Compliance panel / AB reports (Article 21.5 DSU) 4 - 4
Agricultural products 10.2 Agricultural products 9.7Fuels and mining products 12.5 Fuels and mining products 18.3Manufactures 76.2 Manufactures 70.6
1. European Union (27) 73.1 1. European Union (27) 70.22. United States 5.7 2. United States 5.53. India 2.2 3. China 4.14. China 1.8 4. Japan 2.25. Turkey 1.3 5. Russian Federation 2.1
COMMERCIAL SERVICES TRADE Value2010 2009
81 700 77 509
2010 2.21 2.21
Breakdown in economy's total exports By principal services item
30.1 26.5 12.6 24.2 57.3 49.3
INDUSTRIAL PROPERTY
Madrid Total ... ...
October 2011
Belgium
Annual percentage change2005-2010 2009 2010
Real GDP (2005=100) 1 -3 20 -12 ...0 -11 ...
Final bound
Non ad-valorem duties (% total tariff lines) Number of disputes (complainant - defendant) Requests for consultation
in agricultural goods (AOA) in non-agricultural goods
2010Share in world total exports Share in world total imports
Breakdown in economy's total imports By principal services item
Transportation Transportation
Direct residents Direct non-residents
Travel Travel Other commercial services Other commercial services
269 95 364 ... ...
Patent grants by patent office, 2009 Trademark registrations by officeResidents Non-residents Total
Outstanding notifications in WTO Central Registry
MFN duty free imports (%, 2009)
a Refers to 2009 and to the average annual percentage change for 2005-2009.
World Trade OrganizationTrade Profiles 2011
23Download the data:www.wto.org/statistics
CO
UN
TRY
PR
OFI
LES
BASIC INDICATORS Population (thousands, 2010) 345 Rank in world trade, 2010 Exports ImportsGDP (million current US$, 2010) 1 432 Merchandise 166 174GDP (million current PPP US$, 2010) 2 263 excluding intra-EU trade 140 148Current account balance (million US$, 2010) - 41 Commercial services 144 172Trade per capita (US$, 2008-2010) 4 868 excluding intra-EU trade 118 146Trade to GDP ratio (2008-2010) 117.5
2010 112
Exports of goods and services (volume, 2005=100) a 107Imports of goods and services (volume, 2005=100) a 114
TRADE POLICY
WTO accession 1 January 1995 Contribution to WTO budget (%, 2011) 0.015Trade Policy Review 3, 5 November 2010 Import duties collected GPA accession - in total tax revenue ...Tariffs and duty free imports to total imports ...
Tariff binding coverage (%) 97.9 Number of notifications to WTO and measures in force MFN tariffs Applied 2010 46
Simple average of import duties Goods RTAs - services EIAs notified to WTO 2 - 2All goods 58.2 11.0 Anti-dumping (30 June 2010) ...
Agricultural goods (AOA) 101.1 21.6 Countervailing duties (30 June 2010) ...Non-agricultural goods 51.5 9.3 Safeguards (22 October 2010) 0
0.0 0.60 - 0
34.6 Original panel / Appellate Body (AB) reports 0 - 0 19.1 Compliance panel / AB reports (Article 21.5 DSU) 0 - 0
Agricultural products 55.2 Agricultural products 17.0Fuels and mining products 38.3 Fuels and mining products 19.1Manufactures 1.4 Manufactures 58.9
1. United States 49.1 1. United States 47.92. European Union (27) 31.3 2. Mexico 10.03. Costa Rica 4.5 3. China 9.74. Japan 2.9 4. Guatemala 8.05. Mexico 2.8 5. Panama 5.4
COMMERCIAL SERVICES TRADE Value2010 2009 331 151
2010 0.01 0.00
Breakdown in economy's total exports By principal services item
5.8 36.6 79.8 24.2 14.4 39.3
INDUSTRIAL PROPERTY
Madrid Total ... 542
October 2011
Belize
Annual percentage change2005-2010 2009 2010
Real GDP (2005=100) 2 0 22 ... ...4 ... ...
Final bound
Non ad-valorem duties (% total tariff lines) Number of disputes (complainant - defendant) Requests for consultation
in agricultural goods (AOA) in non-agricultural goods
2010Share in world total exports Share in world total imports
Breakdown in economy's total imports By principal services item
Transportation Transportation
Direct residents Direct non-residents
Travel Travel Other commercial services Other commercial services
... 7 7 ... ...
Patent grants by patent office, 2006 Trademark registrations by office, 2008Residents Non-residents Total
Outstanding notifications in WTO Central Registry
MFN duty free imports (%, 2008)
a Refers to 2008 and to the average annual percentage change for 2005-2008.
Belize
World Trade OrganizationTrade Profiles 2011
24 Download the data:www.wto.org/statistics
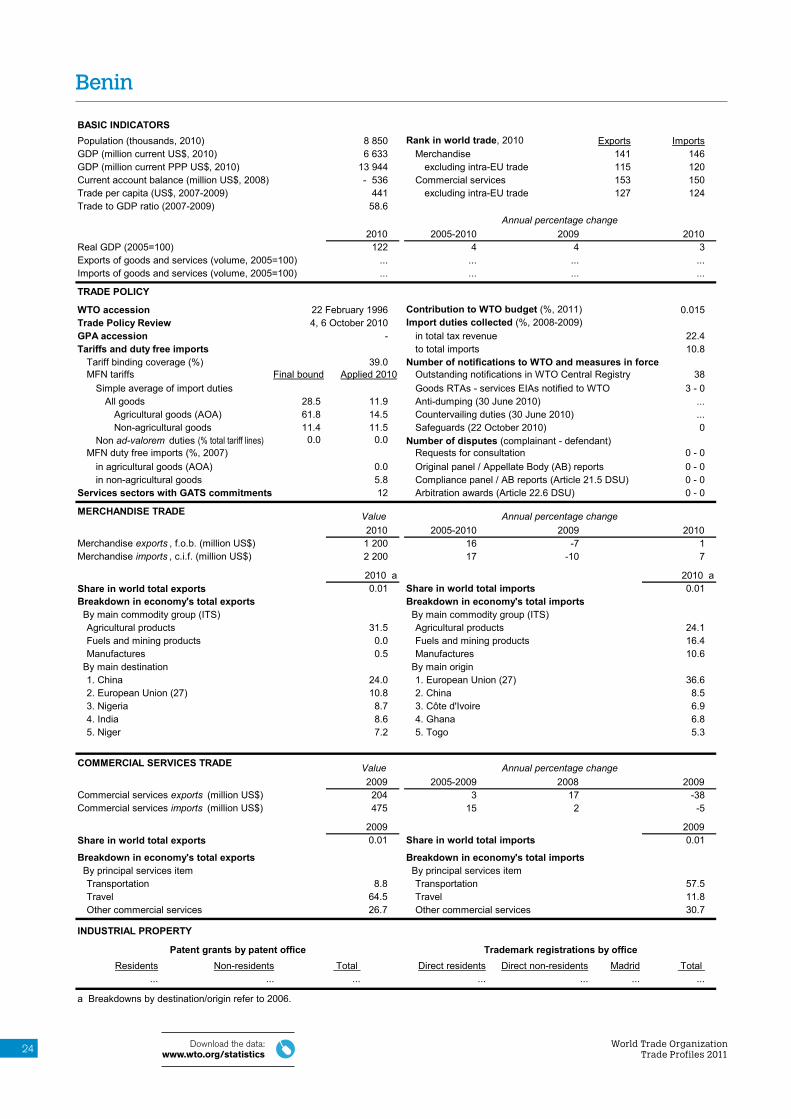
Benin
BASIC INDICATORS Population (thousands, 2010) 8 850 Rank in world trade, 2010 Exports ImportsGDP (million current US$, 2010) 6 633 Merchandise 141 146GDP (million current PPP US$, 2010) 13 944 excluding intra-EU trade 115 120Current account balance (million US$, 2008) - 536 Commercial services 153 150Trade per capita (US$, 2007-2009) 441 excluding intra-EU trade 127 124Trade to GDP ratio (2007-2009) 58.6
2010 122
Exports of goods and services (volume, 2005=100) ...Imports of goods and services (volume, 2005=100) ...
TRADE POLICY
WTO accession 22 February 1996 Contribution to WTO budget (%, 2011) 0.015Trade Policy Review 4, 6 October 2010 Import duties collected (%, 2008-2009) GPA accession - in total tax revenue 22.4Tariffs and duty free imports to total imports 10.8
Tariff binding coverage (%) 39.0 Number of notifications to WTO and measures in force MFN tariffs Applied 2010 38
Simple average of import duties Goods RTAs - services EIAs notified to WTO 3 - 0All goods 28.5 11.9 Anti-dumping (30 June 2010) ...
Agricultural goods (AOA) 61.8 14.5 Countervailing duties (30 June 2010) ...Non-agricultural goods 11.4 11.5 Safeguards (22 October 2010) 0
0.0 0.00 - 0
0.0 Original panel / Appellate Body (AB) reports 0 - 0 5.8 Compliance panel / AB reports (Article 21.5 DSU) 0 - 0
Agricultural products 31.5 Agricultural products 24.1Fuels and mining products 0.0 Fuels and mining products 16.4Manufactures 0.5 Manufactures 10.6
1. China 24.0 1. European Union (27) 36.62. European Union (27) 10.8 2. China 8.53. Nigeria 8.7 3. Côte d'Ivoire 6.94. India 8.6 4. Ghana 6.85. Niger 7.2 5. Togo 5.3
COMMERCIAL SERVICES TRADE Value2009 2008 204 475
2009 0.01 0.01
Breakdown in economy's total exports By principal services item
8.8 57.5 64.5 11.8 26.7 30.7
INDUSTRIAL PROPERTY
Madrid Total ... ...
October 2011
Benin
Annual percentage change2005-2010 2009 2010
Real GDP (2005=100) 4 4 3... ... ...... ... ...
Final bound
Non ad-valorem duties (% total tariff lines) Number of disputes (complainant - defendant) Requests for consultation
in agricultural goods (AOA) in non-agricultural goods
Agricultural products 1.0 Agricultural products 11.4Fuels and mining products 17.2 Fuels and mining products 20.2Manufactures 81.8 Manufactures 66.6
1. India 82.4 1. India 75.12. Hong Kong, China 11.6 2. Korea, Republic of 5.13. Bangladesh 4.8 3. European Union (27) 4.24. Japan 0.7 4. Thailand 2.55. Nepal 0.2 5. Singapore 2.3
COMMERCIAL SERVICES TRADE Value2009 2008 55 70
2009 0.00 0.00
Breakdown in economy's total exports By principal services item
15.8 6.5 76.8 55.3 7.4 38.3
INDUSTRIAL PROPERTY
Madrid Total 599 599
October 2011
Bhutan
Annual percentage change2005-2010 2009 2010
Real GDP (2005=100) 9 7 7... ... ...... ... ...
Final bound
Non ad-valorem duties (% total tariff lines) Number of disputes (complainant - defendant) Requests for consultation
in agricultural goods (AOA) in non-agricultural goods
2009Share in world total exports Share in world total imports
Breakdown in economy's total imports By principal services item
Transportation Transportation
Direct residents Direct non-residents
Travel Travel Other commercial services Other commercial services
... ... ... ... ...
Patent grants by patent office Trademark registrations by office, 2009Residents Non-residents Total
Outstanding notifications in WTO Central Registry
MFN duty free imports
Bhutan
World Trade OrganizationTrade Profiles 2011
26 Download the data:www.wto.org/statistics
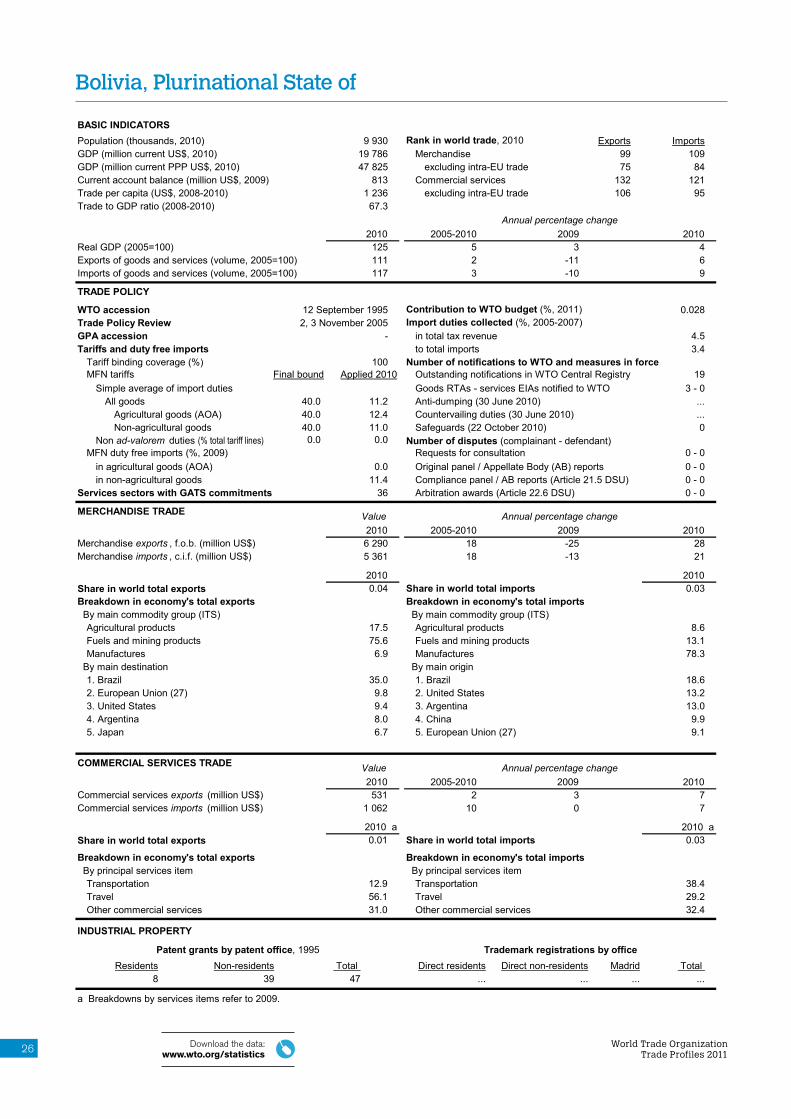
Bolivia, Plurinational State of
BASIC INDICATORS Population (thousands, 2010) 9 930 Rank in world trade, 2010 Exports ImportsGDP (million current US$, 2010) 19 786 Merchandise 99 109GDP (million current PPP US$, 2010) 47 825 excluding intra-EU trade 75 84Current account balance (million US$, 2009) 813 Commercial services 132 121Trade per capita (US$, 2008-2010) 1 236 excluding intra-EU trade 106 95Trade to GDP ratio (2008-2010) 67.3
2010 125
Exports of goods and services (volume, 2005=100) 111Imports of goods and services (volume, 2005=100) 117
TRADE POLICY
WTO accession 12 September 1995 Contribution to WTO budget (%, 2011) 0.028Trade Policy Review 2, 3 November 2005 Import duties collected (%, 2005-2007) GPA accession - in total tax revenue 4.5Tariffs and duty free imports to total imports 3.4
Tariff binding coverage (%) 100 Number of notifications to WTO and measures in force MFN tariffs Applied 2010 19
Simple average of import duties Goods RTAs - services EIAs notified to WTO 3 - 0All goods 40.0 11.2 Anti-dumping (30 June 2010) ...
Agricultural goods (AOA) 40.0 12.4 Countervailing duties (30 June 2010) ...Non-agricultural goods 40.0 11.0 Safeguards (22 October 2010) 0
0.0 0.00 - 0
0.0 Original panel / Appellate Body (AB) reports 0 - 0 11.4 Compliance panel / AB reports (Article 21.5 DSU) 0 - 0
Agricultural products 17.5 Agricultural products 8.6Fuels and mining products 75.6 Fuels and mining products 13.1Manufactures 6.9 Manufactures 78.3
1. Brazil 35.0 1. Brazil 18.62. European Union (27) 9.8 2. United States 13.23. United States 9.4 3. Argentina 13.04. Argentina 8.0 4. China 9.95. Japan 6.7 5. European Union (27) 9.1
COMMERCIAL SERVICES TRADE Value2010 2009 531
1 062
2010 a 0.01 0.03
Breakdown in economy's total exports By principal services item
12.9 38.4 56.1 29.2 31.0 32.4
INDUSTRIAL PROPERTY
Madrid Total ... ...
October 2011
Bolivia, Plurinational State of
Annual percentage change2005-2010 2009 2010
Real GDP (2005=100) 5 3 42 -11 63 -10 9
Final bound
Non ad-valorem duties (% total tariff lines) Number of disputes (complainant - defendant) Requests for consultation
in agricultural goods (AOA) in non-agricultural goods
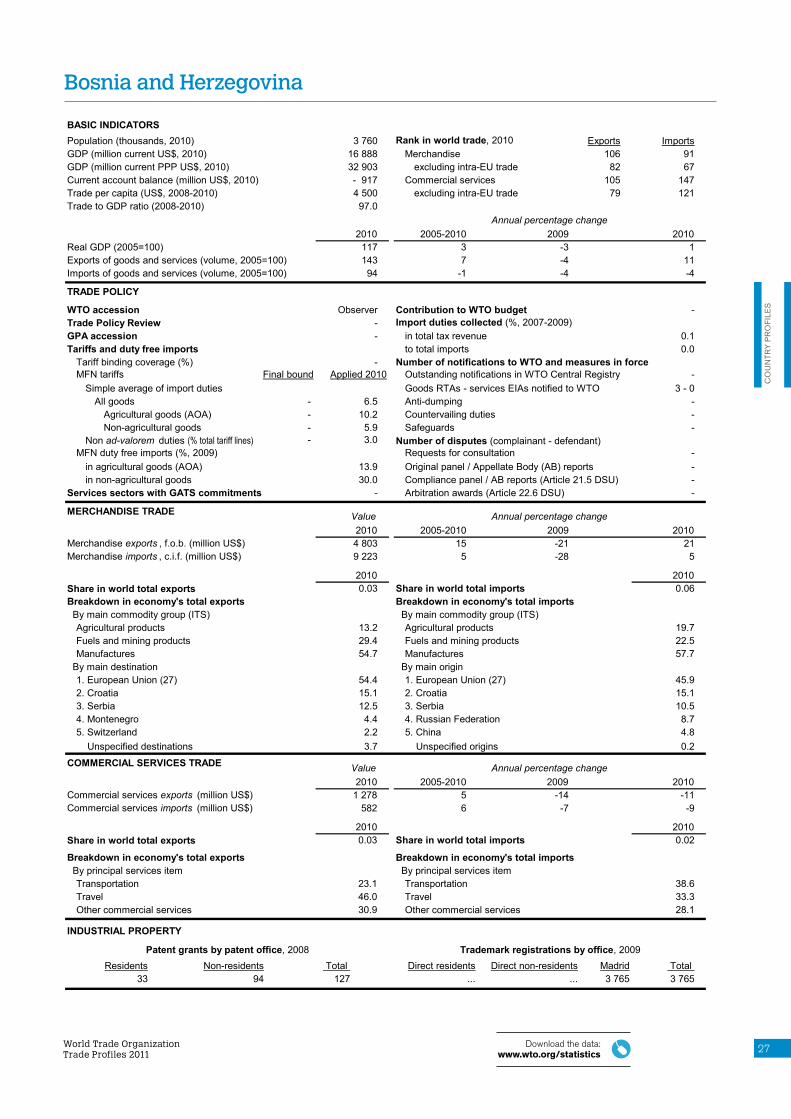
Agricultural products 13.2 Agricultural products 19.7Fuels and mining products 29.4 Fuels and mining products 22.5Manufactures 54.7 Manufactures 57.7
1. European Union (27) 54.4 1. European Union (27) 45.92. Croatia 15.1 2. Croatia 15.13. Serbia 12.5 3. Serbia 10.54. Montenegro 4.4 4. Russian Federation 8.75. Switzerland 2.2 5. China 4.8 Unspecified destinations 3.7 Unspecified origins 0.2
COMMERCIAL SERVICES TRADE Value2010 2009
1 278 582
2010 0.03 0.02
Breakdown in economy's total exports By principal services item
23.1 38.6 46.0 33.3 30.9 28.1
INDUSTRIAL PROPERTY
Madrid Total 3 765 3 765
October 2011
Bosnia and Herzegovina
Annual percentage change2005-2010 2009 2010
Real GDP (2005=100) 3 -3 17 -4 11
-1 -4 -4
Final bound
Non ad-valorem duties (% total tariff lines) Number of disputes (complainant - defendant) Requests for consultation
in agricultural goods (AOA) in non-agricultural goods
2010Share in world total exports Share in world total imports
Breakdown in economy's total imports By principal services item
Transportation Transportation
Direct residents Direct non-residents
Travel Travel Other commercial services Other commercial services
33 94 127 ... ...
Patent grants by patent office, 2008 Trademark registrations by office, 2009Residents Non-residents Total
Outstanding notifications in WTO Central Registry
MFN duty free imports (%, 2009)
Bosnia and Herzegovina
World Trade OrganizationTrade Profiles 2011
28 Download the data:www.wto.org/statistics
Botswana
BASIC INDICATORS Population (thousands, 2010) 2 007 Rank in world trade, 2010 Exports ImportsGDP (million current US$, 2010) 14 857 Merchandise 107 105GDP (million current PPP US$, 2010) 27 669 excluding intra-EU trade 83 80Current account balance (million US$, 2009) - 526 Commercial services 124 117Trade per capita (US$, 2008-2010) 5 363 excluding intra-EU trade 98 91Trade to GDP ratio (2008-2010) 80.1
2010 115
Exports of goods and services (volume, 2005=100) 81Imports of goods and services (volume, 2005=100) 140
TRADE POLICY
WTO accession 31 May 1995 Contribution to WTO budget (%, 2011) 0.033Trade Policy Review 4, 6 November 2009 Import duties collected GPA accession - in total tax revenue ...Tariffs and duty free imports to total imports ...
Tariff binding coverage (%) 96.4 Number of notifications to WTO and measures in force MFN tariffs Applied 2010 17
Simple average of import duties Goods RTAs - services EIAs notified to WTO 3 - 0All goods 18.7 7.7 Anti-dumping (30 June 2010) ...
Agricultural goods (AOA) 37.2 9.1 Countervailing duties (30 June 2010) ...Non-agricultural goods 15.8 7.4 Safeguards (22 October 2010) 0
0.0 2.20 - 0
36.2 Original panel / Appellate Body (AB) reports 0 - 0 60.3 Compliance panel / AB reports (Article 21.5 DSU) 0 - 0
Agricultural products 5.2 Agricultural products 13.2Fuels and mining products 14.7 Fuels and mining products 16.6Manufactures 78.5 Manufactures 68.4
1. European Union (27) 61.0 1. South Africa 72.82. South Africa 12.9 2. European Union (27) 13.33. Norway 9.3 3. China 4.94. Israel 5.3 4. Israel 1.95. Zimbabwe 3.8 5. United States 1.3
COMMERCIAL SERVICES TRADE Value2010 2009 731
1 273
2010 0.02 0.04
Breakdown in economy's total exports By principal services item
18.5 37.9 49.3 20.5 32.2 41.5
INDUSTRIAL PROPERTY
Madrid Total 712 712
October 2011
Botswana
Annual percentage change2005-2010 2009 2010
Real GDP (2005=100) 3 -5 7-4 -28 17 -9 5
Final bound
Non ad-valorem duties (% total tariff lines) Number of disputes (complainant - defendant) Requests for consultation
in agricultural goods (AOA) in non-agricultural goods
2010Share in world total exports Share in world total imports
Breakdown in economy's total imports By principal services item
Transportation Transportation
Direct residents Direct non-residents
Travel Travel Other commercial services Other commercial services
... ... ... ... ...
Patent grants by patent office Trademark registrations by office, 2009Residents Non-residents Total
Outstanding notifications in WTO Central Registry
MFN duty free imports (%, 2009)
World Trade OrganizationTrade Profiles 2011
29Download the data:www.wto.org/statistics
CO
UN
TRY
PR
OFI
LES
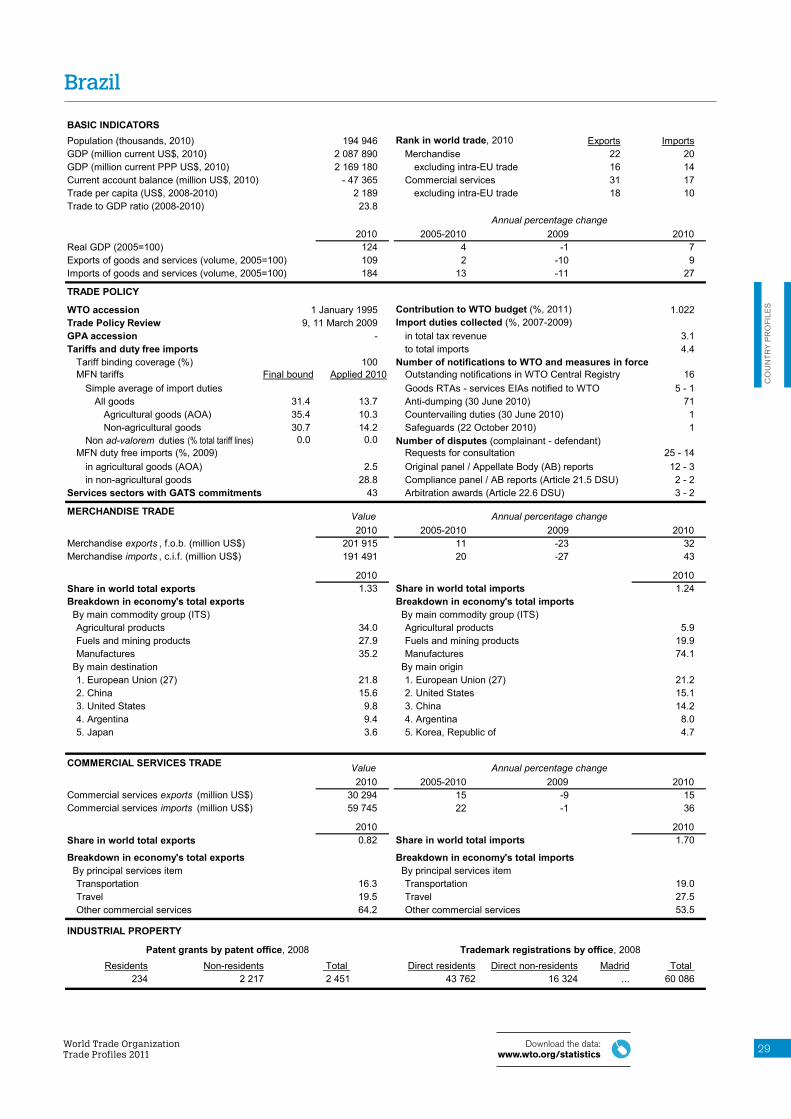
BASIC INDICATORS Population (thousands, 2010) 194 946 Rank in world trade, 2010 Exports ImportsGDP (million current US$, 2010) 2 087 890 Merchandise 22 20GDP (million current PPP US$, 2010) 2 169 180 excluding intra-EU trade 16 14Current account balance (million US$, 2010) - 47 365 Commercial services 31 17Trade per capita (US$, 2008-2010) 2 189 excluding intra-EU trade 18 10Trade to GDP ratio (2008-2010) 23.8
2010 124
Exports of goods and services (volume, 2005=100) 109Imports of goods and services (volume, 2005=100) 184
TRADE POLICY
WTO accession 1 January 1995 Contribution to WTO budget (%, 2011) 1.022Trade Policy Review 9, 11 March 2009 Import duties collected (%, 2007-2009) GPA accession - in total tax revenue 3.1Tariffs and duty free imports to total imports 4.4
Tariff binding coverage (%) 100 Number of notifications to WTO and measures in force MFN tariffs Applied 2010 16
Simple average of import duties Goods RTAs - services EIAs notified to WTO 5 - 1All goods 31.4 13.7 Anti-dumping (30 June 2010) 71
Agricultural goods (AOA) 35.4 10.3 Countervailing duties (30 June 2010) 1Non-agricultural goods 30.7 14.2 Safeguards (22 October 2010) 1
0.0 0.025 - 14
2.5 Original panel / Appellate Body (AB) reports 12 - 3 28.8 Compliance panel / AB reports (Article 21.5 DSU) 2 - 2
Agricultural products 34.0 Agricultural products 5.9Fuels and mining products 27.9 Fuels and mining products 19.9Manufactures 35.2 Manufactures 74.1
1. European Union (27) 21.8 1. European Union (27) 21.22. China 15.6 2. United States 15.13. United States 9.8 3. China 14.24. Argentina 9.4 4. Argentina 8.05. Japan 3.6 5. Korea, Republic of 4.7
COMMERCIAL SERVICES TRADE Value2010 2009
30 294 59 745
2010 0.82 1.70
Breakdown in economy's total exports By principal services item
16.3 19.0 19.5 27.5 64.2 53.5
INDUSTRIAL PROPERTY
Madrid Total ... 60 086
October 2011
Brazil
Annual percentage change2005-2010 2009 2010
Real GDP (2005=100) 4 -1 72 -10 9
13 -11 27
Final bound
Non ad-valorem duties (% total tariff lines) Number of disputes (complainant - defendant) Requests for consultation
in agricultural goods (AOA) in non-agricultural goods
2010Share in world total exports Share in world total imports
Breakdown in economy's total imports By principal services item
Transportation Transportation
Direct residents Direct non-residents
Travel Travel Other commercial services Other commercial services
234 2 217 2 451 43 762 16 324
Patent grants by patent office, 2008 Trademark registrations by office, 2008Residents Non-residents Total
Outstanding notifications in WTO Central Registry
MFN duty free imports (%, 2009)
Brazil
World Trade OrganizationTrade Profiles 2011
30 Download the data:www.wto.org/statistics
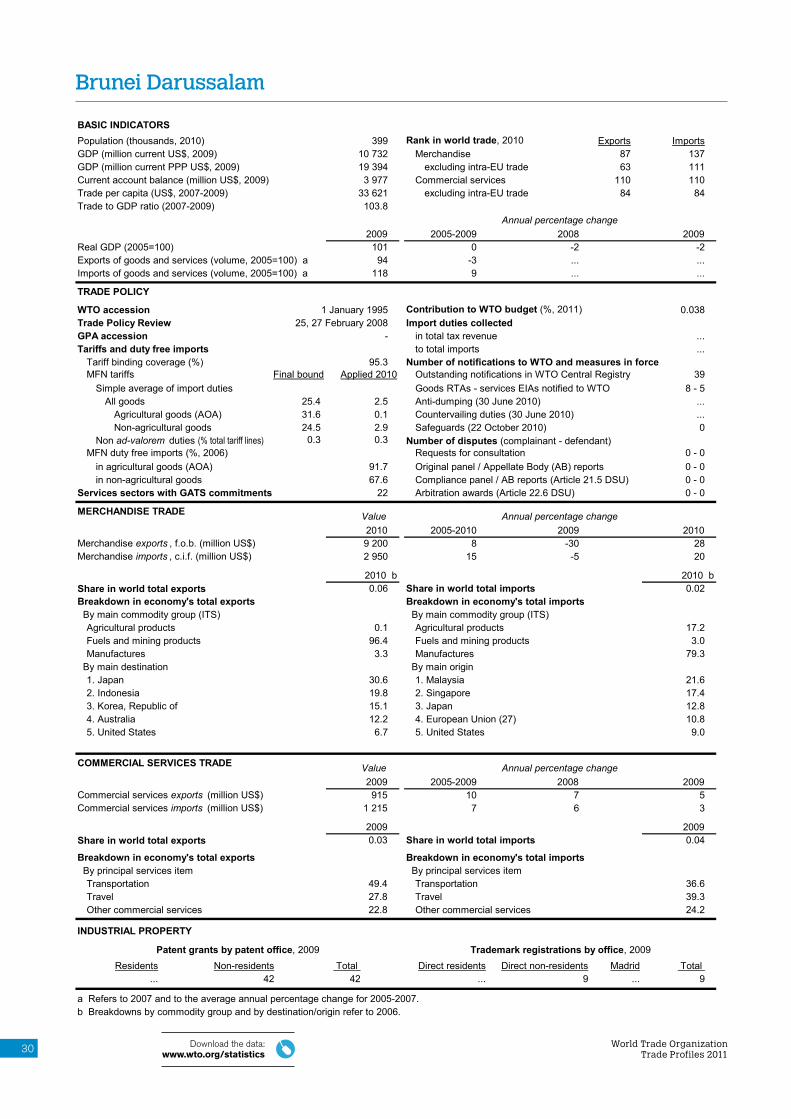
Brunei Darussalam
BASIC INDICATORS Population (thousands, 2010) 399 Rank in world trade, 2010 Exports ImportsGDP (million current US$, 2009) 10 732 Merchandise 87 137GDP (million current PPP US$, 2009) 19 394 excluding intra-EU trade 63 111Current account balance (million US$, 2009) 3 977 Commercial services 110 110Trade per capita (US$, 2007-2009) 33 621 excluding intra-EU trade 84 84Trade to GDP ratio (2007-2009) 103.8
2009 101
Exports of goods and services (volume, 2005=100) a 94Imports of goods and services (volume, 2005=100) a 118
TRADE POLICY
WTO accession 1 January 1995 Contribution to WTO budget (%, 2011) 0.038Trade Policy Review 25, 27 February 2008 Import duties collected GPA accession - in total tax revenue ...Tariffs and duty free imports to total imports ...
Tariff binding coverage (%) 95.3 Number of notifications to WTO and measures in force MFN tariffs Applied 2010 39
Simple average of import duties Goods RTAs - services EIAs notified to WTO 8 - 5All goods 25.4 2.5 Anti-dumping (30 June 2010) ...
Agricultural goods (AOA) 31.6 0.1 Countervailing duties (30 June 2010) ...Non-agricultural goods 24.5 2.9 Safeguards (22 October 2010) 0
0.3 0.30 - 0
91.7 Original panel / Appellate Body (AB) reports 0 - 0 67.6 Compliance panel / AB reports (Article 21.5 DSU) 0 - 0
Agricultural products 0.1 Agricultural products 17.2Fuels and mining products 96.4 Fuels and mining products 3.0Manufactures 3.3 Manufactures 79.3
1. Japan 30.6 1. Malaysia 21.62. Indonesia 19.8 2. Singapore 17.43. Korea, Republic of 15.1 3. Japan 12.84. Australia 12.2 4. European Union (27) 10.85. United States 6.7 5. United States 9.0
COMMERCIAL SERVICES TRADE Value2009 2008 915
1 215
2009 0.03 0.04
Breakdown in economy's total exports By principal services item
49.4 36.6 27.8 39.3 22.8 24.2
INDUSTRIAL PROPERTY
Madrid Total ... 9
October 2011
Brunei Darussalam
Annual percentage change2005-2009 2008 2009
Real GDP (2005=100) 0 -2 -2-3 ... ...9 ... ...
Final bound
Non ad-valorem duties (% total tariff lines) Number of disputes (complainant - defendant) Requests for consultation
in agricultural goods (AOA) in non-agricultural goods
2009Share in world total exports Share in world total imports
Breakdown in economy's total imports By principal services item
Transportation Transportation
Direct residents Direct non-residents
Travel Travel Other commercial services Other commercial services
... 42 42 ... 9
Patent grants by patent office, 2009 Trademark registrations by office, 2009Residents Non-residents Total
Outstanding notifications in WTO Central Registry
MFN duty free imports (%, 2006)
a Refers to 2007 and to the average annual percentage change for 2005-2007. b Breakdowns by commodity group and by destination/origin refer to 2006.
World Trade OrganizationTrade Profiles 2011
31Download the data:www.wto.org/statistics
CO
UN
TRY
PR
OFI
LES
BASIC INDICATORS Population (thousands, 2010) 7 543 Rank in world trade, 2010 Exports ImportsGDP (million current US$, 2010) 47 714 Merchandise 68 63GDP (million current PPP US$, 2010) 103 946 excluding intra-EU trade - -Current account balance (million US$, 2010) - 471 Commercial services 57 68Trade per capita (US$, 2008-2010) 7 780 excluding intra-EU trade - -Trade to GDP ratio (2008-2010) 119.5
2010 114
Exports of goods and services (volume, 2005=100) 163Imports of goods and services (volume, 2005=100) 134
TRADE POLICY
WTO accession 1 December 1996 Contribution to WTO budget (%, 2011) 0.172Trade Policy Review 6, 8 July 2011 Import duties collected GPA accession 1 January 2007 in total tax revenue ...Tariffs and duty free imports to total imports ...
Tariff binding coverage (%) 100 Number of notifications to WTO and measures in force MFN tariffs Applied 2010 18
Simple average of import duties Goods RTAs - services EIAs notified to WTO 31 - 10All goods 5.0 5.1 Anti-dumping (30 June 2010) 149
Agricultural goods (AOA) 12.3 12.8 Countervailing duties (30 June 2010) 8Non-agricultural goods 3.9 4.0 Safeguards (22 October 2010) 0
4.8 4.785 - 70
41.1 Original panel / Appellate Body (AB) reports 33 - 32 51.4 Compliance panel / AB reports (Article 21.5 DSU) 4 - 4
2010Share in world total exports Share in world total imports
Breakdown in economy's total imports By principal services item
Transportation Transportation
Direct residents Direct non-residents
Travel Travel Other commercial services Other commercial services
133 109 242 3 862 1 093
Patent grants by patent office, 2009 Trademark registrations by office, 2009Residents Non-residents Total
Outstanding notifications in WTO Central Registry
MFN duty free imports (%, 2009)
Bulgaria
World Trade OrganizationTrade Profiles 2011
32 Download the data:www.wto.org/statistics
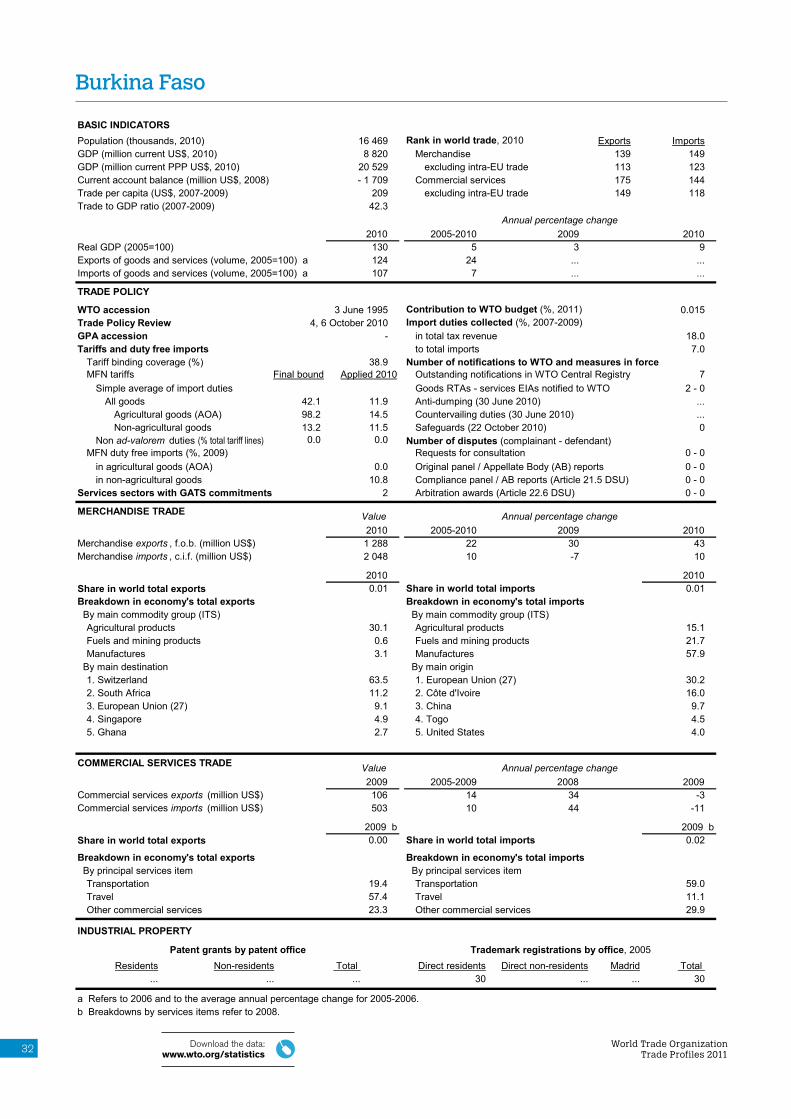
Burkina Faso
BASIC INDICATORS Population (thousands, 2010) 16 469 Rank in world trade, 2010 Exports ImportsGDP (million current US$, 2010) 8 820 Merchandise 139 149GDP (million current PPP US$, 2010) 20 529 excluding intra-EU trade 113 123Current account balance (million US$, 2008) - 1 709 Commercial services 175 144Trade per capita (US$, 2007-2009) 209 excluding intra-EU trade 149 118Trade to GDP ratio (2007-2009) 42.3
2010 130
Exports of goods and services (volume, 2005=100) a 124Imports of goods and services (volume, 2005=100) a 107
TRADE POLICY
WTO accession 3 June 1995 Contribution to WTO budget (%, 2011) 0.015Trade Policy Review 4, 6 October 2010 Import duties collected (%, 2007-2009) GPA accession - in total tax revenue 18.0Tariffs and duty free imports to total imports 7.0
Tariff binding coverage (%) 38.9 Number of notifications to WTO and measures in force MFN tariffs Applied 2010 7
Simple average of import duties Goods RTAs - services EIAs notified to WTO 2 - 0All goods 42.1 11.9 Anti-dumping (30 June 2010) ...
Agricultural goods (AOA) 98.2 14.5 Countervailing duties (30 June 2010) ...Non-agricultural goods 13.2 11.5 Safeguards (22 October 2010) 0
0.0 0.00 - 0
0.0 Original panel / Appellate Body (AB) reports 0 - 0 10.8 Compliance panel / AB reports (Article 21.5 DSU) 0 - 0
Agricultural products 30.1 Agricultural products 15.1Fuels and mining products 0.6 Fuels and mining products 21.7Manufactures 3.1 Manufactures 57.9
1. Switzerland 63.5 1. European Union (27) 30.22. South Africa 11.2 2. Côte d'Ivoire 16.03. European Union (27) 9.1 3. China 9.74. Singapore 4.9 4. Togo 4.55. Ghana 2.7 5. United States 4.0
COMMERCIAL SERVICES TRADE Value2009 2008 106 503
2009 b 0.00 0.02
Breakdown in economy's total exports By principal services item
19.4 59.0 57.4 11.1 23.3 29.9
INDUSTRIAL PROPERTY
Madrid Total ... 30
October 2011
Burkina Faso
Annual percentage change2005-2010 2009 2010
Real GDP (2005=100) 5 3 924 ... ...7 ... ...
Final bound
Non ad-valorem duties (% total tariff lines) Number of disputes (complainant - defendant) Requests for consultation
in agricultural goods (AOA) in non-agricultural goods
2009 bShare in world total exports Share in world total imports
Breakdown in economy's total imports By principal services item
Transportation Transportation
Direct residents Direct non-residents
Travel Travel Other commercial services Other commercial services
... ... ... 30 ...
Patent grants by patent office Trademark registrations by office, 2005Residents Non-residents Total
Outstanding notifications in WTO Central Registry
MFN duty free imports (%, 2009)
a Refers to 2006 and to the average annual percentage change for 2005-2006. b Breakdowns by services items refer to 2008.
World Trade OrganizationTrade Profiles 2011
33Download the data:www.wto.org/statistics
CO
UN
TRY
PR
OFI
LES
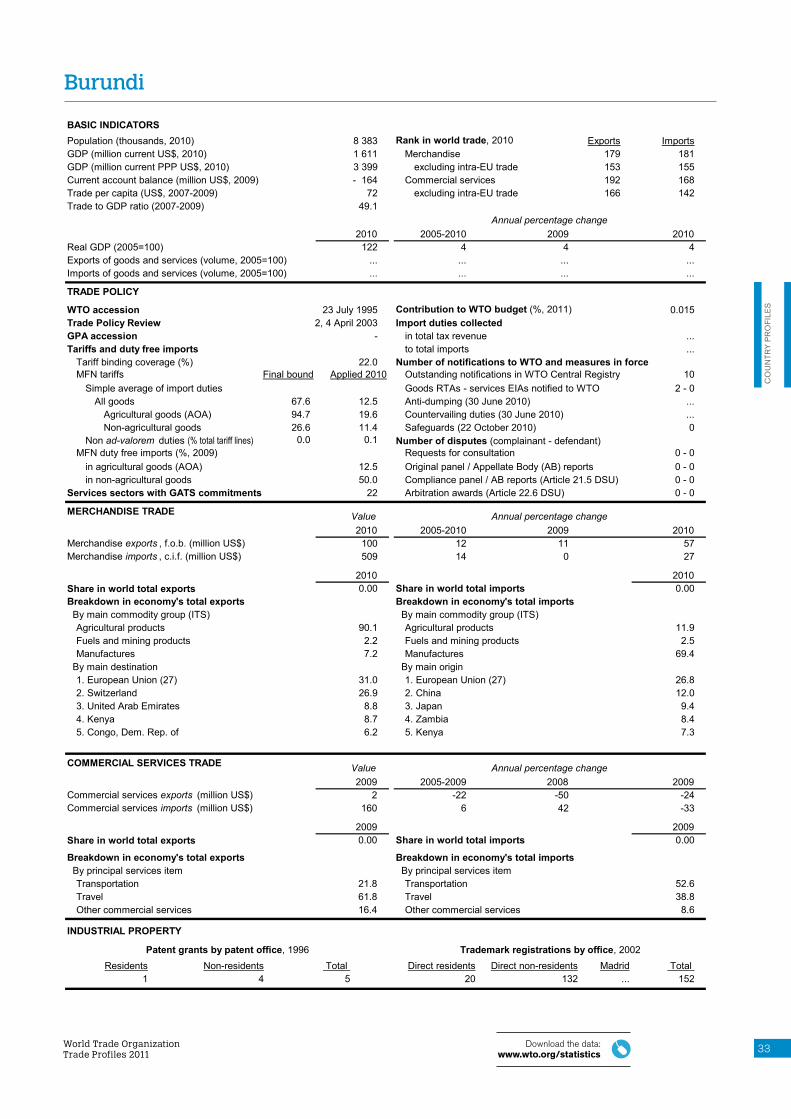
BASIC INDICATORS Population (thousands, 2010) 8 383 Rank in world trade, 2010 Exports ImportsGDP (million current US$, 2010) 1 611 Merchandise 179 181GDP (million current PPP US$, 2010) 3 399 excluding intra-EU trade 153 155Current account balance (million US$, 2009) - 164 Commercial services 192 168Trade per capita (US$, 2007-2009) 72 excluding intra-EU trade 166 142Trade to GDP ratio (2007-2009) 49.1
2010 122
Exports of goods and services (volume, 2005=100) ...Imports of goods and services (volume, 2005=100) ...
TRADE POLICY
WTO accession 23 July 1995 Contribution to WTO budget (%, 2011) 0.015Trade Policy Review 2, 4 April 2003 Import duties collected GPA accession - in total tax revenue ...Tariffs and duty free imports to total imports ...
Tariff binding coverage (%) 22.0 Number of notifications to WTO and measures in force MFN tariffs Applied 2010 10
Simple average of import duties Goods RTAs - services EIAs notified to WTO 2 - 0All goods 67.6 12.5 Anti-dumping (30 June 2010) ...
Agricultural goods (AOA) 94.7 19.6 Countervailing duties (30 June 2010) ...Non-agricultural goods 26.6 11.4 Safeguards (22 October 2010) 0
0.0 0.10 - 0
12.5 Original panel / Appellate Body (AB) reports 0 - 0 50.0 Compliance panel / AB reports (Article 21.5 DSU) 0 - 0
Agricultural products 90.1 Agricultural products 11.9Fuels and mining products 2.2 Fuels and mining products 2.5Manufactures 7.2 Manufactures 69.4
1. European Union (27) 31.0 1. European Union (27) 26.82. Switzerland 26.9 2. China 12.03. United Arab Emirates 8.8 3. Japan 9.44. Kenya 8.7 4. Zambia 8.45. Congo, Dem. Rep. of 6.2 5. Kenya 7.3
COMMERCIAL SERVICES TRADE Value2009 2008
2 160
2009 0.00 0.00
Breakdown in economy's total exports By principal services item
21.8 52.6 61.8 38.8 16.4 8.6
INDUSTRIAL PROPERTY
Madrid Total ... 152
October 2011
Burundi
Annual percentage change2005-2010 2009 2010
Real GDP (2005=100) 4 4 4... ... ...... ... ...
Final bound
Non ad-valorem duties (% total tariff lines) Number of disputes (complainant - defendant) Requests for consultation
in agricultural goods (AOA) in non-agricultural goods
Agricultural products 4.1 Agricultural products 5.7Fuels and mining products 0.1 Fuels and mining products 5.6Manufactures 95.6 Manufactures 51.8
1. United States 34.1 1. China 24.22. Hong Kong, China 24.8 2. Thailand 14.13. European Union (27) 16.7 3. Hong Kong, China 11.34. Singapore 7.7 4. Viet Nam 9.95. Canada 4.9 5. Taipei, Chinese 9.7
COMMERCIAL SERVICES TRADE Value2010 2009
1 671 1 082
2010 0.05 0.03
Breakdown in economy's total exports By principal services item
13.5 57.4 75.4 18.3 11.1 24.3
INDUSTRIAL PROPERTY
Madrid Total ... 2 303
October 2011
Cambodia
Annual percentage change2005-2010 2009 2010
Real GDP (2005=100) 6 -2 79 -6 ...
11 -5 ...
Final bound
Non ad-valorem duties (% total tariff lines) Number of disputes (complainant - defendant) Requests for consultation
in agricultural goods (AOA) in non-agricultural goods
2010Share in world total exports Share in world total imports
Breakdown in economy's total imports By principal services item
Transportation Transportation
Direct residents Direct non-residents
Travel Travel Other commercial services Other commercial services
... ... ... 437 1 866
Patent grants by patent office Trademark registrations by office, 2007Residents Non-residents Total
Outstanding notifications in WTO Central Registry
MFN duty free imports (%, 2004)
a Refers to 2009 and to the average annual percentage change for 2005-2009.
World Trade OrganizationTrade Profiles 2011
35Download the data:www.wto.org/statistics
CO
UN
TRY
PR
OFI
LES
BASIC INDICATORS Population (thousands, 2010) 19 599 Rank in world trade, 2010 Exports ImportsGDP (million current US$, 2010) 22 394 Merchandise 112 115GDP (million current PPP US$, 2010) 44 374 excluding intra-EU trade 88 90Current account balance (million US$, 2010) - 899 Commercial services 112 108Trade per capita (US$, 2008-2010) 674 excluding intra-EU trade 86 82Trade to GDP ratio (2008-2010) 56.8
2010 115
Exports of goods and services (volume, 2005=100) 85Imports of goods and services (volume, 2005=100) 114
TRADE POLICY
WTO accession 13 December 1995 Contribution to WTO budget (%, 2011) 0.037Trade Policy Review 1, 3 October 2007 Import duties collected GPA accession Observer in total tax revenue ...Tariffs and duty free imports to total imports ...
Tariff binding coverage (%) 13.3 Number of notifications to WTO and measures in force MFN tariffs Applied 2009 51
Simple average of import duties Goods RTAs - services EIAs notified to WTO 3 - 0All goods 79.9 17.8 Anti-dumping (30 June 2010) ...
Agricultural goods (AOA) 80.0 22.3 Countervailing duties (30 June 2010) ...Non-agricultural goods 57.5 17.1 Safeguards (22 October 2010) 0
0.0 0.00 - 0
46.7 Original panel / Appellate Body (AB) reports 0 - 0 7.1 Compliance panel / AB reports (Article 21.5 DSU) 0 - 0
Agricultural products 38.0 Agricultural products 20.3Fuels and mining products 51.5 Fuels and mining products 31.4Manufactures 6.7 Manufactures 48.3
1. European Union (27) 55.2 1. European Union (27) 31.52. Chad 8.7 2. Nigeria 18.23. China 8.5 3. China 10.64. United States 5.7 4. United States 3.35. Congo, Dem. Rep. of 4.5 5. Thailand 3.0 Unspecified destinations 0.0 Unspecified origins 3.7
COMMERCIAL SERVICES TRADE Value2010 2009
1 059 1 759
2010 0.03 0.05
Breakdown in economy's total exports By principal services item
46.0 38.7 9.9 9.9
44.1 51.4
INDUSTRIAL PROPERTY
Madrid Total ... ...
October 2011
Cameroon
Annual percentage change2005-2010 2009 2010
Real GDP (2005=100) 3 2 3-3 -5 03 -5 5
Final bound
Non ad-valorem duties (% total tariff lines) Number of disputes (complainant - defendant) Requests for consultation
in agricultural goods (AOA) in non-agricultural goods
2010Share in world total exports Share in world total imports
Breakdown in economy's total imports By principal services item
Transportation Transportation
Direct residents Direct non-residents
Travel Travel Other commercial services Other commercial services
... ... ... ... ...
Patent grants by patent office Trademark registrations by officeResidents Non-residents Total
Outstanding notifications in WTO Central Registry
MFN duty free imports (%, 2006)
Cameroon
World Trade OrganizationTrade Profiles 2011
36 Download the data:www.wto.org/statistics
Canada
BASIC INDICATORS Population (thousands, 2010) 34 109 Rank in world trade, 2010 Exports ImportsGDP (million current US$, 2010) 1 574 052 Merchandise 13 11GDP (million current PPP US$, 2010) 1 327 345 excluding intra-EU trade 8 7Current account balance (million US$, 2010) - 49 307 Commercial services 18 13Trade per capita (US$, 2008-2010) 27 444 excluding intra-EU trade 10 8Trade to GDP ratio (2008-2010) 63.0
2010 106
Exports of goods and services (volume, 2005=100) a 83Imports of goods and services (volume, 2005=100) a 97
TRADE POLICY
WTO accession 1 January 1995 Contribution to WTO budget (%, 2011) 3.021Trade Policy Review 20, 22 June 2011 Import duties collected (%, 2005-2007) GPA accession 1 January 1996 in total tax revenue 0.8Tariffs and duty free imports to total imports 0.7
Tariff binding coverage (%) 99.7 Number of notifications to WTO and measures in force MFN tariffs Applied 2010 16
Simple average of import duties Goods RTAs - services EIAs notified to WTO 6 - 3All goods 6.8 3.7 Anti-dumping (30 June 2010) 36
Agricultural goods (AOA) 16.7 11.3 Countervailing duties (30 June 2010) 9Non-agricultural goods 5.3 2.6 Safeguards (22 October 2010) 0
2.7 1.633 - 17
52.4 Original panel / Appellate Body (AB) reports 14 - 11 60.1 Compliance panel / AB reports (Article 21.5 DSU) 6 - 5
Agricultural products 13.4 Agricultural products 8.2Fuels and mining products 31.2 Fuels and mining products 13.0Manufactures 47.9 Manufactures 74.7
1. United States 74.9 1. United States 50.42. European Union (27) 8.6 2. European Union (27) 11.93. China 3.3 3. China 11.04. Japan 2.3 4. Mexico 5.55. Mexico 1.3 5. Japan 3.3
COMMERCIAL SERVICES TRADE Value2010 2009
67 432 89 963
2010 1.83 2.56
Breakdown in economy's total exports By principal services item
17.3 22.7 23.3 32.9 59.4 44.4
INDUSTRIAL PROPERTY
Madrid Total ... 24 679
October 2011
Canada
Annual percentage change2005-2010 2009 2010
Real GDP (2005=100) 1 -2 3-4 -14 ...-1 -14 ...
Final bound
Non ad-valorem duties (% total tariff lines) Number of disputes (complainant - defendant) Requests for consultation
in agricultural goods (AOA) in non-agricultural goods
Agricultural products 80.6 Agricultural products 28.6Fuels and mining products 0.9 Fuels and mining products 12.9Manufactures 18.3 Manufactures 56.9
1. European Union (27) 94.1 1. European Union (27) 78.12. Brazil 1.5 2. Brazil 4.43. United States 1.5 3. China 4.34. India 0.6 4. Japan 2.35. Guinea-Bissau 0.4 5. Thailand 2.1 Unspecified destinations 1.8 Unspecified origins 1.0
COMMERCIAL SERVICES TRADE Value2010 2009 499 314
2010 0.01 0.01
Breakdown in economy's total exports By principal services item
35.8 32.6 58.1 40.6 6.2 26.9
INDUSTRIAL PROPERTY
Madrid Total ... ...
October 2011
Cape Verde
Annual percentage change2005-2010 2009 2010
Real GDP (2005=100) 7 4 518 12 ...16 13 ...
Final bound
Non ad-valorem duties (% total tariff lines) Number of disputes (complainant - defendant) Requests for consultation
in agricultural goods (AOA) in non-agricultural goods
2010Share in world total exports Share in world total imports
Breakdown in economy's total imports By principal services item
Transportation Transportation
Direct residents Direct non-residents
Travel Travel Other commercial services Other commercial services
... ... ... ... ...
Patent grants by patent office Trademark registrations by officeResidents Non-residents Total
Outstanding notifications in WTO Central Registry
MFN duty free imports (%, 2008)
a Refers to 2009 and to the average annual percentage change for 2005-2009.
Cape Verde
World Trade OrganizationTrade Profiles 2011
38 Download the data:www.wto.org/statistics
Central African Republic
BASIC INDICATORS Population (thousands, 2010) 4 401 Rank in world trade, 2010 Exports ImportsGDP (million current US$, 2010) 2 013 Merchandise 176 185GDP (million current PPP US$, 2010) 3 446 excluding intra-EU trade 150 159Current account balance (million US$, 2010) ... Commercial services 187 169Trade per capita (US$, 2007-2009) 143 excluding intra-EU trade 161 143Trade to GDP ratio (2007-2009) 32.2
2010 115
Exports of goods and services (volume, 2005=100) a 114Imports of goods and services (volume, 2005=100) a 102
TRADE POLICY
WTO accession 31 May 1995 Contribution to WTO budget (%, 2011) 0.015Trade Policy Review 11, 13 June 2007 Import duties collected GPA accession - in total tax revenue ...Tariffs and duty free imports to total imports ...
Tariff binding coverage (%) 62.1 Number of notifications to WTO and measures in force MFN tariffs Applied 2009 40
Simple average of import duties Goods RTAs - services EIAs notified to WTO 1 - 0All goods 36.2 17.8 Anti-dumping (30 June 2010) ...
Agricultural goods (AOA) 30.0 21.9 Countervailing duties (30 June 2010) ...Non-agricultural goods 37.9 17.2 Safeguards (22 October 2010) 0
0.0 0.40 - 0
0.0 Original panel / Appellate Body (AB) reports 0 - 0 0.6 Compliance panel / AB reports (Article 21.5 DSU) 0 - 0
Agricultural products 38.1 Agricultural products ...Fuels and mining products 15.7 Fuels and mining products ...Manufactures 32.8 Manufactures ...
1. European Union (27) 79.8 1. European Union (27) 39.92. China 9.4 2. United States 15.63. Saudi Arabia, Kingdom of 2.9 3. Cameroon 8.84. Turkey 1.5 4. China 7.95. Cameroon 1.4 5. Japan 3.9
COMMERCIAL SERVICES TRADE Value2009 2008 28
156
2009 0.00 0.00
Breakdown in economy's total exports By principal services item
8.0 52.3 47.9 32.9 44.1 14.8
INDUSTRIAL PROPERTY
Madrid Total ... ...
October 2011
Central African Republic
Annual percentage change2005-2010 2009 2010
Real GDP (2005=100) 3 2 314 ... ...2 ... ...
Final bound
Non ad-valorem duties (% total tariff lines) Number of disputes (complainant - defendant) Requests for consultation
in agricultural goods (AOA) in non-agricultural goods
2009Share in world total exports Share in world total imports
Breakdown in economy's total imports By principal services item
Transportation Transportation
Direct residents Direct non-residents
Travel Travel Other commercial services Other commercial services
... ... ... ... ...
Patent grants by patent office Trademark registrations by officeResidents Non-residents Total
Outstanding notifications in WTO Central Registry
MFN duty free imports (%, 2009)
a Refers to 2006 and to the average annual percentage change for 2005-2006. b Breakdowns by commodity group refer to 2005 and by destination/origin refer to 2009.
World Trade OrganizationTrade Profiles 2011
39Download the data:www.wto.org/statistics
CO
UN
TRY
PR
OFI
LES
BASIC INDICATORS Population (thousands, 2010) 11 227 Rank in world trade, 2010 Exports ImportsGDP (million current US$, 2010) 7 588 Merchandise 115 143GDP (million current PPP US$, 2010) 15 269 excluding intra-EU trade 91 117Current account balance (million US$, 2010) ... Commercial services 158 89Trade per capita (US$, 2007-2009) 729 excluding intra-EU trade 132 65Trade to GDP ratio (2007-2009) 104.9
2010 103
Exports of goods and services (volume, 2005=100) a 97Imports of goods and services (volume, 2005=100) a 87
TRADE POLICY
WTO accession 19 October 1996 Contribution to WTO budget (%, 2011) 0.023Trade Policy Review 22, 24 January 2007 Import duties collected GPA accession - in total tax revenue ...Tariffs and duty free imports to total imports ...
Tariff binding coverage (%) 13.5 Number of notifications to WTO and measures in force MFN tariffs Applied 2009 37
Simple average of import duties Goods RTAs - services EIAs notified to WTO 1 - 0All goods 79.9 17.9 Anti-dumping (30 June 2010) ...
Agricultural goods (AOA) 80.0 21.9 Countervailing duties (30 June 2010) ...Non-agricultural goods 75.4 17.2 Safeguards (22 October 2010) 0
0.0 0.00 - 0
... Original panel / Appellate Body (AB) reports 0 - 0
2009Share in world total exports Share in world total imports
Breakdown in economy's total imports By principal services item
Transportation Transportation
Direct residents Direct non-residents
Travel Travel Other commercial services Other commercial services
... ... ... ... ...
Patent grants by patent office Trademark registrations by officeResidents Non-residents Total
Outstanding notifications in WTO Central Registry
MFN duty free imports
a Refers to 2006 and to the average annual percentage change for 2005-2006.
Chad
World Trade OrganizationTrade Profiles 2011
40 Download the data:www.wto.org/statistics
Chile
BASIC INDICATORS Population (thousands, 2010) 17 114 Rank in world trade, 2010 Exports ImportsGDP (million current US$, 2010) 203 443 Merchandise 40 46GDP (million current PPP US$, 2010) 257 461 excluding intra-EU trade 27 28Current account balance (million US$, 2010) 3 802 Commercial services 50 50Trade per capita (US$, 2008-2010) 8 001 excluding intra-EU trade 32 33Trade to GDP ratio (2008-2010) 76.1
2010 117
Exports of goods and services (volume, 2005=100) 110Imports of goods and services (volume, 2005=100) 154
TRADE POLICY
WTO accession 1 January 1995 Contribution to WTO budget (%, 2011) 0.376Trade Policy Review 7, 9 October 2009 Import duties collected (%, 2000-2002) GPA accession Observer in total tax revenue 6.3Tariffs and duty free imports to total imports 3.8
Tariff binding coverage (%) 100 Number of notifications to WTO and measures in force MFN tariffs Applied 2010 5
Simple average of import duties Goods RTAs - services EIAs notified to WTO 19 - 14All goods 25.1 6.0 Anti-dumping (30 June 2010) 0
Agricultural goods (AOA) 26.0 6.0 Countervailing duties (30 June 2010) ...Non-agricultural goods 25.0 6.0 Safeguards (22 October 2010) 0
0.0 0.010 - 13
0.0 Original panel / Appellate Body (AB) reports 2 - 3 0.2 Compliance panel / AB reports (Article 21.5 DSU) 0 - 1
Agricultural products 21.8 Agricultural products 7.6Fuels and mining products 64.2 Fuels and mining products 21.4Manufactures 10.0 Manufactures 60.1
1. China 23.2 1. United States 16.82. European Union (27) 18.0 2. European Union (27) 15.53. United States 11.3 3. China 11.84. Japan 9.2 4. Argentina 10.95. Korea, Republic of 5.8 5. Brazil 6.7 Unspecified destinations 3.4 Unspecified origins 10.8
COMMERCIAL SERVICES TRADE Value2010 2009
10 685 11 568
2010 0.29 0.33
Breakdown in economy's total exports By principal services item
60.5 57.6 15.3 16.5 24.2 25.9
INDUSTRIAL PROPERTY
Madrid Total ... 34 161
October 2011
Chile
Annual percentage change2005-2010 2009 2010
Real GDP (2005=100) 3 -2 52 -6 09 -14 26
Final bound
Non ad-valorem duties (% total tariff lines) Number of disputes (complainant - defendant) Requests for consultation
in agricultural goods (AOA) in non-agricultural goods
2010Share in world total exports Share in world total imports
Breakdown in economy's total imports By principal services item
Transportation Transportation
Direct residents Direct non-residents
Travel Travel Other commercial services Other commercial services
130 1 268 1 398 20 934 13 227
Patent grants by patent office, 2008 Trademark registrations by office, 2008Residents Non-residents Total
Outstanding notifications in WTO Central Registry
MFN duty free imports (%, 2009)
a Breakdowns by destination/origin refer to 2009.
World Trade OrganizationTrade Profiles 2011
41Download the data:www.wto.org/statistics
CO
UN
TRY
PR
OFI
LES
BASIC INDICATORS Population (thousands, 2010) 1 338 300 Rank in world trade, 2010 Exports ImportsGDP (million current US$, 2010) 5 878 629 Merchandise 1 2GDP (million current PPP US$, 2010) 10 084 764 excluding intra-EU trade 2 3Current account balance (million US$, 2010) 305 370 Commercial services 4 3Trade per capita (US$, 2008-2010) 2 135 excluding intra-EU trade 3 3Trade to GDP ratio (2008-2010) 55.4
2010 170
Exports of goods and services (volume, 2005=100) 180Imports of goods and services (volume, 2005=100) 168
TRADE POLICY
WTO accession 11 December 2001 Contribution to WTO budget (%, 2011) 6.878Trade Policy Review 31 May, 2 June 2010 Import duties collected (%, 2006-2008) GPA accession Observer in total tax revenue 3.0Tariffs and duty free imports to total imports 1.9
Tariff binding coverage (%) 100 Number of notifications to WTO and measures in force MFN tariffs Applied 2010 12
Simple average of import duties Goods RTAs - services EIAs notified to WTO 9 - 8All goods 10.0 9.6 Anti-dumping (30 June 2010) 119
Agricultural goods (AOA) 15.7 15.6 Countervailing duties (30 June 2010) 1Non-agricultural goods 9.2 8.7 Safeguards (22 October 2010) 0
0.0 0.58 - 22
0.9 Original panel / Appellate Body (AB) reports 4 - 5 50.6 Compliance panel / AB reports (Article 21.5 DSU) 0 - 0
Agricultural products 3.3 Agricultural products 7.8Fuels and mining products 3.0 Fuels and mining products 26.7Manufactures 93.6 Manufactures 64.1
1. European Union (27) 19.7 1. Japan 12.62. United States 18.0 2. European Union (27) 12.03. Hong Kong, China 13.8 3. Korea, Republic of 9.94. Japan 7.7 4. Taipei, Chinese 8.35. Korea, Republic of 4.4 5. China 7.6
COMMERCIAL SERVICES TRADE Value2010 2009
170 248 192 174
2010 4.61 5.47
Breakdown in economy's total exports By principal services item
20.1 32.9 26.9 28.6 53.0 38.5
INDUSTRIAL PROPERTY
Madrid Total 12 934 818 633
October 2011
China
Annual percentage change2005-2010 2009 2010
Real GDP (2005=100) 11 9 1012 -10 2511 4 17
Final bound
Non ad-valorem duties (% total tariff lines) Number of disputes (complainant - defendant) Requests for consultation
in agricultural goods (AOA) in non-agricultural goods
2010Share in world total exports Share in world total imports
Breakdown in economy's total imports By principal services item
Transportation Transportation
Direct residents Direct non-residents
Travel Travel Other commercial services Other commercial services
65 391 63 098 128 489 737 228 68 471
Patent grants by patent office, 2009 Trademark registrations by office, 2009Residents Non-residents Total
Outstanding notifications in WTO Central Registry
MFN duty free imports (%, 2009)
China
World Trade OrganizationTrade Profiles 2011
42 Download the data:www.wto.org/statistics
Colombia
BASIC INDICATORS Population (thousands, 2010) 46 295 Rank in world trade, 2010 Exports ImportsGDP (million current US$, 2010) 288 189 Merchandise 57 53GDP (million current PPP US$, 2010) 434 788 excluding intra-EU trade 40 35Current account balance (million US$, 2010) - 8 944 Commercial services 69 58Trade per capita (US$, 2008-2010) 1 866 excluding intra-EU trade 46 40Trade to GDP ratio (2008-2010) 33.2
2010 125
Exports of goods and services (volume, 2005=100) 131Imports of goods and services (volume, 2005=100) 149
TRADE POLICY
WTO accession 30 April 1995 Contribution to WTO budget (%, 2011) 0.212Trade Policy Review 22, 24 November 2006 Import duties collected (%, 2008-2009) GPA accession Observer in total tax revenue 6.3Tariffs and duty free imports to total imports 5.9
Tariff binding coverage (%) 100 Number of notifications to WTO and measures in force MFN tariffs Applied 2010 7
Simple average of import duties Goods RTAs - services EIAs notified to WTO 5 - 2All goods 42.8 12.5 Anti-dumping (30 June 2010) 12
Agricultural goods (AOA) 91.4 17.2 Countervailing duties (30 June 2010) ...Non-agricultural goods 35.4 11.8 Safeguards (22 October 2010) 0
0.0 0.05 - 3
0.0 Original panel / Appellate Body (AB) reports 0 - 1 6.8 Compliance panel / AB reports (Article 21.5 DSU) 0 - 0
Agricultural products 14.5 Agricultural products 11.0Fuels and mining products 58.2 Fuels and mining products 7.1Manufactures 22.0 Manufactures 80.4
1. United States 43.1 1. United States 25.92. European Union (27) 12.6 2. European Union (27) 14.03. China 4.9 3. China 13.54. Ecuador 4.6 4. Mexico 9.55. Bolivarian Rep. of Venezuela 3.6 5. Brazil 5.8
COMMERCIAL SERVICES TRADE Value2010 2009
4 373 7 841
2010 0.12 0.22
Breakdown in economy's total exports By principal services item
27.6 35.9 47.6 23.3 24.8 40.8
INDUSTRIAL PROPERTY
Madrid Total ... 18 139
October 2011
Colombia
Annual percentage change2005-2010 2009 2010
Real GDP (2005=100) 5 1 46 -3 118 -8 9
Final bound
Non ad-valorem duties (% total tariff lines) Number of disputes (complainant - defendant) Requests for consultation
in agricultural goods (AOA) in non-agricultural goods
2010Share in world total exports Share in world total imports
Breakdown in economy's total imports By principal services item
Transportation Transportation
Direct residents Direct non-residents
Travel Travel Other commercial services Other commercial services
20 207 227 10 635 7 504
Patent grants by patent office, 2007 Trademark registrations by office, 2007Residents Non-residents Total
Outstanding notifications in WTO Central Registry
MFN duty free imports (%, 2008)
World Trade OrganizationTrade Profiles 2011
43Download the data:www.wto.org/statistics
CO
UN
TRY
PR
OFI
LES
BASIC INDICATORS Population (thousands, 2010) 735 Rank in world trade, 2010 Exports ImportsGDP (million current US$, 2010) 541 Merchandise 196 197GDP (million current PPP US$, 2010) 800 excluding intra-EU trade 170 171Current account balance (million US$, 2010) ... Commercial services 183 179Trade per capita (US$, 2007-2009) 433 excluding intra-EU trade 157 153Trade to GDP ratio (2007-2009) 59.1
2010 107
Exports of goods and services (volume, 2005=100) ...Imports of goods and services (volume, 2005=100) ...
TRADE POLICY
WTO accession Observer Contribution to WTO budget -Trade Policy Review - Import duties collected GPA accession - in total tax revenue ...Tariffs and duty free imports to total imports ...
Tariff binding coverage (%) - Number of notifications to WTO and measures in force MFN tariffs Applied 2010 -
Simple average of import duties Goods RTAs - services EIAs notified to WTO 1 - 0All goods - 11.3 Anti-dumping -
Agricultural products 40.7 Agricultural products 32.1Fuels and mining products 0.3 Fuels and mining products 0.7Manufactures 1.3 Manufactures 40.8
1. European Union (27) 16.1 1. United Arab Emirates 38.62. Singapore 1.3 2. European Union (27) 12.83. India 1.2 3. Pakistan 4.04. United Arab Emirates 0.6 4. China 3.75. Yemen 0.3 5. Tanzania 2.9 Unspecified destinations 80.0 Unspecified origins 25.8
COMMERCIAL SERVICES TRADE Value2009 2008 53 86
2009 0.00 0.00
Breakdown in economy's total exports By principal services item
6.2 61.0 61.4 22.5 32.4 16.5
INDUSTRIAL PROPERTY
Madrid Total ... ...
October 2011
Comoros
Annual percentage change2005-2010 2009 2010
Real GDP (2005=100) 1 2 2... ... ...... ... ...
Final bound
Non ad-valorem duties (% total tariff lines) Number of disputes (complainant - defendant) Requests for consultation
in agricultural goods (AOA) in non-agricultural goods
2009Share in world total exports Share in world total imports
Breakdown in economy's total imports By principal services item
Transportation Transportation
Direct residents Direct non-residents
Travel Travel Other commercial services Other commercial services
... ... ... ... ...
Patent grants by patent office Trademark registrations by officeResidents Non-residents Total
Outstanding notifications in WTO Central Registry
MFN duty free imports
a Breakdowns by commodity group refer to 2004 and by destination/origin refer to 2007.
Comoros
World Trade OrganizationTrade Profiles 2011
44 Download the data:www.wto.org/statistics
Congo
BASIC INDICATORS Population (thousands, 2010) 4 043 Rank in world trade, 2010 Exports ImportsGDP (million current US$, 2010) 11 898 Merchandise 92 138GDP (million current PPP US$, 2010) 17 036 excluding intra-EU trade 68 112Current account balance (million US$, 2007) - 2 181 Commercial services 140 74Trade per capita (US$, 2007-2009) 3 565 excluding intra-EU trade 114 52Trade to GDP ratio (2007-2009) 138.1
2010 129
Exports of goods and services (volume, 2005=100) ...Imports of goods and services (volume, 2005=100) ...
TRADE POLICY
WTO accession 27 March 1997 Contribution to WTO budget (%, 2011) 0.028Trade Policy Review 27, 29 September 2006 Import duties collected (%, 2003-2005) GPA accession - in total tax revenue 20.0Tariffs and duty free imports to total imports 3.4
Tariff binding coverage (%) 16.1 Number of notifications to WTO and measures in force MFN tariffs Applied 2007 52
Simple average of import duties Goods RTAs - services EIAs notified to WTO 1 - 0All goods 27.3 17.9 Anti-dumping (30 June 2010) ...
Agricultural goods (AOA) 30.0 21.9 Countervailing duties (30 June 2010) ...Non-agricultural goods 14.8 17.3 Safeguards (22 October 2010) 0
0.0 0.00 - 0
... Original panel / Appellate Body (AB) reports 0 - 0
2009 aShare in world total exports Share in world total imports
Breakdown in economy's total imports By principal services item
Transportation Transportation
Direct residents Direct non-residents
Travel Travel Other commercial services Other commercial services
... 13 13 ... ...
Patent grants by patent office, 1996 Trademark registrations by officeResidents Non-residents Total
Outstanding notifications in WTO Central Registry
MFN duty free imports
a Breakdowns by services items refer to 2007.
World Trade OrganizationTrade Profiles 2011
45Download the data:www.wto.org/statistics
CO
UN
TRY
PR
OFI
LES
BASIC INDICATORS Population (thousands, 2010) 65 966 Rank in world trade, 2010 Exports ImportsGDP (million current US$, 2010) 13 145 Merchandise 102 120GDP (million current PPP US$, 2010) 22 735 excluding intra-EU trade 78 95Current account balance (million US$, 2010) ... Commercial services 148 90Trade per capita (US$, 2008-2010) 241 excluding intra-EU trade 122 66Trade to GDP ratio (2008-2010) 129.0
2010 131
Exports of goods and services (volume, 2005=100) 125Imports of goods and services (volume, 2005=100) 137
TRADE POLICY
WTO accession 1 January 1997 Contribution to WTO budget (%, 2011) 0.032Trade Policy Review 24, 26 November 2010 Import duties collected (%, 2000-2002) GPA accession - in total tax revenue 32.6Tariffs and duty free imports to total imports 9.0
Tariff binding coverage (%) 100 Number of notifications to WTO and measures in force MFN tariffs Applied 2010 41
Simple average of import duties Goods RTAs - services EIAs notified to WTO 2 - 0All goods 96.2 11.0 Anti-dumping (30 June 2010) ...
Agricultural goods (AOA) 98.2 11.0 Countervailing duties (30 June 2010) ...Non-agricultural goods 95.9 11.0 Safeguards (22 October 2010) 0
0.0 0.00 - 0
... Original panel / Appellate Body (AB) reports 0 - 0
2010Share in world total exports Share in world total imports
Breakdown in economy's total imports By principal services item
Transportation Transportation
Direct residents Direct non-residents
Travel Travel Other commercial services Other commercial services
... ... ... 205 374
Patent grants by patent office Trademark registrations by office, 1996Residents Non-residents Total
Outstanding notifications in WTO Central Registry
MFN duty free imports
Congo, Dem. Rep. of
World Trade OrganizationTrade Profiles 2011
46 Download the data:www.wto.org/statistics
Costa Rica
BASIC INDICATORS Population (thousands, 2010) 4 659 Rank in world trade, 2010 Exports ImportsGDP (million current US$, 2010) 34 564 Merchandise 85 79GDP (million current PPP US$, 2010) 52 885 excluding intra-EU trade 61 57Current account balance (million US$, 2010) - 1 299 Commercial services 68 107Trade per capita (US$, 2008-2010) 6 063 excluding intra-EU trade 45 81Trade to GDP ratio (2008-2010) 89.3
2010 123
Exports of goods and services (volume, 2005=100) 122Imports of goods and services (volume, 2005=100) 122
TRADE POLICY
WTO accession 1 January 1995 Contribution to WTO budget (%, 2011) 0.082Trade Policy Review 7, 9 May 2007 Import duties collected (%, 2008-2009) GPA accession - in total tax revenue 5.7Tariffs and duty free imports to total imports 1.8
Tariff binding coverage (%) 100 Number of notifications to WTO and measures in force MFN tariffs Applied 2010 7
Simple average of import duties Goods RTAs - services EIAs notified to WTO 6 - 4All goods 42.9 5.4 Anti-dumping (30 June 2010) 2
Agricultural goods (AOA) 42.7 11.7 Countervailing duties (30 June 2010) 0Non-agricultural goods 42.9 4.5 Safeguards (22 October 2010) 0
0.0 0.05 - 0
44.2 Original panel / Appellate Body (AB) reports 1 - 0 73.5 Compliance panel / AB reports (Article 21.5 DSU) 0 - 0
Agricultural products 35.9 Agricultural products 10.3Fuels and mining products 1.6 Fuels and mining products 14.3Manufactures 58.5 Manufactures 74.8
1. United States 37.4 1. United States 46.82. European Union (27) 17.9 2. European Union (27) 7.93. Hong Kong, China 4.8 3. China 7.14. Panama 4.8 4. Mexico 6.45. Nicaragua 4.2 5. Japan 3.6
COMMERCIAL SERVICES TRADE Value2010 2009
4 395 1 778
2010 0.12 0.05
Breakdown in economy's total exports By principal services item
6.6 33.5 48.0 27.3 45.4 39.3
INDUSTRIAL PROPERTY
Madrid Total ... ...
October 2011
Costa Rica
Annual percentage change2005-2010 2009 2010
Real GDP (2005=100) 4 -2 44 1 24 -12 18
Final bound
Non ad-valorem duties (% total tariff lines) Number of disputes (complainant - defendant) Requests for consultation
in agricultural goods (AOA) in non-agricultural goods
2010Share in world total exports Share in world total imports
Breakdown in economy's total imports By principal services item
Transportation Transportation
Direct residents Direct non-residents
Travel Travel Other commercial services Other commercial services
... ... ... ... ...
Patent grants by patent office Trademark registrations by officeResidents Non-residents Total
Outstanding notifications in WTO Central Registry
MFN duty free imports (%, 2009)
World Trade OrganizationTrade Profiles 2011
47Download the data:www.wto.org/statistics
CO
UN
TRY
PR
OFI
LES
BASIC INDICATORS Population (thousands, 2010) 19 738 Rank in world trade, 2010 Exports ImportsGDP (million current US$, 2010) 22 780 Merchandise 82 99GDP (million current PPP US$, 2010) 37 207 excluding intra-EU trade 59 74Current account balance (million US$, 2009) 1 670 Commercial services 119 88Trade per capita (US$, 2007-2009) 1 028 excluding intra-EU trade 93 64Trade to GDP ratio (2007-2009) 88.4
2010 112
Exports of goods and services (volume, 2005=100) 92Imports of goods and services (volume, 2005=100) 121
TRADE POLICY
WTO accession 1 January 1995 Contribution to WTO budget (%, 2011) 0.058Trade Policy Review 4, 5 July 1995 Import duties collected (%, 2007-2009) GPA accession - in total tax revenue 31.1Tariffs and duty free imports to total imports 12.3
Tariff binding coverage (%) 32.9 Number of notifications to WTO and measures in force MFN tariffs Applied 2010 44
Simple average of import duties Goods RTAs - services EIAs notified to WTO 3 - 0All goods 11.1 11.9 Anti-dumping (30 June 2010) ...
Agricultural goods (AOA) 14.9 14.5 Countervailing duties (30 June 2010) ...Non-agricultural goods 8.6 11.5 Safeguards (22 October 2010) 0
0.0 0.00 - 0
0.0 Original panel / Appellate Body (AB) reports 0 - 0 35.0 Compliance panel / AB reports (Article 21.5 DSU) 0 - 0
Agricultural products 56.8 Agricultural products 19.8Fuels and mining products 23.4 Fuels and mining products 24.3Manufactures 15.6 Manufactures 54.4
1. European Union (27) 48.4 1. European Union (27) 29.42. United States 7.8 2. Nigeria 20.63. Nigeria 7.0 3. China 7.24. Ghana 5.5 4. Thailand 5.15. Burkina Faso 3.7 5. United States 3.3 Unspecified destinations 1.5 Unspecified origins 6.1
COMMERCIAL SERVICES TRADE Value2009 2008 816
2 324
2009 0.02 0.07
Breakdown in economy's total exports By principal services item
28.7 58.0 13.9 14.8 57.4 27.2
INDUSTRIAL PROPERTY
Madrid Total ... ...
October 2011
Côte d'Ivoire
Annual percentage change2005-2010 2009 2010
Real GDP (2005=100) 2 4 3-2 9 -14 11 8
Final bound
Non ad-valorem duties (% total tariff lines) Number of disputes (complainant - defendant) Requests for consultation
in agricultural goods (AOA) in non-agricultural goods
2009Share in world total exports Share in world total imports
Breakdown in economy's total imports By principal services item
Transportation Transportation
Direct residents Direct non-residents
Travel Travel Other commercial services Other commercial services
... ... ... ... ...
Patent grants by patent office Trademark registrations by officeResidents Non-residents Total
Outstanding notifications in WTO Central Registry
MFN duty free imports (%, 2009)
a Breakdowns by destination/origin refer to 2009.
Côte d’Ivoire
World Trade OrganizationTrade Profiles 2011
48 Download the data:www.wto.org/statistics
Croatia
BASIC INDICATORS Population (thousands, 2010) 4 424 Rank in world trade, 2010 Exports ImportsGDP (million current US$, 2010) 60 852 Merchandise 77 71GDP (million current PPP US$, 2010) 86 342 excluding intra-EU trade 55 49Current account balance (million US$, 2010) - 909 Commercial services 48 75Trade per capita (US$, 2008-2010) 11 868 excluding intra-EU trade 30 53Trade to GDP ratio (2008-2010) 81.2
2010 105
Exports of goods and services (volume, 2005=100) 99Imports of goods and services (volume, 2005=100) 93
TRADE POLICY
WTO accession 30 November 2000 Contribution to WTO budget (%, 2011) 0.169Trade Policy Review 24, 26 March 2010 Import duties collected (%, 2007-2009) GPA accession Observer in total tax revenue 2.3Tariffs and duty free imports to total imports 1.1
Tariff binding coverage (%) 100 Number of notifications to WTO and measures in force MFN tariffs Applied 2010 8
Simple average of import duties Goods RTAs - services EIAs notified to WTO 4 - 1All goods 6.1 4.8 Anti-dumping (30 June 2010) ...
Agricultural goods (AOA) 10.4 9.9 Countervailing duties (30 June 2010) ...Non-agricultural goods 5.5 4.0 Safeguards (22 October 2010) 0
1.9 1.90 - 1
23.6 Original panel / Appellate Body (AB) reports 0 - 0 55.4 Compliance panel / AB reports (Article 21.5 DSU) 0 - 0
Agricultural products 15.0 Agricultural products 11.5Fuels and mining products 16.9 Fuels and mining products 21.2Manufactures 67.6 Manufactures 67.1
1. European Union (27) 61.1 1. European Union (27) 60.12. Bosnia and Herzegovina 11.6 2. Russian Federation 9.13. Serbia 3.9 3. China 7.24. United States 2.5 4. Bosnia and Herzegovina 3.05. Russian Federation 2.0 5. Turkey 2.9
COMMERCIAL SERVICES TRADE Value2010 2009
11 226 3 497
2010 0.30 0.10
Breakdown in economy's total exports By principal services item
9.6 18.9 73.4 23.8 17.0 57.3
INDUSTRIAL PROPERTY
Madrid Total 5 938 5 938
October 2011
Croatia
Annual percentage change2005-2010 2009 2010
Real GDP (2005=100) 1 -6 -10 -16 6
-1 -21 -2
Final bound
Non ad-valorem duties (% total tariff lines) Number of disputes (complainant - defendant) Requests for consultation
in agricultural goods (AOA) in non-agricultural goods
2010Share in world total exports Share in world total imports
Breakdown in economy's total imports By principal services item
Transportation Transportation
Direct residents Direct non-residents
Travel Travel Other commercial services Other commercial services
29 125 154 ... ...
Patent grants by patent office, 2009 Trademark registrations by office, 2009Residents Non-residents Total
Outstanding notifications in WTO Central Registry
MFN duty free imports (%, 2009)
World Trade OrganizationTrade Profiles 2011
49Download the data:www.wto.org/statistics
CO
UN
TRY
PR
OFI
LES
BASIC INDICATORS Population (thousands, 2010) 11 258 Rank in world trade, 2010 Exports ImportsGDP (million current US$, 2008) 62 705 Merchandise 113 84GDP (million current PPP US$, 2010) ... excluding intra-EU trade 89 60Current account balance (million US$, 2010) ... Commercial services 52 109Trade per capita (US$, 2007-2009) 2 237 excluding intra-EU trade 34 83Trade to GDP ratio (2006-2008) 42.9
2008 125
Exports of goods and services (volume, 2005=100) 120Imports of goods and services (volume, 2005=100) 128
TRADE POLICY
WTO accession 20 April 1995 Contribution to WTO budget (%, 2011) 0.073Trade Policy Review ... Import duties collected GPA accession - in total tax revenue ...Tariffs and duty free imports to total imports ...
Tariff binding coverage (%) 30.9 Number of notifications to WTO and measures in force MFN tariffs Applied 2010 5
Simple average of import duties Goods RTAs - services EIAs notified to WTO 2 - 0All goods 21.4 10.7 Anti-dumping (30 June 2010) ...
Agricultural goods (AOA) 37.3 10.9 Countervailing duties (30 June 2010) ...Non-agricultural goods 9.4 10.7 Safeguards (22 October 2010) 0
0.0 0.00 - 0
3.7 Original panel / Appellate Body (AB) reports 0 - 0 32.0 Compliance panel / AB reports (Article 21.5 DSU) 0 - 0
Agricultural products 20.0 Agricultural products 16.4Fuels and mining products 54.9 Fuels and mining products 30.2Manufactures 25.1 Manufactures 53.2
1. Bolivarian Rep. of Venezuela 12.8 1. European Union (27) 21.82. European Union (27) 9.8 2. China 13.43. Russian Federation 3.2 3. United States 4.54. Bolivia, Plurinational State of 1.6 4. Canada 3.55. Mexico 1.2 5. Brazil 3.1 Unspecified destinations 62.8 Unspecified origins 36.7
COMMERCIAL SERVICES TRADE Value2009 2008
8 785 1 375
2009 0.26 0.04
Breakdown in economy's total exports By principal services item
... ...
... ...
... ...
INDUSTRIAL PROPERTY
Madrid Total 1 403 1 403
October 2011
Cuba
Annual percentage change2005-2008 2007 2008
Real GDP (2005=100) 8 7 46 14 49 -1 8
Final bound
Non ad-valorem duties (% total tariff lines) Number of disputes (complainant - defendant) Requests for consultation
in agricultural goods (AOA) in non-agricultural goods
2009Share in world total exports Share in world total imports
Breakdown in economy's total imports By principal services item
Transportation Transportation
Direct residents Direct non-residents
Travel Travel Other commercial services Other commercial services
... 92 92 ... ...
Patent grants by patent office, 2008 Trademark registrations by office, 2009Residents Non-residents Total
Outstanding notifications in WTO Central Registry
MFN duty free imports (%, 2008)
a Breakdowns by commodity group and by destination/origin refer to 2006.
Cuba
World Trade OrganizationTrade Profiles 2011
50 Download the data:www.wto.org/statistics
Cyprus
BASIC INDICATORS Population (thousands, 2010) 1 104 Rank in world trade, 2010 Exports ImportsGDP (million current US$, 2009) 25 039 Merchandise 137 96GDP (million current PPP US$, 2009) 24 583 excluding intra-EU trade - -Current account balance (million US$, 2010) - 1 788 Commercial services 47 72Trade per capita (US$, 2008-2010) 24 505 excluding intra-EU trade - -Trade to GDP ratio (2007-2009) 104.5
2009 112
Exports of goods and services (volume, 2005=100) a 113Imports of goods and services (volume, 2005=100) a 132
TRADE POLICY
WTO accession 30 July 1995 Contribution to WTO budget (%, 2011) 0.069Trade Policy Review 6, 8 July 2011 Import duties collected GPA accession 1 May 2004 in total tax revenue ...Tariffs and duty free imports to total imports ...
Tariff binding coverage (%) 100 Number of notifications to WTO and measures in force MFN tariffs Applied 2010 18
Simple average of import duties Goods RTAs - services EIAs notified to WTO 31 - 10All goods 5.0 5.1 Anti-dumping (30 June 2010) 149
Agricultural goods (AOA) 12.3 12.8 Countervailing duties (30 June 2010) 8Non-agricultural goods 3.9 4.0 Safeguards (22 October 2010) 0
4.8 4.785 - 70
41.1 Original panel / Appellate Body (AB) reports 33 - 32 51.4 Compliance panel / AB reports (Article 21.5 DSU) 4 - 4
Agricultural products 20.3 Agricultural products 15.0Fuels and mining products 22.8 Fuels and mining products 21.4Manufactures 55.1 Manufactures 61.7
1. European Union (27) 51.1 1. European Union (27) 68.82. Lebanon 3.3 2. Israel 7.93. Syrian Arab Republic 2.1 3. China 5.34. Israel 1.8 4. United States 1.45. United Arab Emirates 1.8 5. Switzerland 1.2 Unspecified destinations 14.3 Unspecified origins 1.5
COMMERCIAL SERVICES TRADE Value2010 2009
11 365 4 079
2010 0.31 0.12
Breakdown in economy's total exports By principal services item
18.2 33.7 19.3 28.3 62.5 38.0
INDUSTRIAL PROPERTY
Madrid Total 956 956
October 2011
Cyprus
Annual percentage change2005-2009 2008 2009
Real GDP (2005=100) 3 4 -14 1 ...
10 10 ...
Final bound
Non ad-valorem duties (% total tariff lines) Number of disputes (complainant - defendant) Requests for consultation
in agricultural goods (AOA) in non-agricultural goods
2010Share in world total exports Share in world total imports
Breakdown in economy's total imports By principal services item
Transportation Transportation
Direct residents Direct non-residents
Travel Travel Other commercial services Other commercial services
1 11 12 ... ...
Patent grants by patent office, 2009 Trademark registrations by office, 2009Residents Non-residents Total
Outstanding notifications in WTO Central Registry
MFN duty free imports (%, 2009)
a Refers to 2008 and to the average annual percentage change for 2005-2008.
World Trade OrganizationTrade Profiles 2011
51Download the data:www.wto.org/statistics
CO
UN
TRY
PR
OFI
LES
BASIC INDICATORS Population (thousands, 2010) 10 525 Rank in world trade, 2010 Exports ImportsGDP (million current US$, 2010) 192 152 Merchandise 30 30GDP (million current PPP US$, 2010) 266 278 excluding intra-EU trade - -Current account balance (million US$, 2010) - 7 366 Commercial services 37 35Trade per capita (US$, 2008-2010) 27 494 excluding intra-EU trade - -Trade to GDP ratio (2008-2010) 144.4
2010 114
Exports of goods and services (volume, 2005=100) a 127Imports of goods and services (volume, 2005=100) a 123
TRADE POLICY
WTO accession 1 January 1995 Contribution to WTO budget (%, 2011) 0.790Trade Policy Review 6, 8 July 2011 Import duties collected GPA accession 1 May 2004 in total tax revenue ...Tariffs and duty free imports to total imports ...
Tariff binding coverage (%) 100 Number of notifications to WTO and measures in force MFN tariffs Applied 2010 18
Simple average of import duties Goods RTAs - services EIAs notified to WTO 31 - 10All goods 5.0 5.1 Anti-dumping (30 June 2010) 149
Agricultural goods (AOA) 12.3 12.8 Countervailing duties (30 June 2010) 8Non-agricultural goods 3.9 4.0 Safeguards (22 October 2010) 0
4.8 4.786 - 72
41.1 Original panel / Appellate Body (AB) reports 33 - 32 51.4 Compliance panel / AB reports (Article 21.5 DSU) 4 - 4
Agricultural products 5.1 Agricultural products 6.5Fuels and mining products 5.8 Fuels and mining products 12.9Manufactures 81.0 Manufactures 72.8
1. European Union (27) 83.9 1. European Union (27) 63.22. Russian Federation 2.7 2. China 12.23. United States 1.8 3. Russian Federation 5.44. Switzerland 1.7 4. Japan 2.45. China 0.9 5. United States 2.2
COMMERCIAL SERVICES TRADE Value2010 2009
21 608 20 253
2010 0.59 0.58
Breakdown in economy's total exports By principal services item
27.5 24.6 30.9 20.1 41.6 55.3
INDUSTRIAL PROPERTY
Madrid Total 2 985 10 004
October 2011
Czech Republic
Annual percentage change2005-2010 2009 2010
Real GDP (2005=100) 3 -4 26 -10 ...5 -10 ...
Final bound
Non ad-valorem duties (% total tariff lines) Number of disputes (complainant - defendant) Requests for consultation
in agricultural goods (AOA) in non-agricultural goods
2010Share in world total exports Share in world total imports
Breakdown in economy's total imports By principal services item
Transportation Transportation
Direct residents Direct non-residents
Travel Travel Other commercial services Other commercial services
376 917 1 293 6 219 800
Patent grants by patent office, 2009 Trademark registrations by office, 2009Residents Non-residents Total
Outstanding notifications in WTO Central Registry
MFN duty free imports (%, 2009)
a Refers to 2009 and to the average annual percentage change for 2005-2009.
Czech Republic
World Trade OrganizationTrade Profiles 2011
52 Download the data:www.wto.org/statistics
Denmark
BASIC INDICATORS Population (thousands, 2010) 5 544 Rank in world trade, 2010 Exports ImportsGDP (million current US$, 2010) 310 405 Merchandise 35 34GDP (million current PPP US$, 2010) 219 314 excluding intra-EU trade - -Current account balance (million US$, 2010) 16 994 Commercial services 20 21Trade per capita (US$, 2008-2010) 56 219 excluding intra-EU trade - -Trade to GDP ratio (2008-2010) 96.9
2010 100
Exports of goods and services (volume, 2005=100) a 104Imports of goods and services (volume, 2005=100) a 106
TRADE POLICY
WTO accession 1 January 1995 Contribution to WTO budget (%, 2011) 0.976Trade Policy Review 6, 8 July 2011 Import duties collected GPA accession 1 January 1996 in total tax revenue ...Tariffs and duty free imports to total imports ...
Tariff binding coverage (%) 100 Number of notifications to WTO and measures in force MFN tariffs Applied 2010 18
Simple average of import duties Goods RTAs - services EIAs notified to WTO 31 - 10All goods 5.0 5.1 Anti-dumping (30 June 2010) 149
Agricultural goods (AOA) 12.3 12.8 Countervailing duties (30 June 2010) 8Non-agricultural goods 3.9 4.0 Safeguards (22 October 2010) 0
4.8 4.785 - 71
41.1 Original panel / Appellate Body (AB) reports 33 - 32 51.4 Compliance panel / AB reports (Article 21.5 DSU) 4 - 4
Agricultural products 22.3 Agricultural products 16.9Fuels and mining products 11.1 Fuels and mining products 8.6Manufactures 64.0 Manufactures 72.6
1. European Union (27) 59.1 1. European Union (27) 70.52. Norway 6.1 2. China 7.53. United States 5.3 3. Norway 3.94. China 2.2 4. United States 3.15. Russian Federation 1.5 5. Russian Federation 1.2 Unspecified destinations 9.6 Unspecified origins 0.9
COMMERCIAL SERVICES TRADE Value2010 2009
58 650 49 316
2010 1.59 1.40
Breakdown in economy's total exports By principal services item
62.1 52.5 9.3 17.5
28.5 29.9
INDUSTRIAL PROPERTY
Madrid Total 2 103 10 438
October 2011
Denmark
Annual percentage change2005-2010 2009 2010
Real GDP (2005=100) 0 -5 21 -10 ...2 -12 ...
Final bound
Non ad-valorem duties (% total tariff lines) Number of disputes (complainant - defendant) Requests for consultation
in agricultural goods (AOA) in non-agricultural goods
2010Share in world total exports Share in world total imports
Breakdown in economy's total imports By principal services item
Transportation Transportation
Direct residents Direct non-residents
Travel Travel Other commercial services Other commercial services
130 81 211 3 040 5 295
Patent grants by patent office, 2009 Trademark registrations by office, 2009Residents Non-residents Total
Outstanding notifications in WTO Central Registry
MFN duty free imports (%, 2009)
a Refers to 2009 and to the average annual percentage change for 2005-2009.
World Trade OrganizationTrade Profiles 2011
53Download the data:www.wto.org/statistics
CO
UN
TRY
PR
OFI
LES
BASIC INDICATORS Population (thousands, 2010) 889 Rank in world trade, 2010 Exports ImportsGDP (million current US$, 2009) 1 049 Merchandise 180 182GDP (million current PPP US$, 2009) 1 995 excluding intra-EU trade 154 156Current account balance (million US$, 2009) - 71 Commercial services 163 175Trade per capita (US$, 2007-2009) 935 excluding intra-EU trade 137 149Trade to GDP ratio (2007-2009) 83.4
2009 122
Exports of goods and services (volume, 2005=100) a 103Imports of goods and services (volume, 2005=100) a 118
TRADE POLICY
WTO accession 31 May 1995 Contribution to WTO budget (%, 2011) 0.015Trade Policy Review 27 February, 1 March 2006 Import duties collected GPA accession - in total tax revenue ...Tariffs and duty free imports to total imports ...
Tariff binding coverage (%) 100 Number of notifications to WTO and measures in force MFN tariffs Applied 2009 42
Simple average of import duties Goods RTAs - services EIAs notified to WTO 1 - 0All goods 41.3 20.9 Anti-dumping (30 June 2010) ...
Agricultural goods (AOA) 49.9 14.2 Countervailing duties (30 June 2010) ...Non-agricultural goods 40.0 21.9 Safeguards (22 October 2010) 0
0.0 0.00 - 0
5.5 Original panel / Appellate Body (AB) reports 0 - 0 0.5 Compliance panel / AB reports (Article 21.5 DSU) 0 - 0
Agricultural products ... Agricultural products ...Fuels and mining products ... Fuels and mining products ...Manufactures ... Manufactures ...
1. Ethiopia 35.3 1. European Union (27) 37.32. European Union (27) 20.6 2. United Arab Emirates 18.53. Somalia 11.9 3. Saudi Arabia, Kingdom of 6.04. Brazil 8.7 4. Japan 5.55. Qatar 6.3 5. Ethiopia 5.0
COMMERCIAL SERVICES TRADE Value2009 2008 142 114
2009 0.00 0.00
Breakdown in economy's total exports By principal services item
77.8 73.0 11.3 5.1 11.0 21.9
INDUSTRIAL PROPERTY
Madrid Total ... ...
October 2011
Djibouti
Annual percentage change2005-2009 2008 2009
Real GDP (2005=100) 5 6 53 ... ...
18 ... ...
Final bound
Non ad-valorem duties (% total tariff lines) Number of disputes (complainant - defendant) Requests for consultation
in agricultural goods (AOA) in non-agricultural goods
2009Share in world total exports Share in world total imports
Breakdown in economy's total imports By principal services item
Transportation Transportation
Direct residents Direct non-residents
Travel Travel Other commercial services Other commercial services
... ... ... ... ...
Patent grants by patent office Trademark registrations by officeResidents Non-residents Total
Outstanding notifications in WTO Central Registry
MFN duty free imports (%, 2009)
a Refers to 2006 and to the average annual percentage change for 2005-2006. b Breakdowns by destination/origin refer to 2009.
Djibouti
World Trade OrganizationTrade Profiles 2011
54 Download the data:www.wto.org/statistics
Dominica
BASIC INDICATORS Population (thousands, 2010) 68 Rank in world trade, 2010 Exports ImportsGDP (million current US$, 2010) 383 Merchandise 190 194GDP (million current PPP US$, 2010) 667 excluding intra-EU trade 164 168Current account balance (million US$, 2010) - 97 Commercial services 173 188Trade per capita (US$, 2008-2010) 6 197 excluding intra-EU trade 147 162Trade to GDP ratio (2008-2010) 111.5
2010 116
Exports of goods and services (volume, 2005=100) a 110Imports of goods and services (volume, 2005=100) a 101
TRADE POLICY
WTO accession 1 January 1995 Contribution to WTO budget (%, 2011) 0.015Trade Policy Review 5, 7 November 2007 Import duties collected GPA accession - in total tax revenue ...Tariffs and duty free imports to total imports ...
Tariff binding coverage (%) 94.7 Number of notifications to WTO and measures in force MFN tariffs Applied 2007 35
Simple average of import duties Goods RTAs - services EIAs notified to WTO 2 - 2All goods 58.7 9.9 Anti-dumping (30 June 2010) ...
Agricultural goods (AOA) 112.2 20.5 Countervailing duties (30 June 2010) ...Non-agricultural goods 50.0 8.3 Safeguards (22 October 2010) 0
0.0 0.00 - 0
18.5 Original panel / Appellate Body (AB) reports 0 - 0 13.1 Compliance panel / AB reports (Article 21.5 DSU) 0 - 0
Agricultural products 39.1 Agricultural products 22.9Fuels and mining products 13.6 Fuels and mining products 17.7Manufactures 47.4 Manufactures 59.3
1. Saint Kitts and Nevis 17.7 1. United States 41.82. Jamaica 17.3 2. Trinidad and Tobago 15.33. European Union (27) 16.8 3. European Union (27) 8.04. Trinidad and Tobago 13.9 4. Bolivarian Rep. of Venezuela 7.25. Antigua and Barbuda 9.1 5. Japan 4.1
COMMERCIAL SERVICES TRADE Value2010 2009 116 62
2010 0.00 0.00
Breakdown in economy's total exports By principal services item
4.1 52.0 74.7 20.9 21.2 27.1
INDUSTRIAL PROPERTY
Madrid Total ... ...
October 2011
Dominica
Annual percentage change2005-2010 2009 2010
Real GDP (2005=100) 3 -1 210 ... ...1 ... ...
Final bound
Non ad-valorem duties (% total tariff lines) Number of disputes (complainant - defendant) Requests for consultation
in agricultural goods (AOA) in non-agricultural goods
2010Share in world total exports Share in world total imports
Breakdown in economy's total imports By principal services item
Transportation Transportation
Direct residents Direct non-residents
Travel Travel Other commercial services Other commercial services
... ... ... ... ...
Patent grants by patent office Trademark registrations by officeResidents Non-residents Total
Outstanding notifications in WTO Central Registry
MFN duty free imports (%, 2007)
a Refers to 2006 and to the average annual percentage change for 2005-2006.
World Trade OrganizationTrade Profiles 2011
55Download the data:www.wto.org/statistics
CO
UN
TRY
PR
OFI
LES
BASIC INDICATORS Population (thousands, 2010) 9 927 Rank in world trade, 2010 Exports ImportsGDP (million current US$, 2010) 51 577 Merchandise 97 77GDP (million current PPP US$, 2010) 92 129 excluding intra-EU trade 73 55Current account balance (million US$, 2009) - 2 159 Commercial services 64 99Trade per capita (US$, 2008-2010) 2 824 excluding intra-EU trade 42 73Trade to GDP ratio (2008-2010) 57.8
2010 141
Exports of goods and services (volume, 2005=100) 86Imports of goods and services (volume, 2005=100) 100
TRADE POLICY
WTO accession 9 March 1995 Contribution to WTO budget (%, 2011) 0.084Trade Policy Review 24, 26 November 2008 Import duties collected (%, 2006-2008) GPA accession - in total tax revenue 9.2Tariffs and duty free imports to total imports 3.7
Tariff binding coverage (%) 100 Number of notifications to WTO and measures in force MFN tariffs Applied 2008 9
Simple average of import duties Goods RTAs - services EIAs notified to WTO 2 - 2All goods 34.0 7.1 Anti-dumping (30 June 2010) ...
Agricultural goods (AOA) 39.3 12.8 Countervailing duties (30 June 2010) ...Non-agricultural goods 33.2 6.2 Safeguards (22 October 2010) 1
0.0 0.00 - 7
42.1 Original panel / Appellate Body (AB) reports 0 - 1 7.7 Compliance panel / AB reports (Article 21.5 DSU) 0 - 0
Agricultural products 19.4 Agricultural products 14.6Fuels and mining products 8.8 Fuels and mining products 25.0Manufactures 62.2 Manufactures 59.0
1. United States 57.2 1. United States 39.02. Haiti 16.2 2. China 10.73. European Union (27) 11.3 3. European Union (27) 9.34. China 2.4 4. Bolivarian Rep. of Venezuela 7.25. Jamaica 1.0 5. Mexico 6.0
COMMERCIAL SERVICES TRADE Value2010 2009
5 132 2 055
2010 a 0.14 0.06
Breakdown in economy's total exports By principal services item
9.1 57.9 83.3 20.2 7.7 21.8
INDUSTRIAL PROPERTY
Madrid Total ... ...
October 2011
Dominican Republic
Annual percentage change2005-2010 2009 2010
Real GDP (2005=100) 7 3 8-3 -7 -60 -10 -8
Final bound
Non ad-valorem duties (% total tariff lines) Number of disputes (complainant - defendant) Requests for consultation
in agricultural goods (AOA) in non-agricultural goods
2010 aShare in world total exports Share in world total imports
Breakdown in economy's total imports By principal services item
Transportation Transportation
Direct residents Direct non-residents
Travel Travel Other commercial services Other commercial services
... ... ... ... ...
Patent grants by patent office Trademark registrations by officeResidents Non-residents Total
Outstanding notifications in WTO Central Registry
MFN duty free imports (%, 2007)
a Breakdowns by services items refer to 2009.
Dominican Republic
World Trade OrganizationTrade Profiles 2011
56 Download the data:www.wto.org/statistics
Ecuador
BASIC INDICATORS Population (thousands, 2010) 14 465 Rank in world trade, 2010 Exports ImportsGDP (million current US$, 2010) 58 910 Merchandise 72 70GDP (million current PPP US$, 2010) 117 241 excluding intra-EU trade 50 48Current account balance (million US$, 2009) - 268 Commercial services 106 81Trade per capita (US$, 2008-2010) 2 691 excluding intra-EU trade 80 59Trade to GDP ratio (2008-2010) 69.7
2010 120
Exports of goods and services (volume, 2005=100) 115Imports of goods and services (volume, 2005=100) 121
TRADE POLICY
WTO accession 21 January 1996 Contribution to WTO budget (%, 2011) 0.099Trade Policy Review 15, 17 June 2005 Import duties collected GPA accession - in total tax revenue ...Tariffs and duty free imports to total imports ...
Tariff binding coverage (%) 100 Number of notifications to WTO and measures in force MFN tariffs Applied 2010 8
Simple average of import duties Goods RTAs - services EIAs notified to WTO 3 - 0All goods 21.7 11.2 Anti-dumping (30 June 2010) ...
Agricultural goods (AOA) 25.7 18.4 Countervailing duties (30 June 2010) ...Non-agricultural goods 21.2 10.1 Safeguards (22 October 2010) 1
0.0 0.03 - 3
10.9 Original panel / Appellate Body (AB) reports 2 - 0 64.7 Compliance panel / AB reports (Article 21.5 DSU) 2 - 0
Agricultural products 34.1 Agricultural products 9.4Fuels and mining products 55.9 Fuels and mining products 22.4Manufactures 9.6 Manufactures 67.7
1. United States 34.7 1. United States 27.92. European Union (27) 13.0 2. Colombia 9.83. Panama 12.2 3. European Union (27) 8.94. Peru 7.6 4. China 7.85. Bolivarian Rep. of Venezuela 5.6 5. Peru 5.0
COMMERCIAL SERVICES TRADE Value2010 2009
1 264 2 907
2010 0.03 0.08
Breakdown in economy's total exports By principal services item
28.4 58.2 61.8 19.5 9.8 22.3
INDUSTRIAL PROPERTY
Madrid Total ... 12 181
October 2011
Ecuador
Annual percentage change2005-2010 2009 2010
Real GDP (2005=100) 4 0 43 -6 64 -8 2
Final bound
Non ad-valorem duties (% total tariff lines) Number of disputes (complainant - defendant) Requests for consultation
in agricultural goods (AOA) in non-agricultural goods
2010Share in world total exports Share in world total imports
Breakdown in economy's total imports By principal services item
Transportation Transportation
Direct residents Direct non-residents
Travel Travel Other commercial services Other commercial services
... ... 64 4 928 7 253
Patent grants by patent office, 2009 Trademark registrations by office, 2007Residents Non-residents Total
Outstanding notifications in WTO Central Registry
MFN duty free imports (%, 2009)
World Trade OrganizationTrade Profiles 2011
57Download the data:www.wto.org/statistics
CO
UN
TRY
PR
OFI
LES
BASIC INDICATORS Population (thousands, 2010) 81 121 Rank in world trade, 2010 Exports ImportsGDP (million current US$, 2010) 218 912 Merchandise 63 49GDP (million current PPP US$, 2010) 509 503 excluding intra-EU trade 45 31Current account balance (million US$, 2009) - 3 349 Commercial services 34 46Trade per capita (US$, 2008-2010) 1 356 excluding intra-EU trade 21 29Trade to GDP ratio (2008-2010) 56.8
2010 138
Exports of goods and services (volume, 2005=100) 147Imports of goods and services (volume, 2005=100) 137
TRADE POLICY
WTO accession 30 June 1995 Contribution to WTO budget (%, 2011) 0.284Trade Policy Review 26, 28 July 2005 Import duties collected (%, 2007-2009) GPA accession - in total tax revenue 8.9Tariffs and duty free imports to total imports 3.9
Tariff binding coverage (%) 99.4 Number of notifications to WTO and measures in force MFN tariffs Applied 2009 38
Simple average of import duties Goods RTAs - services EIAs notified to WTO 7 - 0All goods 36.7 17.0 Anti-dumping (30 June 2010) 23
Agricultural goods (AOA) 95.2 66.1 Countervailing duties (30 June 2010) ...Non-agricultural goods 27.7 9.6 Safeguards (22 October 2010) 1
0.2 0.20 - 4
61.6 Original panel / Appellate Body (AB) reports 0 - 1 16.0 Compliance panel / AB reports (Article 21.5 DSU) 0 - 0
Agricultural products 19.4 Agricultural products 22.4Fuels and mining products 34.5 Fuels and mining products 17.7Manufactures 41.5 Manufactures 59.9
1. European Union (27) 30.3 1. European Union (27) 32.32. Saudi Arabia, Kingdom of 5.9 2. United States 9.43. United States 5.9 3. China 9.24. India 4.7 4. Saudi Arabia, Kingdom of 4.05. Libyan Arab Jamahiriya 4.6 5. Korea, Republic of 3.6
COMMERCIAL SERVICES TRADE Value2010 2009
23 618 13 003
2010 0.64 0.37
Breakdown in economy's total exports By principal services item
33.5 50.6 53.0 17.2 13.4 32.2
INDUSTRIAL PROPERTY
Madrid Total 2 773 2 773
October 2011
Egypt
Annual percentage change2005-2010 2009 2010
Real GDP (2005=100) 7 7 58 -15 -116 -18 -16
Final bound
Non ad-valorem duties (% total tariff lines) Number of disputes (complainant - defendant) Requests for consultation
in agricultural goods (AOA) in non-agricultural goods
2010Share in world total exports Share in world total imports
Breakdown in economy's total imports By principal services item
Transportation Transportation
Direct residents Direct non-residents
Travel Travel Other commercial services Other commercial services
56 265 321 ... ...
Patent grants by patent office, 2009 Trademark registrations by office, 2009Residents Non-residents Total
Outstanding notifications in WTO Central Registry
MFN duty free imports (%, 2009)
Egypt
World Trade OrganizationTrade Profiles 2011
58 Download the data:www.wto.org/statistics
El Salvador
BASIC INDICATORS Population (thousands, 2010) 6 193 Rank in world trade, 2010 Exports ImportsGDP (million current US$, 2010) 21 796 Merchandise 110 97GDP (million current PPP US$, 2010) 41 445 excluding intra-EU trade 86 72Current account balance (million US$, 2010) - 488 Commercial services 117 122Trade per capita (US$, 2008-2010) 2 370 excluding intra-EU trade 91 96Trade to GDP ratio (2008-2010) 67.4
2010 109
Exports of goods and services (volume, 2005=100) 102Imports of goods and services (volume, 2005=100) 116
TRADE POLICY
WTO accession 7 May 1995 Contribution to WTO budget (%, 2011) 0.049Trade Policy Review 10, 12 February 2010 Import duties collected (%, 2007-2009) GPA accession - in total tax revenue 5.9Tariffs and duty free imports to total imports 0.2
Tariff binding coverage (%) 100 Number of notifications to WTO and measures in force MFN tariffs Applied 2010 21
Simple average of import duties Goods RTAs - services EIAs notified to WTO 6 - 5All goods 36.6 5.9 Anti-dumping (30 June 2010) ...
Agricultural goods (AOA) 42.5 12.3 Countervailing duties (30 June 2010) ...Non-agricultural goods 35.7 4.9 Safeguards (22 October 2010) 0
0.0 0.01 - 0
24.1 Original panel / Appellate Body (AB) reports 0 - 0 64.8 Compliance panel / AB reports (Article 21.5 DSU) 0 - 0
Agricultural products 21.9 Agricultural products 18.5Fuels and mining products 4.6 Fuels and mining products 17.4Manufactures 71.5 Manufactures 63.7
1. United States 48.4 1. United States 36.92. Guatemala 14.0 2. Guatemala 9.53. Honduras 12.9 3. Mexico 8.94. Nicaragua 5.4 4. European Union (27) 6.85. European Union (27) 4.3 5. China 5.7
COMMERCIAL SERVICES TRADE Value2010 2009 944
1 024
2010 0.03 0.03
Breakdown in economy's total exports By principal services item
31.8 45.0 41.3 21.4 26.8 33.7
INDUSTRIAL PROPERTY
Madrid Total ... 5 460
October 2011
El Salvador
Annual percentage change2005-2010 2009 2010
Real GDP (2005=100) 2 -4 10 -16 103 -23 26
Final bound
Non ad-valorem duties (% total tariff lines) Number of disputes (complainant - defendant) Requests for consultation
in agricultural goods (AOA) in non-agricultural goods
2009Share in world total exports Share in world total imports
Breakdown in economy's total imports By principal services item
Transportation Transportation
Direct residents Direct non-residents
Travel Travel Other commercial services Other commercial services
... ... ... ... ...
Patent grants by patent office Trademark registrations by officeResidents Non-residents Total
Outstanding notifications in WTO Central Registry
MFN duty free imports
Equatorial Guinea
World Trade OrganizationTrade Profiles 2011
60 Download the data:www.wto.org/statistics
Eritrea
BASIC INDICATORS Population (thousands, 2010) 5 254 Rank in world trade, 2010 Exports ImportsGDP (million current US$, 2010) 2 117 Merchandise 199 176GDP (million current PPP US$, 2010) 2 847 excluding intra-EU trade 173 150Current account balance (million US$, 2010) ... Commercial services 170 191Trade per capita (US$, 2008-2010) ... excluding intra-EU trade 144 165Trade to GDP ratio (2008-2010) ...
2010 96
Exports of goods and services (volume, 2005=100) a 97Imports of goods and services (volume, 2005=100) a 98
TRADE POLICY
WTO accession Non-member and non-observer Contribution to WTO budget -Trade Policy Review - Import duties collected GPA accession - in total tax revenue ...Tariffs and duty free imports to total imports ...
Tariff binding coverage (%) - Number of notifications to WTO and measures in force MFN tariffs Applied 2006 -
Simple average of import duties Goods RTAs - services EIAs notified to WTO 1 - 0All goods - 7.9 Anti-dumping -
2010Share in world total exports Share in world total imports
Breakdown in economy's total imports By principal services item
Transportation Transportation
Direct residents Direct non-residents
Travel Travel Other commercial services Other commercial services
... ... ... ... ...
Patent grants by patent office Trademark registrations by officeResidents Non-residents Total
Outstanding notifications in WTO Central Registry
MFN duty free imports
a Refers to 2007 and to the average annual percentage change for 2005-2007.
World Trade OrganizationTrade Profiles 2011
61Download the data:www.wto.org/statistics
CO
UN
TRY
PR
OFI
LES
BASIC INDICATORS Population (thousands, 2010) 1 340 Rank in world trade, 2010 Exports ImportsGDP (million current US$, 2010) 18 674 Merchandise 78 81GDP (million current PPP US$, 2010) 26 837 excluding intra-EU trade - -Current account balance (million US$, 2010) 683 Commercial services 66 85Trade per capita (US$, 2008-2010) 23 165 excluding intra-EU trade - -Trade to GDP ratio (2008-2010) 152.0
2010 98
Exports of goods and services (volume, 2005=100) 98Imports of goods and services (volume, 2005=100) 83
TRADE POLICY
WTO accession 13 November 1999 Contribution to WTO budget (%, 2011) 0.097Trade Policy Review 6, 8 July 2011 Import duties collected GPA accession 1 May 2004 in total tax revenue ...Tariffs and duty free imports to total imports ...
Tariff binding coverage (%) 100 Number of notifications to WTO and measures in force MFN tariffs Applied 2010 18
Simple average of import duties Goods RTAs - services EIAs notified to WTO 31 - 10All goods 5.0 5.1 Anti-dumping (30 June 2010) 149
Agricultural goods (AOA) 12.3 12.8 Countervailing duties (30 June 2010) 8Non-agricultural goods 3.9 4.0 Safeguards (22 October 2010) 0
4.8 4.785 - 70
41.1 Original panel / Appellate Body (AB) reports 33 - 32 51.4 Compliance panel / AB reports (Article 21.5 DSU) 4 - 4
Agricultural products 16.0 Agricultural products 13.5Fuels and mining products 18.6 Fuels and mining products 18.5Manufactures 64.7 Manufactures 67.1
1. European Union (27) 60.9 1. European Union (27) 64.52. Russian Federation 14.8 2. Russian Federation 10.53. United States 4.2 3. China 6.94. Norway 3.2 4. Japan 2.15. Nigeria 2.2 5. United States 2.0
COMMERCIAL SERVICES TRADE Value2010 2009
4 460 2 742
2010 0.12 0.08
Breakdown in economy's total exports By principal services item
39.5 35.4 24.2 22.2 36.2 42.4
INDUSTRIAL PROPERTY
Madrid Total 1 883 3 083
October 2011
Estonia
Annual percentage change2005-2010 2009 2010
Real GDP (2005=100) 0 -14 20 -19 11
-4 -33 9
Final bound
Non ad-valorem duties (% total tariff lines) Number of disputes (complainant - defendant) Requests for consultation
in agricultural goods (AOA) in non-agricultural goods
Agricultural products 81.2 Agricultural products 11.5Fuels and mining products 1.0 Fuels and mining products 19.7Manufactures 9.8 Manufactures 68.7
1. European Union (27) 30.5 1. China 24.02. China 10.4 2. European Union (27) 15.53. Somalia 9.6 3. Saudi Arabia, Kingdom of 11.94. Sudan 6.5 4. India 7.25. Saudi Arabia, Kingdom of 6.3 5. United Arab Emirates 5.6
COMMERCIAL SERVICES TRADE Value2009 2008
1 676 2 190
2009 0.05 0.07
Breakdown in economy's total exports By principal services item
59.2 67.4 19.6 6.3 21.2 26.2
INDUSTRIAL PROPERTY
Madrid Total ... 627
October 2011
Ethiopia
Annual percentage change2005-2010 2009 2010
Real GDP (2005=100) 10 9 106 7 14
19 16 16
Final bound
Non ad-valorem duties (% total tariff lines) Number of disputes (complainant - defendant) Requests for consultation
in agricultural goods (AOA) in non-agricultural goods
2009Share in world total exports Share in world total imports
Breakdown in economy's total imports By principal services item
Transportation Transportation
Direct residents Direct non-residents
Travel Travel Other commercial services Other commercial services
... 13 13 355 272
Patent grants by patent office, 2007 Trademark registrations by office, 2007Residents Non-residents Total
Outstanding notifications in WTO Central Registry
MFN duty free imports (%, 2009)
World Trade OrganizationTrade Profiles 2011
63Download the data:www.wto.org/statistics
CO
UN
TRY
PR
OFI
LES
BASIC INDICATORS Population (thousands, 2010) 502 088 Rank in world trade, 2010 Exports ImportsGDP (million current US$, 2010) 16 222 201 Merchandise - -GDP (million current PPP US$, 2009) 15 617 685 excluding intra-EU trade 1 1Current account balance (million US$, 2010) - 125 186 Commercial services - -Trade per capita (US$, 2008-2010) 10 080 excluding intra-EU trade 1 1Trade to GDP ratio (2008-2010) 29.8
2010 104
Exports of goods and services (volume, 2005=100) 113Imports of goods and services (volume, 2005=100) 112
TRADE POLICY
WTO accession 1 January 1995 Contribution to WTO budget -Trade Policy Review 6, 8 July 2011 Import duties collected (%, 2007-2009) GPA accession 1 January 1996 in total tax revenue 0.6Tariffs and duty free imports to total imports 1.1
Tariff binding coverage (%) 100 Number of notifications to WTO and measures in force MFN tariffs Applied 2010 16
Simple average of import duties Goods RTAs - services EIAs notified to WTO 30 - 9All goods 5.0 5.1 Anti-dumping (30 June 2010) 149
Agricultural goods (AOA) 12.3 12.8 Countervailing duties (30 June 2010) 8Non-agricultural goods 3.9 4.0 Safeguards (22 October 2010) 0
4.8 4.785 - 70
41.1 Original panel / Appellate Body (AB) reports 33 - 32 51.4 Compliance panel / AB reports (Article 21.5 DSU) 4 - 4
Agricultural products 7.2 Agricultural products 7.7Fuels and mining products 8.2 Fuels and mining products 30.2Manufactures 81.1 Manufactures 60.0
1. United States 18.0 1. China 18.92. China 8.4 2. United States 11.43. Switzerland 7.9 3. Russian Federation 10.44. Russian Federation 6.4 4. Switzerland 5.75. Turkey 4.5 5. Norway 5.3
COMMERCIAL SERVICES TRADE Value2010 2009
685 211 590 018
2010 24.39 21.88
Breakdown in economy's total exports By principal services item
24.6 24.3 14.1 19.6 61.3 56.1
INDUSTRIAL PROPERTY
Madrid Total 12 001 88 491
Outstanding notifications in WTO Central Registry
MFN duty free imports (%, 2009)
- - - ... 76 490
Patent grants by patent office Trademark registrations by office, 2009Residents Non-residents Total Direct residents Direct non-residents
Travel Travel Other commercial services Other commercial services
Share in world total exports Share in world total imports
Breakdown in economy's total imports By principal services item
Non ad-valorem duties (% total tariff lines) Number of disputes (complainant - defendant) Requests for consultation
in agricultural goods (AOA) in non-agricultural goods
3 -12 102 -12 9
Real GDP (2005=100) 1 -4 2
October 2011
European Union (27)
Annual percentage change2005-2010 2009 2010
European Union (27)
World Trade OrganizationTrade Profiles 2011
64 Download the data:www.wto.org/statistics
Fiji
BASIC INDICATORS Population (thousands, 2010) 861 Rank in world trade, 2010 Exports ImportsGDP (million current US$, 2010) 3 009 Merchandise 156 157GDP (million current PPP US$, 2010) 3 867 excluding intra-EU trade 130 131Current account balance (million US$, 2009) - 236 Commercial services 121 151Trade per capita (US$, 2008-2010) 4 264 excluding intra-EU trade 95 125Trade to GDP ratio (2008-2010) 116.0
2010 98
Exports of goods and services (volume, 2005=100) ...Imports of goods and services (volume, 2005=100) ...
TRADE POLICY
WTO accession 14 January 1996 Contribution to WTO budget (%, 2011) 0.015Trade Policy Review 25, 27 March 2009 Import duties collected (%, 2004-2006) GPA accession - in total tax revenue 18.5Tariffs and duty free imports to total imports 6.2
Tariff binding coverage (%) 51.3 Number of notifications to WTO and measures in force MFN tariffs Applied 2010 22
Simple average of import duties Goods RTAs - services EIAs notified to WTO 3 - 0All goods 41.2 11.9 Anti-dumping (30 June 2010) ...
Agricultural goods (AOA) 44.6 22.4 Countervailing duties (30 June 2010) ...Non-agricultural goods 40.0 10.3 Safeguards (22 October 2010) 0
0.3 1.80 - 0
22.3 Original panel / Appellate Body (AB) reports 0 - 0 7.0 Compliance panel / AB reports (Article 21.5 DSU) 0 - 0
Agricultural products 48.4 Agricultural products 19.1Fuels and mining products 31.6 Fuels and mining products 32.0Manufactures 19.9 Manufactures 46.2
1. Singapore 16.4 1. Singapore 27.72. European Union (27) 16.4 2. Australia 22.13. Australia 15.9 3. New Zealand 15.94. United States 11.1 4. China 5.55. New Zealand 6.7 5. United States 4.4
COMMERCIAL SERVICES TRADE Value2010 2009 802 469
2010 0.02 0.01
Breakdown in economy's total exports By principal services item
30.6 52.9 65.0 18.7 4.4 28.4
INDUSTRIAL PROPERTY
Madrid Total ... ...
October 2011
Fiji
Annual percentage change2005-2010 2009 2010
Real GDP (2005=100) 0 -3 0... ... ...... ... ...
Final bound
Non ad-valorem duties (% total tariff lines) Number of disputes (complainant - defendant) Requests for consultation
in agricultural goods (AOA) in non-agricultural goods
2010Share in world total exports Share in world total imports
Breakdown in economy's total imports By principal services item
Transportation Transportation
Direct residents Direct non-residents
Travel Travel Other commercial services Other commercial services
... ... ... ... ...
Patent grants by patent office Trademark registrations by officeResidents Non-residents Total
Outstanding notifications in WTO Central Registry
MFN duty free imports (%, 2009)
a Breakdowns by destination/origin refer to 2009.
World Trade OrganizationTrade Profiles 2011
65Download the data:www.wto.org/statistics
CO
UN
TRY
PR
OFI
LES
BASIC INDICATORS Population (thousands, 2010) 5 364 Rank in world trade, 2010 Exports ImportsGDP (million current US$, 2010) 238 801 Merchandise 41 38GDP (million current PPP US$, 2010) 196 629 excluding intra-EU trade - -Current account balance (million US$, 2010) 7 466 Commercial services 35 34Trade per capita (US$, 2008-2010) 37 239 excluding intra-EU trade - -Trade to GDP ratio (2008-2010) 79.8
2010 105
Exports of goods and services (volume, 2005=100) a 103Imports of goods and services (volume, 2005=100) a 101
TRADE POLICY
WTO accession 1 January 1995 Contribution to WTO budget (%, 2011) 0.648Trade Policy Review 6, 8 July 2011 Import duties collected GPA accession 1 January 1996 in total tax revenue ...Tariffs and duty free imports to total imports ...
Tariff binding coverage (%) 100 Number of notifications to WTO and measures in force MFN tariffs Applied 2010 18
Simple average of import duties Goods RTAs - services EIAs notified to WTO 31 - 10All goods 5.0 5.1 Anti-dumping (30 June 2010) 149
Agricultural goods (AOA) 12.3 12.8 Countervailing duties (30 June 2010) 8Non-agricultural goods 3.9 4.0 Safeguards (22 October 2010) 0
4.8 4.785 - 70
41.1 Original panel / Appellate Body (AB) reports 33 - 32 51.4 Compliance panel / AB reports (Article 21.5 DSU) 4 - 4
Agricultural products 8.2 Agricultural products 9.4Fuels and mining products 12.9 Fuels and mining products 26.4Manufactures 73.1 Manufactures 62.3
1. European Union (27) 55.0 1. European Union (27) 54.92. Russian Federation 9.0 2. Russian Federation 17.83. United States 7.0 3. China 7.34. China 5.1 4. United States 3.45. Norway 2.7 5. Norway 2.3
COMMERCIAL SERVICES TRADE Value2010 2009
23 431 20 679
2010 0.63 0.59
Breakdown in economy's total exports By principal services item
12.3 25.2 12.4 20.5 75.3 54.3
INDUSTRIAL PROPERTY
Madrid Total 1 935 5 504
October 2011
Finland
Annual percentage change2005-2010 2009 2010
Real GDP (2005=100) 1 -8 31 -20 ...0 -18 ...
Final bound
Non ad-valorem duties (% total tariff lines) Number of disputes (complainant - defendant) Requests for consultation
in agricultural goods (AOA) in non-agricultural goods
2010Share in world total exports Share in world total imports
Breakdown in economy's total imports By principal services item
Transportation Transportation
Direct residents Direct non-residents
Travel Travel Other commercial services Other commercial services
721 334 1 055 3 043 526
Patent grants by patent office, 2009 Trademark registrations by office, 2009Residents Non-residents Total
Outstanding notifications in WTO Central Registry
MFN duty free imports (%, 2009)
a Refers to 2009 and to the average annual percentage change for 2005-2009.
Finland
World Trade OrganizationTrade Profiles 2011
66 Download the data:www.wto.org/statistics
France
BASIC INDICATORS Population (thousands, 2010) 64 877 Rank in world trade, 2010 Exports ImportsGDP (million current US$, 2010) 2 560 002 Merchandise 6 5GDP (million current PPP US$, 2010) 2 194 118 excluding intra-EU trade - -Current account balance (million US$, 2010) - 54 460 Commercial services 5 6Trade per capita (US$, 2008-2010) 21 947 excluding intra-EU trade - -Trade to GDP ratio (2008-2010) 53.0
2010 103
Exports of goods and services (volume, 2005=100) a 94Imports of goods and services (volume, 2005=100) a 100
TRADE POLICY
WTO accession 1 January 1995 Contribution to WTO budget (%, 2011) 4.489Trade Policy Review 6, 8 July 2011 Import duties collected GPA accession 1 January 1996 in total tax revenue ...Tariffs and duty free imports to total imports ...
Tariff binding coverage (%) 100 Number of notifications to WTO and measures in force MFN tariffs Applied 2010 18
Simple average of import duties Goods RTAs - services EIAs notified to WTO 31 - 10All goods 5.0 5.1 Anti-dumping (30 June 2010) 149
Agricultural goods (AOA) 12.3 12.8 Countervailing duties (30 June 2010) 8Non-agricultural goods 3.9 4.0 Safeguards (22 October 2010) 0
4.8 4.785 - 72
41.1 Original panel / Appellate Body (AB) reports 33 - 32 51.4 Compliance panel / AB reports (Article 21.5 DSU) 4 - 4
Agricultural products 13.1 Agricultural products 9.9Fuels and mining products 6.4 Fuels and mining products 16.4Manufactures 78.5 Manufactures 73.2
1. European Union (27) 61.1 1. European Union (27) 59.92. United States 5.7 2. China 8.23. Switzerland 2.9 3. United States 5.94. China 2.8 4. Russian Federation 2.75. Russian Federation 1.6 5. Switzerland 2.4
COMMERCIAL SERVICES TRADE Value2010 2009
142 605 128 931
2010 3.86 3.67
Breakdown in economy's total exports By principal services item
25.2 27.7 32.4 30.5 42.4 41.8
INDUSTRIAL PROPERTY
Madrid Total 4 675 4 675
October 2011
France
Annual percentage change2005-2010 2009 2010
Real GDP (2005=100) 1 -3 1-2 -12 ...0 -11 ...
Final bound
Non ad-valorem duties (% total tariff lines) Number of disputes (complainant - defendant) Requests for consultation
in agricultural goods (AOA) in non-agricultural goods
Agricultural products 18.7 Agricultural products 14.4Fuels and mining products 4.2 Fuels and mining products 6.5Manufactures 50.9 Manufactures 62.2
1. European Union (27) 56.2 1. European Union (27) 52.22. Serbia 24.2 2. Russian Federation 9.83. Croatia 5.7 3. Serbia 8.14. Bosnia and Herzegovina 3.2 4. China 5.75. Albania 3.1 5. Turkey 5.0
COMMERCIAL SERVICES TRADE Value2010 2009 901 801
2010 0.02 0.02
Breakdown in economy's total exports By principal services item
32.0 39.5 21.9 11.5 46.1 49.1
INDUSTRIAL PROPERTY
Madrid Total 3 768 3 768
October 2011
FYR Macedonia
Annual percentage change2005-2010 2009 2010
Real GDP (2005=100) 3 -1 10 -13 ...4 -11 ...
Final bound
Non ad-valorem duties (% total tariff lines) Number of disputes (complainant - defendant) Requests for consultation
in agricultural goods (AOA) in non-agricultural goods
2010Share in world total exports Share in world total imports
Breakdown in economy's total imports By principal services item
Transportation Transportation
Direct residents Direct non-residents
Travel Travel Other commercial services Other commercial services
11 325 336 ... ...
Patent grants by patent office, 2008 Trademark registrations by office, 2009Residents Non-residents Total
Outstanding notifications in WTO Central Registry
MFN duty free imports (%, 2008)
a Refers to 2009 and to the average annual percentage change for 2005-2009. b Breakdowns by commodity group and by destination/origin refer to 2009.
FYR Macedonia
World Trade OrganizationTrade Profiles 2011
68 Download the data:www.wto.org/statistics
Gabon
BASIC INDICATORS Population (thousands, 2010) 1 505 Rank in world trade, 2010 Exports ImportsGDP (million current US$, 2010) 13 011 Merchandise 86 136GDP (million current PPP US$, 2010) 22 471 excluding intra-EU trade 62 110Current account balance (million US$, 2005) 1 983 Commercial services 161 111Trade per capita (US$, 2007-2009) 7 581 excluding intra-EU trade 135 85Trade to GDP ratio (2007-2009) 89.0
2010 114
Exports of goods and services (volume, 2005=100) 92Imports of goods and services (volume, 2005=100) 143
TRADE POLICY
WTO accession 1 January 1995 Contribution to WTO budget (%, 2011) 0.021Trade Policy Review 1, 3 October 2007 Import duties collected GPA accession - in total tax revenue ...Tariffs and duty free imports to total imports ...
Tariff binding coverage (%) 100 Number of notifications to WTO and measures in force MFN tariffs Applied 2009 15
Simple average of import duties Goods RTAs - services EIAs notified to WTO 1 - 0All goods 21.4 17.8 Anti-dumping (30 June 2010) ...
Agricultural goods (AOA) 59.6 21.9 Countervailing duties (30 June 2010) ...Non-agricultural goods 15.5 17.1 Safeguards (22 October 2010) 0
0.0 0.00 - 0
2.0 Original panel / Appellate Body (AB) reports 0 - 0 7.4 Compliance panel / AB reports (Article 21.5 DSU) 0 - 0
Agricultural products 4.5 Agricultural products 15.7Fuels and mining products 83.6 Fuels and mining products 13.9Manufactures 2.6 Manufactures 70.4
1. United States 59.0 1. European Union (27) 65.12. European Union (27) 17.9 2. United States 7.13. China 8.0 3. China 4.94. Malaysia 4.0 4. Japan 2.15. Korea, Republic of 1.6 5. Cameroon 2.1
COMMERCIAL SERVICES TRADE Value2009 2008 172
1 279
2009 a 0.01 0.04
Breakdown in economy's total exports By principal services item
22.0 31.4 7.7 26.9
70.3 41.7
INDUSTRIAL PROPERTY
Madrid Total ... ...
October 2011
Gabon
Annual percentage change2005-2010 2009 2010
Real GDP (2005=100) 3 -1 6-2 -5 37 -3 9
Final bound
Non ad-valorem duties (% total tariff lines) Number of disputes (complainant - defendant) Requests for consultation
in agricultural goods (AOA) in non-agricultural goods
2009 aShare in world total exports Share in world total imports
Breakdown in economy's total imports By principal services item
Transportation Transportation
Direct residents Direct non-residents
Travel Travel Other commercial services Other commercial services
... ... ... ... ...
Patent grants by patent office Trademark registrations by officeResidents Non-residents Total
Outstanding notifications in WTO Central Registry
MFN duty free imports (%, 2007)
a Breakdowns by destination/origin refer to 2009. Breakdowns by services items refer to 2005.
World Trade OrganizationTrade Profiles 2011
69Download the data:www.wto.org/statistics
CO
UN
TRY
PR
OFI
LES
BASIC INDICATORS Population (thousands, 2010) 1 728 Rank in world trade, 2010 Exports ImportsGDP (million current US$, 2010) 807 Merchandise 198 192GDP (million current PPP US$, 2010) 2 420 excluding intra-EU trade 172 166Current account balance (million US$, 2010) 52 Commercial services 177 186Trade per capita (US$, 2008-2010) 370 excluding intra-EU trade 151 160Trade to GDP ratio (2008-2010) 79.1
2010 125
Exports of goods and services (volume, 2005=100) 126Imports of goods and services (volume, 2005=100) 112
TRADE POLICY
WTO accession 23 October 1996 Contribution to WTO budget (%, 2011) 0.015Trade Policy Review 14, 16 September 2010 Import duties collected GPA accession - in total tax revenue ...Tariffs and duty free imports to total imports ...
Tariff binding coverage (%) 13.7 Number of notifications to WTO and measures in force MFN tariffs Applied 2010 29
Simple average of import duties Goods RTAs - services EIAs notified to WTO 1 - 0All goods 102.6 14.0 Anti-dumping (30 June 2010) ...
Agricultural goods (AOA) 104.3 16.5 Countervailing duties (30 June 2010) ...Non-agricultural goods 57.6 13.7 Safeguards (22 October 2010) 0
0.0 0.00 - 0
29.6 Original panel / Appellate Body (AB) reports 0 - 0 10.6 Compliance panel / AB reports (Article 21.5 DSU) 0 - 0
Agricultural products 75.0 Agricultural products 36.7Fuels and mining products 18.8 Fuels and mining products 11.3Manufactures 3.1 Manufactures 50.3
1. Senegal 26.8 1. European Union (27) 32.02. Guinea 23.9 2. Côte d'Ivoire 14.33. European Union (27) 17.4 3. China 11.54. Guinea-Bissau 14.0 4. Brazil 5.75. India 4.4 5. Malaysia 4.5
COMMERCIAL SERVICES TRADE Value2010 2009 88 72
2010 0.00 0.00
Breakdown in economy's total exports By principal services item
41.7 47.8 35.8 14.8 22.5 37.5
INDUSTRIAL PROPERTY
Madrid Total ... 327
October 2011
Gambia
Annual percentage change2005-2010 2009 2010
Real GDP (2005=100) 5 6 55 2 42 4 7
Final bound
Non ad-valorem duties (% total tariff lines) Number of disputes (complainant - defendant) Requests for consultation
in agricultural goods (AOA) in non-agricultural goods
2010Share in world total exports Share in world total imports
Breakdown in economy's total imports By principal services item
Transportation Transportation
Direct residents Direct non-residents
Travel Travel Other commercial services Other commercial services
... 7 7 42 285
Patent grants by patent office, 2007 Trademark registrations by office, 2007Residents Non-residents Total
Outstanding notifications in WTO Central Registry
MFN duty free imports (%, 2009)
a Breakdowns by destination/origin refer to 2009.
Gambia
World Trade OrganizationTrade Profiles 2011
70 Download the data:www.wto.org/statistics
Georgia
BASIC INDICATORS Population (thousands, 2010) 4 453 Rank in world trade, 2010 Exports ImportsGDP (million current US$, 2010) 11 667 Merchandise 132 114GDP (million current PPP US$, 2010) 22 419 excluding intra-EU trade 107 89Current account balance (million US$, 2010) - 1 114 Commercial services 98 124Trade per capita (US$, 2008-2010) 2 213 excluding intra-EU trade 72 98Trade to GDP ratio (2008-2010) 83.2
2010 129
Exports of goods and services (volume, 2005=100) ...Imports of goods and services (volume, 2005=100) ...
TRADE POLICY
WTO accession 14 June 2000 Contribution to WTO budget (%, 2011) 0.025Trade Policy Review 8, 10 December 2009 Import duties collected (%, 2007-2009) GPA accession Observer in total tax revenue 1.1Tariffs and duty free imports to total imports 0.5
Tariff binding coverage (%) 100 Number of notifications to WTO and measures in force MFN tariffs Applied 2010 18
Simple average of import duties Goods RTAs - services EIAs notified to WTO 8 - 0All goods 7.4 1.3 Anti-dumping (30 June 2010) ...
Agricultural goods (AOA) 13.0 7.5 Countervailing duties (30 June 2010) ...Non-agricultural goods 6.5 0.3 Safeguards (22 October 2010) 0
0.4 0.50 - 0
52.4 Original panel / Appellate Body (AB) reports 0 - 0 98.4 Compliance panel / AB reports (Article 21.5 DSU) 0 - 0
Agricultural products 20.3 Agricultural products 18.9Fuels and mining products 20.6 Fuels and mining products 20.5Manufactures 53.4 Manufactures 60.2
1. European Union (27) 18.5 1. European Union (27) 28.22. Azerbaijan 15.4 2. Turkey 17.33. Turkey 13.6 3. Ukraine 10.94. United States 11.4 4. Azerbaijan 9.15. Armenia 10.1 5. China 6.5
COMMERCIAL SERVICES TRADE Value2010 2009
1 512 995
2010 0.04 0.03
Breakdown in economy's total exports By principal services item
46.1 55.7 43.5 20.0 10.5 24.3
INDUSTRIAL PROPERTY
Madrid Total 3 105 4 203
October 2011
Georgia
Annual percentage change2005-2010 2009 2010
Real GDP (2005=100) 5 -4 6... ... ...... ... ...
Final bound
Non ad-valorem duties (% total tariff lines) Number of disputes (complainant - defendant) Requests for consultation
in agricultural goods (AOA) in non-agricultural goods
2010Share in world total exports Share in world total imports
Breakdown in economy's total imports By principal services item
Transportation Transportation
Direct residents Direct non-residents
Travel Travel Other commercial services Other commercial services
147 146 293 407 691
Patent grants by patent office, 2009 Trademark registrations by office, 2009Residents Non-residents Total
Outstanding notifications in WTO Central Registry
MFN duty free imports (%, 2009)
World Trade OrganizationTrade Profiles 2011
71Download the data:www.wto.org/statistics
CO
UN
TRY
PR
OFI
LES
BASIC INDICATORS Population (thousands, 2010) 81 702 Rank in world trade, 2010 Exports ImportsGDP (million current US$, 2010) 3 309 669 Merchandise 3 3GDP (million current PPP US$, 2010) 3 071 282 excluding intra-EU trade - -Current account balance (million US$, 2010) 187 332 Commercial services 2 2Trade per capita (US$, 2008-2010) 35 679 excluding intra-EU trade - -Trade to GDP ratio (2008-2010) 85.3
2010 106
Exports of goods and services (volume, 2005=100) a 107Imports of goods and services (volume, 2005=100) a 110
TRADE POLICY
WTO accession 1 January 1995 Contribution to WTO budget (%, 2011) 8.856Trade Policy Review 6, 8 July 2011 Import duties collected GPA accession 1 January 1996 in total tax revenue ...Tariffs and duty free imports to total imports ...
Tariff binding coverage (%) 100 Number of notifications to WTO and measures in force MFN tariffs Applied 2010 18
Simple average of import duties Goods RTAs - services EIAs notified to WTO 31 - 10All goods 5.0 5.1 Anti-dumping (30 June 2010) 149
Agricultural goods (AOA) 12.3 12.8 Countervailing duties (30 June 2010) 8Non-agricultural goods 3.9 4.0 Safeguards (22 October 2010) 0
4.8 4.785 - 70
41.1 Original panel / Appellate Body (AB) reports 33 - 32 51.4 Compliance panel / AB reports (Article 21.5 DSU) 4 - 4
Agricultural products 6.4 Agricultural products 9.6Fuels and mining products 5.2 Fuels and mining products 16.4Manufactures 86.0 Manufactures 72.0
1. European Union (27) 60.3 1. European Union (27) 56.42. United States 6.8 2. China 9.43. China 5.6 3. United States 5.64. Switzerland 4.4 4. Switzerland 4.15. Russian Federation 2.7 5. Russian Federation 3.9
COMMERCIAL SERVICES TRADE Value2010 2009
232 394 259 737
2010 6.29 7.40
Breakdown in economy's total exports By principal services item
24.7 24.1 14.9 29.9 60.4 46.0
INDUSTRIAL PROPERTY
Madrid Total 4 725 54 542
October 2011
Germany
Annual percentage change2005-2010 2009 2010
Real GDP (2005=100) 1 -5 42 -14 ...2 -9 ...
Final bound
Non ad-valorem duties (% total tariff lines) Number of disputes (complainant - defendant) Requests for consultation
in agricultural goods (AOA) in non-agricultural goods
2010Share in world total exports Share in world total imports
Breakdown in economy's total imports By principal services item
Transportation Transportation
Direct residents Direct non-residents
Travel Travel Other commercial services Other commercial services
10 284 4 151 14 435 47 218 2 599
Patent grants by patent office, 2009 Trademark registrations by office, 2009Residents Non-residents Total
Outstanding notifications in WTO Central Registry
MFN duty free imports (%, 2009)
a Refers to 2009 and to the average annual percentage change for 2005-2009.
Germany
World Trade OrganizationTrade Profiles 2011
72 Download the data:www.wto.org/statistics
Ghana
BASIC INDICATORS Population (thousands, 2010) 24 392 Rank in world trade, 2010 Exports ImportsGDP (million current US$, 2010) 31 306 Merchandise 93 85GDP (million current PPP US$, 2010) 39 644 excluding intra-EU trade 69 61Current account balance (million US$, 2010) - 2 701 Commercial services 104 92Trade per capita (US$, 2008-2010) 834 excluding intra-EU trade 78 68Trade to GDP ratio (2008-2010) 69.3
2010 137
Exports of goods and services (volume, 2005=100) ...Imports of goods and services (volume, 2005=100) ...
TRADE POLICY
WTO accession 1 January 1995 Contribution to WTO budget (%, 2011) 0.046Trade Policy Review 28, 30 January 2008 Import duties collected (%, 2007-2009) GPA accession - in total tax revenue 24.9Tariffs and duty free imports to total imports 8.1
Tariff binding coverage (%) 14.4 Number of notifications to WTO and measures in force MFN tariffs Applied 2010 32
Simple average of import duties Goods RTAs - services EIAs notified to WTO 2 - 0All goods 92.5 13.0 Anti-dumping (30 June 2010) ...
Agricultural goods (AOA) 97.2 17.5 Countervailing duties (30 June 2010) ...Non-agricultural goods 36.1 12.3 Safeguards (22 October 2010) 0
0.0 0.00 - 0
1.1 Original panel / Appellate Body (AB) reports 0 - 0 25.0 Compliance panel / AB reports (Article 21.5 DSU) 0 - 0
Agricultural products 73.4 Agricultural products 16.4Fuels and mining products 9.3 Fuels and mining products 9.7Manufactures 3.3 Manufactures 72.3
1. South Africa 44.0 1. European Union (27) 27.82. European Union (27) 26.4 2. China 11.73. India 5.3 3. Nigeria 8.74. Malaysia 3.2 4. United States 7.75. United States 2.8 5. India 4.3
COMMERCIAL SERVICES TRADE Value2010 2009
1 344 2 444
2010 0.04 0.07
Breakdown in economy's total exports By principal services item
27.1 46.4 46.1 23.5 26.8 30.0
INDUSTRIAL PROPERTY
Madrid Total 677 677
October 2011
Ghana
Annual percentage change2005-2010 2009 2010
Real GDP (2005=100) 7 5 7... ... ...... ... ...
Final bound
Non ad-valorem duties (% total tariff lines) Number of disputes (complainant - defendant) Requests for consultation
in agricultural goods (AOA) in non-agricultural goods
2010Share in world total exports Share in world total imports
Breakdown in economy's total imports By principal services item
Transportation Transportation
Direct residents Direct non-residents
Travel Travel Other commercial services Other commercial services
... ... ... ... ...
Patent grants by patent office Trademark registrations by office, 2009Residents Non-residents Total
Outstanding notifications in WTO Central Registry
MFN duty free imports (%, 2009)
a Breakdowns by destination/origin refer to 2008.
World Trade OrganizationTrade Profiles 2011
73Download the data:www.wto.org/statistics
CO
UN
TRY
PR
OFI
LES
BASIC INDICATORS Population (thousands, 2010) 11 319 Rank in world trade, 2010 Exports ImportsGDP (million current US$, 2010) 304 865 Merchandise 66 41GDP (million current PPP US$, 2010) 318 675 excluding intra-EU trade - -Current account balance (million US$, 2010) - 31 862 Commercial services 26 38Trade per capita (US$, 2008-2010) 14 109 excluding intra-EU trade - -Trade to GDP ratio (2008-2010) 48.8
2010 104
Exports of goods and services (volume, 2005=100) a 93Imports of goods and services (volume, 2005=100) a 102
TRADE POLICY
WTO accession 1 January 1995 Contribution to WTO budget (%, 2011) 0.506Trade Policy Review 6, 8 July 2011 Import duties collected GPA accession 1 January 1996 in total tax revenue ...Tariffs and duty free imports to total imports ...
Tariff binding coverage (%) 100 Number of notifications to WTO and measures in force MFN tariffs Applied 2010 18
Simple average of import duties Goods RTAs - services EIAs notified to WTO 31 - 10All goods 5.0 5.1 Anti-dumping (30 June 2010) 149
Agricultural goods (AOA) 12.3 12.8 Countervailing duties (30 June 2010) 8Non-agricultural goods 3.9 4.0 Safeguards (22 October 2010) 0
4.8 4.785 - 72
41.1 Original panel / Appellate Body (AB) reports 33 - 32 51.4 Compliance panel / AB reports (Article 21.5 DSU) 4 - 4
Agricultural products 27.1 Agricultural products 13.4Fuels and mining products 20.7 Fuels and mining products 26.9Manufactures 49.3 Manufactures 59.6
1. European Union (27) 62.6 1. European Union (27) 51.32. Turkey 5.3 2. Russian Federation 9.83. United States 4.1 3. China 6.04. Albania 2.4 4. Korea, Republic of 3.85. Russian Federation 2.0 5. Libyan Arab Jamahiriya 2.9 Unspecified destinations 2.0 Unspecified origins 0.3
COMMERCIAL SERVICES TRADE Value2010 2009
36 695 19 257
2010 0.99 0.55
Breakdown in economy's total exports By principal services item
55.6 56.1 34.7 14.8 9.7 29.1
INDUSTRIAL PROPERTY
Madrid Total 2 458 2 458
October 2011
Greece
Annual percentage change2005-2010 2009 2010
Real GDP (2005=100) 1 -2 -4-2 -20 ...0 -19 ...
Final bound
Non ad-valorem duties (% total tariff lines) Number of disputes (complainant - defendant) Requests for consultation
in agricultural goods (AOA) in non-agricultural goods
2010Share in world total exports Share in world total imports
Breakdown in economy's total imports By principal services item
Transportation Transportation
Direct residents Direct non-residents
Travel Travel Other commercial services Other commercial services
424 18 442 ... ...
Patent grants by patent office, 2009 Trademark registrations by office, 2009Residents Non-residents Total
Outstanding notifications in WTO Central Registry
MFN duty free imports (%, 2009)
a Refers to 2009 and to the average annual percentage change for 2005-2009.
Greece
World Trade OrganizationTrade Profiles 2011
74 Download the data:www.wto.org/statistics
Grenada
BASIC INDICATORS Population (thousands, 2010) 104 Rank in world trade, 2010 Exports ImportsGDP (million current US$, 2010) 628 Merchandise 194 190GDP (million current PPP US$, 2010) 849 excluding intra-EU trade 168 164Current account balance (million US$, 2010) - 218 Commercial services 168 180Trade per capita (US$, 2008-2010) 5 468 excluding intra-EU trade 142 154Trade to GDP ratio (2008-2010) 88.9
2010 94
Exports of goods and services (volume, 2005=100) ...Imports of goods and services (volume, 2005=100) ...
TRADE POLICY
WTO accession 22 February 1996 Contribution to WTO budget (%, 2011) 0.015Trade Policy Review 5, 7 November 2007 Import duties collected GPA accession - in total tax revenue ...Tariffs and duty free imports to total imports ...
Tariff binding coverage (%) 100 Number of notifications to WTO and measures in force MFN tariffs Applied 2010 41
Simple average of import duties Goods RTAs - services EIAs notified to WTO 2 - 2All goods 56.7 10.4 Anti-dumping (30 June 2010) ...
Agricultural goods (AOA) 100.7 18.2 Countervailing duties (30 June 2010) ...Non-agricultural goods 50.0 9.2 Safeguards (22 October 2010) 0
0.0 0.10 - 0
18.0 Original panel / Appellate Body (AB) reports 0 - 0 8.9 Compliance panel / AB reports (Article 21.5 DSU) 0 - 0
Agricultural products 58.6 Agricultural products 25.8Fuels and mining products 0.3 Fuels and mining products 15.3Manufactures 41.1 Manufactures 58.8
1. Dominica 16.4 1. United States 30.92. United States 16.3 2. Trinidad and Tobago 24.93. European Union (27) 16.1 3. European Union (27) 10.74. Saint Lucia 11.2 4. Bolivarian Rep. of Venezuela 7.05. Barbados 9.4 5. Japan 3.6
COMMERCIAL SERVICES TRADE Value2010 2009 137 94
2010 0.00 0.00
Breakdown in economy's total exports By principal services item
7.2 49.5 70.4 10.5 22.3 40.0
INDUSTRIAL PROPERTY
Madrid Total ... ...
October 2011
Grenada
Annual percentage change2005-2010 2009 2010
Real GDP (2005=100) -1 -8 -1... ... ...... ... ...
Final bound
Non ad-valorem duties (% total tariff lines) Number of disputes (complainant - defendant) Requests for consultation
in agricultural goods (AOA) in non-agricultural goods
2010Share in world total exports Share in world total imports
Breakdown in economy's total imports By principal services item
Transportation Transportation
Direct residents Direct non-residents
Travel Travel Other commercial services Other commercial services
... ... ... ... ...
Patent grants by patent office Trademark registrations by officeResidents Non-residents Total
Outstanding notifications in WTO Central Registry
MFN duty free imports (%, 2009)
a Breakdowns by destination/origin refer to 2008.
World Trade OrganizationTrade Profiles 2011
75Download the data:www.wto.org/statistics
CO
UN
TRY
PR
OFI
LES
BASIC INDICATORS Population (thousands, 2010) 14 389 Rank in world trade, 2010 Exports ImportsGDP (million current US$, 2010) 41 190 Merchandise 91 78GDP (million current PPP US$, 2010) 68 204 excluding intra-EU trade 67 56Current account balance (million US$, 2010) - 826 Commercial services 90 93Trade per capita (US$, 2008-2010) 1 729 excluding intra-EU trade 64 69Trade to GDP ratio (2008-2010) 61.7
2010 119
Exports of goods and services (volume, 2005=100) 110Imports of goods and services (volume, 2005=100) 104
TRADE POLICY
WTO accession 21 July 1995 Contribution to WTO budget (%, 2011) 0.071Trade Policy Review 4, 6 February 2009 Import duties collected (%, 2007-2009) GPA accession - in total tax revenue 7.5Tariffs and duty free imports to total imports 2.2
Tariff binding coverage (%) 100 Number of notifications to WTO and measures in force MFN tariffs Applied 2010 17
Simple average of import duties Goods RTAs - services EIAs notified to WTO 4 - 3All goods 41.2 5.6 Anti-dumping (30 June 2010) ...
Agricultural goods (AOA) 51.0 9.9 Countervailing duties (30 June 2010) ...Non-agricultural goods 39.7 4.9 Safeguards (22 October 2010) 0
0.0 0.08 - 2
30.1 Original panel / Appellate Body (AB) reports 2 - 2 58.1 Compliance panel / AB reports (Article 21.5 DSU) 0 - 0
Agricultural products 46.3 Agricultural products 14.6Fuels and mining products 11.0 Fuels and mining products 19.3Manufactures 42.6 Manufactures 65.9
1. United States 38.8 1. United States 37.12. El Salvador 11.7 2. Mexico 11.23. Honduras 8.3 3. China 7.14. European Union (27) 5.7 4. European Union (27) 6.95. Mexico 5.3 5. El Salvador 4.9
COMMERCIAL SERVICES TRADE Value2010 2009
2 117 2 351
2010 0.06 0.07
Breakdown in economy's total exports By principal services item
14.8 49.2 65.1 33.3 20.1 17.5
INDUSTRIAL PROPERTY
Madrid Total ... 4 184
October 2011
Guatemala
Annual percentage change2005-2010 2009 2010
Real GDP (2005=100) 4 1 32 -6 31 -9 7
Final bound
Non ad-valorem duties (% total tariff lines) Number of disputes (complainant - defendant) Requests for consultation
in agricultural goods (AOA) in non-agricultural goods
2010Share in world total exports Share in world total imports
Breakdown in economy's total imports By principal services item
Transportation Transportation
Direct residents Direct non-residents
Travel Travel Other commercial services Other commercial services
1 190 191 ... 4 184
Patent grants by patent office, 2009 Trademark registrations by office, 2006Residents Non-residents Total
Outstanding notifications in WTO Central Registry
MFN duty free imports (%, 2009)
Guatemala
World Trade OrganizationTrade Profiles 2011
76 Download the data:www.wto.org/statistics
BASIC INDICATORS Population (thousands, 2010) 9 982 Rank in world trade, 2010 Exports ImportsGDP (million current US$, 2010) 4 511 Merchandise 140 161GDP (million current PPP US$, 2010) 10 806 excluding intra-EU trade 114 135Current account balance (million US$, 2010) - 327 Commercial services 181 158Trade per capita (US$, 2008-2010) 307 excluding intra-EU trade 155 132Trade to GDP ratio (2008-2010) 72.1
2010 111
Exports of goods and services (volume, 2005=100) 118Imports of goods and services (volume, 2005=100) 131
TRADE POLICY
WTO accession 25 October 1995 Contribution to WTO budget (%, 2011) 0.015Trade Policy Review 12, 14 october 2005 Import duties collected GPA accession - in total tax revenue ...Tariffs and duty free imports to total imports ...
Tariff binding coverage (%) 38.6 Number of notifications to WTO and measures in force MFN tariffs Applied 2010 39
Simple average of import duties Goods RTAs - services EIAs notified to WTO 2 - 0All goods 20.3 11.8 Anti-dumping (30 June 2010) ...
Agricultural goods (AOA) 39.7 14.1 Countervailing duties (30 June 2010) ...Non-agricultural goods 10.1 11.5 Safeguards (22 October 2010) 0
0.0 0.40 - 0
1.4 Original panel / Appellate Body (AB) reports 0 - 0 3.4 Compliance panel / AB reports (Article 21.5 DSU) 0 - 0
Agricultural products 5.4 Agricultural products 18.3Fuels and mining products 56.0 Fuels and mining products 29.8Manufactures 11.1 Manufactures 51.8
1. European Union (27) 49.6 1. European Union (27) 53.52. Switzerland 19.5 2. China 6.73. Russian Federation 10.6 3. United States 5.24. United States 6.7 4. Australia 3.95. Canada 4.0 5. Brazil 2.9
COMMERCIAL SERVICES TRADE Value2010 2009 61
381
2010 0.00 0.01
Breakdown in economy's total exports By principal services item
6.3 59.8 3.4 2.0
90.3 38.2
INDUSTRIAL PROPERTY
Madrid Total ... ...
October 2011
Guinea
Annual percentage change2005-2010 2009 2010
Real GDP (2005=100) 2 0 23 3 16 17 0
Final bound
Non ad-valorem duties (% total tariff lines) Number of disputes (complainant - defendant) Requests for consultation
in agricultural goods (AOA) in non-agricultural goods
2010Share in world total exports Share in world total imports
Breakdown in economy's total imports By principal services item
Transportation Transportation
Direct residents Direct non-residents
Travel Travel Other commercial services Other commercial services
... ... ... ... ...
Patent grants by patent office Trademark registrations by officeResidents Non-residents Total
Outstanding notifications in WTO Central Registry
MFN duty free imports (%, 2008)
a Breakdowns by destination/origin refer to 2008.
Guinea
World Trade OrganizationTrade Profiles 2011
77Download the data:www.wto.org/statistics
CO
UN
TRY
PR
OFI
LES
BASIC INDICATORS Population (thousands, 2010) 1 515 Rank in world trade, 2010 Exports ImportsGDP (million current US$, 2010) 879 Merchandise 177 195GDP (million current PPP US$, 2010) 1 784 excluding intra-EU trade 151 169Current account balance (million US$, 2008) - 29 Commercial services 186 185Trade per capita (US$, 2007-2009) 286 excluding intra-EU trade 160 159Trade to GDP ratio (2007-2009) 52.6
2010 116
Exports of goods and services (volume, 2005=100) ...Imports of goods and services (volume, 2005=100) ...
TRADE POLICY
WTO accession 31 May 1995 Contribution to WTO budget (%, 2011) 0.015Trade Policy Review ... Import duties collected GPA accession - in total tax revenue ...Tariffs and duty free imports to total imports ...
Tariff binding coverage (%) 97.7 Number of notifications to WTO and measures in force MFN tariffs Applied 2010 43
Simple average of import duties Goods RTAs - services EIAs notified to WTO 2 - 0All goods 48.7 11.9 Anti-dumping (30 June 2010) ...
Agricultural goods (AOA) 40.1 14.5 Countervailing duties (30 June 2010) ...Non-agricultural goods 50.0 11.5 Safeguards (22 October 2010) 0
0.0 0.00 - 0
0.0 Original panel / Appellate Body (AB) reports 0 - 0 1.4 Compliance panel / AB reports (Article 21.5 DSU) 0 - 0
Agricultural products ... Agricultural products ...Fuels and mining products ... Fuels and mining products ...Manufactures ... Manufactures ...
1. India 86.6 1. European Union (27) 46.92. Singapore 12.1 2. Senegal 40.93. European Union (27) 0.8 3. Thailand 7.04. Panama 0.2 4. China 2.45. Korea, Dem. People's Rep. of 0.2 5. Gambia 1.6
COMMERCIAL SERVICES TRADE Value2009 2008 28 68
2009 a 0.00 0.00
Breakdown in economy's total exports By principal services item
0.2 37.7 87.3 53.5 12.6 8.8
INDUSTRIAL PROPERTY
Madrid Total ... 2
October 2011
Guinea-Bissau
Annual percentage change2005-2010 2009 2010
Real GDP (2005=100) 3 3 3... ... ...... ... ...
Final bound
Non ad-valorem duties (% total tariff lines) Number of disputes (complainant - defendant) Requests for consultation
in agricultural goods (AOA) in non-agricultural goods
2009 aShare in world total exports Share in world total imports
Breakdown in economy's total imports By principal services item
Transportation Transportation
Direct residents Direct non-residents
Travel Travel Other commercial services Other commercial services
... ... ... 2 ...
Patent grants by patent office Trademark registrations by office, 2007Residents Non-residents Total
Outstanding notifications in WTO Central Registry
MFN duty free imports (%, 2008)
a Breakdowns by destination/origin refer to 2005. Breakdowns by services items refer to 2008.
Guinea-Bissau
World Trade OrganizationTrade Profiles 2011
78 Download the data:www.wto.org/statistics
Guyana
BASIC INDICATORS Population (thousands, 2010) 754 Rank in world trade, 2010 Exports ImportsGDP (million current US$, 2010) 2 222 Merchandise 147 160GDP (million current PPP US$, 2010) 2 333 excluding intra-EU trade 121 134Current account balance (million US$, 2008) - 192 Commercial services 160 161Trade per capita (US$, 2007-2009) 3 043 excluding intra-EU trade 134 135Trade to GDP ratio (2007-2009) 120.6
2010 111
Exports of goods and services (volume, 2005=100) ...Imports of goods and services (volume, 2005=100) ...
TRADE POLICY
WTO accession 1 January 1995 Contribution to WTO budget (%, 2011) 0.015Trade Policy Review 8, 10 July 2009 Import duties collected GPA accession - in total tax revenue ...Tariffs and duty free imports to total imports ...
Tariff binding coverage (%) 100 Number of notifications to WTO and measures in force MFN tariffs Applied 2010 21
Simple average of import duties Goods RTAs - services EIAs notified to WTO 3 - 2All goods 56.6 10.9 Anti-dumping (30 June 2010) ...
Agricultural goods (AOA) 99.6 21.7 Countervailing duties (30 June 2010) ...Non-agricultural goods 50.0 9.3 Safeguards (22 October 2010) 0
0.0 0.00 - 0
37.5 Original panel / Appellate Body (AB) reports 0 - 0 20.6 Compliance panel / AB reports (Article 21.5 DSU) 0 - 0
Agricultural products 51.9 Agricultural products 15.8Fuels and mining products 20.2 Fuels and mining products 30.9Manufactures 6.2 Manufactures 53.2
1. European Union (27) 25.0 1. United States 28.12. United States 21.8 2. Trinidad and Tobago 17.13. Canada 18.5 3. Netherlands Antilles 8.94. Ukraine 5.7 4. Suriname 8.75. Jamaica 5.0 5. European Union (27) 8.1
COMMERCIAL SERVICES TRADE Value2009 2008 171 270
2009 0.01 0.01
Breakdown in economy's total exports By principal services item
6.1 29.8 20.5 19.4 73.3 50.7
INDUSTRIAL PROPERTY
Madrid Total ... ...
October 2011
Guyana
Annual percentage change2005-2010 2009 2010
Real GDP (2005=100) 2 3 4... ... ...... ... ...
Final bound
Non ad-valorem duties (% total tariff lines) Number of disputes (complainant - defendant) Requests for consultation
in agricultural goods (AOA) in non-agricultural goods
2009Share in world total exports Share in world total imports
Breakdown in economy's total imports By principal services item
Transportation Transportation
Direct residents Direct non-residents
Travel Travel Other commercial services Other commercial services
... ... ... ... ...
Patent grants by patent office Trademark registrations by officeResidents Non-residents Total
Outstanding notifications in WTO Central Registry
MFN duty free imports (%, 2008)
World Trade OrganizationTrade Profiles 2011
79Download the data:www.wto.org/statistics
CO
UN
TRY
PR
OFI
LES
BASIC INDICATORS Population (thousands, 2010) 9 993 Rank in world trade, 2010 Exports ImportsGDP (million current US$, 2010) 6 710 Merchandise 157 135GDP (million current PPP US$, 2010) 11 017 excluding intra-EU trade 131 109Current account balance (million US$, 2009) - 232 Commercial services 159 116Trade per capita (US$, 2008-2010) 404 excluding intra-EU trade 133 90Trade to GDP ratio (2008-2010) 61.0
2010 104
Exports of goods and services (volume, 2005=100) a 130Imports of goods and services (volume, 2005=100) a 114
TRADE POLICY
WTO accession 30 January 1996 Contribution to WTO budget (%, 2011) 0.015Trade Policy Review 4, 6 November 2003 Import duties collected GPA accession - in total tax revenue ...Tariffs and duty free imports to total imports ...
Tariff binding coverage (%) 89.3 Number of notifications to WTO and measures in force MFN tariffs Applied 2010 27
Simple average of import duties Goods RTAs - services EIAs notified to WTO 1 - 1All goods 18.7 4.7 Anti-dumping (30 June 2010) ...
Agricultural goods (AOA) 21.1 8.0 Countervailing duties (30 June 2010) ...Non-agricultural goods 18.2 4.2 Safeguards (22 October 2010) 0
9.1 0.30 - 0
... Original panel / Appellate Body (AB) reports 0 - 0
2010Share in world total exports Share in world total imports
Breakdown in economy's total imports By principal services item
Transportation Transportation
Direct residents Direct non-residents
Travel Travel Other commercial services Other commercial services
... 7 7 82 812
Patent grants by patent office, 1999 Trademark registrations by office, 1999Residents Non-residents Total
Outstanding notifications in WTO Central Registry
MFN duty free imports
a Refers to 2009 and to the average annual percentage change for 2005-2009.
Haiti
World Trade OrganizationTrade Profiles 2011
80 Download the data:www.wto.org/statistics
Honduras
BASIC INDICATORS Population (thousands, 2010) 7 601 Rank in world trade, 2010 Exports ImportsGDP (million current US$, 2010) 15 400 Merchandise 100 95GDP (million current PPP US$, 2010) 29 568 excluding intra-EU trade 76 71Current account balance (million US$, 2009) - 449 Commercial services 114 115Trade per capita (US$, 2008-2010) 2 276 excluding intra-EU trade 88 89Trade to GDP ratio (2008-2010) 116.5
2010 119
Exports of goods and services (volume, 2005=100) 105Imports of goods and services (volume, 2005=100) 102
TRADE POLICY
WTO accession 1 January 1995 Contribution to WTO budget (%, 2011) 0.052Trade Policy Review 20, 22 September 2010 Import duties collected (%, 2007-2009) GPA accession - in total tax revenue 6.4Tariffs and duty free imports to total imports 1.4
Tariff binding coverage (%) 100 Number of notifications to WTO and measures in force MFN tariffs Applied 2009 14
Simple average of import duties Goods RTAs - services EIAs notified to WTO 5 - 4All goods 31.8 5.6 Anti-dumping (30 June 2010) ...
Agricultural goods (AOA) 32.4 10.5 Countervailing duties (30 June 2010) ...Non-agricultural goods 31.7 4.8 Safeguards (22 October 2010) 0
0.0 0.17 - 0
30.0 Original panel / Appellate Body (AB) reports 2 - 0 61.3 Compliance panel / AB reports (Article 21.5 DSU) 0 - 0
Agricultural products 27.7 Agricultural products 14.2Fuels and mining products 5.3 Fuels and mining products 18.1Manufactures 61.4 Manufactures 64.5
1. United States 47.7 1. United States 36.02. European Union (27) 19.1 2. Guatemala 10.63. El Salvador 7.0 3. Mexico 6.64. Guatemala 6.4 4. El Salvador 6.15. Nicaragua 3.9 5. European Union (27) 5.8
COMMERCIAL SERVICES TRADE Value2010 2009
1 001 1 299
2010 0.03 0.04
Breakdown in economy's total exports By principal services item
3.9 44.6 64.4 24.7 31.6 30.7
INDUSTRIAL PROPERTY
Madrid Total ... 5 266
October 2011
Honduras
Annual percentage change2005-2010 2009 2010
Real GDP (2005=100) 3 -2 31 -13 120 -26 13
Final bound
Non ad-valorem duties (% total tariff lines) Number of disputes (complainant - defendant) Requests for consultation
in agricultural goods (AOA) in non-agricultural goods
2010Share in world total exports Share in world total imports
Breakdown in economy's total imports By principal services item
Transportation Transportation
Direct residents Direct non-residents
Travel Travel Other commercial services Other commercial services
6 41 47 1 119 4 147
Patent grants by patent office, 2002 Trademark registrations by office, 2007Residents Non-residents Total
Outstanding notifications in WTO Central Registry
MFN duty free imports (%, 2009)
a Breakdowns by destination/origin refer to 2009.
World Trade OrganizationTrade Profiles 2011
81Download the data:www.wto.org/statistics
CO
UN
TRY
PR
OFI
LES
BASIC INDICATORS Population (thousands, 2010) 7 068 Rank in world trade, 2010 Exports ImportsGDP (million current US$, 2010) 224 458 Merchandise 11 9GDP (million current PPP US$, 2010) 326 232 excluding intra-EU trade 6 5Current account balance (million US$, 2010) 13 936 Commercial services 11 19Trade per capita (US$, 2008-2010) 127 402 excluding intra-EU trade 7 12Trade to GDP ratio (2008-2010) 413.1
2010 121
Exports of goods and services (volume, 2005=100) 127Imports of goods and services (volume, 2005=100) 130
TRADE POLICY
WTO accession 1 January 1995 Contribution to WTO budget (%, 2011) 2.630Trade Policy Review 1, 3 December 2010 Import duties collected (%, 2006-2008) GPA accession 19 June 1997 in total tax revenue 0.6Tariffs and duty free imports to total imports 0.0
Tariff binding coverage (%) 45.6 Number of notifications to WTO and measures in force MFN tariffs Applied 2010 4
Simple average of import duties Goods RTAs - services EIAs notified to WTO 2 - 2All goods 0.0 0.0 Anti-dumping (30 June 2010) ...
Agricultural goods (AOA) 0.0 0.0 Countervailing duties (30 June 2010) ...Non-agricultural goods 0.0 0.0 Safeguards (22 October 2010) 0
0.0 0.01 - 0
100.0 Original panel / Appellate Body (AB) reports 0 - 0 100.0 Compliance panel / AB reports (Article 21.5 DSU) 0 - 0
Agricultural products 2.0 Agricultural products 4.7Fuels and mining products 2.1 Fuels and mining products 5.2Manufactures 93.1 Manufactures 88.1
1. China 52.4 1. China 44.72. European Union (27) 11.4 2. Japan 9.33. United States 10.7 3. European Union (27) 7.34. Japan 4.1 4. Singapore 7.05. India 2.5 5. Taipei, Chinese 6.6
COMMERCIAL SERVICES TRADE Value2010 2009
106 428 50 868
2010 2.88 1.45
Breakdown in economy's total exports By principal services item
28.4 28.6 20.8 34.3 50.7 37.0
INDUSTRIAL PROPERTY
Madrid Total ... 22 500
October 2011
Hong Kong, China
Annual percentage change2005-2010 2009 2010
Real GDP (2005=100) 4 -3 75 -10 175 -9 17
Final bound
Non ad-valorem duties (% total tariff lines) Number of disputes (complainant - defendant) Requests for consultation
in agricultural goods (AOA) in non-agricultural goods
2010Share in world total exports Share in world total imports
Breakdown in economy's total imports By principal services item
Transportation Transportation
Direct residents Direct non-residents
Travel Travel Other commercial services Other commercial services
86 5 564 5 650 7 523 14 977
Patent grants by patent office, 2009 Trademark registrations by office, 2009Residents Non-residents Total
Outstanding notifications in WTO Central Registry
MFN duty free imports (%, 2009)
Hong Kong, China
World Trade OrganizationTrade Profiles 2011
82 Download the data:www.wto.org/statistics
Hungary
BASIC INDICATORS Population (thousands, 2010) 10 009 Rank in world trade, 2010 Exports ImportsGDP (million current US$, 2010) 130 419 Merchandise 36 33GDP (million current PPP US$, 2010) 203 251 excluding intra-EU trade - -Current account balance (million US$, 2010) 2 685 Commercial services 38 43Trade per capita (US$, 2008-2010) 21 924 excluding intra-EU trade - -Trade to GDP ratio (2008-2010) 159.0
2010 97
Exports of goods and services (volume, 2005=100) a 145Imports of goods and services (volume, 2005=100) a 136
TRADE POLICY
WTO accession 1 January 1995 Contribution to WTO budget (%, 2011) 0.647Trade Policy Review 6, 8 July 2011 Import duties collected GPA accession 1 May 2004 in total tax revenue ...Tariffs and duty free imports to total imports ...
Tariff binding coverage (%) 100 Number of notifications to WTO and measures in force MFN tariffs Applied 2010 18
Simple average of import duties Goods RTAs - services EIAs notified to WTO 31 - 10All goods 5.0 5.1 Anti-dumping (30 June 2010) 149
Agricultural goods (AOA) 12.3 12.8 Countervailing duties (30 June 2010) 8Non-agricultural goods 3.9 4.0 Safeguards (22 October 2010) 0
4.8 4.790 - 72
41.1 Original panel / Appellate Body (AB) reports 33 - 32 51.4 Compliance panel / AB reports (Article 21.5 DSU) 4 - 4
Agricultural products 8.6 Agricultural products 6.6Fuels and mining products 4.6 Fuels and mining products 13.8Manufactures 86.6 Manufactures 79.4
1. European Union (27) 77.4 1. European Union (27) 67.82. Russian Federation 3.6 2. Russian Federation 7.83. United States 2.0 3. China 7.14. Ukraine 2.0 4. Korea, Republic of 3.35. Turkey 1.7 5. Japan 2.2
COMMERCIAL SERVICES TRADE Value2010 2009
18 886 15 638
2010 0.51 0.45
Breakdown in economy's total exports By principal services item
19.6 20.0 28.3 18.9 52.1 61.1
INDUSTRIAL PROPERTY
Madrid Total 2 815 5 461
October 2011
Hungary
Annual percentage change2005-2010 2009 2010
Real GDP (2005=100) -1 -7 113 ... ...11 ... ...
Final bound
Non ad-valorem duties (% total tariff lines) Number of disputes (complainant - defendant) Requests for consultation
in agricultural goods (AOA) in non-agricultural goods
2010Share in world total exports Share in world total imports
Breakdown in economy's total imports By principal services item
Transportation Transportation
Direct residents Direct non-residents
Travel Travel Other commercial services Other commercial services
86 329 415 2 084 562
Patent grants by patent office, 2009 Trademark registrations by office, 2009Residents Non-residents Total
Outstanding notifications in WTO Central Registry
MFN duty free imports (%, 2009)
a Refers to 2008 and to the average annual percentage change for 2005-2008.
World Trade OrganizationTrade Profiles 2011
83Download the data:www.wto.org/statistics
CO
UN
TRY
PR
OFI
LES
BASIC INDICATORS Population (thousands, 2010) 317 Rank in world trade, 2010 Exports ImportsGDP (million current US$, 2010) 12 594 Merchandise 108 127GDP (million current PPP US$, 2010) 11 093 excluding intra-EU trade 84 101Current account balance (million US$, 2010) 15 014 Commercial services 84 98Trade per capita (US$, 2005-2007) 45 878 excluding intra-EU trade 58 72Trade to GDP ratio (2005-2007) 78.4
2010 101
Exports of goods and services (volume, 2005=100) a 129Imports of goods and services (volume, 2005=100) a 68
TRADE POLICY
WTO accession 1 January 1995 Contribution to WTO budget (%, 2011) 0.047Trade Policy Review 7, 9 June 2006 Import duties collected (%, 2005-2007) GPA accession 28 April 2001 in total tax revenue 1.0Tariffs and duty free imports to total imports 0.7
Tariff binding coverage (%) 95.0 Number of notifications to WTO and measures in force MFN tariffs Applied 2010 25
Simple average of import duties Goods RTAs - services EIAs notified to WTO 22 - 7All goods 23.5 5.6 Anti-dumping (30 June 2010) ...
Agricultural goods (AOA) 109.0 26.8 Countervailing duties (30 June 2010) ...Non-agricultural goods 9.6 2.3 Safeguards (22 October 2010) 0
3.1 2.40 - 0
68.3 Original panel / Appellate Body (AB) reports 0 - 0 81.9 Compliance panel / AB reports (Article 21.5 DSU) 0 - 0
Agricultural products 41.9 Agricultural products 12.2Fuels and mining products 43.0 Fuels and mining products 29.0Manufactures 14.6 Manufactures 58.8
1. European Union (27) 77.5 1. European Union (27) 51.92. United States 4.6 2. Norway 9.03. Norway 4.2 3. Brazil 8.74. Japan 2.5 4. United States 8.25. Russian Federation 2.1 5. China 6.0
COMMERCIAL SERVICES TRADE Value2010 2009
2 532 2 073
2010 0.07 0.06
Breakdown in economy's total exports By principal services item
47.5 35.7 22.6 26.3 29.9 38.0
INDUSTRIAL PROPERTY
Madrid Total 2 385 3 300
October 2011
Iceland
Annual percentage change2005-2010 2009 2010
Real GDP (2005=100) 0 -7 -37 7 ...
-9 -24 ...
Final bound
Non ad-valorem duties (% total tariff lines) Number of disputes (complainant - defendant) Requests for consultation
in agricultural goods (AOA) in non-agricultural goods
2010Share in world total exports Share in world total imports
Breakdown in economy's total imports By principal services item
Transportation Transportation
Direct residents Direct non-residents
Travel Travel Other commercial services Other commercial services
4 75 79 387 528
Patent grants by patent office, 2009 Trademark registrations by office, 2009Residents Non-residents Total
Outstanding notifications in WTO Central Registry
MFN duty free imports (%, 2009)
a Refers to 2009 and to the average annual percentage change for 2005-2009.
Iceland
World Trade OrganizationTrade Profiles 2011
84 Download the data:www.wto.org/statistics
India
BASIC INDICATORS Population (thousands, 2010) 1 170 938 Rank in world trade, 2010 Exports ImportsGDP (million current US$, 2010) 1 729 010 Merchandise 20 13GDP (million current PPP US$, 2010) 4 198 609 excluding intra-EU trade 14 8Current account balance (million US$, 2010) - 51 781 Commercial services 7 7Trade per capita (US$, 2008-2010) 595 excluding intra-EU trade 5 5Trade to GDP ratio (2008-2010) 47.7
2010 151
Exports of goods and services (volume, 2005=100) 149Imports of goods and services (volume, 2005=100) 174
TRADE POLICY
WTO accession 1 January 1995 Contribution to WTO budget (%, 2011) 1.510Trade Policy Review 14, 16 September 2011 Import duties collected (%, 2007-2009) GPA accession Observer in total tax revenue 16.5Tariffs and duty free imports to total imports 7.0
Tariff binding coverage (%) 73.8 Number of notifications to WTO and measures in force MFN tariffs Applied 2009 23
Simple average of import duties Goods RTAs - services EIAs notified to WTO 14 - 3All goods 48.7 13.0 Anti-dumping (30 June 2010) 205
Agricultural goods (AOA) 113.1 31.8 Countervailing duties (30 June 2010) ...Non-agricultural goods 34.6 10.1 Safeguards (22 October 2010) 2
5.3 5.219 - 20
19.3 Original panel / Appellate Body (AB) reports 9 - 6 37.3 Compliance panel / AB reports (Article 21.5 DSU) 1 - 0
Agricultural products 10.7 Agricultural products 5.4Fuels and mining products 25.4 Fuels and mining products 38.8Manufactures 63.9 Manufactures 44.5
1. European Union (27) 20.5 1. European Union (27) 14.42. United Arab Emirates 14.4 2. China 11.53. United States 10.8 3. United Arab Emirates 7.44. China 5.9 4. United States 6.05. Hong Kong, China 4.0 5. Saudi Arabia, Kingdom of 5.4
COMMERCIAL SERVICES TRADE Value2010 2009
123 277 116 140
2010 3.34 3.31
Breakdown in economy's total exports By principal services item
10.7 40.0 11.5 9.2 77.8 50.9
INDUSTRIAL PROPERTY
Madrid Total ... 102 257
October 2011
India
Annual percentage change2005-2010 2009 2010
Real GDP (2005=100) 9 9 108 -7 4
12 -7 14
Final bound
Non ad-valorem duties (% total tariff lines) Number of disputes (complainant - defendant) Requests for consultation
in agricultural goods (AOA) in non-agricultural goods
2010Share in world total exports Share in world total imports
Breakdown in economy's total imports By principal services item
Transportation Transportation
Direct residents Direct non-residents
Travel Travel Other commercial services Other commercial services
... ... 18 230 ... ...
Patent grants by patent office, 2008 Trademark registrations by office, 2008Residents Non-residents Total
Outstanding notifications in WTO Central Registry
MFN duty free imports (%, 2009)
a Breakdowns by destination/origin refer to 2009.
World Trade OrganizationTrade Profiles 2011
85Download the data:www.wto.org/statistics
CO
UN
TRY
PR
OFI
LES
BASIC INDICATORS Population (thousands, 2010) 239 871 Rank in world trade, 2010 Exports ImportsGDP (million current US$, 2010) 706 558 Merchandise 27 29GDP (million current PPP US$, 2010) 1 029 789 excluding intra-EU trade 20 20Current account balance (million US$, 2010) 6 295 Commercial services 40 32Trade per capita (US$, 2008-2010) 1 222 excluding intra-EU trade 23 20Trade to GDP ratio (2008-2010) 49.6
2010 132
Exports of goods and services (volume, 2005=100) 135Imports of goods and services (volume, 2005=100) 130
TRADE POLICY
WTO accession 1 January 1995 Contribution to WTO budget (%, 2011) 0.758Trade Policy Review 27, 29 June 2007 Import duties collected (%, 2002-2004) GPA accession - in total tax revenue 4.5Tariffs and duty free imports to total imports 2.1
Tariff binding coverage (%) 95.8 Number of notifications to WTO and measures in force MFN tariffs Applied 2010 21
Simple average of import duties Goods RTAs - services EIAs notified to WTO 8 - 4All goods 37.1 6.8 Anti-dumping (30 June 2010) 16
Agricultural goods (AOA) 47.1 8.4 Countervailing duties (30 June 2010) ...Non-agricultural goods 35.5 6.6 Safeguards (22 October 2010) 3
0.0 0.25 - 4
65.8 Original panel / Appellate Body (AB) reports 2 - 4 77.5 Compliance panel / AB reports (Article 21.5 DSU) 1 - 0
Agricultural products 22.8 Agricultural products 11.9Fuels and mining products 39.4 Fuels and mining products 24.5Manufactures 37.0 Manufactures 63.6
1. Japan 16.3 1. China 15.02. European Union (27) 10.9 2. Singapore 14.93. China 9.9 3. Japan 12.54. United States 9.1 4. European Union (27) 7.35. Singapore 8.7 5. United States 6.9
COMMERCIAL SERVICES TRADE Value2010 2009
16 234 25 790
2010 0.44 0.73
Breakdown in economy's total exports By principal services item
16.4 35.4 43.0 24.9 40.6 39.7
INDUSTRIAL PROPERTY
Madrid Total ... 24 677
October 2011
Indonesia
Annual percentage change2005-2010 2009 2010
Real GDP (2005=100) 6 5 66 -10 155 -15 17
Final bound
Non ad-valorem duties (% total tariff lines) Number of disputes (complainant - defendant) Requests for consultation
in agricultural goods (AOA) in non-agricultural goods
Agricultural products 5.0 Agricultural products 14.5Fuels and mining products 82.4 Fuels and mining products 11.9Manufactures 12.6 Manufactures 58.8
1. Japan 23.9 1. European Union (27) 9.02. Taipei, Chinese 22.5 2. China 6.03. European Union (27) 19.8 3. India 3.74. United Arab Emirates 2.9 4. Japan 2.65. Iraq 2.9 5. Malaysia 0.8 Unspecified destinations 0.3 Unspecified origins 74.8
COMMERCIAL SERVICES TRADE Value2010 2009
7 531 19 438
2010 b 0.20 0.55
Breakdown in economy's total exports By principal services item
51.8 29.8 26.9 52.4 21.2 17.8
INDUSTRIAL PROPERTY
Madrid Total 2 832 2 832
October 2011
Iran, Islamic Rep. of
Annual percentage change2005-2009 2008 2009
Real GDP (2005=100) 4 2 24 ... ...6 ... ...
Final bound
Non ad-valorem duties (% total tariff lines) Number of disputes (complainant - defendant) Requests for consultation
in agricultural goods (AOA) in non-agricultural goods
2010 bShare in world total exports Share in world total imports
Breakdown in economy's total imports By principal services item
Transportation Transportation
Direct residents Direct non-residents
Travel Travel Other commercial services Other commercial services
4 074 439 4 513 ... ...
Patent grants by patent office, 2006 Trademark registrations by office, 2009Residents Non-residents Total
Outstanding notifications in WTO Central Registry
MFN duty free imports (%, 2006)
a Refers to 2007 and to the average annual percentage change for 2005-2007. b Breakdowns by destination/origin refer to 2006. Breakdowns by services items refer to 2009.
World Trade OrganizationTrade Profiles 2011
87Download the data:www.wto.org/statistics
CO
UN
TRY
PR
OFI
LES
BASIC INDICATORS Population (thousands, 2010) 32 031 Rank in world trade, 2010 Exports ImportsGDP (million current US$, 2010) 82 150 Merchandise 51 51GDP (million current PPP US$, 2010) 113 238 excluding intra-EU trade 36 33Current account balance (million US$, 2008) 27 133 Commercial services 113 66Trade per capita (US$, 2005-2007) 1 944 excluding intra-EU trade 87 47Trade to GDP ratio (2005-2007) 124.4
2010 124
Exports of goods and services (volume, 2005=100) ...Imports of goods and services (volume, 2005=100) ...
TRADE POLICY
WTO accession Observer Contribution to WTO budget -Trade Policy Review - Import duties collected GPA accession - in total tax revenue ...Tariffs and duty free imports to total imports ...
Tariff binding coverage (%) - Number of notifications to WTO and measures in force MFN tariffs Applied -
Simple average of import duties Goods RTAs - services EIAs notified to WTO 2 - 0All goods - ... Anti-dumping -
2007Share in world total exports Share in world total imports
Breakdown in economy's total imports By principal services item
Transportation Transportation
Direct residents Direct non-residents
Travel Travel Other commercial services Other commercial services
28 18 46 ... ...
Patent grants by patent office, 1996 Trademark registrations by officeResidents Non-residents Total
Outstanding notifications in WTO Central Registry
MFN duty free imports
a Breakdowns by destination/origin refer to 2009.
Iraq
World Trade OrganizationTrade Profiles 2011
88 Download the data:www.wto.org/statistics
Ireland
BASIC INDICATORS Population (thousands, 2010) 4 481 Rank in world trade, 2010 Exports ImportsGDP (million current US$, 2010) 203 892 Merchandise 32 45GDP (million current PPP US$, 2010) 178 036 excluding intra-EU trade - -Current account balance (million US$, 2010) - 1 474 Commercial services 13 8Trade per capita (US$, 2008-2010) 86 470 excluding intra-EU trade - -Trade to GDP ratio (2008-2010) 167.7
2010 98
Exports of goods and services (volume, 2005=100) a 108Imports of goods and services (volume, 2005=100) a 100
TRADE POLICY
WTO accession 1 January 1995 Contribution to WTO budget (%, 2011) 1.188Trade Policy Review 6, 8 July 2011 Import duties collected GPA accession 1 January 1996 in total tax revenue ...Tariffs and duty free imports to total imports ...
Tariff binding coverage (%) 100 Number of notifications to WTO and measures in force MFN tariffs Applied 2010 18
Simple average of import duties Goods RTAs - services EIAs notified to WTO 31 - 10All goods 5.0 5.1 Anti-dumping (30 June 2010) 149
Agricultural goods (AOA) 12.3 12.8 Countervailing duties (30 June 2010) 8Non-agricultural goods 3.9 4.0 Safeguards (22 October 2010) 0
4.8 4.785 - 73
41.1 Original panel / Appellate Body (AB) reports 33 - 33 51.4 Compliance panel / AB reports (Article 21.5 DSU) 4 - 4
Agricultural products 9.6 Agricultural products 13.1Fuels and mining products 2.2 Fuels and mining products 13.8Manufactures 84.4 Manufactures 66.2
1. European Union (27) 57.8 1. European Union (27) 60.02. United States 23.3 2. United States 14.13. Switzerland 4.0 3. China 5.54. Japan 2.0 4. Norway 2.85. China 1.9 5. Switzerland 1.9 Unspecified destinations 0.1 Unspecified origins 1.9
COMMERCIAL SERVICES TRADE Value2010 2009
96 629 108 337
2010 2.62 3.09
Breakdown in economy's total exports By principal services item
4.7 2.0 4.2 7.1
91.1 90.9
INDUSTRIAL PROPERTY
Madrid Total 1 499 3 434
October 2011
Ireland
Annual percentage change2005-2010 2009 2010
Real GDP (2005=100) 0 -8 -12 -4 ...0 -10 ...
Final bound
Non ad-valorem duties (% total tariff lines) Number of disputes (complainant - defendant) Requests for consultation
in agricultural goods (AOA) in non-agricultural goods
2010Share in world total exports Share in world total imports
Breakdown in economy's total imports By principal services item
Transportation Transportation
Direct residents Direct non-residents
Travel Travel Other commercial services Other commercial services
251 77 328 1 119 816
Patent grants by patent office, 2009 Trademark registrations by office, 2009Residents Non-residents Total
Outstanding notifications in WTO Central Registry
MFN duty free imports (%, 2009)
a Refers to 2009 and to the average annual percentage change for 2005-2009.
World Trade OrganizationTrade Profiles 2011
89Download the data:www.wto.org/statistics
CO
UN
TRY
PR
OFI
LES
BASIC INDICATORS Population (thousands, 2010) 7 625 Rank in world trade, 2010 Exports ImportsGDP (million current US$, 2010) 217 333 Merchandise 48 43GDP (million current PPP US$, 2010) 217 653 excluding intra-EU trade 33 26Current account balance (million US$, 2010) 6 708 Commercial services 33 41Trade per capita (US$, 2008-2010) 20 179 excluding intra-EU trade 20 26Trade to GDP ratio (2008-2010) 73.6
2010 122
Exports of goods and services (volume, 2005=100) 122Imports of goods and services (volume, 2005=100) 114
TRADE POLICY
WTO accession 21 April 1995 Contribution to WTO budget (%, 2011) 0.453Trade Policy Review 1, 3 February 2006 Import duties collected (%, 2007-2009) GPA accession 1 January 1996 in total tax revenue 1.2Tariffs and duty free imports to total imports 0.8
Tariff binding coverage (%) 75.1 Number of notifications to WTO and measures in force MFN tariffs Applied 2009 18
Simple average of import duties Goods RTAs - services EIAs notified to WTO 7 - 0All goods 22.1 6.4 Anti-dumping (30 June 2010) 4
Agricultural goods (AOA) 73.3 16.3 Countervailing duties (30 June 2010) ...Non-agricultural goods 11.4 4.9 Safeguards (22 October 2010) 0
5.9 4.90 - 0
57.2 Original panel / Appellate Body (AB) reports 0 - 0 73.7 Compliance panel / AB reports (Article 21.5 DSU) 0 - 0
Agricultural products 3.9 Agricultural products 8.3Fuels and mining products 2.3 Fuels and mining products 18.7Manufactures 93.0 Manufactures 69.2
1. United States 31.7 1. European Union (27) 34.52. European Union (27) 26.3 2. United States 11.33. Hong Kong, China 6.7 3. China 8.04. India 4.9 4. Switzerland 5.45. China 3.5 5. India 3.1 Unspecified destinations 3.7 Unspecified origins 18.1
COMMERCIAL SERVICES TRADE Value2010 2009
24 650 17 774
2010 0.67 0.51
Breakdown in economy's total exports By principal services item
17.1 32.4 19.3 19.2 63.5 48.4
INDUSTRIAL PROPERTY
Madrid Total ... 9 529
October 2011
Israel
Annual percentage change2005-2010 2009 2010
Real GDP (2005=100) 4 1 54 -12 133 -14 12
Final bound
Non ad-valorem duties (% total tariff lines) Number of disputes (complainant - defendant) Requests for consultation
in agricultural goods (AOA) in non-agricultural goods
2010Share in world total exports Share in world total imports
Breakdown in economy's total imports By principal services item
Transportation Transportation
Direct residents Direct non-residents
Travel Travel Other commercial services Other commercial services
295 1 720 2 015 2 604 6 925
Patent grants by patent office, 2009 Trademark registrations by office, 2008Residents Non-residents Total
Outstanding notifications in WTO Central Registry
MFN duty free imports (%, 2009)
Israel
World Trade OrganizationTrade Profiles 2011
90 Download the data:www.wto.org/statistics
Italy
BASIC INDICATORS Population (thousands, 2010) 60 484 Rank in world trade, 2010 Exports ImportsGDP (million current US$, 2010) 2 051 412 Merchandise 8 8GDP (million current PPP US$, 2010) 1 908 569 excluding intra-EU trade - -Current account balance (million US$, 2010) - 67 526 Commercial services 12 9Trade per capita (US$, 2008-2010) 19 202 excluding intra-EU trade - -Trade to GDP ratio (2008-2010) 53.7
2010 98
Exports of goods and services (volume, 2005=100) a 86Imports of goods and services (volume, 2005=100) a 90
TRADE POLICY
WTO accession 1 January 1995 Contribution to WTO budget (%, 2011) 3.741Trade Policy Review 6, 8 July 2011 Import duties collected GPA accession 1 January 1996 in total tax revenue ...Tariffs and duty free imports to total imports ...
Tariff binding coverage (%) 100 Number of notifications to WTO and measures in force MFN tariffs Applied 2010 18
Simple average of import duties Goods RTAs - services EIAs notified to WTO 31 - 10All goods 5.0 5.1 Anti-dumping (30 June 2010) 149
Agricultural goods (AOA) 12.3 12.8 Countervailing duties (30 June 2010) 8Non-agricultural goods 3.9 4.0 Safeguards (22 October 2010) 0
4.8 4.785 - 70
41.1 Original panel / Appellate Body (AB) reports 33 - 32 51.4 Compliance panel / AB reports (Article 21.5 DSU) 4 - 4
Agricultural products 8.6 Agricultural products 11.6Fuels and mining products 7.3 Fuels and mining products 23.7Manufactures 81.9 Manufactures 63.4
1. European Union (27) 56.9 1. European Union (27) 54.82. United States 6.0 2. China 7.83. Switzerland 4.8 3. Russian Federation 3.64. China 2.5 4. Switzerland 3.25. Turkey 2.4 5. Libyan Arab Jamahiriya 3.2
COMMERCIAL SERVICES TRADE Value2010 2009
97 091 107 939
2010 2.63 3.07
Breakdown in economy's total exports By principal services item
14.0 22.7 39.9 25.1 46.1 52.1
INDUSTRIAL PROPERTY
Madrid Total 4 723 61 099
October 2011
Italy
Annual percentage change2005-2010 2009 2010
Real GDP (2005=100) 0 -5 1-4 -19 ...-3 -15 ...
Final bound
Non ad-valorem duties (% total tariff lines) Number of disputes (complainant - defendant) Requests for consultation
in agricultural goods (AOA) in non-agricultural goods
2010Share in world total exports Share in world total imports
Breakdown in economy's total imports By principal services item
Transportation Transportation
Direct residents Direct non-residents
Travel Travel Other commercial services Other commercial services
16 319 1 958 18 277 54 091 2 285
Patent grants by patent office, 2009 Trademark registrations by office, 2009Residents Non-residents Total
Outstanding notifications in WTO Central Registry
MFN duty free imports (%, 2009)
a Refers to 2009 and to the average annual percentage change for 2005-2009.
World Trade OrganizationTrade Profiles 2011
91Download the data:www.wto.org/statistics
CO
UN
TRY
PR
OFI
LES
BASIC INDICATORS Population (thousands, 2010) 2 702 Rank in world trade, 2010 Exports ImportsGDP (million current US$, 2010) 13 995 Merchandise 138 113GDP (million current PPP US$, 2010) 21 183 excluding intra-EU trade 112 88Current account balance (million US$, 2009) - 1 126 Commercial services 81 105Trade per capita (US$, 2008-2010) 4 472 excluding intra-EU trade 55 79Trade to GDP ratio (2008-2010) 88.7
2010 103
Exports of goods and services (volume, 2005=100) ...Imports of goods and services (volume, 2005=100) ...
TRADE POLICY
WTO accession 9 March 1995 Contribution to WTO budget (%, 2011) 0.041Trade Policy Review 18, 20 January 2011 Import duties collected (%, 2003-2005) GPA accession - in total tax revenue 8.9Tariffs and duty free imports to total imports 4.4
Tariff binding coverage (%) 100 Number of notifications to WTO and measures in force MFN tariffs Applied 2010 23
Simple average of import duties Goods RTAs - services EIAs notified to WTO 2 - 2All goods 49.6 7.5 Anti-dumping (30 June 2010) 0
Agricultural goods (AOA) 96.9 17.8 Countervailing duties (30 June 2010) ...Non-agricultural goods 42.4 5.9 Safeguards (22 October 2010) 0
0.0 0.00 - 0
37.6 Original panel / Appellate Body (AB) reports 0 - 0 48.5 Compliance panel / AB reports (Article 21.5 DSU) 0 - 0
Agricultural products 23.6 Agricultural products 18.8Fuels and mining products 62.4 Fuels and mining products 31.0Manufactures 11.8 Manufactures 48.9
1. United States 49.6 1. United States 35.92. European Union (27) 13.4 2. Bolivarian Rep. of Venezuela 14.03. Canada 12.3 3. Trinidad and Tobago 13.84. Norway 5.2 4. European Union (27) 6.85. Russian Federation 2.8 5. China 4.6
COMMERCIAL SERVICES TRADE Value2010 2009
2 680 1 813
2010 0.07 0.05
Breakdown in economy's total exports By principal services item
13.2 43.8 74.1 10.6 12.7 45.6
INDUSTRIAL PROPERTY
Madrid Total ... 1 495
October 2011
Jamaica
Annual percentage change2005-2010 2009 2010
Real GDP (2005=100) 1 -2 -1... ... ...... ... ...
Final bound
Non ad-valorem duties (% total tariff lines) Number of disputes (complainant - defendant) Requests for consultation
in agricultural goods (AOA) in non-agricultural goods
2010Share in world total exports Share in world total imports
Breakdown in economy's total imports By principal services item
Transportation Transportation
Direct residents Direct non-residents
Travel Travel Other commercial services Other commercial services
9 34 43 287 1 208
Patent grants by patent office, 2006 Trademark registrations by office, 2002Residents Non-residents Total
Outstanding notifications in WTO Central Registry
MFN duty free imports (%, 2009)
Jamaica
World Trade OrganizationTrade Profiles 2011
92 Download the data:www.wto.org/statistics
Japan
BASIC INDICATORS Population (thousands, 2010) 127 450 Rank in world trade, 2010 Exports ImportsGDP (million current US$, 2010) 5 497 813 Merchandise 4 4GDP (million current PPP US$, 2010) 4 332 537 excluding intra-EU trade 4 4Current account balance (million US$, 2010) 195 759 Commercial services 6 5Trade per capita (US$, 2008-2010) 12 418 excluding intra-EU trade 4 4Trade to GDP ratio (2008-2010) 30.8
2010 102
Exports of goods and services (volume, 2005=100) a 92Imports of goods and services (volume, 2005=100) a 89
TRADE POLICY
WTO accession 1 January 1995 Contribution to WTO budget (%, 2011) 4.963Trade Policy Review 15, 17 February 2011 Import duties collected (%, 2003-2005) GPA accession 1 January 1996 in total tax revenue 1.1Tariffs and duty free imports to total imports 1.5
Tariff binding coverage (%) 99.7 Number of notifications to WTO and measures in force MFN tariffs Applied 2010 12
Simple average of import duties Goods RTAs - services EIAs notified to WTO 11 - 10All goods 4.9 4.4 Anti-dumping (30 June 2010) 6
Agricultural goods (AOA) 20.9 17.3 Countervailing duties (30 June 2010) ...Non-agricultural goods 2.5 2.5 Safeguards (22 October 2010) 0
3.5 3.214 - 15
46.6 Original panel / Appellate Body (AB) reports 11 - 7 82.1 Compliance panel / AB reports (Article 21.5 DSU) 1 - 1
Agricultural products 1.3 Agricultural products 11.2Fuels and mining products 4.3 Fuels and mining products 36.7Manufactures 88.4 Manufactures 50.0
1. China 19.4 1. China 22.12. United States 15.6 2. United States 10.03. European Union (27) 11.3 3. European Union (27) 9.64. Korea, Republic of 8.1 4. Australia 6.45. Taipei, Chinese 6.8 5. Saudi Arabia, Kingdom of 5.2
COMMERCIAL SERVICES TRADE Value2010 2009
138 875 155 800
2010 3.76 4.44
Breakdown in economy's total exports By principal services item
28.0 29.9 9.5 17.9
62.4 52.2
INDUSTRIAL PROPERTY
Madrid Total 5 177 103 575
October 2011
Japan
Annual percentage change2005-2010 2009 2010
Real GDP (2005=100) 0 -6 5-2 -24 ...-3 -17 ...
Final bound
Non ad-valorem duties (% total tariff lines) Number of disputes (complainant - defendant) Requests for consultation
in agricultural goods (AOA) in non-agricultural goods
2010Share in world total exports Share in world total imports
Breakdown in economy's total imports By principal services item
Transportation Transportation
Direct residents Direct non-residents
Travel Travel Other commercial services Other commercial services
164 459 28 890 193 349 88 426 9 972
Patent grants by patent office, 2009 Trademark registrations by office, 2009Residents Non-residents Total
Outstanding notifications in WTO Central Registry
MFN duty free imports (%, 2009)
a Refers to 2009 and to the average annual percentage change for 2005-2009.
World Trade OrganizationTrade Profiles 2011
93Download the data:www.wto.org/statistics
CO
UN
TRY
PR
OFI
LES
BASIC INDICATORS Population (thousands, 2010) 6 047 Rank in world trade, 2010 Exports ImportsGDP (million current US$, 2010) 27 574 Merchandise 95 76GDP (million current PPP US$, 2010) 34 507 excluding intra-EU trade 71 54Current account balance (million US$, 2010) - 1 311 Commercial services 65 70Trade per capita (US$, 2008-2010) 4 950 excluding intra-EU trade 43 49Trade to GDP ratio (2008-2010) 116.6
2010 133
Exports of goods and services (volume, 2005=100) 106Imports of goods and services (volume, 2005=100) 112
TRADE POLICY
WTO accession 11 April 2000 Contribution to WTO budget (%, 2011) 0.077Trade Policy Review 10, 12 November 2008 Import duties collected (%, 2008-2009) GPA accession Observer in total tax revenue 9.8Tariffs and duty free imports to total imports 2.2
Tariff binding coverage (%) 100 Number of notifications to WTO and measures in force MFN tariffs Applied 2010 10
Simple average of import duties Goods RTAs - services EIAs notified to WTO 6 - 2All goods 16.3 10.0 Anti-dumping (30 June 2010) ...
Agricultural goods (AOA) 23.6 18.2 Countervailing duties (30 June 2010) ...Non-agricultural goods 15.2 8.8 Safeguards (22 October 2010) 1
0.2 0.20 - 0
64.8 Original panel / Appellate Body (AB) reports 0 - 0 44.6 Compliance panel / AB reports (Article 21.5 DSU) 0 - 0
Agricultural products 16.2 Agricultural products 17.4Fuels and mining products 8.2 Fuels and mining products 24.2Manufactures 72.6 Manufactures 55.8
1. Iraq 16.0 1. European Union (27) 19.92. United States 13.2 2. Saudi Arabia, Kingdom of 19.83. India 11.1 3. China 10.84. Saudi Arabia, Kingdom of 9.4 4. United States 5.65. United Arab Emirates 4.2 5. Egypt 4.5 Unspecified destinations 8.7 Unspecified origins 0.2
COMMERCIAL SERVICES TRADE Value2010 2009
4 782 4 164
2010 0.13 0.12
Breakdown in economy's total exports By principal services item
17.8 50.9 71.4 34.4 10.8 14.7
INDUSTRIAL PROPERTY
Madrid Total ... 6 824
October 2011
Jordan
Annual percentage change2005-2010 2009 2010
Real GDP (2005=100) 6 2 31 -3 82 -8 7
Final bound
Non ad-valorem duties (% total tariff lines) Number of disputes (complainant - defendant) Requests for consultation
in agricultural goods (AOA) in non-agricultural goods
Agricultural products 3.5 Agricultural products 10.2Fuels and mining products 82.9 Fuels and mining products 16.2Manufactures 12.1 Manufactures 73.4
1. European Union (27) 53.8 1. European Union (27) 30.12. China 17.7 2. Russian Federation 22.83. Russian Federation 5.3 3. China 16.54. Canada 4.3 4. Ukraine 5.75. Israel 2.2 5. United States 5.5
COMMERCIAL SERVICES TRADE Value2010 2009
3 886 11 128
2010 0.11 0.32
Breakdown in economy's total exports By principal services item
58.4 16.7 25.9 11.0 15.7 72.4
INDUSTRIAL PROPERTY
Madrid Total 3 295 3 295
October 2011
Kazakhstan
Annual percentage change2005-2010 2009 2010
Real GDP (2005=100) 6 1 72 -6 -2
-4 -16 -21
Final bound
Non ad-valorem duties (% total tariff lines) Number of disputes (complainant - defendant) Requests for consultation
in agricultural goods (AOA) in non-agricultural goods
2010Share in world total exports Share in world total imports
Breakdown in economy's total imports By principal services item
Transportation Transportation
Direct residents Direct non-residents
Travel Travel Other commercial services Other commercial services
132 39 171 ... ...
Patent grants by patent office, 2008 Trademark registrations by office, 2009Residents Non-residents Total
Outstanding notifications in WTO Central Registry
MFN duty free imports (%, 2009)
World Trade OrganizationTrade Profiles 2011
95Download the data:www.wto.org/statistics
CO
UN
TRY
PR
OFI
LES
BASIC INDICATORS Population (thousands, 2010) 40 513 Rank in world trade, 2010 Exports ImportsGDP (million current US$, 2010) 31 409 Merchandise 103 82GDP (million current PPP US$, 2010) 66 225 excluding intra-EU trade 79 59Current account balance (million US$, 2009) - 1 661 Commercial services 79 104Trade per capita (US$, 2008-2010) 500 excluding intra-EU trade 53 78Trade to GDP ratio (2008-2010) 65.2
2010 125
Exports of goods and services (volume, 2005=100) 116Imports of goods and services (volume, 2005=100) 144
TRADE POLICY
WTO accession 1 January 1995 Contribution to WTO budget (%, 2011) 0.049Trade Policy Review 25, 27 October 2006 Import duties collected (%, 2007-2009) GPA accession - in total tax revenue 8.3Tariffs and duty free imports to total imports 4.1
Tariff binding coverage (%) 14.8 Number of notifications to WTO and measures in force MFN tariffs Applied 2010 41
Simple average of import duties Goods RTAs - services EIAs notified to WTO 2 - 0All goods 95.4 12.5 Anti-dumping (30 June 2010) ...
Agricultural goods (AOA) 100.0 19.7 Countervailing duties (30 June 2010) ...Non-agricultural goods 55.1 11.4 Safeguards (22 October 2010) 0
0.0 0.10 - 0
23.1 Original panel / Appellate Body (AB) reports 0 - 0 59.9 Compliance panel / AB reports (Article 21.5 DSU) 0 - 0
Agricultural products 55.5 Agricultural products 13.1Fuels and mining products 6.0 Fuels and mining products 22.8Manufactures 32.8 Manufactures 59.2
1. European Union (27) 26.5 1. European Union (27) 18.52. Uganda 13.4 2. United Arab Emirates 11.43. Tanzania 8.7 3. India 10.64. United States 5.1 4. China 9.55. Pakistan 4.4 5. South Africa 9.0
COMMERCIAL SERVICES TRADE Value2010 2009
2 931 1 827
2010 0.08 0.05
Breakdown in economy's total exports By principal services item
51.9 51.1 27.3 12.0 20.8 36.9
INDUSTRIAL PROPERTY
Madrid Total 1 429 1 429
October 2011
Kenya
Annual percentage change2005-2010 2009 2010
Real GDP (2005=100) 5 3 53 -7 67 0 3
Final bound
Non ad-valorem duties (% total tariff lines) Number of disputes (complainant - defendant) Requests for consultation
in agricultural goods (AOA) in non-agricultural goods
2010Share in world total exports Share in world total imports
Breakdown in economy's total imports By principal services item
Transportation Transportation
Direct residents Direct non-residents
Travel Travel Other commercial services Other commercial services
7 17 24 ... ...
Patent grants by patent office, 2006 Trademark registrations by office, 2009Residents Non-residents Total
Outstanding notifications in WTO Central Registry
MFN duty free imports (%, 2009)
a Breakdowns by destination/origin refer to 2009.
Kenya
World Trade OrganizationTrade Profiles 2011
96 Download the data:www.wto.org/statistics
Korea, Republic of
BASIC INDICATORS Population (thousands, 2010) 48 875 Rank in world trade, 2010 Exports ImportsGDP (million current US$, 2010) 1 014 483 Merchandise 7 10GDP (million current PPP US$, 2010) 1 417 549 excluding intra-EU trade 5 6Current account balance (million US$, 2010) 28 214 Commercial services 15 12Trade per capita (US$, 2008-2010) 20 110 excluding intra-EU trade 8 7Trade to GDP ratio (2008-2010) 105.8
2010 120
Exports of goods and services (volume, 2005=100) a 133Imports of goods and services (volume, 2005=100) a 119
TRADE POLICY
WTO accession 1 January 1995 Contribution to WTO budget (%, 2011) 2.685Trade Policy Review 8, 10 October 2008 Import duties collected (%, 2007-2009) GPA accession 1 January 1997 in total tax revenue 4.0Tariffs and duty free imports to total imports 1.7
Tariff binding coverage (%) 94.6 Number of notifications to WTO and measures in force MFN tariffs Applied 2010 18
Simple average of import duties Goods RTAs - services EIAs notified to WTO 10 - 7All goods 16.6 12.1 Anti-dumping (30 June 2010) 37
Agricultural goods (AOA) 55.9 48.5 Countervailing duties (30 June 2010) ...Non-agricultural goods 10.2 6.6 Safeguards (22 October 2010) 0
0.7 0.415 - 14
9.3 Original panel / Appellate Body (AB) reports 10 - 8 39.1 Compliance panel / AB reports (Article 21.5 DSU) 0 - 1
Agricultural products 2.0 Agricultural products 6.3Fuels and mining products 9.1 Fuels and mining products 36.9Manufactures 88.2 Manufactures 56.4
1. China 23.8 1. China 16.82. European Union (27) 12.8 2. Japan 15.33. United States 10.4 3. European Union (27) 10.04. Japan 6.0 4. United States 9.05. Hong Kong, China 5.4 5. Saudi Arabia, Kingdom of 6.1
COMMERCIAL SERVICES TRADE Value2010 2009
81 570 92 978
2010 2.21 2.65
Breakdown in economy's total exports By principal services item
46.6 31.0 12.0 19.0 41.4 50.0
INDUSTRIAL PROPERTY
Madrid Total 5 337 50 453
October 2011
Korea, Republic of
Annual percentage change2005-2010 2009 2010
Real GDP (2005=100) 4 0 67 -1 ...4 -8 ...
Final bound
Non ad-valorem duties (% total tariff lines) Number of disputes (complainant - defendant) Requests for consultation
in agricultural goods (AOA) in non-agricultural goods
Agricultural products 0.5 Agricultural products 13.7Fuels and mining products 92.3 Fuels and mining products 2.5Manufactures 7.2 Manufactures 81.5
1. China 2.2 1. ... ...2. United Arab Emirates 1.1 2. ... ...3. Saudi Arabia, Kingdom of 0.9 3. ... ...4. European Union (27) 0.7 4. ... ...5. India 0.6 5. ... ... Unspecified destinations 90.3
COMMERCIAL SERVICES TRADE Value2010 2009
6 917 11 628
2010 0.19 0.33
Breakdown in economy's total exports By principal services item
44.9 31.9 2.3 67.0
52.8 1.0
INDUSTRIAL PROPERTY
Madrid Total ... ...
October 2011
Kuwait
Annual percentage change2005-2007 2006 2007
Real GDP (2005=100) 5 5 4... ... ...... ... ...
Final bound
Non ad-valorem duties (% total tariff lines) Number of disputes (complainant - defendant) Requests for consultation
in agricultural goods (AOA) in non-agricultural goods
2010Share in world total exports Share in world total imports
Breakdown in economy's total imports By principal services item
Transportation Transportation
Direct residents Direct non-residents
Travel Travel Other commercial services Other commercial services
... ... ... ... ...
Patent grants by patent office Trademark registrations by officeResidents Non-residents Total
Outstanding notifications in WTO Central Registry
MFN duty free imports (%, 2008)
a Breakdowns by destination/origin refer to 2009.
Kuwait
World Trade OrganizationTrade Profiles 2011
98 Download the data:www.wto.org/statistics
Kyrgyz Republic
BASIC INDICATORS Population (thousands, 2010) 5 365 Rank in world trade, 2010 Exports ImportsGDP (million current US$, 2010) 4 616 Merchandise 129 134GDP (million current PPP US$, 2010) 12 107 excluding intra-EU trade 104 108Current account balance (million US$, 2010) - 188 Commercial services 126 129Trade per capita (US$, 2008-2010) 1 258 excluding intra-EU trade 100 103Trade to GDP ratio (2008-2010) 139.0
2010 123
Exports of goods and services (volume, 2005=100) 139Imports of goods and services (volume, 2005=100) 205
TRADE POLICY
WTO accession 20 December 1998 Contribution to WTO budget (%, 2011) 0.015Trade Policy Review 9, 11 October 2006 Import duties collected (%, 2007-2009) GPA accession Observer in total tax revenue 14.8Tariffs and duty free imports to total imports 2.8
Tariff binding coverage (%) 100 Number of notifications to WTO and measures in force MFN tariffs Applied 2010 37
Simple average of import duties Goods RTAs - services EIAs notified to WTO 9 - 0All goods 7.5 4.6 Anti-dumping (30 June 2010) ...
Agricultural goods (AOA) 12.8 7.6 Countervailing duties (30 June 2010) ...Non-agricultural goods 6.7 4.2 Safeguards (22 October 2010) 1
0.6 0.40 - 0
21.1 Original panel / Appellate Body (AB) reports 0 - 0 61.9 Compliance panel / AB reports (Article 21.5 DSU) 0 - 0
Agricultural products 12.8 Agricultural products 18.1Fuels and mining products 8.2 Fuels and mining products 27.4Manufactures 15.8 Manufactures 53.9
1. Switzerland 26.1 1. Russian Federation 33.62. United Arab Emirates 20.3 2. China 20.73. Russian Federation 17.3 3. Kazakhstan 12.04. Kazakhstan 12.2 4. European Union (27) 9.25. United States 6.1 5. United States 5.9
COMMERCIAL SERVICES TRADE Value2010 2009 679 915
2010 0.02 0.03
Breakdown in economy's total exports By principal services item
22.2 45.6 41.8 29.6 36.0 24.8
INDUSTRIAL PROPERTY
Madrid Total 2 546 2 546
October 2011
Kyrgyz Republic
Annual percentage change2005-2010 2009 2010
Real GDP (2005=100) 4 3 -17 -7 4
15 -8 2
Final bound
Non ad-valorem duties (% total tariff lines) Number of disputes (complainant - defendant) Requests for consultation
in agricultural goods (AOA) in non-agricultural goods
2009Share in world total exports Share in world total imports
Breakdown in economy's total imports By principal services item
Transportation Transportation
Direct residents Direct non-residents
Travel Travel Other commercial services Other commercial services
... ... ... 45 675
Patent grants by patent office Trademark registrations by office, 2003Residents Non-residents Total
Outstanding notifications in WTO Central Registry
MFN duty free imports
Lao People’s Dem. Rep.
World Trade OrganizationTrade Profiles 2011
100 Download the data:www.wto.org/statistics
Latvia
BASIC INDICATORS Population (thousands, 2010) 2 243 Rank in world trade, 2010 Exports ImportsGDP (million current US$, 2010) 24 010 Merchandise 84 83GDP (million current PPP US$, 2010) 36 586 excluding intra-EU trade - -Current account balance (million US$, 2010) 850 Commercial services 75 95Trade per capita (US$, 2008-2010) 11 884 excluding intra-EU trade - -Trade to GDP ratio (2008-2010) 96.2
2010 97
Exports of goods and services (volume, 2005=100) 113Imports of goods and services (volume, 2005=100) 88
TRADE POLICY
WTO accession 10 February 1999 Contribution to WTO budget (%, 2011) 0.081Trade Policy Review 6, 8 July 2011 Import duties collected GPA accession 1 May 2004 in total tax revenue ...Tariffs and duty free imports to total imports ...
Tariff binding coverage (%) 100 Number of notifications to WTO and measures in force MFN tariffs Applied 2010 18
Simple average of import duties Goods RTAs - services EIAs notified to WTO 31 - 10All goods 5.0 5.1 Anti-dumping (30 June 2010) 149
Agricultural goods (AOA) 12.3 12.8 Countervailing duties (30 June 2010) 8Non-agricultural goods 3.9 4.0 Safeguards (22 October 2010) 0
4.8 4.785 - 70
41.1 Original panel / Appellate Body (AB) reports 33 - 32 51.4 Compliance panel / AB reports (Article 21.5 DSU) 4 - 4
Agricultural products 11.0 Agricultural products 17.5Fuels and mining products 8.9 Fuels and mining products 26.5Manufactures 50.0 Manufactures 51.2
1. European Union (27) 18.1 1. European Union (27) 35.82. Switzerland 11.8 2. United States 10.73. United Arab Emirates 9.8 3. China 9.14. South Africa 8.1 4. Turkey 3.85. Iraq 6.3 5. Japan 3.5
COMMERCIAL SERVICES TRADE Value2010 2009
15 200 12 986
2010 0.41 0.37
Breakdown in economy's total exports By principal services item
4.1 14.7 52.7 36.5 43.2 48.8
INDUSTRIAL PROPERTY
Madrid Total ... ...
October 2011
Lebanon
Annual percentage change2005-2010 2009 2010
Real GDP (2005=100) 7 9 78 5 89 6 8
Final bound
Non ad-valorem duties (% total tariff lines) Number of disputes (complainant - defendant) Requests for consultation
in agricultural goods (AOA) in non-agricultural goods
2010Share in world total exports Share in world total imports
Breakdown in economy's total imports By principal services item
Transportation Transportation
Direct residents Direct non-residents
Travel Travel Other commercial services Other commercial services
... ... ... ... ...
Patent grants by patent office Trademark registrations by officeResidents Non-residents Total
Outstanding notifications in WTO Central Registry
MFN duty free imports (%, 2009)
Lebanon
World Trade OrganizationTrade Profiles 2011
102 Download the data:www.wto.org/statistics
Lesotho
BASIC INDICATORS Population (thousands, 2010) 2 171 Rank in world trade, 2010 Exports ImportsGDP (million current US$, 2010) 2 132 Merchandise 152 146GDP (million current PPP US$, 2010) 3 330 excluding intra-EU trade 126 120Current account balance (million US$, 2009) - 32 Commercial services 179 178Trade per capita (US$, 2007-2009) 1 218 excluding intra-EU trade 153 152Trade to GDP ratio (2007-2009) 158.5
2010 122
Exports of goods and services (volume, 2005=100) 89Imports of goods and services (volume, 2005=100) 135
TRADE POLICY
WTO accession 31 May 1995 Contribution to WTO budget (%, 2011) 0.015Trade Policy Review 4, 6 November 2009 Import duties collected GPA accession - in total tax revenue ...Tariffs and duty free imports to total imports ...
Tariff binding coverage (%) 100 Number of notifications to WTO and measures in force MFN tariffs Applied 2010 19
Simple average of import duties Goods RTAs - services EIAs notified to WTO 3 - 0All goods 78.4 7.6 Anti-dumping (30 June 2010) ...
Agricultural goods (AOA) 198.9 9.1 Countervailing duties (30 June 2010) ...Non-agricultural goods 60.0 7.4 Safeguards (22 October 2010) 0
0.0 2.20 - 0
... Original panel / Appellate Body (AB) reports 0 - 0
2009Share in world total exports Share in world total imports
Breakdown in economy's total imports By principal services item
Transportation Transportation
Direct residents Direct non-residents
Travel Travel Other commercial services Other commercial services
1 ... 1 ... ...
Patent grants by patent office, 1996 Trademark registrations by office, 2009Residents Non-residents Total
Outstanding notifications in WTO Central Registry
MFN duty free imports
World Trade OrganizationTrade Profiles 2011
103Download the data:www.wto.org/statistics
CO
UN
TRY
PR
OFI
LES
Libyan Arab Jamahiriya
BASIC INDICATORS Population (thousands, 2010) 6 355 Rank in world trade, 2010 Exports ImportsGDP (million current US$, 2009) 62 360 Merchandise 56 86GDP (million current PPP US$, 2009) 105 444 excluding intra-EU trade 39 62Current account balance (million US$, 2009) 9 381 Commercial services 138 67Trade per capita (US$, 2007-2009) 11 848 excluding intra-EU trade 112 48Trade to GDP ratio (2007-2009) 96.1
2009 119
Exports of goods and services (volume, 2005=100) ...Imports of goods and services (volume, 2005=100) ...
TRADE POLICY
WTO accession Observer Contribution to WTO budget -Trade Policy Review - Import duties collected GPA accession - in total tax revenue ...Tariffs and duty free imports to total imports ...
Tariff binding coverage (%) - Number of notifications to WTO and measures in force MFN tariffs Applied 2006 -
Simple average of import duties Goods RTAs - services EIAs notified to WTO 3 - 0All goods - 0.0 Anti-dumping -
2009Share in world total exports Share in world total imports
Breakdown in economy's total imports By principal services item
Transportation Transportation
Direct residents Direct non-residents
Travel Travel Other commercial services Other commercial services
... ... ... ... ...
Patent grants by patent office Trademark registrations by officeResidents Non-residents Total
Outstanding notifications in WTO Central Registry
MFN duty free imports
World Trade OrganizationTrade Profiles 2011
104 Download the data:www.wto.org/statistics
Lithuania
BASIC INDICATORS Population (thousands, 2010) 3 321 Rank in world trade, 2010 Exports ImportsGDP (million current US$, 2010) 36 306 Merchandise 67 65GDP (million current PPP US$, 2010) 60 383 excluding intra-EU trade - -Current account balance (million US$, 2010) 670 Commercial services 70 86Trade per capita (US$, 2008-2010) 15 232 excluding intra-EU trade - -Trade to GDP ratio (2008-2010) 126.7
2010 105
Exports of goods and services (volume, 2005=100) 131Imports of goods and services (volume, 2005=100) 117
TRADE POLICY
WTO accession 31 May 2001 Contribution to WTO budget (%, 2011) 0.142Trade Policy Review 6, 8 July 2011 Import duties collected GPA accession 1 May 2004 in total tax revenue ...Tariffs and duty free imports to total imports ...
Tariff binding coverage (%) 100 Number of notifications to WTO and measures in force MFN tariffs Applied 2010 21
Simple average of import duties Goods RTAs - services EIAs notified to WTO 31 - 10All goods 5.0 5.1 Anti-dumping (30 June 2010) 149
Agricultural goods (AOA) 12.3 12.8 Countervailing duties (30 June 2010) 8Non-agricultural goods 3.9 4.0 Safeguards (22 October 2010) 0
4.8 4.785 - 70
41.1 Original panel / Appellate Body (AB) reports 33 - 32 51.4 Compliance panel / AB reports (Article 21.5 DSU) 4 - 4
Agricultural products 20.1 Agricultural products 14.5Fuels and mining products 24.9 Fuels and mining products 33.7Manufactures 54.9 Manufactures 51.8
1. European Union (27) 61.2 1. European Union (27) 56.52. Russian Federation 15.6 2. Russian Federation 32.73. Belarus 5.2 3. China 2.44. Ukraine 3.6 4. Belarus 1.75. United States 2.9 5. United States 1.0
COMMERCIAL SERVICES TRADE Value2010 2009
4 067 2 711
2010 0.11 0.08
Breakdown in economy's total exports By principal services item
59.5 52.4 25.3 29.0 15.2 18.6
INDUSTRIAL PROPERTY
Madrid Total 2 335 5 112
October 2011
Lithuania
Annual percentage change2005-2010 2009 2010
Real GDP (2005=100) 1 -15 15 -13 163 -28 18
Final bound
Non ad-valorem duties (% total tariff lines) Number of disputes (complainant - defendant) Requests for consultation
in agricultural goods (AOA) in non-agricultural goods
2010Share in world total exports Share in world total imports
Breakdown in economy's total imports By principal services item
Transportation Transportation
Direct residents Direct non-residents
Travel Travel Other commercial services Other commercial services
59 25 84 2 307 470
Patent grants by patent office, 2009 Trademark registrations by office, 2009Residents Non-residents Total
Outstanding notifications in WTO Central Registry
MFN duty free imports (%, 2009)
World Trade OrganizationTrade Profiles 2011
105Download the data:www.wto.org/statistics
CO
UN
TRY
PR
OFI
LES
BASIC INDICATORS Population (thousands, 2010) 506 Rank in world trade, 2010 Exports ImportsGDP (million current US$, 2010) 55 096 Merchandise 69 64GDP (million current PPP US$, 2010) 45 408 excluding intra-EU trade - -Current account balance (million US$, 2010) 4 310 Commercial services 17 26Trade per capita (US$, 2008-2010) 291 051 excluding intra-EU trade - -Trade to GDP ratio (2008-2010) 261.6
2010 113
Exports of goods and services (volume, 2005=100) a 121Imports of goods and services (volume, 2005=100) a 120
TRADE POLICY
WTO accession 1 January 1995 Contribution to WTO budget (%, 2011) 0.421Trade Policy Review 6, 8 July 2011 Import duties collected GPA accession 1 January 1996 in total tax revenue ...Tariffs and duty free imports to total imports ...
Tariff binding coverage (%) 100 Number of notifications to WTO and measures in force MFN tariffs Applied 2010 17
Simple average of import duties Goods RTAs - services EIAs notified to WTO 31 - 10All goods 5.0 5.1 Anti-dumping (30 June 2010) 149
Agricultural goods (AOA) 12.3 12.8 Countervailing duties (30 June 2010) 8Non-agricultural goods 3.9 4.0 Safeguards (22 October 2010) 0
4.8 4.785 - 70
41.1 Original panel / Appellate Body (AB) reports 33 - 32 51.4 Compliance panel / AB reports (Article 21.5 DSU) 4 - 4
Agricultural products 7.9 Agricultural products 10.8Fuels and mining products 4.6 Fuels and mining products 18.0Manufactures 86.4 Manufactures 70.9
1. European Union (27) 81.7 1. European Union (27) 80.42. United States 2.7 2. United States 2.43. Switzerland 1.5 3. China 1.74. Hong Kong, China 1.3 4. Japan 1.75. China 1.3 5. Switzerland 0.7 Unspecified destinations 0.1 Unspecified origins 1.8
COMMERCIAL SERVICES TRADE Value2010 2009
68 336 38 688
2010 1.85 1.10
Breakdown in economy's total exports By principal services item
5.0 4.3 6.0 9.2
89.0 86.5
INDUSTRIAL PROPERTY
Madrid Total ... ...
October 2011
Luxembourg
Annual percentage change2005-2010 2009 2010
Real GDP (2005=100) 3 -4 45 -8 ...5 -10 ...
Final bound
Non ad-valorem duties (% total tariff lines) Number of disputes (complainant - defendant) Requests for consultation
in agricultural goods (AOA) in non-agricultural goods
2010Share in world total exports Share in world total imports
Breakdown in economy's total imports By principal services item
Transportation Transportation
Direct residents Direct non-residents
Travel Travel Other commercial services Other commercial services
30 25 55 ... ...
Patent grants by patent office, 2009 Trademark registrations by officeResidents Non-residents Total
Outstanding notifications in WTO Central Registry
MFN duty free imports (%, 2009)
a Refers to 2009 and to the average annual percentage change for 2005-2009.
Luxembourg
World Trade OrganizationTrade Profiles 2011
106 Download the data:www.wto.org/statistics
Macao, China
BASIC INDICATORS Population (thousands, 2010) 544 Rank in world trade, 2010 Exports ImportsGDP (million current US$, 2009) 21 736 Merchandise 148 106GDP (million current PPP US$, 2009) 32 208 excluding intra-EU trade 122 81Current account balance (million US$, 2009) 6 238 Commercial services 32 59Trade per capita (US$, 2008-2010) 65 163 excluding intra-EU trade 19 41Trade to GDP ratio (2007-2009) 144.5
2009 168
Exports of goods and services (volume, 2005=100) 169Imports of goods and services (volume, 2005=100) 122
TRADE POLICY
WTO accession 1 January 1995 Contribution to WTO budget (%, 2011) 0.077Trade Policy Review 30 April, 2 May 2007 Import duties collected (%, 2007-2009) GPA accession - in total tax revenue 0.0Tariffs and duty free imports to total imports 0.0
Tariff binding coverage (%) 27.9 Number of notifications to WTO and measures in force MFN tariffs Applied 2010 4
Simple average of import duties Goods RTAs - services EIAs notified to WTO 1 - 1All goods 0.0 0.0 Anti-dumping (30 June 2010) ...
Agricultural goods (AOA) 0.0 0.0 Countervailing duties (30 June 2010) ...Non-agricultural goods 0.0 0.0 Safeguards (22 October 2010) 0
0.0 0.00 - 0
100.0 Original panel / Appellate Body (AB) reports 0 - 0 100.0 Compliance panel / AB reports (Article 21.5 DSU) 0 - 0
Agricultural products 2.1 Agricultural products 17.0Fuels and mining products 12.1 Fuels and mining products 11.1Manufactures 81.9 Manufactures 65.6
1. Hong Kong, China 30.4 1. China 30.52. China 11.4 2. European Union (27) 22.23. United States 11.0 3. Hong Kong, China 10.34. European Union (27) 5.6 4. Japan 8.55. Viet Nam 2.7 5. Switzerland 7.4 Unspecified destinations 29.8 Unspecified origins 0.3
COMMERCIAL SERVICES TRADE Value2010 2009
27 923 7 111
2010 0.76 0.20
Breakdown in economy's total exports By principal services item
1.6 3.4 96.9 15.4 1.4 81.2
INDUSTRIAL PROPERTY
Madrid Total ... 6 371
October 2011
Macao, China
Annual percentage change2005-2009 2008 2009
Real GDP (2005=100) 14 14 114 16 -15 0 -15
Final bound
Non ad-valorem duties (% total tariff lines) Number of disputes (complainant - defendant) Requests for consultation
in agricultural goods (AOA) in non-agricultural goods
2010Share in world total exports Share in world total imports
Breakdown in economy's total imports By principal services item
Transportation Transportation
Direct residents Direct non-residents
Travel Travel Other commercial services Other commercial services
... 113 113 466 5 905
Patent grants by patent office, 2009 Trademark registrations by office, 2009Residents Non-residents Total
Outstanding notifications in WTO Central Registry
MFN duty free imports (%, 2009)
World Trade OrganizationTrade Profiles 2011
107Download the data:www.wto.org/statistics
CO
UN
TRY
PR
OFI
LES
BASIC INDICATORS Population (thousands, 2010) 20 714 Rank in world trade, 2010 Exports ImportsGDP (million current US$, 2010) 8 721 Merchandise 143 142GDP (million current PPP US$, 2010) 19 916 excluding intra-EU trade 117 116Current account balance (million US$, 2005) - 554 Commercial services 125 128Trade per capita (US$, 2008-2010) 290 excluding intra-EU trade 99 102Trade to GDP ratio (2008-2010) 65.8
2010 116
Exports of goods and services (volume, 2005=100) a 164Imports of goods and services (volume, 2005=100) a 152
TRADE POLICY
WTO accession 17 November 1995 Contribution to WTO budget (%, 2011) 0.015Trade Policy Review 2, 4 April 2008 Import duties collected (%, 2006-2008) GPA accession - in total tax revenue 49.0Tariffs and duty free imports to total imports 12.7
Tariff binding coverage (%) 29.7 Number of notifications to WTO and measures in force MFN tariffs Applied 2010 27
Simple average of import duties Goods RTAs - services EIAs notified to WTO 2 - 0All goods 27.4 11.7 Anti-dumping (30 June 2010) ...
Agricultural goods (AOA) 30.0 14.6 Countervailing duties (30 June 2010) ...Non-agricultural goods 25.4 11.3 Safeguards (22 October 2010) 0
0.0 0.10 - 0
17.3 Original panel / Appellate Body (AB) reports 0 - 0 21.3 Compliance panel / AB reports (Article 21.5 DSU) 0 - 0
Agricultural products 26.0 Agricultural products 14.0Fuels and mining products 14.0 Fuels and mining products 14.9Manufactures 59.5 Manufactures 67.5
1. European Union (27) 53.6 1. European Union (27) 24.92. China 5.2 2. China 12.23. Côte d'Ivoire 4.5 3. South Africa 7.74. India 4.3 4. United States 5.85. United States 4.1 5. Bahrain 5.5
COMMERCIAL SERVICES TRADE Value2010 2009 725 917
2010 b 0.02 0.03
Breakdown in economy's total exports By principal services item
30.0 42.6 39.1 10.2 30.9 47.2
INDUSTRIAL PROPERTY
Madrid Total 766 1 595
October 2011
Madagascar
Annual percentage change2005-2010 2009 2010
Real GDP (2005=100) 3 -5 213 9 ...11 -10 ...
Final bound
Non ad-valorem duties (% total tariff lines) Number of disputes (complainant - defendant) Requests for consultation
in agricultural goods (AOA) in non-agricultural goods
2010 bShare in world total exports Share in world total imports
Breakdown in economy's total imports By principal services item
Transportation Transportation
Direct residents Direct non-residents
Travel Travel Other commercial services Other commercial services
2 25 27 571 258
Patent grants by patent office, 2009 Trademark registrations by office, 2009Residents Non-residents Total
Outstanding notifications in WTO Central Registry
MFN duty free imports (%, 2009)
a Refers to 2009 and to the average annual percentage change for 2005-2009. b Breakdowns by services items refer to 2008.
Madagascar
World Trade OrganizationTrade Profiles 2011
108 Download the data:www.wto.org/statistics
Malawi
BASIC INDICATORS Population (thousands, 2010) 14 901 Rank in world trade, 2010 Exports ImportsGDP (million current US$, 2010) 5 106 Merchandise 144 150GDP (million current PPP US$, 2010) 13 047 excluding intra-EU trade 118 124Current account balance (million US$, 2010) ... Commercial services 178 159Trade per capita (US$, 2007-2009) 179 excluding intra-EU trade 152 133Trade to GDP ratio (2007-2009) 61.5
2010 143
Exports of goods and services (volume, 2005=100) ...Imports of goods and services (volume, 2005=100) ...
TRADE POLICY
WTO accession 31 May 1995 Contribution to WTO budget (%, 2011) 0.015Trade Policy Review 9, 11 June 2010 Import duties collected GPA accession - in total tax revenue ...Tariffs and duty free imports to total imports ...
Tariff binding coverage (%) 31.6 Number of notifications to WTO and measures in force MFN tariffs Applied 2010 21
Simple average of import duties Goods RTAs - services EIAs notified to WTO 2 - 0All goods 75.4 12.7 Anti-dumping (30 June 2010) ...
Agricultural goods (AOA) 121.2 17.4 Countervailing duties (30 June 2010) ...Non-agricultural goods 42.3 12.0 Safeguards (22 October 2010) 0
0.0 0.20 - 0
35.9 Original panel / Appellate Body (AB) reports 0 - 0 38.6 Compliance panel / AB reports (Article 21.5 DSU) 0 - 0
Agricultural products 79.7 Agricultural products 16.9Fuels and mining products 11.2 Fuels and mining products 12.6Manufactures 9.1 Manufactures 70.5
1. European Union (27) 36.7 1. South Africa 30.12. Canada 11.0 2. European Union (27) 13.73. Egypt 9.2 3. China 9.14. United States 6.0 4. India 7.65. South Africa 5.8 5. Zambia 5.5
COMMERCIAL SERVICES TRADE Value2009 2008 72
330
2009 0.00 0.01
Breakdown in economy's total exports By principal services item
37.2 68.9 60.1 24.2 2.7 6.9
INDUSTRIAL PROPERTY
Madrid Total ... 370
October 2011
Malawi
Annual percentage change2005-2010 2009 2010
Real GDP (2005=100) 7 8 7... ... ...... ... ...
Final bound
Non ad-valorem duties (% total tariff lines) Number of disputes (complainant - defendant) Requests for consultation
in agricultural goods (AOA) in non-agricultural goods
2009Share in world total exports Share in world total imports
Breakdown in economy's total imports By principal services item
Transportation Transportation
Direct residents Direct non-residents
Travel Travel Other commercial services Other commercial services
... 2 2 96 274
Patent grants by patent office, 2003 Trademark registrations by office, 2006Residents Non-residents Total
Outstanding notifications in WTO Central Registry
MFN duty free imports (%, 2009)
World Trade OrganizationTrade Profiles 2011
109Download the data:www.wto.org/statistics
CO
UN
TRY
PR
OFI
LES
BASIC INDICATORS Population (thousands, 2010) 28 401 Rank in world trade, 2010 Exports ImportsGDP (million current US$, 2010) 237 804 Merchandise 23 25GDP (million current PPP US$, 2010) 414 395 excluding intra-EU trade 17 18Current account balance (million US$, 2009) 31 801 Commercial services 29 30Trade per capita (US$, 2008-2010) 13 840 excluding intra-EU trade 17 19Trade to GDP ratio (2008-2010) 177.8
2010 124
Exports of goods and services (volume, 2005=100) a 101Imports of goods and services (volume, 2005=100) a 103
TRADE POLICY
WTO accession 1 January 1995 Contribution to WTO budget (%, 2011) 1.154Trade Policy Review 25, 27 January 2010 Import duties collected (%, 2000-2001) GPA accession - in total tax revenue 6.1Tariffs and duty free imports to total imports 1.0
Tariff binding coverage (%) 84.3 Number of notifications to WTO and measures in force MFN tariffs Applied 2009 22
Simple average of import duties Goods RTAs - services EIAs notified to WTO 10 - 6All goods 23.1 8.0 Anti-dumping (30 June 2010) 9
Agricultural goods (AOA) 67.6 10.9 Countervailing duties (30 June 2010) ...Non-agricultural goods 14.9 7.6 Safeguards (22 October 2010) 0
2.9 0.71 - 1
75.9 Original panel / Appellate Body (AB) reports 1 - 0 77.3 Compliance panel / AB reports (Article 21.5 DSU) 1 - 0
Agricultural products 14.5 Agricultural products 9.7Fuels and mining products 17.8 Fuels and mining products 15.1Manufactures 67.0 Manufactures 73.2
1. Singapore 13.3 1. Japan 12.52. China 12.6 2. China 12.53. European Union (27) 10.7 3. Singapore 11.44. Japan 10.4 4. United States 10.65. United States 9.5 5. European Union (27) 10.2
COMMERCIAL SERVICES TRADE Value2010 2009
32 679 31 972
2010 0.89 0.91
Breakdown in economy's total exports By principal services item
14.4 37.2 56.0 24.8 29.6 37.9
INDUSTRIAL PROPERTY
Madrid Total ... 14 972
October 2011
Malaysia
Annual percentage change2005-2010 2009 2010
Real GDP (2005=100) 4 -2 70 -10 ...1 -12 ...
Final bound
Non ad-valorem duties (% total tariff lines) Number of disputes (complainant - defendant) Requests for consultation
in agricultural goods (AOA) in non-agricultural goods
2010Share in world total exports Share in world total imports
Breakdown in economy's total imports By principal services item
Transportation Transportation
Direct residents Direct non-residents
Travel Travel Other commercial services Other commercial services
164 1 922 2 086 5 438 9 534
Patent grants by patent office, 2008 Trademark registrations by office, 2009Residents Non-residents Total
Outstanding notifications in WTO Central Registry
MFN duty free imports (%, 2009)
a Refers to 2009 and to the average annual percentage change for 2005-2009.
Malaysia
World Trade OrganizationTrade Profiles 2011
110 Download the data:www.wto.org/statistics
Maldives
BASIC INDICATORS Population (thousands, 2010) 316 Rank in world trade, 2010 Exports ImportsGDP (million current US$, 2010) 1 480 Merchandise 172 162GDP (million current PPP US$, 2010) 1 795 excluding intra-EU trade 146 136Current account balance (million US$, 2010) - 463 Commercial services 122 163Trade per capita (US$, 2008-2010) 7 257 excluding intra-EU trade 96 137Trade to GDP ratio (2008-2010) 167.2
2010 138
Exports of goods and services (volume, 2005=100) ...Imports of goods and services (volume, 2005=100) ...
TRADE POLICY
WTO accession 31 May 1995 Contribution to WTO budget (%, 2011) 0.015Trade Policy Review 26, 28 October 2009 Import duties collected (%, 2007-2009) GPA accession - in total tax revenue 70.9Tariffs and duty free imports to total imports 12.6
Tariff binding coverage (%) 97.1 Number of notifications to WTO and measures in force MFN tariffs Applied 2010 30
Simple average of import duties Goods RTAs - services EIAs notified to WTO 2 - 0All goods 36.9 20.5 Anti-dumping (30 June 2010) ...
Agricultural goods (AOA) 48.0 18.4 Countervailing duties (30 June 2010) ...Non-agricultural goods 35.1 20.8 Safeguards (22 October 2010) 0
0.0 0.00 - 0
0.0 Original panel / Appellate Body (AB) reports 0 - 0 0.0 Compliance panel / AB reports (Article 21.5 DSU) 0 - 0
Agricultural products 62.0 Agricultural products 25.0Fuels and mining products 0.6 Fuels and mining products 15.6Manufactures 0.0 Manufactures 58.5
1. Thailand 49.0 1. Singapore 21.32. European Union (27) 31.0 2. United Arab Emirates 18.03. Sri Lanka 9.5 3. European Union (27) 11.54. Japan 2.9 4. India 10.45. Iran, Islamic Rep. of 2.9 5. Malaysia 7.7
COMMERCIAL SERVICES TRADE Value2010 2009 763 299
2010 0.02 0.01
Breakdown in economy's total exports By principal services item
5.2 54.0 93.5 34.3 1.2 11.7
INDUSTRIAL PROPERTY
Madrid Total ... 151
October 2011
Maldives
Annual percentage change2005-2010 2009 2010
Real GDP (2005=100) 7 -2 5... ... ...... ... ...
Final bound
Non ad-valorem duties (% total tariff lines) Number of disputes (complainant - defendant) Requests for consultation
in agricultural goods (AOA) in non-agricultural goods
2010Share in world total exports Share in world total imports
Breakdown in economy's total imports By principal services item
Transportation Transportation
Direct residents Direct non-residents
Travel Travel Other commercial services Other commercial services
... ... ... 151 ...
Patent grants by patent office Trademark registrations by office, 2007Residents Non-residents Total
Outstanding notifications in WTO Central Registry
MFN duty free imports (%, 2009)
a Breakdowns by destination/origin refer to 2008.
World Trade OrganizationTrade Profiles 2011
111Download the data:www.wto.org/statistics
CO
UN
TRY
PR
OFI
LES
BASIC INDICATORS Population (thousands, 2010) 15 370 Rank in world trade, 2010 Exports ImportsGDP (million current US$, 2010) 9 251 Merchandise 122 140GDP (million current PPP US$, 2010) 16 241 excluding intra-EU trade 97 114Current account balance (million US$, 2009) - 655 Commercial services 143 127Trade per capita (US$, 2007-2009) 363 excluding intra-EU trade 117 101Trade to GDP ratio (2007-2009) 63.3
2010 126
Exports of goods and services (volume, 2005=100) a 115Imports of goods and services (volume, 2005=100) a 107
TRADE POLICY
WTO accession 31 May 1995 Contribution to WTO budget (%, 2011) 0.015Trade Policy Review 4, 6 October 2010 Import duties collected (%, 2007-2009) GPA accession - in total tax revenue 14.6Tariffs and duty free imports to total imports 5.7
Tariff binding coverage (%) 40.2 Number of notifications to WTO and measures in force MFN tariffs Applied 2010 34
Simple average of import duties Goods RTAs - services EIAs notified to WTO 2 - 0All goods 29.0 11.9 Anti-dumping (30 June 2010) ...
Agricultural goods (AOA) 59.2 14.5 Countervailing duties (30 June 2010) ...Non-agricultural goods 14.1 11.5 Safeguards (22 October 2010) 0
0.0 0.00 - 0
0.0 Original panel / Appellate Body (AB) reports 0 - 0 11.2 Compliance panel / AB reports (Article 21.5 DSU) 0 - 0
Agricultural products 16.2 Agricultural products 14.4Fuels and mining products 1.5 Fuels and mining products 14.9Manufactures 5.0 Manufactures 69.3
1. South Africa 57.1 1. European Union (27) 24.02. Switzerland 12.1 2. Senegal 13.63. European Union (27) 8.9 3. Benin 9.94. Senegal 4.4 4. China 9.95. United States 3.2 5. United States 9.0
COMMERCIAL SERVICES TRADE Value2009 2008 335 813
2009 0.01 0.03
Breakdown in economy's total exports By principal services item
5.8 56.5 57.2 12.5 36.9 31.0
INDUSTRIAL PROPERTY
Madrid Total ... ...
October 2011
Mali
Annual percentage change2005-2010 2009 2010
Real GDP (2005=100) 5 5 57 ... ...4 ... ...
Final bound
Non ad-valorem duties (% total tariff lines) Number of disputes (complainant - defendant) Requests for consultation
in agricultural goods (AOA) in non-agricultural goods
2009Share in world total exports Share in world total imports
Breakdown in economy's total imports By principal services item
Transportation Transportation
Direct residents Direct non-residents
Travel Travel Other commercial services Other commercial services
... ... ... ... ...
Patent grants by patent office Trademark registrations by officeResidents Non-residents Total
Outstanding notifications in WTO Central Registry
MFN duty free imports (%, 2008)
a Refers to 2007 and to the average annual percentage change for 2005-2007.
Mali
World Trade OrganizationTrade Profiles 2011
112 Download the data:www.wto.org/statistics
Malta
BASIC INDICATORS Population (thousands, 2010) 413 Rank in world trade, 2010 Exports ImportsGDP (million current US$, 2009) 7 987 Merchandise 120 125GDP (million current PPP US$, 2009) 10 251 excluding intra-EU trade - -Current account balance (million US$, 2010) - 340 Commercial services 77 97Trade per capita (US$, 2008-2010) 31 509 excluding intra-EU trade - -Trade to GDP ratio (2007-2009) 165.7
2009 108
Exports of goods and services (volume, 2005=100) 102Imports of goods and services (volume, 2005=100) 94
TRADE POLICY
WTO accession 1 January 1995 Contribution to WTO budget (%, 2011) 0.040Trade Policy Review 6, 8 July 2011 Import duties collected GPA accession 1 May 2004 in total tax revenue ...Tariffs and duty free imports to total imports ...
Tariff binding coverage (%) 100 Number of notifications to WTO and measures in force MFN tariffs Applied 2010 18
Simple average of import duties Goods RTAs - services EIAs notified to WTO 31 - 10All goods 5.0 5.1 Anti-dumping (30 June 2010) 149
Agricultural goods (AOA) 12.3 12.8 Countervailing duties (30 June 2010) 8Non-agricultural goods 3.9 4.0 Safeguards (22 October 2010) 0
4.8 4.785 - 70
41.1 Original panel / Appellate Body (AB) reports 33 - 32 51.4 Compliance panel / AB reports (Article 21.5 DSU) 4 - 4
Agricultural products 7.1 Agricultural products 13.5Fuels and mining products 8.1 Fuels and mining products 9.7Manufactures 83.4 Manufactures 75.5
1. European Union (27) 42.9 1. European Union (27) 69.62. Singapore 12.5 2. China 4.03. United States 9.3 3. Switzerland 3.84. Hong Kong, China 6.5 4. Singapore 3.75. Libyan Arab Jamahiriya 5.1 5. United States 2.9
COMMERCIAL SERVICES TRADE Value2010 2009
3 487 2 115
2010 0.09 0.06
Breakdown in economy's total exports By principal services item
11.0 18.0 30.9 21.8 58.2 60.2
INDUSTRIAL PROPERTY
Madrid Total ... 947
October 2011
Malta
Annual percentage change2005-2009 2008 2009
Real GDP (2005=100) 2 3 -20 -3 -8
-1 -3 -11
Final bound
Non ad-valorem duties (% total tariff lines) Number of disputes (complainant - defendant) Requests for consultation
in agricultural goods (AOA) in non-agricultural goods
2010Share in world total exports Share in world total imports
Breakdown in economy's total imports By principal services item
Transportation Transportation
Direct residents Direct non-residents
Travel Travel Other commercial services Other commercial services
10 24 34 408 539
Patent grants by patent office, 2009 Trademark registrations by office, 2009Residents Non-residents Total
Outstanding notifications in WTO Central Registry
MFN duty free imports (%, 2009)
a Breakdowns by destination/origin refer to 2009.
World Trade OrganizationTrade Profiles 2011
113Download the data:www.wto.org/statistics
CO
UN
TRY
PR
OFI
LES
BASIC INDICATORS Population (thousands, 2010) 3 460 Rank in world trade, 2010 Exports ImportsGDP (million current US$, 2010) 3 636 Merchandise 127 151GDP (million current PPP US$, 2010) 6 676 excluding intra-EU trade 102 125Current account balance (million US$, 2010) ... Commercial services 166 140Trade per capita (US$, 2004-2006) 790 excluding intra-EU trade 140 114Trade to GDP ratio (2004-2006) 118.3
2010 121
Exports of goods and services (volume, 2005=100) ...Imports of goods and services (volume, 2005=100) ...
TRADE POLICY
WTO accession 31 May 1995 Contribution to WTO budget (%, 2011) 0.015Trade Policy Review 11, 13 September 2002 Import duties collected GPA accession - in total tax revenue ...Tariffs and duty free imports to total imports ...
Tariff binding coverage (%) 39.1 Number of notifications to WTO and measures in force MFN tariffs Applied 2010 44
Simple average of import duties Goods RTAs - services EIAs notified to WTO 0 - 0All goods 19.9 9.6 Anti-dumping (30 June 2010) ...
Agricultural goods (AOA) 37.8 11.8 Countervailing duties (30 June 2010) ...Non-agricultural goods 10.7 9.3 Safeguards (22 October 2010) 0
0.0 0.00 - 0
11.9 Original panel / Appellate Body (AB) reports 0 - 0 16.0 Compliance panel / AB reports (Article 21.5 DSU) 0 - 0
Agricultural products 11.5 Agricultural products 28.8Fuels and mining products 75.6 Fuels and mining products 35.2Manufactures 0.0 Manufactures 36.0
1. European Union (27) 20.7 1. European Union (27) 46.52. China 19.1 2. United Arab Emirates 12.13. Switzerland 18.6 3. China 6.84. Japan 16.2 4. Singapore 4.65. Swaziland 14.4 5. United States 3.7
COMMERCIAL SERVICES TRADE Value2009 2008 136 616
2009 0.00 0.02
Breakdown in economy's total exports By principal services item
... ...
... ...
... ...
INDUSTRIAL PROPERTY
Madrid Total ... ...
October 2011
Mauritania
Annual percentage change2005-2010 2009 2010
Real GDP (2005=100) 4 -1 5... ... ...... ... ...
Final bound
Non ad-valorem duties (% total tariff lines) Number of disputes (complainant - defendant) Requests for consultation
in agricultural goods (AOA) in non-agricultural goods
2009Share in world total exports Share in world total imports
Breakdown in economy's total imports By principal services item
Transportation Transportation
Direct residents Direct non-residents
Travel Travel Other commercial services Other commercial services
... ... ... ... ...
Patent grants by patent office Trademark registrations by officeResidents Non-residents Total
Outstanding notifications in WTO Central Registry
MFN duty free imports (%, 2008)
Mauritania
World Trade OrganizationTrade Profiles 2011
114 Download the data:www.wto.org/statistics
Mauritius
BASIC INDICATORS Population (thousands, 2010) 1 281 Rank in world trade, 2010 Exports ImportsGDP (million current US$, 2010) 9 729 Merchandise 123 123GDP (million current PPP US$, 2010) 17 394 excluding intra-EU trade 98 98Current account balance (million US$, 2010) - 800 Commercial services 82 101Trade per capita (US$, 2008-2010) 8 232 excluding intra-EU trade 56 75Trade to GDP ratio (2008-2010) 111.5
2010 124
Exports of goods and services (volume, 2005=100) 104Imports of goods and services (volume, 2005=100) 108
TRADE POLICY
WTO accession 1 January 1995 Contribution to WTO budget (%, 2011) 0.031Trade Policy Review 23, 25 April 2008 Import duties collected GPA accession - in total tax revenue ...Tariffs and duty free imports to total imports ...
Tariff binding coverage (%) 17.9 Number of notifications to WTO and measures in force MFN tariffs Applied 2010 34
Simple average of import duties Goods RTAs - services EIAs notified to WTO 2 - 0All goods 94.0 1.4 Anti-dumping (30 June 2010) ...
Agricultural goods (AOA) 119.7 1.0 Countervailing duties (30 June 2010) ...Non-agricultural goods 21.3 1.4 Safeguards (22 October 2010) 0
0.0 2.40 - 0
93.6 Original panel / Appellate Body (AB) reports 0 - 0 91.3 Compliance panel / AB reports (Article 21.5 DSU) 0 - 0
Agricultural products 31.5 Agricultural products 23.1Fuels and mining products 1.0 Fuels and mining products 20.2Manufactures 50.0 Manufactures 56.1
1. European Union (27) 63.7 1. European Union (27) 22.92. United States 10.9 2. India 22.33. Madagascar 5.5 3. China 13.34. South Africa 4.5 4. South Africa 8.45. Switzerland 1.8 5. Japan 3.3
COMMERCIAL SERVICES TRADE Value2010 2009
2 656 1 956
2010 0.07 0.06
Breakdown in economy's total exports By principal services item
14.1 28.1 48.4 20.4 37.5 51.6
INDUSTRIAL PROPERTY
Madrid Total ... 2 366
October 2011
Mauritius
Annual percentage change2005-2010 2009 2010
Real GDP (2005=100) 4 3 41 -5 -41 -5 -1
Final bound
Non ad-valorem duties (% total tariff lines) Number of disputes (complainant - defendant) Requests for consultation
in agricultural goods (AOA) in non-agricultural goods
2010Share in world total exports Share in world total imports
Breakdown in economy's total imports By principal services item
Transportation Transportation
Direct residents Direct non-residents
Travel Travel Other commercial services Other commercial services
... 3 3 ... ...
Patent grants by patent office, 1998 Trademark registrations by office, 2008Residents Non-residents Total
Outstanding notifications in WTO Central Registry
MFN duty free imports (%, 2009)
World Trade OrganizationTrade Profiles 2011
115Download the data:www.wto.org/statistics
CO
UN
TRY
PR
OFI
LES
BASIC INDICATORS Population (thousands, 2010) 113 423 Rank in world trade, 2010 Exports ImportsGDP (million current US$, 2010) 1 039 662 Merchandise 15 16GDP (million current PPP US$, 2010) 1 652 168 excluding intra-EU trade 10 10Current account balance (million US$, 2010) - 5 626 Commercial services 41 33Trade per capita (US$, 2008-2010) 5 302 excluding intra-EU trade 24 21Trade to GDP ratio (2008-2010) 59.0
2010 109
Exports of goods and services (volume, 2005=100) 125Imports of goods and services (volume, 2005=100) 120
TRADE POLICY
WTO accession 1 January 1995 Contribution to WTO budget (%, 2011) 1.855Trade Policy Review 11, 13 February 2008 Import duties collected GPA accession - in total tax revenue ...Tariffs and duty free imports to total imports ...
Tariff binding coverage (%) 100 Number of notifications to WTO and measures in force MFN tariffs Applied 2010 20
Simple average of import duties Goods RTAs - services EIAs notified to WTO 15 - 11All goods 36.1 9.0 Anti-dumping (30 June 2010) 38
Agricultural goods (AOA) 44.2 21.5 Countervailing duties (30 June 2010) 1Non-agricultural goods 34.9 7.1 Safeguards (22 October 2010) 0
0.9 0.721 - 14
34.9 Original panel / Appellate Body (AB) reports 6 - 6 42.8 Compliance panel / AB reports (Article 21.5 DSU) 0 - 1
Agricultural products 6.3 Agricultural products 7.8Fuels and mining products 16.7 Fuels and mining products 10.7Manufactures 74.5 Manufactures 79.5
1. United States 80.2 1. United States 48.22. European Union (27) 4.9 2. China 15.23. Canada 3.6 3. European Union (27) 10.84. China 1.4 4. Japan 5.05. Brazil 1.3 5. Korea, Republic of 4.2
COMMERCIAL SERVICES TRADE Value2010 2009
15 434 22 275
2010 0.42 0.63
Breakdown in economy's total exports By principal services item
9.4 12.9 76.9 32.7 13.7 54.4
INDUSTRIAL PROPERTY
Madrid Total ... 57 836
October 2011
Mexico
Annual percentage change2005-2010 2009 2010
Real GDP (2005=100) 2 -6 65 -15 254 -18 19
Final bound
Non ad-valorem duties (% total tariff lines) Number of disputes (complainant - defendant) Requests for consultation
in agricultural goods (AOA) in non-agricultural goods
2010Share in world total exports Share in world total imports
Breakdown in economy's total imports By principal services item
Transportation Transportation
Direct residents Direct non-residents
Travel Travel Other commercial services Other commercial services
280 10 290 1 044 736
Patent grants by patent office, 2009 Trademark registrations by office, 2009Residents Non-residents Total
Outstanding notifications in WTO Central Registry
MFN duty free imports (%, 2009)
World Trade OrganizationTrade Profiles 2011
117Download the data:www.wto.org/statistics
CO
UN
TRY
PR
OFI
LES
BASIC INDICATORS Population (thousands, 2010) 2 756 Rank in world trade, 2010 Exports ImportsGDP (million current US$, 2010) 6 083 Merchandise 119 133GDP (million current PPP US$, 2010) 11 017 excluding intra-EU trade 95 107Current account balance (million US$, 2009) - 342 Commercial services 135 135Trade per capita (US$, 2008-2010) 2 337 excluding intra-EU trade 109 109Trade to GDP ratio (2008-2010) 116.7
2010 137
Exports of goods and services (volume, 2005=100) ...Imports of goods and services (volume, 2005=100) ...
TRADE POLICY
WTO accession 29 January 1997 Contribution to WTO budget (%, 2011) 0.015Trade Policy Review 15, 17 March 2005 Import duties collected (%, 2007-2009) GPA accession Observer in total tax revenue 8.6Tariffs and duty free imports to total imports 3.2
Tariff binding coverage (%) 100 Number of notifications to WTO and measures in force MFN tariffs Applied 2010 23
Simple average of import duties Goods RTAs - services EIAs notified to WTO 0 - 0All goods 17.5 5.0 Anti-dumping (30 June 2010) ...
Agricultural goods (AOA) 18.9 5.1 Countervailing duties (30 June 2010) ...Non-agricultural goods 17.3 5.0 Safeguards (22 October 2010) 0
0.0 0.10 - 0
0.0 Original panel / Appellate Body (AB) reports 0 - 0 1.4 Compliance panel / AB reports (Article 21.5 DSU) 0 - 0
Agricultural products 5.1 Agricultural products 9.9Fuels and mining products 84.1 Fuels and mining products 19.7Manufactures 2.0 Manufactures 69.5
1. China 74.2 1. Russian Federation 34.32. Canada 9.5 2. China 31.13. European Union (27) 5.6 3. European Union (27) 9.24. United States 3.4 4. Korea, Republic of 5.65. Russian Federation 3.0 5. Japan 5.1
COMMERCIAL SERVICES TRADE Value2010 2009 487 753
2010 0.01 0.02
Breakdown in economy's total exports By principal services item
35.7 38.5 50.1 34.4 14.2 27.1
INDUSTRIAL PROPERTY
Madrid Total 1 398 1 398
October 2011
Mongolia
Annual percentage change2005-2010 2009 2010
Real GDP (2005=100) 6 -1 6... ... ...... ... ...
Final bound
Non ad-valorem duties (% total tariff lines) Number of disputes (complainant - defendant) Requests for consultation
in agricultural goods (AOA) in non-agricultural goods
2010Share in world total exports Share in world total imports
Breakdown in economy's total imports By principal services item
Transportation Transportation
Direct residents Direct non-residents
Travel Travel Other commercial services Other commercial services
91 83 174 ... ...
Patent grants by patent office, 2006 Trademark registrations by office, 2009Residents Non-residents Total
Outstanding notifications in WTO Central Registry
MFN duty free imports (%, 2007)
a Breakdowns by destination/origin refer to 2007.
Mongolia
World Trade OrganizationTrade Profiles 2011
118 Download the data:www.wto.org/statistics
Montenegro
BASIC INDICATORS Population (thousands, 2010) 631 Rank in world trade, 2010 Exports ImportsGDP (million current US$, 2010) 4 004 Merchandise 159 145GDP (million current PPP US$, 2010) 8 005 excluding intra-EU trade 133 119Current account balance (million US$, 2010) - 1 031 Commercial services 115 157Trade per capita (US$, 2008-2010) 7 474 excluding intra-EU trade 89 131Trade to GDP ratio (2008-2010) 111.6
2010 123
Exports of goods and services (volume, 2005=100) ...Imports of goods and services (volume, 2005=100) ...
TRADE POLICY
WTO accession Observer Contribution to WTO budget -Trade Policy Review - Import duties collected GPA accession - in total tax revenue ...Tariffs and duty free imports to total imports ...
Tariff binding coverage (%) - Number of notifications to WTO and measures in force MFN tariffs Applied 2010 -
Simple average of import duties Goods RTAs - services EIAs notified to WTO 3 - 1All goods - 4.9 Anti-dumping -
Agricultural products 18.8 Agricultural products 24.6Fuels and mining products 52.7 Fuels and mining products 16.7Manufactures 20.5 Manufactures 57.2
1. European Union (27) 55.9 1. European Union (27) 37.72. Serbia 28.2 2. Serbia 26.23. Bosnia and Herzegovina 7.3 3. Bosnia and Herzegovina 7.54. Albania 2.5 4. China 5.45. Turkey 1.5 5. Croatia 4.8 Unspecified destinations 0.1 Unspecified origins 5.0
COMMERCIAL SERVICES TRADE Value2010 2009 989 386
2010 0.03 0.01
Breakdown in economy's total exports By principal services item
17.4 25.5 66.7 11.6 15.9 62.9
INDUSTRIAL PROPERTY
Madrid Total 4 036 4 036
October 2011
Montenegro
Annual percentage change2005-2010 2009 2010
Real GDP (2005=100) 4 -6 1... ... ...... ... ...
Final bound
Non ad-valorem duties (% total tariff lines) Number of disputes (complainant - defendant) Requests for consultation
in agricultural goods (AOA) in non-agricultural goods
2010Share in world total exports Share in world total imports
Breakdown in economy's total imports By principal services item
Transportation Transportation
Direct residents Direct non-residents
Travel Travel Other commercial services Other commercial services
... ... ... ... ...
Patent grants by patent office Trademark registrations by office, 2009Residents Non-residents Total
Outstanding notifications in WTO Central Registry
MFN duty free imports (%, 2009)
World Trade OrganizationTrade Profiles 2011
119Download the data:www.wto.org/statistics
CO
UN
TRY
PR
OFI
LES
BASIC INDICATORS Population (thousands, 2010) 31 951 Rank in world trade, 2010 Exports ImportsGDP (million current US$, 2010) 91 196 Merchandise 71 56GDP (million current PPP US$, 2010) 151 638 excluding intra-EU trade 49 38Current account balance (million US$, 2010) - 3 925 Commercial services 46 65Trade per capita (US$, 2008-2010) 2 195 excluding intra-EU trade 29 46Trade to GDP ratio (2008-2010) 76.8
2010 127
Exports of goods and services (volume, 2005=100) 115Imports of goods and services (volume, 2005=100) 137
TRADE POLICY
WTO accession 1 January 1995 Contribution to WTO budget (%, 2011) 0.181Trade Policy Review 24, 26 June 2009 Import duties collected (%, 2007-2009) GPA accession - in total tax revenue 7.2Tariffs and duty free imports to total imports 4.2
Tariff binding coverage (%) 100 Number of notifications to WTO and measures in force MFN tariffs Applied 2010 38
Simple average of import duties Goods RTAs - services EIAs notified to WTO 6 - 1All goods 41.3 18.1 Anti-dumping (30 June 2010) ...
Agricultural goods (AOA) 54.3 42.0 Countervailing duties (30 June 2010) ...Non-agricultural goods 39.3 14.4 Safeguards (22 October 2010) 1
0.0 0.00 - 0
0.0 Original panel / Appellate Body (AB) reports 0 - 0 0.6 Compliance panel / AB reports (Article 21.5 DSU) 0 - 0
Agricultural products 21.0 Agricultural products 14.0Fuels and mining products 15.1 Fuels and mining products 28.9Manufactures 63.3 Manufactures 54.6
1. European Union (27) 59.7 1. European Union (27) 49.22. India 6.1 2. China 8.43. Brazil 3.8 3. United States 7.14. United States 3.8 4. Saudi Arabia, Kingdom of 6.05. Singapore 1.9 5. Russian Federation 3.8
COMMERCIAL SERVICES TRADE Value2010 2009
12 138 5 724
2010 0.33 0.16
Breakdown in economy's total exports By principal services item
17.7 46.1 55.2 21.0 27.1 32.9
INDUSTRIAL PROPERTY
Madrid Total 3 760 3 760
October 2011
Morocco
Annual percentage change2005-2010 2009 2010
Real GDP (2005=100) 5 5 33 -13 57 -6 5
Final bound
Non ad-valorem duties (% total tariff lines) Number of disputes (complainant - defendant) Requests for consultation
in agricultural goods (AOA) in non-agricultural goods
2010Share in world total exports Share in world total imports
Breakdown in economy's total imports By principal services item
Transportation Transportation
Direct residents Direct non-residents
Travel Travel Other commercial services Other commercial services
115 854 969 ... ...
Patent grants by patent office, 2008 Trademark registrations by office, 2009Residents Non-residents Total
Outstanding notifications in WTO Central Registry
MFN duty free imports (%, 2009)
Morocco
World Trade OrganizationTrade Profiles 2011
120 Download the data:www.wto.org/statistics
Mozambique
BASIC INDICATORS Population (thousands, 2010) 23 391 Rank in world trade, 2010 Exports ImportsGDP (million current US$, 2010) 9 586 Merchandise 117 120GDP (million current PPP US$, 2010) 21 871 excluding intra-EU trade 93 95Current account balance (million US$, 2010) - 913 Commercial services 130 119Trade per capita (US$, 2008-2010) 313 excluding intra-EU trade 104 93Trade to GDP ratio (2008-2010) 73.4
2010 142
Exports of goods and services (volume, 2005=100) 137Imports of goods and services (volume, 2005=100) 136
TRADE POLICY
WTO accession 26 August 1995 Contribution to WTO budget (%, 2011) 0.020Trade Policy Review 22, 24 April 2009 Import duties collected GPA accession - in total tax revenue ...Tariffs and duty free imports to total imports ...
Tariff binding coverage (%) 13.6 Number of notifications to WTO and measures in force MFN tariffs Applied 2010 36
Simple average of import duties Goods RTAs - services EIAs notified to WTO 2 - 0All goods 97.5 10.1 Anti-dumping (30 June 2010) ...
Agricultural goods (AOA) 100.0 13.8 Countervailing duties (30 June 2010) ...Non-agricultural goods 11.3 9.5 Safeguards (22 October 2010) 0
0.0 0.00 - 0
2.2 Original panel / Appellate Body (AB) reports 0 - 0 9.8 Compliance panel / AB reports (Article 21.5 DSU) 0 - 0
Agricultural products 13.8 Agricultural products 10.0Fuels and mining products 51.3 Fuels and mining products 16.2Manufactures 2.3 Manufactures 39.3
1. European Union (27) 61.4 1. South Africa 34.42. South Africa 20.8 2. European Union (27) 30.63. China 3.5 3. India 5.74. Zimbabwe 3.2 4. China 3.65. India 1.4 5. Japan 3.5
COMMERCIAL SERVICES TRADE Value2010 2009 576
1 086
2010 0.02 0.03
Breakdown in economy's total exports By principal services item
28.2 26.9 34.2 23.1 37.5 50.0
INDUSTRIAL PROPERTY
Madrid Total 870 870
October 2011
Mozambique
Annual percentage change2005-2010 2009 2010
Real GDP (2005=100) 7 6 76 2 26 14 2
Final bound
Non ad-valorem duties (% total tariff lines) Number of disputes (complainant - defendant) Requests for consultation
in agricultural goods (AOA) in non-agricultural goods
2010Share in world total exports Share in world total imports
Breakdown in economy's total imports By principal services item
Transportation Transportation
Direct residents Direct non-residents
Travel Travel Other commercial services Other commercial services
18 22 40 ... ...
Patent grants by patent office, 2007 Trademark registrations by office, 2009Residents Non-residents Total
Outstanding notifications in WTO Central Registry
MFN duty free imports (%, 2009)
World Trade OrganizationTrade Profiles 2011
121Download the data:www.wto.org/statistics
CO
UN
TRY
PR
OFI
LES
BASIC INDICATORS Population (thousands, 2010) 47 963 Rank in world trade, 2010 Exports ImportsGDP (million current US$, 2009) 35 226 Merchandise 88 116GDP (million current PPP US$, 2009) 71 962 excluding intra-EU trade 64 91Current account balance (million US$, 2006) 802 Commercial services 146 138Trade per capita (US$, 2004-2006) 141 excluding intra-EU trade 120 112Trade to GDP ratio (2004-2006) 52.8
2009 138
Exports of goods and services (volume, 2005=100) ...Imports of goods and services (volume, 2005=100) ...
TRADE POLICY
WTO accession 1 January 1995 Contribution to WTO budget (%, 2011) 0.021Trade Policy Review ... Import duties collected GPA accession - in total tax revenue ...Tariffs and duty free imports to total imports ...
Tariff binding coverage (%) 17.6 Number of notifications to WTO and measures in force MFN tariffs Applied 2008 24
Simple average of import duties Goods RTAs - services EIAs notified to WTO 7 - 3All goods 83.4 5.6 Anti-dumping (30 June 2010) ...
Agricultural goods (AOA) 103.6 8.7 Countervailing duties (30 June 2010) ...Non-agricultural goods 21.5 5.1 Safeguards (22 October 2010) 0
0.1 0.00 - 0
... Original panel / Appellate Body (AB) reports 0 - 0
2006Share in world total exports Share in world total imports
Breakdown in economy's total imports By principal services item
Transportation Transportation
Direct residents Direct non-residents
Travel Travel Other commercial services Other commercial services
... ... ... ... ...
Patent grants by patent office Trademark registrations by officeResidents Non-residents Total
Outstanding notifications in WTO Central Registry
MFN duty free imports
Myanmar
World Trade OrganizationTrade Profiles 2011
122 Download the data:www.wto.org/statistics
Namibia
BASIC INDICATORS Population (thousands, 2010) 2 283 Rank in world trade, 2010 Exports ImportsGDP (million current US$, 2010) 12 170 Merchandise 111 110GDP (million current PPP US$, 2010) 14 672 excluding intra-EU trade 87 85Current account balance (million US$, 2009) 120 Commercial services 131 137Trade per capita (US$, 2008-2010) 4 195 excluding intra-EU trade 105 111Trade to GDP ratio (2008-2010) 93.1
2010 122
Exports of goods and services (volume, 2005=100) 66Imports of goods and services (volume, 2005=100) 78
TRADE POLICY
WTO accession 1 January 1995 Contribution to WTO budget (%, 2011) 0.022Trade Policy Review 4, 6 November 2009 Import duties collected GPA accession - in total tax revenue ...Tariffs and duty free imports to total imports ...
Tariff binding coverage (%) 96.4 Number of notifications to WTO and measures in force MFN tariffs Applied 2010 6
Simple average of import duties Goods RTAs - services EIAs notified to WTO 3 - 0All goods 19.0 7.7 Anti-dumping (30 June 2010) ...
Agricultural goods (AOA) 39.5 9.1 Countervailing duties (30 June 2010) ...Non-agricultural goods 15.8 7.4 Safeguards (22 October 2010) 0
0.0 2.20 - 0
30.9 Original panel / Appellate Body (AB) reports 0 - 0 50.1 Compliance panel / AB reports (Article 21.5 DSU) 0 - 0
Agricultural products 34.6 Agricultural products 6.2Fuels and mining products 35.3 Fuels and mining products 31.8Manufactures 20.0 Manufactures 58.1
1. South Africa 31.8 1. South Africa 67.82. European Union (27) 28.8 2. European Union (27) 15.83. Angola 8.6 3. India 3.54. Canada 7.1 4. China 3.35. United States 5.5 5. United States 2.0
COMMERCIAL SERVICES TRADE Value2010 2009 572 705
2010 0.02 0.02
Breakdown in economy's total exports By principal services item
24.2 35.3 69.8 18.8 6.0 45.9
INDUSTRIAL PROPERTY
Madrid Total 858 858
October 2011
Namibia
Annual percentage change2005-2010 2009 2010
Real GDP (2005=100) 4 -1 5-8 -14 -42-5 5 -60
Final bound
Non ad-valorem duties (% total tariff lines) Number of disputes (complainant - defendant) Requests for consultation
in agricultural goods (AOA) in non-agricultural goods
Agricultural products 22.3 Agricultural products 13.0Fuels and mining products 4.6 Fuels and mining products 18.3Manufactures 70.0 Manufactures 54.9
1. India 65.5 1. India 57.02. European Union (27) 11.1 2. China 10.53. United States 6.3 3. United Arab Emirates 8.94. Bangladesh 5.5 4. European Union (27) 4.15. Bhutan 2.6 5. Indonesia 2.2
COMMERCIAL SERVICES TRADE Value2010 2009 584 846
2010 0.02 0.02
Breakdown in economy's total exports By principal services item
6.8 33.2 59.0 47.5 34.2 19.2
INDUSTRIAL PROPERTY
Madrid Total ... 1 132
October 2011
Nepal
Annual percentage change2005-2010 2009 2010
Real GDP (2005=100) 4 4 5... ... ...... ... ...
Final bound
Non ad-valorem duties (% total tariff lines) Number of disputes (complainant - defendant) Requests for consultation
in agricultural goods (AOA) in non-agricultural goods
2010Share in world total exports Share in world total imports
Breakdown in economy's total imports By principal services item
Transportation Transportation
Direct residents Direct non-residents
Travel Travel Other commercial services Other commercial services
1 ... 1 612 520
Patent grants by patent office, 2007 Trademark registrations by office, 2007Residents Non-residents Total
Outstanding notifications in WTO Central Registry
MFN duty free imports (%, 2009)
Nepal
World Trade OrganizationTrade Profiles 2011
124 Download the data:www.wto.org/statistics
Netherlands
BASIC INDICATORS Population (thousands, 2010) 16 612 Rank in world trade, 2010 Exports ImportsGDP (million current US$, 2010) 783 413 Merchandise 5 7GDP (million current PPP US$, 2010) 705 601 excluding intra-EU trade - -Current account balance (million US$, 2010) 60 026 Commercial services 9 10Trade per capita (US$, 2008-2010) 68 319 excluding intra-EU trade - -Trade to GDP ratio (2008-2010) 138.2
2010 107
Exports of goods and services (volume, 2005=100) a 108Imports of goods and services (volume, 2005=100) a 109
TRADE POLICY
WTO accession 1 January 1995 Contribution to WTO budget (%, 2011) 3.233Trade Policy Review 6, 8 July 2011 Import duties collected GPA accession 1 January 1996 in total tax revenue ...Tariffs and duty free imports to total imports ...
Tariff binding coverage (%) 100 Number of notifications to WTO and measures in force MFN tariffs Applied 2010 18
Simple average of import duties Goods RTAs - services EIAs notified to WTO 31 - 10All goods 5.0 5.1 Anti-dumping (30 June 2010) 149
Agricultural goods (AOA) 12.3 12.8 Countervailing duties (30 June 2010) 8Non-agricultural goods 3.9 4.0 Safeguards (22 October 2010) 0
4.8 4.785 - 71
41.1 Original panel / Appellate Body (AB) reports 33 - 32 51.4 Compliance panel / AB reports (Article 21.5 DSU) 4 - 4
Agricultural products 16.4 Agricultural products 11.9Fuels and mining products 19.2 Fuels and mining products 23.8Manufactures 61.5 Manufactures 61.7
1. European Union (27) 74.6 1. European Union (27) 55.32. United States 4.5 2. United States 8.43. Switzerland 1.5 3. China 8.04. China 1.5 4. Russian Federation 3.55. Russian Federation 1.4 5. Japan 2.6
COMMERCIAL SERVICES TRADE Value2010 2009
113 257 106 103
2010 3.07 3.02
Breakdown in economy's total exports By principal services item
22.3 17.8 11.5 18.5 66.1 63.7
INDUSTRIAL PROPERTY
Madrid Total ... ...
October 2011
Netherlands
Annual percentage change2005-2010 2009 2010
Real GDP (2005=100) 1 -4 22 -8 ...2 -8 ...
Final bound
Non ad-valorem duties (% total tariff lines) Number of disputes (complainant - defendant) Requests for consultation
in agricultural goods (AOA) in non-agricultural goods
2010Share in world total exports Share in world total imports
Breakdown in economy's total imports By principal services item
Transportation Transportation
Direct residents Direct non-residents
Travel Travel Other commercial services Other commercial services
1 643 305 1 948 ... ...
Patent grants by patent office, 2009 Trademark registrations by officeResidents Non-residents Total
Outstanding notifications in WTO Central Registry
MFN duty free imports (%, 2009)
a Refers to 2009 and to the average annual percentage change for 2005-2009. b Breakdowns by destination/origin refer to 2009.
World Trade OrganizationTrade Profiles 2011
125Download the data:www.wto.org/statistics
CO
UN
TRY
PR
OFI
LES
BASIC INDICATORS Population (thousands, 2010) 4 368 Rank in world trade, 2010 Exports ImportsGDP (million current US$, 2009) 126 679 Merchandise 60 58GDP (million current PPP US$, 2010) 130 662 excluding intra-EU trade 43 40Current account balance (million US$, 2010) - 3 270 Commercial services 53 57Trade per capita (US$, 2008-2010) 17 507 excluding intra-EU trade 35 39Trade to GDP ratio (2007-2009) 58.1
2010 107
Exports of goods and services (volume, 2005=100) a 103Imports of goods and services (volume, 2005=100) a 88
TRADE POLICY
WTO accession 1 January 1995 Contribution to WTO budget (%, 2011) 0.237Trade Policy Review 10, 12 June 2009 Import duties collected (%, 2005-2007) GPA accession Observer in total tax revenue 2.3Tariffs and duty free imports to total imports 2.6
Tariff binding coverage (%) 100.0 Number of notifications to WTO and measures in force MFN tariffs Applied 2009 6
Simple average of import duties Goods RTAs - services EIAs notified to WTO 8 - 7All goods 10.2 2.1 Anti-dumping (30 June 2010) 12
Agricultural goods (AOA) 5.9 1.5 Countervailing duties (30 June 2010) 0Non-agricultural goods 10.8 2.2 Safeguards (22 October 2010) 0
3.3 0.47 - 0
47.5 Original panel / Appellate Body (AB) reports 4 - 0 65.6 Compliance panel / AB reports (Article 21.5 DSU) 2 - 0
Agricultural products 62.3 Agricultural products 11.0Fuels and mining products 8.6 Fuels and mining products 17.5Manufactures 22.6 Manufactures 68.8
1. Australia 23.0 1. Australia 18.22. China 11.1 2. China 16.03. European Union (27) 10.9 3. European Union (27) 14.74. United States 8.6 4. United States 10.45. Japan 7.8 5. Japan 7.3
COMMERCIAL SERVICES TRADE Value2010 2009
8 594 9 021
2010 0.23 0.26
Breakdown in economy's total exports By principal services item
20.6 30.5 56.5 33.4 22.9 36.0
INDUSTRIAL PROPERTY
Madrid Total ... 8 441
October 2011
New Zealand
Annual percentage change2005-2010 2009 2010
Real GDP (2005=100) 1 1 31 0 ...
-3 -15 ...
Final bound
Non ad-valorem duties (% total tariff lines) Number of disputes (complainant - defendant) Requests for consultation
in agricultural goods (AOA) in non-agricultural goods
2010Share in world total exports Share in world total imports
Breakdown in economy's total imports By principal services item
Transportation Transportation
Direct residents Direct non-residents
Travel Travel Other commercial services Other commercial services
457 2 955 3 412 4 356 4 085
Patent grants by patent office, 2009 Trademark registrations by office, 2009Residents Non-residents Total
Outstanding notifications in WTO Central Registry
MFN duty free imports (%, 2009)
a Refers to 2009 and to the average annual percentage change for 2005-2009.
New Zealand
World Trade OrganizationTrade Profiles 2011
126 Download the data:www.wto.org/statistics
Nicaragua
BASIC INDICATORS Population (thousands, 2010) 5 788 Rank in world trade, 2010 Exports ImportsGDP (million current US$, 2010) 6 551 Merchandise 128 126GDP (million current PPP US$, 2010) 16 008 excluding intra-EU trade 103 100Current account balance (million US$, 2010) - 963 Commercial services 139 141Trade per capita (US$, 2008-2010) 1 447 excluding intra-EU trade 113 115Trade to GDP ratio (2008-2010) 129.6
2010 114
Exports of goods and services (volume, 2005=100) 175Imports of goods and services (volume, 2005=100) 118
TRADE POLICY
WTO accession 3 September 1995 Contribution to WTO budget (%, 2011) 0.022Trade Policy Review 24, 26 July 2006 Import duties collected (%, 2000-2001) GPA accession - in total tax revenue 10.0Tariffs and duty free imports to total imports 2.5
Tariff binding coverage (%) 100 Number of notifications to WTO and measures in force MFN tariffs Applied 2010 12
Simple average of import duties Goods RTAs - services EIAs notified to WTO 5 - 3All goods 40.7 5.6 Anti-dumping (30 June 2010) ...
Agricultural goods (AOA) 43.4 11.0 Countervailing duties (30 June 2010) ...Non-agricultural goods 40.3 4.8 Safeguards (22 October 2010) 0
0.0 0.31 - 2
24.1 Original panel / Appellate Body (AB) reports 0 - 0 61.7 Compliance panel / AB reports (Article 21.5 DSU) 0 - 0
Agricultural products 78.5 Agricultural products 17.2Fuels and mining products 3.0 Fuels and mining products 22.1Manufactures 6.3 Manufactures 60.7
1. United States 32.8 1. United States 20.72. Bolivarian Rep. of Venezuela 13.5 2. Bolivarian Rep. of Venezuela 17.73. El Salvador 10.7 3. China 8.74. European Union (27) 10.4 4. Costa Rica 8.25. Canada 8.5 5. Mexico 7.7
COMMERCIAL SERVICES TRADE Value2010 2009 430 660
2010 0.01 0.02
Breakdown in economy's total exports By principal services item
11.0 49.7 71.7 31.1 17.3 19.1
INDUSTRIAL PROPERTY
Madrid Total ... 2 894
October 2011
Nicaragua
Annual percentage change2005-2010 2009 2010
Real GDP (2005=100) 3 -1 412 1 373 -8 2
Final bound
Non ad-valorem duties (% total tariff lines) Number of disputes (complainant - defendant) Requests for consultation
in agricultural goods (AOA) in non-agricultural goods
2010Share in world total exports Share in world total imports
Breakdown in economy's total imports By principal services item
Transportation Transportation
Direct residents Direct non-residents
Travel Travel Other commercial services Other commercial services
7 129 136 404 2 490
Patent grants by patent office, 2000 Trademark registrations by office, 2000Residents Non-residents Total
Outstanding notifications in WTO Central Registry
MFN duty free imports (%, 2009)
World Trade OrganizationTrade Profiles 2011
127Download the data:www.wto.org/statistics
CO
UN
TRY
PR
OFI
LES
BASIC INDICATORS Population (thousands, 2010) 15 512 Rank in world trade, 2010 Exports ImportsGDP (million current US$, 2010) 5 549 Merchandise 146 148GDP (million current PPP US$, 2010) 11 209 excluding intra-EU trade 120 122Current account balance (million US$, 2008) - 651 Commercial services 174 133Trade per capita (US$, 2007-2009) 199 excluding intra-EU trade 148 107Trade to GDP ratio (2007-2009) 57.9
2010 128
Exports of goods and services (volume, 2005=100) ...Imports of goods and services (volume, 2005=100) ...
TRADE POLICY
WTO accession 13 December 1996 Contribution to WTO budget (%, 2011) 0.015Trade Policy Review 11, 13 November 2009 Import duties collected GPA accession - in total tax revenue ...Tariffs and duty free imports to total imports ...
Tariff binding coverage (%) 96.7 Number of notifications to WTO and measures in force MFN tariffs Applied 2010 38
Simple average of import duties Goods RTAs - services EIAs notified to WTO 2 - 0All goods 44.6 11.9 Anti-dumping (30 June 2010) ...
Agricultural goods (AOA) 84.2 14.5 Countervailing duties (30 June 2010) ...Non-agricultural goods 38.3 11.5 Safeguards (22 October 2010) 0
0.0 0.00 - 0
0.0 Original panel / Appellate Body (AB) reports 0 - 0 11.1 Compliance panel / AB reports (Article 21.5 DSU) 0 - 0
Agricultural products 14.0 Agricultural products 21.9Fuels and mining products 33.7 Fuels and mining products 13.7Manufactures 5.2 Manufactures 37.9
1. United States 16.7 1. China 43.82. Japan 16.6 2. European Union (27) 25.33. European Union (27) 15.9 3. United States 6.14. Switzerland 15.6 4. Nigeria 3.95. Nigeria 11.1 5. Japan 3.3
COMMERCIAL SERVICES TRADE Value2009 2008 100 735
2009 0.00 0.02
Breakdown in economy's total exports By principal services item
7.8 72.6 66.1 7.3 26.1 20.1
INDUSTRIAL PROPERTY
Madrid Total ... ...
October 2011
Niger
Annual percentage change2005-2010 2009 2010
Real GDP (2005=100) 5 -1 9... ... ...... ... ...
Final bound
Non ad-valorem duties (% total tariff lines) Number of disputes (complainant - defendant) Requests for consultation
in agricultural goods (AOA) in non-agricultural goods
2009Share in world total exports Share in world total imports
Breakdown in economy's total imports By principal services item
Transportation Transportation
Direct residents Direct non-residents
Travel Travel Other commercial services Other commercial services
... ... ... ... ...
Patent grants by patent office Trademark registrations by officeResidents Non-residents Total
Outstanding notifications in WTO Central Registry
MFN duty free imports (%, 2009)
Niger
World Trade OrganizationTrade Profiles 2011
128 Download the data:www.wto.org/statistics
Nigeria
BASIC INDICATORS Population (thousands, 2010) 158 423 Rank in world trade, 2010 Exports ImportsGDP (million current US$, 2010) 193 669 Merchandise 37 50GDP (million current PPP US$, 2010) 374 343 excluding intra-EU trade 24 32Current account balance (million US$, 2010) 2 476 Commercial services 83 36Trade per capita (US$, 2008-2010) 874 excluding intra-EU trade 57 22Trade to GDP ratio (2008-2010) 71.1
2010 138
Exports of goods and services (volume, 2005=100) ...Imports of goods and services (volume, 2005=100) ...
TRADE POLICY
WTO accession 1 January 1995 Contribution to WTO budget (%, 2011) 0.328Trade Policy Review 28, 30 June 2011 Import duties collected (%, 2006-2008) GPA accession - in total tax revenue 0.0Tariffs and duty free imports to total imports 0.0
Tariff binding coverage (%) 19.1 Number of notifications to WTO and measures in force MFN tariffs Applied 2010 9
Simple average of import duties Goods RTAs - services EIAs notified to WTO 2 - 0All goods 119.1 11.7 Anti-dumping (30 June 2010) ...
Agricultural goods (AOA) 150.0 15.5 Countervailing duties (30 June 2010) ...Non-agricultural goods 48.6 11.2 Safeguards (22 October 2010) 0
0.0 0.00 - 0
0.0 Original panel / Appellate Body (AB) reports 0 - 0 2.9 Compliance panel / AB reports (Article 21.5 DSU) 0 - 0
Agricultural products 5.2 Agricultural products 11.0Fuels and mining products 87.7 Fuels and mining products 2.4Manufactures 7.1 Manufactures 86.5
1. United States 34.4 1. European Union (27) 21.82. European Union (27) 22.4 2. United States 17.93. India 10.5 3. China 16.64. Brazil 7.0 4. Antigua and Barbuda 5.65. Equatorial Guinea 3.1 5. India 5.4
COMMERCIAL SERVICES TRADE Value2010 2009
2 613 20 163
2010 0.07 0.57
Breakdown in economy's total exports By principal services item
75.1 43.2 21.9 27.7 3.1 29.1
INDUSTRIAL PROPERTY
Madrid Total ... ...
October 2011
Nigeria
Annual percentage change2005-2010 2009 2010
Real GDP (2005=100) 7 7 8... ... ...... ... ...
Final bound
Non ad-valorem duties (% total tariff lines) Number of disputes (complainant - defendant) Requests for consultation
in agricultural goods (AOA) in non-agricultural goods
2010Share in world total exports Share in world total imports
Breakdown in economy's total imports By principal services item
Transportation Transportation
Direct residents Direct non-residents
Travel Travel Other commercial services Other commercial services
... ... ... ... ...
Patent grants by patent office Trademark registrations by officeResidents Non-residents Total
Outstanding notifications in WTO Central Registry
MFN duty free imports (%, 2009)
World Trade OrganizationTrade Profiles 2011
129Download the data:www.wto.org/statistics
CO
UN
TRY
PR
OFI
LES
BASIC INDICATORS Population (thousands, 2010) 4 885 Rank in world trade, 2010 Exports ImportsGDP (million current US$, 2010) 414 462 Merchandise 31 36GDP (million current PPP US$, 2010) 277 941 excluding intra-EU trade 21 24Current account balance (million US$, 2010) 53 243 Commercial services 25 24Trade per capita (US$, 2008-2010) 62 121 excluding intra-EU trade 14 15Trade to GDP ratio (2008-2010) 72.6
2010 105
Exports of goods and services (volume, 2005=100) a 99Imports of goods and services (volume, 2005=100) a 109
TRADE POLICY
WTO accession 1 January 1995 Contribution to WTO budget (%, 2011) 0.896Trade Policy Review 22, 24 October 2008 Import duties collected (%, 2007-2009) GPA accession 1 January 1996 in total tax revenue 0.3Tariffs and duty free imports to total imports 0.3
Tariff binding coverage (%) 100 Number of notifications to WTO and measures in force MFN tariffs Applied 2010 4
Simple average of import duties Goods RTAs - services EIAs notified to WTO 22 - 6All goods 20.1 7.0 Anti-dumping (30 June 2010) ...
Agricultural goods (AOA) 131.1 49.4 Countervailing duties (30 June 2010) ...Non-agricultural goods 3.1 0.5 Safeguards (22 October 2010) 0
10.6 6.84 - 0
46.3 Original panel / Appellate Body (AB) reports 2 - 0 96.2 Compliance panel / AB reports (Article 21.5 DSU) 0 - 0
Agricultural products 7.7 Agricultural products 9.4Fuels and mining products 70.6 Fuels and mining products 14.2Manufactures 18.0 Manufactures 74.4
1. European Union (27) 81.2 1. European Union (27) 63.32. United States 5.0 2. China 8.53. China 1.7 3. United States 5.54. Canada 1.7 4. Canada 3.25. Korea, Republic of 1.6 5. Korea, Republic of 3.0
COMMERCIAL SERVICES TRADE Value2010 2009
40 106 41 839
2010 1.09 1.19
Breakdown in economy's total exports By principal services item
39.5 27.3 11.5 33.5 49.0 39.2
INDUSTRIAL PROPERTY
Madrid Total 6 761 11 534
October 2011
Norway
Annual percentage change2005-2010 2009 2010
Real GDP (2005=100) 1 -1 00 -4 ...2 -11 ...
Final bound
Non ad-valorem duties (% total tariff lines) Number of disputes (complainant - defendant) Requests for consultation
in agricultural goods (AOA) in non-agricultural goods
2010Share in world total exports Share in world total imports
Breakdown in economy's total imports By principal services item
Transportation Transportation
Direct residents Direct non-residents
Travel Travel Other commercial services Other commercial services
377 1 254 1 631 2 401 2 372
Patent grants by patent office, 2008 Trademark registrations by office, 2009Residents Non-residents Total
Outstanding notifications in WTO Central Registry
MFN duty free imports (%, 2009)
a Refers to 2009 and to the average annual percentage change for 2005-2009.
Norway
World Trade OrganizationTrade Profiles 2011
130 Download the data:www.wto.org/statistics
Oman
BASIC INDICATORS Population (thousands, 2010) 2 782 Rank in world trade, 2010 Exports ImportsGDP (million current US$, 2009) 46 866 Merchandise 58 72GDP (million current PPP US$, 2009) 72 018 excluding intra-EU trade 41 50Current account balance (million US$, 2009) - 287 Commercial services 93 62Trade per capita (US$, 2008-2010) 22 163 excluding intra-EU trade 67 43Trade to GDP ratio (2007-2009) 109.2
2009 128
Exports of goods and services (volume, 2005=100) ...Imports of goods and services (volume, 2005=100) ...
TRADE POLICY
WTO accession 9 November 2000 Contribution to WTO budget (%, 2011) 0.142Trade Policy Review 25, 27 June 2008 Import duties collected (%, 2000-2001) GPA accession Observer in total tax revenue 9.4Tariffs and duty free imports to total imports 2.0
Tariff binding coverage (%) 100 Number of notifications to WTO and measures in force MFN tariffs Applied 2009 22
Simple average of import duties Goods RTAs - services EIAs notified to WTO 3 - 1All goods 13.7 5.6 Anti-dumping (30 June 2010) ...
Agricultural goods (AOA) 27.6 12.0 Countervailing duties (30 June 2010) ...Non-agricultural goods 11.6 4.7 Safeguards (22 October 2010) 0
0.0 0.40 - 0
40.6 Original panel / Appellate Body (AB) reports 0 - 0 6.2 Compliance panel / AB reports (Article 21.5 DSU) 0 - 0
Agricultural products 2.5 Agricultural products 11.8Fuels and mining products 73.1 Fuels and mining products 10.4Manufactures 10.8 Manufactures 71.4
1. United Arab Emirates 5.8 1. United Arab Emirates 26.62. India 3.1 2. European Union (27) 13.53. China 1.6 3. China 4.94. European Union (27) 1.5 4. India 4.35. Saudi Arabia, Kingdom of 1.5 5. United States 3.7 Unspecified destinations 75.5 Unspecified origins 25.2
COMMERCIAL SERVICES TRADE Value2010 2009
1 943 6 613
2010 0.05 0.19
Breakdown in economy's total exports By principal services item
33.0 40.6 40.5 14.7 26.5 44.7
INDUSTRIAL PROPERTY
Madrid Total 2 097 2 097
October 2011
Oman
Annual percentage change2005-2009 2008 2009
Real GDP (2005=100) 6 13 1... ... ...... ... ...
Final bound
Non ad-valorem duties (% total tariff lines) Number of disputes (complainant - defendant) Requests for consultation
in agricultural goods (AOA) in non-agricultural goods
2010Share in world total exports Share in world total imports
Breakdown in economy's total imports By principal services item
Transportation Transportation
Direct residents Direct non-residents
Travel Travel Other commercial services Other commercial services
... ... ... ... ...
Patent grants by patent office Trademark registrations by office, 2009Residents Non-residents Total
Outstanding notifications in WTO Central Registry
MFN duty free imports (%, 2008)
World Trade OrganizationTrade Profiles 2011
131Download the data:www.wto.org/statistics
CO
UN
TRY
PR
OFI
LES
BASIC INDICATORS Population (thousands, 2010) 173 593 Rank in world trade, 2010 Exports ImportsGDP (million current US$, 2010) 174 799 Merchandise 65 55GDP (million current PPP US$, 2010) 464 203 excluding intra-EU trade 47 37Current account balance (million US$, 2010) - 1 490 Commercial services 80 63Trade per capita (US$, 2008-2010) 372 excluding intra-EU trade 54 44Trade to GDP ratio (2008-2010) 38.0
2010 123
Exports of goods and services (volume, 2005=100) 117Imports of goods and services (volume, 2005=100) 112
TRADE POLICY
WTO accession 1 January 1995 Contribution to WTO budget (%, 2011) 0.185Trade Policy Review 16, 18 January 2008 Import duties collected (%, 2003-2005) GPA accession - in total tax revenue 15.8Tariffs and duty free imports to total imports 7.1
Tariff binding coverage (%) 98.7 Number of notifications to WTO and measures in force MFN tariffs Applied 2010 12
Simple average of import duties Goods RTAs - services EIAs notified to WTO 8 - 2All goods 59.9 13.9 Anti-dumping (30 June 2010) 29
Agricultural goods (AOA) 95.6 17.0 Countervailing duties (30 June 2010) ...Non-agricultural goods 54.6 13.4 Safeguards (22 October 2010) 0
0.0 0.83 - 2
34.8 Original panel / Appellate Body (AB) reports 2 - 0 36.1 Compliance panel / AB reports (Article 21.5 DSU) 0 - 0
Agricultural products 18.4 Agricultural products 17.3Fuels and mining products 7.1 Fuels and mining products 32.0Manufactures 74.4 Manufactures 46.5
1. European Union (27) 24.3 1. United Arab Emirates 14.02. United States 17.2 2. China 14.03. United Arab Emirates 8.6 3. European Union (27) 11.54. Afghanistan 7.9 4. Saudi Arabia, Kingdom of 10.25. China 6.7 5. Kuwait 6.9
COMMERCIAL SERVICES TRADE Value2010 2009
2 792 6 466
2010 0.08 0.18
Breakdown in economy's total exports By principal services item
47.7 58.1 10.9 14.3 41.4 27.6
INDUSTRIAL PROPERTY
Madrid Total ... 8 165
October 2011
Pakistan
Annual percentage change2005-2010 2009 2010
Real GDP (2005=100) 4 4 43 -3 142 -15 11
Final bound
Non ad-valorem duties (% total tariff lines) Number of disputes (complainant - defendant) Requests for consultation
in agricultural goods (AOA) in non-agricultural goods
2010Share in world total exports Share in world total imports
Breakdown in economy's total imports By principal services item
Transportation Transportation
Direct residents Direct non-residents
Travel Travel Other commercial services Other commercial services
11 222 233 3 191 4 974
Patent grants by patent office, 2008 Trademark registrations by office, 2008Residents Non-residents Total
Outstanding notifications in WTO Central Registry
MFN duty free imports (%, 2009)
Pakistan
World Trade OrganizationTrade Profiles 2011
132 Download the data:www.wto.org/statistics
Panama
BASIC INDICATORS Population (thousands, 2010) 3 517 Rank in world trade, 2010 Exports ImportsGDP (million current US$, 2010) 26 777 Merchandise 150 92GDP (million current PPP US$, 2010) 48 804 excluding intra-EU trade 124 68Current account balance (million US$, 2010) - 2 953 Commercial services 59 87Trade per capita (US$, 2008-2010) 9 765 excluding intra-EU trade 39 63Trade to GDP ratio (2008-2010) 137.3
2010 149
Exports of goods and services (volume, 2005=100) 157Imports of goods and services (volume, 2005=100) 160
TRADE POLICY
WTO accession 6 September 1997 Contribution to WTO budget (%, 2011) 0.087Trade Policy Review 17, 19 September 2007 Import duties collected GPA accession Observer in total tax revenue ...Tariffs and duty free imports to total imports ...
Tariff binding coverage (%) 100 Number of notifications to WTO and measures in force MFN tariffs Applied 2009 19
Simple average of import duties Goods RTAs - services EIAs notified to WTO 6 - 6All goods 23.4 7.2 Anti-dumping (30 June 2010) 0
Agricultural goods (AOA) 27.6 13.4 Countervailing duties (30 June 2010) ...Non-agricultural goods 22.7 6.2 Safeguards (22 October 2010) 0
0.2 0.05 - 1
32.1 Original panel / Appellate Body (AB) reports 1 - 0 39.3 Compliance panel / AB reports (Article 21.5 DSU) 0 - 0
Agricultural products 57.2 Agricultural products 11.7Fuels and mining products 8.9 Fuels and mining products 19.3Manufactures 11.0 Manufactures 66.9
1. United States 19.8 1. China 24.92. Bolivarian Rep. of Venezuela 16.1 2. United States 20.53. Colombia 15.6 3. Singapore 10.44. Costa Rica 5.1 4. European Union (27) 9.05. Dominican Republic 5.0 5. Hong Kong, China 4.5
COMMERCIAL SERVICES TRADE Value2010 2009
6 013 2 681
2010 0.16 0.08
Breakdown in economy's total exports By principal services item
55.4 57.5 27.9 14.8 16.7 27.7
INDUSTRIAL PROPERTY
Madrid Total ... 7 354
October 2011
Panama
Annual percentage change2005-2010 2009 2010
Real GDP (2005=100) 8 3 79 -1 6
10 -6 21
Final bound
Non ad-valorem duties (% total tariff lines) Number of disputes (complainant - defendant) Requests for consultation
in agricultural goods (AOA) in non-agricultural goods
2010Share in world total exports Share in world total imports
Breakdown in economy's total imports By principal services item
Transportation Transportation
Direct residents Direct non-residents
Travel Travel Other commercial services Other commercial services
... 310 310 2 820 4 534
Patent grants by patent office, 2008 Trademark registrations by office, 2009Residents Non-residents Total
Outstanding notifications in WTO Central Registry
MFN duty free imports (%, 2009)
World Trade OrganizationTrade Profiles 2011
133Download the data:www.wto.org/statistics
CO
UN
TRY
PR
OFI
LES
BASIC INDICATORS Population (thousands, 2010) 6 858 Rank in world trade, 2010 Exports ImportsGDP (million current US$, 2010) 9 480 Merchandise 101 129GDP (million current PPP US$, 2010) 16 827 excluding intra-EU trade 77 103Current account balance (million US$, 2009) - 672 Commercial services 150 77Trade per capita (US$, 2008-2010) 1 647 excluding intra-EU trade 124 55Trade to GDP ratio (2008-2010) 130.3
2010 134
Exports of goods and services (volume, 2005=100) ...Imports of goods and services (volume, 2005=100) ...
TRADE POLICY
WTO accession 9 June 1996 Contribution to WTO budget (%, 2011) 0.017Trade Policy Review 16, 18 November 2010 Import duties collected GPA accession - in total tax revenue ...Tariffs and duty free imports to total imports ...
Tariff binding coverage (%) 100 Number of notifications to WTO and measures in force MFN tariffs Applied 2010 48
Simple average of import duties Goods RTAs - services EIAs notified to WTO 4 - 0All goods 31.9 5.1 Anti-dumping (30 June 2010) ...
Agricultural goods (AOA) 44.1 14.7 Countervailing duties (30 June 2010) ...Non-agricultural goods 30.0 3.6 Safeguards (22 October 2010) 0
0.8 0.70 - 0
85.6 Original panel / Appellate Body (AB) reports 0 - 0 94.1 Compliance panel / AB reports (Article 21.5 DSU) 0 - 0
2010Share in world total exports Share in world total imports
Breakdown in economy's total imports By principal services item
Transportation Transportation
Direct residents Direct non-residents
Travel Travel Other commercial services Other commercial services
... 1 1 27 531
Patent grants by patent office, 2008 Trademark registrations by office, 2000Residents Non-residents Total
Outstanding notifications in WTO Central Registry
MFN duty free imports (%, 2004)
a Breakdowns by commodity group refer to 2004.
Papua New Guinea
World Trade OrganizationTrade Profiles 2011
134 Download the data:www.wto.org/statistics
Paraguay
BASIC INDICATORS Population (thousands, 2010) 6 455 Rank in world trade, 2010 Exports ImportsGDP (million current US$, 2010) 18 475 Merchandise 109 88GDP (million current PPP US$, 2010) 33 256 excluding intra-EU trade 85 64Current account balance (million US$, 2010) - 596 Commercial services 102 139Trade per capita (US$, 2008-2010) 2 778 excluding intra-EU trade 76 113Trade to GDP ratio (2008-2010) 106.6
2010 131
Exports of goods and services (volume, 2005=100) 155Imports of goods and services (volume, 2005=100) 161
TRADE POLICY
WTO accession 1 January 1995 Contribution to WTO budget (%, 2011) 0.040Trade Policy Review 27, 29 April 2011 Import duties collected (%, 2007-2009) GPA accession - in total tax revenue 11.0Tariffs and duty free imports to total imports 2.6
Tariff binding coverage (%) 100 Number of notifications to WTO and measures in force MFN tariffs Applied 2010 10
Simple average of import duties Goods RTAs - services EIAs notified to WTO 5 - 1All goods 33.5 10.2 Anti-dumping (30 June 2010) 0
Agricultural goods (AOA) 33.2 10.3 Countervailing duties (30 June 2010) ...Non-agricultural goods 33.5 10.2 Safeguards (22 October 2010) 0
0.0 0.00 - 0
27.6 Original panel / Appellate Body (AB) reports 0 - 0 40.7 Compliance panel / AB reports (Article 21.5 DSU) 0 - 0
Agricultural products 88.5 Agricultural products 8.1Fuels and mining products 0.8 Fuels and mining products 12.5Manufactures 10.7 Manufactures 79.3
1. Uruguay 22.0 1. China 34.22. Brazil 14.6 2. Brazil 24.13. Chile 12.1 3. Argentina 15.74. Argentina 11.9 4. European Union (27) 5.35. European Union (27) 10.7 5. United States 4.4
COMMERCIAL SERVICES TRADE Value2010 2009
1 361 677
2010 0.04 0.02
Breakdown in economy's total exports By principal services item
16.9 66.5 16.0 22.6 67.1 10.9
INDUSTRIAL PROPERTY
Madrid Total ... ...
October 2011
Paraguay
Annual percentage change2005-2010 2009 2010
Real GDP (2005=100) 5 -4 159 -13 28
10 -13 24
Final bound
Non ad-valorem duties (% total tariff lines) Number of disputes (complainant - defendant) Requests for consultation
in agricultural goods (AOA) in non-agricultural goods
2010Share in world total exports Share in world total imports
Breakdown in economy's total imports By principal services item
Transportation Transportation
Direct residents Direct non-residents
Travel Travel Other commercial services Other commercial services
... ... ... ... ...
Patent grants by patent office Trademark registrations by officeResidents Non-residents Total
Outstanding notifications in WTO Central Registry
MFN duty free imports (%, 2009)
World Trade OrganizationTrade Profiles 2011
135Download the data:www.wto.org/statistics
CO
UN
TRY
PR
OFI
LES
BASIC INDICATORS Population (thousands, 2010) 29 077 Rank in world trade, 2010 Exports ImportsGDP (million current US$, 2010) 153 845 Merchandise 59 59GDP (million current PPP US$, 2010) 275 355 excluding intra-EU trade 42 41Current account balance (million US$, 2009) 247 Commercial services 73 64Trade per capita (US$, 2008-2010) 2 305 excluding intra-EU trade 49 45Trade to GDP ratio (2008-2010) 48.8
2010 141
Exports of goods and services (volume, 2005=100) 119Imports of goods and services (volume, 2005=100) 173
TRADE POLICY
WTO accession 1 January 1995 Contribution to WTO budget (%, 2011) 0.160Trade Policy Review 17, 19 October 2007 Import duties collected (%, 2007-2009) GPA accession - in total tax revenue 3.0Tariffs and duty free imports to total imports 2.0
Tariff binding coverage (%) 100 Number of notifications to WTO and measures in force MFN tariffs Applied 2010 15
Simple average of import duties Goods RTAs - services EIAs notified to WTO 10 - 5All goods 29.3 5.4 Anti-dumping (30 June 2010) 26
Agricultural goods (AOA) 30.8 6.3 Countervailing duties (30 June 2010) 0Non-agricultural goods 29.1 5.2 Safeguards (22 October 2010) 0
0.0 0.03 - 4
61.9 Original panel / Appellate Body (AB) reports 1 - 0 73.9 Compliance panel / AB reports (Article 21.5 DSU) 0 - 0
Agricultural products 16.7 Agricultural products 11.9Fuels and mining products 49.5 Fuels and mining products 15.4Manufactures 10.7 Manufactures 71.8
1. European Union (27) 17.8 1. United States 19.52. United States 16.4 2. China 17.13. China 15.5 3. European Union (27) 10.64. Switzerland 11.0 4. Brazil 7.35. Canada 9.5 5. Ecuador 4.8
COMMERCIAL SERVICES TRADE Value2010 2009
3 835 5 795
2010 0.10 0.17
Breakdown in economy's total exports By principal services item
21.5 42.1 60.2 21.9 18.3 36.0
INDUSTRIAL PROPERTY
Madrid Total ... 18 695
October 2011
Peru
Annual percentage change2005-2010 2009 2010
Real GDP (2005=100) 7 1 93 -2 5
12 -12 20
Final bound
Non ad-valorem duties (% total tariff lines) Number of disputes (complainant - defendant) Requests for consultation
in agricultural goods (AOA) in non-agricultural goods
2010Share in world total exports Share in world total imports
Breakdown in economy's total imports By principal services item
Transportation Transportation
Direct residents Direct non-residents
Travel Travel Other commercial services Other commercial services
13 372 385 10 322 8 373
Patent grants by patent office, 2009 Trademark registrations by office, 2008Residents Non-residents Total
Outstanding notifications in WTO Central Registry
MFN duty free imports (%, 2009)
Peru
World Trade OrganizationTrade Profiles 2011
136 Download the data:www.wto.org/statistics
Philippines
BASIC INDICATORS Population (thousands, 2010) 93 261 Rank in world trade, 2010 Exports ImportsGDP (million current US$, 2010) 199 589 Merchandise 52 47GDP (million current PPP US$, 2010) 367 425 excluding intra-EU trade 37 29Current account balance (million US$, 2010) 8 465 Commercial services 44 53Trade per capita (US$, 2008-2010) 1 335 excluding intra-EU trade 27 36Trade to GDP ratio (2008-2010) 67.8
2010 127
Exports of goods and services (volume, 2005=100) 130Imports of goods and services (volume, 2005=100) 120
TRADE POLICY
WTO accession 1 January 1995 Contribution to WTO budget (%, 2011) 0.386Trade Policy Review 5, 7 July 2005 Import duties collected GPA accession - in total tax revenue ...Tariffs and duty free imports to total imports ...
Tariff binding coverage (%) 67.0 Number of notifications to WTO and measures in force MFN tariffs Applied 2010 19
Simple average of import duties Goods RTAs - services EIAs notified to WTO 9 - 4All goods 25.7 6.3 Anti-dumping (30 June 2010) 1
Agricultural goods (AOA) 35.0 9.8 Countervailing duties (30 June 2010) ...Non-agricultural goods 23.4 5.7 Safeguards (22 October 2010) 4
0.1 0.05 - 6
0.1 Original panel / Appellate Body (AB) reports 2 - 0 35.5 Compliance panel / AB reports (Article 21.5 DSU) 0 - 0
Agricultural products 8.0 Agricultural products 11.7Fuels and mining products 6.2 Fuels and mining products 20.8Manufactures 85.1 Manufactures 67.0
1. Japan 15.2 1. Japan 12.52. United States 14.7 2. United States 10.83. European Union (27) 14.4 3. Singapore 9.34. Singapore 14.2 4. China 8.55. China 11.1 5. European Union (27) 7.3
COMMERCIAL SERVICES TRADE Value2010 2009
13 243 11 066
2010 0.36 0.32
Breakdown in economy's total exports By principal services item
10.2 44.5 21.0 30.6 68.8 24.8
INDUSTRIAL PROPERTY
Madrid Total ... 10 311
October 2011
Philippines
Annual percentage change2005-2010 2009 2010
Real GDP (2005=100) 5 1 85 -8 214 -8 23
Final bound
Non ad-valorem duties (% total tariff lines) Number of disputes (complainant - defendant) Requests for consultation
in agricultural goods (AOA) in non-agricultural goods
2010Share in world total exports Share in world total imports
Breakdown in economy's total imports By principal services item
Transportation Transportation
Direct residents Direct non-residents
Travel Travel Other commercial services Other commercial services
41 797 838 4 903 5 408
Patent grants by patent office, 2008 Trademark registrations by office, 2009Residents Non-residents Total
Outstanding notifications in WTO Central Registry
MFN duty free imports (%, 2009)
World Trade OrganizationTrade Profiles 2011
137Download the data:www.wto.org/statistics
CO
UN
TRY
PR
OFI
LES
BASIC INDICATORS Population (thousands, 2010) 38 187 Rank in world trade, 2010 Exports ImportsGDP (million current US$, 2010) 468 585 Merchandise 28 24GDP (million current PPP US$, 2010) 754 097 excluding intra-EU trade - -Current account balance (million US$, 2010) - 15 879 Commercial services 30 31Trade per capita (US$, 2008-2010) 10 289 excluding intra-EU trade - -Trade to GDP ratio (2008-2010) 82.4
2010 126
Exports of goods and services (volume, 2005=100) 130Imports of goods and services (volume, 2005=100) 133
TRADE POLICY
WTO accession 1 July 1995 Contribution to WTO budget (%, 2011) 1.050Trade Policy Review 6, 8 July 2011 Import duties collected GPA accession 1 May 2004 in total tax revenue ...Tariffs and duty free imports to total imports ...
Tariff binding coverage (%) 100 Number of notifications to WTO and measures in force MFN tariffs Applied 2010 18
Simple average of import duties Goods RTAs - services EIAs notified to WTO 31 - 10All goods 5.0 5.1 Anti-dumping (30 June 2010) 149
Agricultural goods (AOA) 12.3 12.8 Countervailing duties (30 June 2010) 8Non-agricultural goods 3.9 4.0 Safeguards (22 October 2010) 0
4.8 4.788 - 71
41.1 Original panel / Appellate Body (AB) reports 34 - 32 51.4 Compliance panel / AB reports (Article 21.5 DSU) 4 - 4
Agricultural products 12.2 Agricultural products 9.4Fuels and mining products 8.6 Fuels and mining products 14.3Manufactures 79.1 Manufactures 74.1
1. European Union (27) 79.4 1. European Union (27) 61.62. Russian Federation 3.7 2. China 9.33. Ukraine 2.5 3. Russian Federation 8.64. Norway 1.9 4. Korea, Republic of 3.05. United States 1.8 5. United States 2.3
COMMERCIAL SERVICES TRADE Value2010 2009
32 400 28 781
2010 0.88 0.82
Breakdown in economy's total exports By principal services item
27.1 21.2 29.2 28.3 43.7 50.5
INDUSTRIAL PROPERTY
Madrid Total 3 415 13 035
October 2011
Poland
Annual percentage change2005-2010 2009 2010
Real GDP (2005=100) 5 2 45 -9 66 -14 7
Final bound
Non ad-valorem duties (% total tariff lines) Number of disputes (complainant - defendant) Requests for consultation
in agricultural goods (AOA) in non-agricultural goods
2010Share in world total exports Share in world total imports
Breakdown in economy's total imports By principal services item
Transportation Transportation
Direct residents Direct non-residents
Travel Travel Other commercial services Other commercial services
1 536 2 422 3 958 8 731 889
Patent grants by patent office, 2009 Trademark registrations by office, 2009Residents Non-residents Total
Outstanding notifications in WTO Central Registry
MFN duty free imports (%, 2009)
a Breakdowns by destination/origin refer to 2009.
Poland
World Trade OrganizationTrade Profiles 2011
138 Download the data:www.wto.org/statistics
Portugal
BASIC INDICATORS Population (thousands, 2010) 10 643 Rank in world trade, 2010 Exports ImportsGDP (million current US$, 2010) 228 538 Merchandise 55 37GDP (million current PPP US$, 2010) 272 166 excluding intra-EU trade - -Current account balance (million US$, 2010) - 22 595 Commercial services 36 44Trade per capita (US$, 2008-2010) 15 662 excluding intra-EU trade - -Trade to GDP ratio (2008-2010) 69.9
2010 103
Exports of goods and services (volume, 2005=100) a 106Imports of goods and services (volume, 2005=100) a 104
TRADE POLICY
WTO accession 1 January 1995 Contribution to WTO budget (%, 2011) 0.505Trade Policy Review 6, 8 July 2011 Import duties collected GPA accession 1 January 1996 in total tax revenue ...Tariffs and duty free imports to total imports ...
Tariff binding coverage (%) 100 Number of notifications to WTO and measures in force MFN tariffs Applied 2010 17
Simple average of import duties Goods RTAs - services EIAs notified to WTO 31 - 10All goods 5.0 5.1 Anti-dumping (30 June 2010) 149
Agricultural goods (AOA) 12.3 12.8 Countervailing duties (30 June 2010) 8Non-agricultural goods 3.9 4.0 Safeguards (22 October 2010) 0
4.8 4.785 - 71
41.1 Original panel / Appellate Body (AB) reports 33 - 32 51.4 Compliance panel / AB reports (Article 21.5 DSU) 4 - 4
Agricultural products 13.9 Agricultural products 15.1Fuels and mining products 10.2 Fuels and mining products 17.5Manufactures 73.3 Manufactures 66.8
1. European Union (27) 73.3 1. European Union (27) 75.42. Angola 5.2 2. China 2.83. United States 3.6 3. Nigeria 2.44. Brazil 1.2 4. Brazil 1.85. Mexico 1.1 5. United States 1.5 Unspecified destinations 2.8 Unspecified origins 0.2
COMMERCIAL SERVICES TRADE Value2010 2009
22 986 14 198
2010 0.62 0.40
Breakdown in economy's total exports By principal services item
27.0 30.2 43.9 27.5 29.1 42.3
INDUSTRIAL PROPERTY
Madrid Total 2 450 2 450
October 2011
Portugal
Annual percentage change2005-2010 2009 2010
Real GDP (2005=100) 1 -2 11 -12 ...1 -11 ...
Final bound
Non ad-valorem duties (% total tariff lines) Number of disputes (complainant - defendant) Requests for consultation
in agricultural goods (AOA) in non-agricultural goods
2010Share in world total exports Share in world total imports
Breakdown in economy's total imports By principal services item
Transportation Transportation
Direct residents Direct non-residents
Travel Travel Other commercial services Other commercial services
132 33 165 ... ...
Patent grants by patent office, 2008 Trademark registrations by office, 2009Residents Non-residents Total
Outstanding notifications in WTO Central Registry
MFN duty free imports (%, 2009)
a Refers to 2009 and to the average annual percentage change for 2005-2009.
World Trade OrganizationTrade Profiles 2011
139Download the data:www.wto.org/statistics
CO
UN
TRY
PR
OFI
LES
BASIC INDICATORS Population (thousands, 2010) 1 759 Rank in world trade, 2010 Exports ImportsGDP (million current US$, 2009) 98 313 Merchandise 46 66GDP (million current PPP US$, 2009) 128 187 excluding intra-EU trade 31 44Current account balance (million US$, 2010) ... Commercial services 87 60Trade per capita (US$, 2004-2006) 50 298 excluding intra-EU trade 61 42Trade to GDP ratio (2004-2006) 93.5
2009 205
Exports of goods and services (volume, 2005=100) ...Imports of goods and services (volume, 2005=100) ...
TRADE POLICY
WTO accession 13 January 1996 Contribution to WTO budget (%, 2011) 0.204Trade Policy Review 21, 23 February 2005 Import duties collected (%, 2004-2006) GPA accession - in total tax revenue 5.3Tariffs and duty free imports to total imports 3.9
Tariff binding coverage (%) 100 Number of notifications to WTO and measures in force MFN tariffs Applied 2009 17
Simple average of import duties Goods RTAs - services EIAs notified to WTO 2 - 0All goods 15.9 5.0 Anti-dumping (30 June 2010) ...
Agricultural goods (AOA) 25.7 8.0 Countervailing duties (30 June 2010) ...Non-agricultural goods 14.5 4.6 Safeguards (22 October 2010) 0
0.0 0.60 - 0
36.5 Original panel / Appellate Body (AB) reports 0 - 0 7.4 Compliance panel / AB reports (Article 21.5 DSU) 0 - 0
2006Share in world total exports Share in world total imports
Breakdown in economy's total imports By principal services item
Transportation Transportation
Direct residents Direct non-residents
Travel Travel Other commercial services Other commercial services
... ... ... ... ...
Patent grants by patent office Trademark registrations by officeResidents Non-residents Total
Outstanding notifications in WTO Central Registry
MFN duty free imports (%, 2008)
a Breakdowns by destination/origin refer to 2009.
Qatar
World Trade OrganizationTrade Profiles 2011
140 Download the data:www.wto.org/statistics
Romania
BASIC INDICATORS Population (thousands, 2010) 21 442 Rank in world trade, 2010 Exports ImportsGDP (million current US$, 2010) 161 624 Merchandise 54 42GDP (million current PPP US$, 2010) 306 348 excluding intra-EU trade - -Current account balance (million US$, 2010) - 6 559 Commercial services 54 56Trade per capita (US$, 2008-2010) 5 985 excluding intra-EU trade - -Trade to GDP ratio (2008-2010) 73.8
2010 116
Exports of goods and services (volume, 2005=100) 139Imports of goods and services (volume, 2005=100) 153
TRADE POLICY
WTO accession 1 January 1995 Contribution to WTO budget (%, 2011) 0.351Trade Policy Review 6, 8 July 2011 Import duties collected GPA accession 1 January 2007 in total tax revenue ...Tariffs and duty free imports to total imports ...
Tariff binding coverage (%) 100 Number of notifications to WTO and measures in force MFN tariffs Applied 2010 18
Simple average of import duties Goods RTAs - services EIAs notified to WTO 31 - 10All goods 5.0 5.1 Anti-dumping (30 June 2010) 149
Agricultural goods (AOA) 12.3 12.8 Countervailing duties (30 June 2010) 8Non-agricultural goods 3.9 4.0 Safeguards (22 October 2010) 0
4.8 4.785 - 72
41.1 Original panel / Appellate Body (AB) reports 33 - 32 51.4 Compliance panel / AB reports (Article 21.5 DSU) 4 - 4
Agricultural products 10.4 Agricultural products 9.4Fuels and mining products 9.6 Fuels and mining products 12.9Manufactures 79.7 Manufactures 77.4
1. European Union (27) 72.2 1. European Union (27) 72.52. Turkey 6.9 2. China 5.53. Russian Federation 2.2 3. Russian Federation 4.44. United States 1.5 4. Turkey 3.75. Serbia 1.4 5. Kazakhstan 2.9
COMMERCIAL SERVICES TRADE Value2010 2009
8 542 9 292
2010 0.23 0.26
Breakdown in economy's total exports By principal services item
29.9 30.0 13.3 17.7 56.8 52.4
INDUSTRIAL PROPERTY
Madrid Total 2 833 10 809
October 2011
Romania
Annual percentage change2005-2010 2009 2010
Real GDP (2005=100) 3 -8 17 -12 119 -25 11
Final bound
Non ad-valorem duties (% total tariff lines) Number of disputes (complainant - defendant) Requests for consultation
in agricultural goods (AOA) in non-agricultural goods
Agricultural products 5.2 Agricultural products 14.8Fuels and mining products 70.4 Fuels and mining products 5.3Manufactures 20.2 Manufactures 75.7
1. European Union (27) 52.2 1. European Union (27) 38.32. Ukraine 5.8 2. China 15.73. Turkey 5.1 3. Ukraine 5.64. China 5.1 4. United States 4.55. Belarus 4.5 5. Japan 4.1 Unspecified destinations 1.8 Unspecified origins 8.0
COMMERCIAL SERVICES TRADE Value2010 2009
43 961 70 223
2010 1.19 2.00
Breakdown in economy's total exports By principal services item
33.9 17.1 20.4 37.8 45.6 45.2
INDUSTRIAL PROPERTY
Madrid Total 12 153 40 488
October 2011
Russian Federation
Annual percentage change2005-2010 2009 2010
Real GDP (2005=100) 3 -8 43 -5 58 -30 18
Final bound
Non ad-valorem duties (% total tariff lines) Number of disputes (complainant - defendant) Requests for consultation
in agricultural goods (AOA) in non-agricultural goods
2010Share in world total exports Share in world total imports
Breakdown in economy's total imports By principal services item
Transportation Transportation
Direct residents Direct non-residents
Travel Travel Other commercial services Other commercial services
26 294 8 530 34 824 19 585 8 750
Patent grants by patent office, 2009 Trademark registrations by office, 2009Residents Non-residents Total
Outstanding notifications in WTO Central Registry
MFN duty free imports (%, 2009)
Russian Federation
World Trade OrganizationTrade Profiles 2011
142 Download the data:www.wto.org/statistics
Rwanda
BASIC INDICATORS Population (thousands, 2010) 10 624 Rank in world trade, 2010 Exports ImportsGDP (million current US$, 2010) 5 628 Merchandise 168 159GDP (million current PPP US$, 2010) 12 268 excluding intra-EU trade 142 133Current account balance (million US$, 2009) - 379 Commercial services 151 149Trade per capita (US$, 2008-2010) 195 excluding intra-EU trade 125 123Trade to GDP ratio (2008-2010) 38.7
2010 143
Exports of goods and services (volume, 2005=100) ...Imports of goods and services (volume, 2005=100) ...
TRADE POLICY
WTO accession 22 May 1996 Contribution to WTO budget (%, 2011) 0.015Trade Policy Review 28, 30 September 2004 Import duties collected GPA accession - in total tax revenue ...Tariffs and duty free imports to total imports ...
Tariff binding coverage (%) 100 Number of notifications to WTO and measures in force MFN tariffs Applied 2010 39
Simple average of import duties Goods RTAs - services EIAs notified to WTO 2 - 0All goods 89.4 12.5 Anti-dumping (30 June 2010) ...
Agricultural goods (AOA) 74.2 19.5 Countervailing duties (30 June 2010) ...Non-agricultural goods 91.7 11.4 Safeguards (22 October 2010) 0
0.0 0.10 - 0
10.7 Original panel / Appellate Body (AB) reports 0 - 0 56.3 Compliance panel / AB reports (Article 21.5 DSU) 0 - 0
2010Share in world total exports Share in world total imports
Breakdown in economy's total imports By principal services item
Transportation Transportation
Direct residents Direct non-residents
Travel Travel Other commercial services Other commercial services
... 20 20 14 224
Patent grants by patent office, 2007 Trademark registrations by office, 2007Residents Non-residents Total
Outstanding notifications in WTO Central Registry
MFN duty free imports (%, 2009)
World Trade OrganizationTrade Profiles 2011
143Download the data:www.wto.org/statistics
CO
UN
TRY
PR
OFI
LES
BASIC INDICATORS Population (thousands, 2010) 52 Rank in world trade, 2010 Exports ImportsGDP (million current US$, 2010) 526 Merchandise 183 189GDP (million current PPP US$, 2010) 683 excluding intra-EU trade 157 163Current account balance (million US$, 2010) - 96 Commercial services 172 181Trade per capita (US$, 2008-2010) 10 425 excluding intra-EU trade 146 155Trade to GDP ratio (2008-2010) 99.8
2010 98
Exports of goods and services (volume, 2005=100) ...Imports of goods and services (volume, 2005=100) ...
TRADE POLICY
WTO accession 21 February 1996 Contribution to WTO budget (%, 2011) 0.015Trade Policy Review 5, 7 November 2007 Import duties collected GPA accession - in total tax revenue ...Tariffs and duty free imports to total imports ...
Tariff binding coverage (%) 97.8 Number of notifications to WTO and measures in force MFN tariffs Applied 2010 46
Simple average of import duties Goods RTAs - services EIAs notified to WTO 2 - 2All goods 75.9 9.2 Anti-dumping (30 June 2010) ...
Agricultural goods (AOA) 108.6 14.3 Countervailing duties (30 June 2010) ...Non-agricultural goods 70.8 8.4 Safeguards (22 October 2010) 0
0.0 0.40 - 0
10.9 Original panel / Appellate Body (AB) reports 0 - 0 5.6 Compliance panel / AB reports (Article 21.5 DSU) 0 - 0
Agricultural products 8.0 Agricultural products 20.5Fuels and mining products 0.2 Fuels and mining products 9.2Manufactures 91.8 Manufactures 70.3
1. United States 84.7 1. United States 61.02. European Union (27) 5.2 2. Trinidad and Tobago 11.53. Netherlands Antilles 2.4 3. European Union (27) 6.54. Antigua and Barbuda 1.5 4. Japan 3.05. Grenada 1.2 5. Canada 2.1
COMMERCIAL SERVICES TRADE Value2010 2009 119 87
2010 0.00 0.00
Breakdown in economy's total exports By principal services item
9.6 43.4 69.0 11.6 21.4 45.0
INDUSTRIAL PROPERTY
Madrid Total ... ...
October 2011
Saint Kitts and Nevis
Annual percentage change2005-2010 2009 2010
Real GDP (2005=100) 0 -11 -2... ... ...... ... ...
Final bound
Non ad-valorem duties (% total tariff lines) Number of disputes (complainant - defendant) Requests for consultation
in agricultural goods (AOA) in non-agricultural goods
2010Share in world total exports Share in world total imports
Breakdown in economy's total imports By principal services item
Transportation Transportation
Direct residents Direct non-residents
Travel Travel Other commercial services Other commercial services
... ... ... ... ...
Patent grants by patent office Trademark registrations by officeResidents Non-residents Total
Outstanding notifications in WTO Central Registry
MFN duty free imports (%, 2008)
a Breakdowns by commodity group refer to 2006 and by destination/origin refer to 2008.
Saint Kitts and Nevis
World Trade OrganizationTrade Profiles 2011
144 Download the data:www.wto.org/statistics
Saint Lucia
BASIC INDICATORS Population (thousands, 2010) 174 Rank in world trade, 2010 Exports ImportsGDP (million current US$, 2010) 932 Merchandise 175 178GDP (million current PPP US$, 2010) 1 610 excluding intra-EU trade 149 152Current account balance (million US$, 2010) - 150 Commercial services 142 167Trade per capita (US$, 2008-2010) 7 414 excluding intra-EU trade 116 141Trade to GDP ratio (2008-2010) 133.3
2010 102
Exports of goods and services (volume, 2005=100) ...Imports of goods and services (volume, 2005=100) ...
TRADE POLICY
WTO accession 1 January 1995 Contribution to WTO budget (%, 2011) 0.015Trade Policy Review 5, 7 November 2007 Import duties collected GPA accession - in total tax revenue ...Tariffs and duty free imports to total imports ...
Tariff binding coverage (%) 99.6 Number of notifications to WTO and measures in force MFN tariffs Applied 2007 39
Simple average of import duties Goods RTAs - services EIAs notified to WTO 2 - 2All goods 62.0 8.9 Anti-dumping (30 June 2010) ...
Agricultural goods (AOA) 114.5 14.8 Countervailing duties (30 June 2010) ...Non-agricultural goods 54.0 8.0 Safeguards (22 October 2010) 0
0.0 0.00 - 0
28.0 Original panel / Appellate Body (AB) reports 0 - 0 52.1 Compliance panel / AB reports (Article 21.5 DSU) 0 - 0
Agricultural products 28.8 Agricultural products 22.6Fuels and mining products 22.0 Fuels and mining products 26.5Manufactures 48.2 Manufactures 50.7
1. United States 34.0 1. United States 42.62. Trinidad and Tobago 23.2 2. Trinidad and Tobago 23.83. European Union (27) 17.0 3. European Union (27) 8.44. Barbados 8.5 4. Japan 4.35. Saint Vincent and the Grenadines 3.0 5. Barbados 3.5
COMMERCIAL SERVICES TRADE Value2010 2009 385 196
2010 0.01 0.01
Breakdown in economy's total exports By principal services item
5.0 42.5 85.5 24.5 9.5 33.0
INDUSTRIAL PROPERTY
Madrid Total ... 539
October 2011
Saint Lucia
Annual percentage change2005-2010 2009 2010
Real GDP (2005=100) 0 -5 -2... ... ...... ... ...
Final bound
Non ad-valorem duties (% total tariff lines) Number of disputes (complainant - defendant) Requests for consultation
in agricultural goods (AOA) in non-agricultural goods
2010Share in world total exports Share in world total imports
Breakdown in economy's total imports By principal services item
Transportation Transportation
Direct residents Direct non-residents
Travel Travel Other commercial services Other commercial services
... 34 34 42 497
Patent grants by patent office, 2006 Trademark registrations by office, 2001Residents Non-residents Total
Outstanding notifications in WTO Central Registry
MFN duty free imports (%, 2007)
a Breakdowns by destination/origin refer to 2008.
World Trade OrganizationTrade Profiles 2011
145Download the data:www.wto.org/statistics
CO
UN
TRY
PR
OFI
LES
BASIC INDICATORS Population (thousands, 2010) 109 Rank in world trade, 2010 Exports ImportsGDP (million current US$, 2010) 562 Merchandise 188 184GDP (million current PPP US$, 2010) 940 excluding intra-EU trade 162 158Current account balance (million US$, 2010) - 206 Commercial services 167 182Trade per capita (US$, 2008-2010) 5 398 excluding intra-EU trade 141 156Trade to GDP ratio (2008-2010) 102.2
2010 109
Exports of goods and services (volume, 2005=100) ...Imports of goods and services (volume, 2005=100) ...
TRADE POLICY
WTO accession 1 January 1995 Contribution to WTO budget (%, 2011) 0.015Trade Policy Review 5, 7 November 2007 Import duties collected GPA accession - in total tax revenue ...Tariffs and duty free imports to total imports ...
Tariff binding coverage (%) 99.7 Number of notifications to WTO and measures in force MFN tariffs Applied 2007 33
Simple average of import duties Goods RTAs - services EIAs notified to WTO 2 - 2All goods 62.6 9.9 Anti-dumping (30 June 2010) ...
Agricultural goods (AOA) 114.6 15.9 Countervailing duties (30 June 2010) ...Non-agricultural goods 54.6 8.9 Safeguards (22 October 2010) 0
0.0 0.20 - 0
24.3 Original panel / Appellate Body (AB) reports 0 - 0 12.8 Compliance panel / AB reports (Article 21.5 DSU) 0 - 0
Agricultural products 70.0 Agricultural products 24.0Fuels and mining products 2.7 Fuels and mining products 22.6Manufactures 27.3 Manufactures 53.3
1. Saint Lucia 20.6 1. United States 33.02. Trinidad and Tobago 16.1 2. Trinidad and Tobago 27.13. European Union (27) 12.4 3. European Union (27) 9.54. Barbados 11.3 4. China 5.35. Antigua and Barbuda 7.4 5. Canada 5.0
COMMERCIAL SERVICES TRADE Value2010 2009 137 86
2010 0.00 0.00
Breakdown in economy's total exports By principal services item
6.2 53.5 63.4 16.0 30.4 30.6
INDUSTRIAL PROPERTY
Madrid Total ... 124
October 2011
Saint Vincent and the Grenadines
Annual percentage change2005-2010 2009 2010
Real GDP (2005=100) 2 -3 -7... ... ...... ... ...
Final bound
Non ad-valorem duties (% total tariff lines) Number of disputes (complainant - defendant) Requests for consultation
in agricultural goods (AOA) in non-agricultural goods
2010Share in world total exports Share in world total imports
Breakdown in economy's total imports By principal services item
Transportation Transportation
Direct residents Direct non-residents
Travel Travel Other commercial services Other commercial services
... 2 2 ... 124
Patent grants by patent office, 2000 Trademark registrations by office, 1996Residents Non-residents Total
Outstanding notifications in WTO Central Registry
MFN duty free imports (%, 2007)
Saint Vincent and the Grenadines
World Trade OrganizationTrade Profiles 2011
146 Download the data:www.wto.org/statistics
Samoa
BASIC INDICATORS Population (thousands, 2010) 183 Rank in world trade, 2010 Exports ImportsGDP (million current US$, 2010) 565 Merchandise 182 186GDP (million current PPP US$, 2010) 800 excluding intra-EU trade 156 160Current account balance (million US$, 2010) - 59 Commercial services 164 184Trade per capita (US$, 2008-2010) 2 721 excluding intra-EU trade 138 158Trade to GDP ratio (2008-2010) 90.8
2010 105
Exports of goods and services (volume, 2005=100) ...Imports of goods and services (volume, 2005=100) ...
TRADE POLICY
WTO accession Observer Contribution to WTO budget -Trade Policy Review - Import duties collected GPA accession - in total tax revenue ...Tariffs and duty free imports to total imports ...
Tariff binding coverage (%) - Number of notifications to WTO and measures in force MFN tariffs Applied -
Simple average of import duties Goods RTAs - services EIAs notified to WTO 2 - 0All goods - ... Anti-dumping -
Agricultural products 21.5 Agricultural products 26.8Fuels and mining products 0.3 Fuels and mining products 18.3Manufactures 78.2 Manufactures 54.0
1. Australia 77.1 1. New Zealand 30.72. New Zealand 10.9 2. Australia 23.33. American Samoa 5.3 3. United States 11.54. United States 3.1 4. Japan 8.45. Singapore 2.1 5. China 6.1
COMMERCIAL SERVICES TRADE Value2010 2009 160 78
2010 0.00 0.00
Breakdown in economy's total exports By principal services item
4.6 46.6 77.8 19.1 17.6 34.3
INDUSTRIAL PROPERTY
Madrid Total ... 143
October 2011
Samoa
Annual percentage change2005-2010 2009 2010
Real GDP (2005=100) 1 -6 1... ... ...... ... ...
Final bound
Non ad-valorem duties (% total tariff lines) Number of disputes (complainant - defendant) Requests for consultation
in agricultural goods (AOA) in non-agricultural goods
2010Share in world total exports Share in world total imports
Breakdown in economy's total imports By principal services item
Transportation Transportation
Direct residents Direct non-residents
Travel Travel Other commercial services Other commercial services
... 11 11 21 122
Patent grants by patent office, 2007 Trademark registrations by office, 2007Residents Non-residents Total
Outstanding notifications in WTO Central Registry
MFN duty free imports
World Trade OrganizationTrade Profiles 2011
147Download the data:www.wto.org/statistics
CO
UN
TRY
PR
OFI
LES
BASIC INDICATORS Population (thousands, 2010) 165 Rank in world trade, 2010 Exports ImportsGDP (million current US$, 2010) 197 Merchandise 200 202GDP (million current PPP US$, 2010) 311 excluding intra-EU trade 174 176Current account balance (million US$, 2009) - 79 Commercial services 190 192Trade per capita (US$, 2007-2009) 713 excluding intra-EU trade 164 166Trade to GDP ratio (2007-2009) 67.8
2010...
Exports of goods and services (volume, 2005=100) ...Imports of goods and services (volume, 2005=100) ...
TRADE POLICY
WTO accession Observer Contribution to WTO budget -Trade Policy Review - Import duties collected GPA accession - in total tax revenue ...Tariffs and duty free imports to total imports ...
Tariff binding coverage (%) - Number of notifications to WTO and measures in force MFN tariffs Applied -
Simple average of import duties Goods RTAs - services EIAs notified to WTO 0 - 0All goods - ... Anti-dumping -
Agricultural products 55.3 Agricultural products 30.6Fuels and mining products 0.0 Fuels and mining products 17.2Manufactures 2.7 Manufactures 51.8
1. European Union (27) 81.5 1. European Union (27) 66.82. Norway 4.6 2. Angola 15.63. Nigeria 4.1 3. Gabon 5.14. Angola 1.3 4. Japan 2.35. United States 0.5 5. China 2.2 Unspecified destinations 6.6 Unspecified origins 0.8
COMMERCIAL SERVICES TRADE Value2009 2008 10 17
2009 0.00 0.00
Breakdown in economy's total exports By principal services item
1.6 91.3 82.6 0.1 15.7 8.6
INDUSTRIAL PROPERTY
Madrid Total 287 287
October 2011
Sao Tome and Principe
Annual percentage change2005-2010 2009 2010
Real GDP (2005=100) ... ... ...... ... ...... ... ...
Final bound
Non ad-valorem duties (% total tariff lines) Number of disputes (complainant - defendant) Requests for consultation
in agricultural goods (AOA) in non-agricultural goods
2009Share in world total exports Share in world total imports
Breakdown in economy's total imports By principal services item
Transportation Transportation
Direct residents Direct non-residents
Travel Travel Other commercial services Other commercial services
... ... ... ... ...
Patent grants by patent office Trademark registrations by office, 2009Residents Non-residents Total
Outstanding notifications in WTO Central Registry
MFN duty free imports
São Tomé and Principe
World Trade OrganizationTrade Profiles 2011
148 Download the data:www.wto.org/statistics
Saudi Arabia, Kingdom of
BASIC INDICATORS Population (thousands, 2010) 27 448 Rank in world trade, 2010 Exports ImportsGDP (million current US$, 2010) 434 666 Merchandise 17 31GDP (million current PPP US$, 2010) 618 807 excluding intra-EU trade 12 21Current account balance (million US$, 2009) 20 955 Commercial services 51 18Trade per capita (US$, 2008-2010) 15 162 excluding intra-EU trade 33 11Trade to GDP ratio (2008-2010) 95.0
2010 114
Exports of goods and services (volume, 2005=100) a 107Imports of goods and services (volume, 2005=100) a 152
TRADE POLICY
WTO accession 11 December 2005 Contribution to WTO budget (%, 2011) 1.124Trade Policy Review ... Import duties collected GPA accession Observer in total tax revenue ...Tariffs and duty free imports to total imports ...
Tariff binding coverage (%) 100 Number of notifications to WTO and measures in force MFN tariffs Applied 2009 16
Simple average of import duties Goods RTAs - services EIAs notified to WTO 2 - 0All goods 11.1 4.8 Anti-dumping (30 June 2010) ...
Agricultural goods (AOA) 15.4 5.6 Countervailing duties (30 June 2010) ...Non-agricultural goods 10.5 4.7 Safeguards (22 October 2010) 0
1.2 1.40 - 0
58.7 Original panel / Appellate Body (AB) reports 0 - 0 23.3 Compliance panel / AB reports (Article 21.5 DSU) 0 - 0
Agricultural products 0.5 Agricultural products 13.7Fuels and mining products 84.2 Fuels and mining products 5.0Manufactures 11.7 Manufactures 79.9
1. Japan 26.8 1. European Union (27) 31.92. Taipei, Chinese 23.6 2. United States 13.63. United States 17.5 3. China 9.74. European Union (27) 7.1 4. Japan 8.75. United Arab Emirates 3.6 5. Korea, Republic of 4.5
COMMERCIAL SERVICES TRADE Value2010 2009
10 346 50 996
2010 0.28 1.45
Breakdown in economy's total exports By principal services item
19.6 24.9 64.9 41.4 15.5 33.6
INDUSTRIAL PROPERTY
Madrid Total ... ...
October 2011
Saudi Arabia, Kingdom of
Annual percentage change2005-2010 2009 2010
Real GDP (2005=100) 3 0 43 ... ...
23 ... ...
Final bound
Non ad-valorem duties (% total tariff lines) Number of disputes (complainant - defendant) Requests for consultation
in agricultural goods (AOA) in non-agricultural goods
2010 bShare in world total exports Share in world total imports
Breakdown in economy's total imports By main commodity group (ITS) By main commodity group (ITS)
By main destination By main origin
Annual percentage change2005-2010 2010
Commercial services exports (million US$) c ... 3 10Commercial services imports (million US$) c ... -5 8
2010Share in world total exports Share in world total imports
Breakdown in economy's total imports By principal services item
Transportation Transportation
Direct residents Direct non-residents
Travel Travel Other commercial services Other commercial services
17 257 274 ... ...
Patent grants by patent office, 2007 Trademark registrations by officeResidents Non-residents Total
Outstanding notifications in WTO Central Registry
MFN duty free imports (%, 2009)
a Refers to 2007 and to the average annual percentage change for 2005-2007. b Breakdowns by destination/origin refer to 2007. c Break in series for commercial services: 2008.
World Trade OrganizationTrade Profiles 2011
149Download the data:www.wto.org/statistics
CO
UN
TRY
PR
OFI
LES
BASIC INDICATORS Population (thousands, 2010) 12 434 Rank in world trade, 2010 Exports ImportsGDP (million current US$, 2010) 12 954 Merchandise 125 117GDP (million current PPP US$, 2010) 23 832 excluding intra-EU trade 100 92Current account balance (million US$, 2008) - 1 884 Commercial services 109 112Trade per capita (US$, 2007-2009) 766 excluding intra-EU trade 83 86Trade to GDP ratio (2007-2009) 72.5
2010 118
Exports of goods and services (volume, 2005=100) 122Imports of goods and services (volume, 2005=100) 135
TRADE POLICY
WTO accession 1 January 1995 Contribution to WTO budget (%, 2011) 0.021Trade Policy Review 11, 13 November 2009 Import duties collected GPA accession - in total tax revenue ...Tariffs and duty free imports to total imports ...
Tariff binding coverage (%) 100 Number of notifications to WTO and measures in force MFN tariffs Applied 2010 30
Simple average of import duties Goods RTAs - services EIAs notified to WTO 2 - 0All goods 30.0 11.9 Anti-dumping (30 June 2010) ...
Agricultural goods (AOA) 29.8 14.5 Countervailing duties (30 June 2010) ...Non-agricultural goods 30.0 11.5 Safeguards (22 October 2010) 0
0.0 0.00 - 0
0.0 Original panel / Appellate Body (AB) reports 0 - 0 17.0 Compliance panel / AB reports (Article 21.5 DSU) 0 - 0
Agricultural products 27.1 Agricultural products 23.9Fuels and mining products 27.0 Fuels and mining products 31.6Manufactures 36.2 Manufactures 44.4
1. Mali 25.4 1. European Union (27) 43.62. European Union (27) 13.8 2. Nigeria 10.23. India 9.7 3. China 8.34. Switzerland 7.7 4. Thailand 3.35. Guinea 4.2 5. Brazil 2.7 Unspecified destinations 8.7 Unspecified origins 0.3
COMMERCIAL SERVICES TRADE Value2009 2008
1 076 1 248
2009 a 0.03 0.04
Breakdown in economy's total exports By principal services item
12.2 55.4 46.1 12.7 41.7 31.9
INDUSTRIAL PROPERTY
Madrid Total ... ...
October 2011
Senegal
Annual percentage change2005-2010 2009 2010
Real GDP (2005=100) 3 2 44 -9 66 -17 4
Final bound
Non ad-valorem duties (% total tariff lines) Number of disputes (complainant - defendant) Requests for consultation
in agricultural goods (AOA) in non-agricultural goods
2009 aShare in world total exports Share in world total imports
Breakdown in economy's total imports By principal services item
Transportation Transportation
Direct residents Direct non-residents
Travel Travel Other commercial services Other commercial services
... ... ... ... ...
Patent grants by patent office Trademark registrations by officeResidents Non-residents Total
Outstanding notifications in WTO Central Registry
MFN duty free imports (%, 2009)
a Breakdowns by services items refer to 2008.
Senegal
World Trade OrganizationTrade Profiles 2011
150 Download the data:www.wto.org/statistics
Serbia
BASIC INDICATORS Population (thousands, 2010) 7 293 Rank in world trade, 2010 Exports ImportsGDP (million current US$, 2010) 39 128 Merchandise 83 75GDP (million current PPP US$, 2010) 83 776 excluding intra-EU trade 60 53Current account balance (million US$, 2010) - 2 819 Commercial services 76 76Trade per capita (US$, 2008-2010) 4 842 excluding intra-EU trade 51 54Trade to GDP ratio (2008-2010) 82.0
2010 117
Exports of goods and services (volume, 2005=100) 117Imports of goods and services (volume, 2005=100) 118
TRADE POLICY
WTO accession Observer Contribution to WTO budget -Trade Policy Review - Import duties collected GPA accession - in total tax revenue ...Tariffs and duty free imports to total imports ...
Tariff binding coverage (%) - Number of notifications to WTO and measures in force MFN tariffs Applied 2010 -
Simple average of import duties Goods RTAs - services EIAs notified to WTO 5 - 0All goods - 7.4 Anti-dumping -
Agricultural products 24.1 Agricultural products 7.6Fuels and mining products 14.8 Fuels and mining products 23.6Manufactures 59.4 Manufactures 51.8
1. European Union (27) 57.3 1. European Union (27) 56.02. Bosnia and Herzegovina 11.1 2. Russian Federation 12.93. Montenegro 8.2 3. China 7.24. Russian Federation 5.5 4. Bosnia and Herzegovina 3.35. FYR Macedonia 4.9 5. Croatia 2.6
COMMERCIAL SERVICES TRADE Value2010 2009
3 525 3 477
2010 0.10 0.10
Breakdown in economy's total exports By principal services item
22.2 28.6 22.7 27.5 55.2 44.0
INDUSTRIAL PROPERTY
Madrid Total 5 043 8 414
October 2011
Serbia
Annual percentage change2005-2010 2009 2010
Real GDP (2005=100) 3 -3 23 -12 03 -17 -4
Final bound
Non ad-valorem duties (% total tariff lines) Number of disputes (complainant - defendant) Requests for consultation
in agricultural goods (AOA) in non-agricultural goods
Agricultural products 54.9 Agricultural products 23.4Fuels and mining products 43.2 Fuels and mining products 25.7Manufactures 1.8 Manufactures 48.2
1. European Union (27) 40.9 1. European Union (27) 29.72. Saudi Arabia, Kingdom of 26.8 2. United Arab Emirates 16.73. Switzerland 0.8 3. Saudi Arabia, Kingdom of 14.54. Sri Lanka 0.7 4. Singapore 8.25. United States 0.5 5. South Africa 6.2 Unspecified destinations 27.3 Unspecified origins 0.0
COMMERCIAL SERVICES TRADE Value2010 2009 404 334
2010 0.01 0.01
Breakdown in economy's total exports By principal services item
44.6 52.6 51.0 11.1 4.5 36.2
INDUSTRIAL PROPERTY
Madrid Total ... 309
October 2011
Seychelles
Annual percentage change2005-2010 2009 2010
Real GDP (2005=100) 5 1 622 11 ...17 2 ...
Final bound
Non ad-valorem duties (% total tariff lines) Number of disputes (complainant - defendant) Requests for consultation
in agricultural goods (AOA) in non-agricultural goods
2010Share in world total exports Share in world total imports
Breakdown in economy's total imports By principal services item
Transportation Transportation
Direct residents Direct non-residents
Travel Travel Other commercial services Other commercial services
... 6 6 2 307
Patent grants by patent office, 1996 Trademark registrations by office, 2003Residents Non-residents Total
Outstanding notifications in WTO Central Registry
MFN duty free imports (%, 2008)
a Refers to 2009 and to the average annual percentage change for 2005-2009. b Breakdowns by destination/origin refer to 2008.
Seychelles
World Trade OrganizationTrade Profiles 2011
152 Download the data:www.wto.org/statistics
Sierra Leone
BASIC INDICATORS Population (thousands, 2010) 5 868 Rank in world trade, 2010 Exports ImportsGDP (million current US$, 2010) 1 905 Merchandise 165 171GDP (million current PPP US$, 2010) 4 815 excluding intra-EU trade 139 145Current account balance (million US$, 2010) - 320 Commercial services 182 174Trade per capita (US$, 2008-2010) 184 excluding intra-EU trade 156 148Trade to GDP ratio (2008-2010) 55.4
2010 131
Exports of goods and services (volume, 2005=100) ...Imports of goods and services (volume, 2005=100) ...
TRADE POLICY
WTO accession 23 July 1995 Contribution to WTO budget (%, 2011) 0.015Trade Policy Review 9, 11 February 2005 Import duties collected (%, 2007-2009) GPA accession - in total tax revenue 40.9Tariffs and duty free imports to total imports 14.0
Tariff binding coverage (%) 100 Number of notifications to WTO and measures in force MFN tariffs Applied 2006 42
Simple average of import duties Goods RTAs - services EIAs notified to WTO 1 - 0All goods 47.4 13.6 Anti-dumping (30 June 2010) ...
Agricultural goods (AOA) 40.4 16.4 Countervailing duties (30 June 2010) ...Non-agricultural goods 48.5 13.1 Safeguards (22 October 2010) 0
0.0 0.30 - 0
... Original panel / Appellate Body (AB) reports 0 - 0
2010Share in world total exports Share in world total imports
Breakdown in economy's total imports By principal services item
Transportation Transportation
Direct residents Direct non-residents
Travel Travel Other commercial services Other commercial services
... 5 5 ... ...
Patent grants by patent office, 1995 Trademark registrations by office, 2009Residents Non-residents Total
Outstanding notifications in WTO Central Registry
MFN duty free imports
World Trade OrganizationTrade Profiles 2011
153Download the data:www.wto.org/statistics
CO
UN
TRY
PR
OFI
LES
BASIC INDICATORS Population (thousands, 2010) 5 077 Rank in world trade, 2010 Exports ImportsGDP (million current US$, 2010) 222 699 Merchandise 14 15GDP (million current PPP US$, 2010) 291 937 excluding intra-EU trade 9 9Current account balance (million US$, 2009) 32 628 Commercial services 10 11Trade per capita (US$, 2008-2010) 161 763 excluding intra-EU trade 6 6Trade to GDP ratio (2008-2010) 404.9
2010 136
Exports of goods and services (volume, 2005=100) 138Imports of goods and services (volume, 2005=100) 136
TRADE POLICY
WTO accession 1 January 1995 Contribution to WTO budget (%, 2011) 2.202Trade Policy Review 14, 16 July 2008 Import duties collected (%, 2007-2009) GPA accession 20 October 1997 in total tax revenue 0.0Tariffs and duty free imports to total imports 0.0
Tariff binding coverage (%) 69.7 Number of notifications to WTO and measures in force MFN tariffs Applied 2010 15
Simple average of import duties Goods RTAs - services EIAs notified to WTO 19 - 15All goods 9.9 0.0 Anti-dumping (30 June 2010) ...
Agricultural goods (AOA) 24.6 0.2 Countervailing duties (30 June 2010) ...Non-agricultural goods 6.4 0.0 Safeguards (22 October 2010) 0
0.5 0.01 - 0
98.5 Original panel / Appellate Body (AB) reports 0 - 0 100.0 Compliance panel / AB reports (Article 21.5 DSU) 0 - 0
Agricultural products 2.2 Agricultural products 3.5Fuels and mining products 17.3 Fuels and mining products 27.6Manufactures 72.2 Manufactures 64.9
1. Malaysia 11.9 1. European Union (27) 12.32. Hong Kong, China 11.7 2. Malaysia 11.73. China 10.3 3. United States 11.54. European Union (27) 10.0 4. China 10.85. Indonesia 9.4 5. Japan 7.9
COMMERCIAL SERVICES TRADE Value2010 2009
111 912 96 105
2010 3.03 2.74
Breakdown in economy's total exports By principal services item
29.2 29.5 12.6 17.4 58.2 53.1
INDUSTRIAL PROPERTY
Madrid Total 5 139 14 662
October 2011
Singapore
Annual percentage change2005-2010 2009 2010
Real GDP (2005=100) 6 -1 147 -8 196 -11 17
Final bound
Non ad-valorem duties (% total tariff lines) Number of disputes (complainant - defendant) Requests for consultation
in agricultural goods (AOA) in non-agricultural goods
2010Share in world total exports Share in world total imports
Breakdown in economy's total imports By principal services item
Transportation Transportation
Direct residents Direct non-residents
Travel Travel Other commercial services Other commercial services
473 5 136 5 609 3 646 5 877
Patent grants by patent office, 2009 Trademark registrations by office, 2009Residents Non-residents Total
Outstanding notifications in WTO Central Registry
MFN duty free imports (%, 2009)
Singapore
World Trade OrganizationTrade Profiles 2011
154 Download the data:www.wto.org/statistics
Slovak Republic
BASIC INDICATORS Population (thousands, 2010) 5 433 Rank in world trade, 2010 Exports ImportsGDP (million current US$, 2010) 89 034 Merchandise 45 39GDP (million current PPP US$, 2010) 129 843 excluding intra-EU trade - -Current account balance (million US$, 2010) - 3 004 Commercial services 60 61Trade per capita (US$, 2008-2010) 26 338 excluding intra-EU trade - -Trade to GDP ratio (2008-2010) 155.6
2010 120
Exports of goods and services (volume, 2005=100) 166Imports of goods and services (volume, 2005=100) 155
TRADE POLICY
WTO accession 1 January 1995 Contribution to WTO budget (%, 2011) 0.363Trade Policy Review 6, 8 July 2011 Import duties collected GPA accession 1 May 2004 in total tax revenue ...Tariffs and duty free imports to total imports ...
Tariff binding coverage (%) 100 Number of notifications to WTO and measures in force MFN tariffs Applied 2010 18
Simple average of import duties Goods RTAs - services EIAs notified to WTO 31 - 10All goods 5.0 5.1 Anti-dumping (30 June 2010) 149
Agricultural goods (AOA) 12.3 12.8 Countervailing duties (30 June 2010) 8Non-agricultural goods 3.9 4.0 Safeguards (22 October 2010) 0
4.8 4.785 - 73
41.1 Original panel / Appellate Body (AB) reports 33 - 32 51.4 Compliance panel / AB reports (Article 21.5 DSU) 4 - 4
Agricultural products 5.7 Agricultural products 7.7Fuels and mining products 7.6 Fuels and mining products 16.2Manufactures 86.4 Manufactures 75.8
1. European Union (27) 84.4 1. European Union (27) 51.22. Russian Federation 3.9 2. Russian Federation 9.43. China 2.0 3. Korea, Republic of 7.84. Turkey 1.7 4. China 5.95. United States 1.5 5. Japan 1.7
COMMERCIAL SERVICES TRADE Value2010 2009
5 816 6 775
2010 0.16 0.19
Breakdown in economy's total exports By principal services item
31.1 28.0 39.4 30.0 29.5 42.0
INDUSTRIAL PROPERTY
Madrid Total 2 626 5 723
October 2011
Slovak Republic
Annual percentage change2005-2010 2009 2010
Real GDP (2005=100) 4 -6 011 9 79 8 8
Final bound
Non ad-valorem duties (% total tariff lines) Number of disputes (complainant - defendant) Requests for consultation
in agricultural goods (AOA) in non-agricultural goods
2010Share in world total exports Share in world total imports
Breakdown in economy's total imports By principal services item
Transportation Transportation
Direct residents Direct non-residents
Travel Travel Other commercial services Other commercial services
66 488 554 2 235 862
Patent grants by patent office, 2009 Trademark registrations by office, 2009Residents Non-residents Total
Outstanding notifications in WTO Central Registry
MFN duty free imports (%, 2009)
World Trade OrganizationTrade Profiles 2011
155Download the data:www.wto.org/statistics
CO
UN
TRY
PR
OFI
LES
BASIC INDICATORS Population (thousands, 2010) 2 053 Rank in world trade, 2010 Exports ImportsGDP (million current US$, 2010) 47 763 Merchandise 61 60GDP (million current PPP US$, 2010) 56 568 excluding intra-EU trade - -Current account balance (million US$, 2010) - 542 Commercial services 61 69Trade per capita (US$, 2008-2010) 31 283 excluding intra-EU trade - -Trade to GDP ratio (2008-2010) 126.2
2010 109
Exports of goods and services (volume, 2005=100) a 132Imports of goods and services (volume, 2005=100) a 134
TRADE POLICY
WTO accession 30 July 1995 Contribution to WTO budget (%, 2011) 0.193Trade Policy Review 6, 8 July 2011 Import duties collected GPA accession 1 May 2004 in total tax revenue ...Tariffs and duty free imports to total imports ...
Tariff binding coverage (%) 100 Number of notifications to WTO and measures in force MFN tariffs Applied 2010 18
Simple average of import duties Goods RTAs - services EIAs notified to WTO 31 - 10All goods 5.0 5.1 Anti-dumping (30 June 2010) 149
Agricultural goods (AOA) 12.3 12.8 Countervailing duties (30 June 2010) 8Non-agricultural goods 3.9 4.0 Safeguards (22 October 2010) 0
4.8 4.785 - 70
41.1 Original panel / Appellate Body (AB) reports 33 - 32 51.4 Compliance panel / AB reports (Article 21.5 DSU) 4 - 4
Agricultural products 8.0 Agricultural products 11.8Fuels and mining products 8.2 Fuels and mining products 17.8Manufactures 83.7 Manufactures 69.9
1. European Union (27) 71.6 1. European Union (27) 66.42. Croatia 6.7 2. China 5.33. Serbia 3.6 3. Croatia 3.84. Russian Federation 2.9 4. United States 2.55. Bosnia and Herzegovina 2.9 5. Switzerland 2.0 Unspecified destinations 0.1 Unspecified origins 2.0
COMMERCIAL SERVICES TRADE Value2010 2009
5 767 4 284
2010 0.16 0.12
Breakdown in economy's total exports By principal services item
26.4 21.7 40.0 27.9 33.6 50.4
INDUSTRIAL PROPERTY
Madrid Total 2 386 3 831
October 2011
Slovenia
Annual percentage change2005-2010 2009 2010
Real GDP (2005=100) 2 -8 110 ... ...10 ... ...
Final bound
Non ad-valorem duties (% total tariff lines) Number of disputes (complainant - defendant) Requests for consultation
in agricultural goods (AOA) in non-agricultural goods
2010Share in world total exports Share in world total imports
Breakdown in economy's total imports By principal services item
Transportation Transportation
Direct residents Direct non-residents
Travel Travel Other commercial services Other commercial services
239 7 246 1 158 287
Patent grants by patent office, 2009 Trademark registrations by office, 2009Residents Non-residents Total
Outstanding notifications in WTO Central Registry
MFN duty free imports (%, 2009)
a Refers to 2008 and to the average annual percentage change for 2005-2008.
Slovenia
World Trade OrganizationTrade Profiles 2011
156 Download the data:www.wto.org/statistics
Solomon Islands
BASIC INDICATORS Population (thousands, 2010) 538 Rank in world trade, 2010 Exports ImportsGDP (million current US$, 2010) 679 Merchandise 171 183GDP (million current PPP US$, 2010) 1 447 excluding intra-EU trade 145 157Current account balance (million US$, 2009) - 121 Commercial services 176 170Trade per capita (US$, 2008-2010) 1 315 excluding intra-EU trade 150 144Trade to GDP ratio (2008-2010) 107.4
2010 134
Exports of goods and services (volume, 2005=100) ...Imports of goods and services (volume, 2005=100) ...
TRADE POLICY
WTO accession 26 July 1996 Contribution to WTO budget (%, 2011) 0.015Trade Policy Review 6, 8 May 2009 Import duties collected GPA accession - in total tax revenue ...Tariffs and duty free imports to total imports ...
Tariff binding coverage (%) 100 Number of notifications to WTO and measures in force MFN tariffs Applied 2010 45
Simple average of import duties Goods RTAs - services EIAs notified to WTO 3 - 0All goods 78.4 9.7 Anti-dumping (30 June 2010) ...
Agricultural goods (AOA) 71.9 13.2 Countervailing duties (30 June 2010) ...Non-agricultural goods 79.4 9.1 Safeguards (22 October 2010) 0
1.5 3.00 - 0
... Original panel / Appellate Body (AB) reports 0 - 0
Agricultural products 95.0 Agricultural products 19.9Fuels and mining products 0.1 Fuels and mining products 25.0Manufactures 0.3 Manufactures 52.0
1. China 46.5 1. Australia 31.22. European Union (27) 12.8 2. Singapore 27.13. Thailand 7.2 3. Japan 8.24. Philippines 7.1 4. Malaysia 5.85. Korea, Dem. People's Rep. of 6.1 5. Papua New Guinea 5.7
COMMERCIAL SERVICES TRADE Value2010 2009 92
167
2010 a 0.00 0.00
Breakdown in economy's total exports By principal services item
21.6 37.8 64.4 33.4 14.1 28.8
INDUSTRIAL PROPERTY
Madrid Total ... ...
October 2011
Solomon Islands
Annual percentage change2005-2010 2009 2010
Real GDP (2005=100) 6 -1 7... ... ...... ... ...
Final bound
Non ad-valorem duties (% total tariff lines) Number of disputes (complainant - defendant) Requests for consultation
in agricultural goods (AOA) in non-agricultural goods
2010 aShare in world total exports Share in world total imports
Breakdown in economy's total imports By main commodity group (ITS) By main commodity group (ITS)
By main destination By main origin
Annual percentage change2005-2010 2010
Commercial services exports (million US$) b ... 27 35Commercial services imports (million US$) b ... -16 76
2010 aShare in world total exports Share in world total imports
Breakdown in economy's total imports By principal services item
Transportation Transportation
Direct residents Direct non-residents
Travel Travel Other commercial services Other commercial services
... ... ... ... ...
Patent grants by patent office Trademark registrations by officeResidents Non-residents Total
Outstanding notifications in WTO Central Registry
MFN duty free imports
a Breakdowns by destination/origin refer to 2007. Breakdowns by services items refer to 2009. b Break in series for commercial services: 2006.
World Trade OrganizationTrade Profiles 2011
157Download the data:www.wto.org/statistics
CO
UN
TRY
PR
OFI
LES
BASIC INDICATORS Population (thousands, 2010) 49 991 Rank in world trade, 2010 Exports ImportsGDP (million current US$, 2010) 363 704 Merchandise 38 32GDP (million current PPP US$, 2010) 524 198 excluding intra-EU trade 25 22Current account balance (million US$, 2010) - 9 987 Commercial services 43 40Trade per capita (US$, 2008-2010) 3 805 excluding intra-EU trade 26 25Trade to GDP ratio (2008-2010) 61.1
2010 117
Exports of goods and services (volume, 2005=100) 109Imports of goods and services (volume, 2005=100) 114
TRADE POLICY
WTO accession 1 January 1995 Contribution to WTO budget (%, 2011) 0.560Trade Policy Review 4, 6 November 2009 Import duties collected GPA accession - in total tax revenue ...Tariffs and duty free imports to total imports ...
Tariff binding coverage (%) 96.4 Number of notifications to WTO and measures in force MFN tariffs Applied 2010 15
Simple average of import duties Goods RTAs - services EIAs notified to WTO 4 - 0All goods 19.0 7.7 Anti-dumping (30 June 2010) 38
Agricultural goods (AOA) 39.5 9.0 Countervailing duties (30 June 2010) 1Non-agricultural goods 15.8 7.5 Safeguards (22 October 2010) 0
0.0 2.20 - 3
38.2 Original panel / Appellate Body (AB) reports 0 - 0 71.7 Compliance panel / AB reports (Article 21.5 DSU) 0 - 0
Agricultural products 9.6 Agricultural products 6.8Fuels and mining products 37.3 Fuels and mining products 21.8Manufactures 40.1 Manufactures 70.2
1. European Union (27) 26.1 1. European Union (27) 32.12. China 11.4 2. China 14.33. United States 9.9 3. United States 7.34. Japan 9.0 4. Japan 5.35. India 4.2 5. Saudi Arabia, Kingdom of 4.0
COMMERCIAL SERVICES TRADE Value2010 2009
13 617 18 023
2010 0.37 0.51
Breakdown in economy's total exports By principal services item
11.9 39.3 66.7 31.0 21.4 29.6
INDUSTRIAL PROPERTY
Madrid Total ... 19 753
October 2011
South Africa
Annual percentage change2005-2010 2009 2010
Real GDP (2005=100) 3 -2 32 -20 163 -17 6
Final bound
Non ad-valorem duties (% total tariff lines) Number of disputes (complainant - defendant) Requests for consultation
in agricultural goods (AOA) in non-agricultural goods
2010Share in world total exports Share in world total imports
Breakdown in economy's total imports By principal services item
Transportation Transportation
Direct residents Direct non-residents
Travel Travel Other commercial services Other commercial services
... ... 7 740 10 948 8 805
Patent grants by patent office, 2008 Trademark registrations by office, 2009Residents Non-residents Total
Outstanding notifications in WTO Central Registry
MFN duty free imports (%, 2009)
South Africa
World Trade OrganizationTrade Profiles 2011
158 Download the data:www.wto.org/statistics
Spain
BASIC INDICATORS Population (thousands, 2010) 46 082 Rank in world trade, 2010 Exports ImportsGDP (million current US$, 2010) 1 407 405 Merchandise 18 14GDP (million current PPP US$, 2010) 1 477 840 excluding intra-EU trade - -Current account balance (million US$, 2010) - 63 428 Commercial services 8 14Trade per capita (US$, 2008-2010) 17 713 excluding intra-EU trade - -Trade to GDP ratio (2008-2010) 54.6
2010 104
Exports of goods and services (volume, 2005=100) a 100Imports of goods and services (volume, 2005=100) a 93
TRADE POLICY
WTO accession 1 January 1995 Contribution to WTO budget (%, 2011) 2.617Trade Policy Review 6, 8 July 2011 Import duties collected GPA accession 1 January 1996 in total tax revenue ...Tariffs and duty free imports to total imports ...
Tariff binding coverage (%) 100 Number of notifications to WTO and measures in force MFN tariffs Applied 2010 18
Simple average of import duties Goods RTAs - services EIAs notified to WTO 31 - 10All goods 5.0 5.1 Anti-dumping (30 June 2010) 149
Agricultural goods (AOA) 12.3 12.8 Countervailing duties (30 June 2010) 8Non-agricultural goods 3.9 4.0 Safeguards (22 October 2010) 0
4.8 4.785 - 70
41.1 Original panel / Appellate Body (AB) reports 33 - 32 51.4 Compliance panel / AB reports (Article 21.5 DSU) 4 - 4
Agricultural products 16.3 Agricultural products 11.7Fuels and mining products 9.9 Fuels and mining products 22.4Manufactures 71.8 Manufactures 65.3
1. European Union (27) 68.3 1. European Union (27) 57.52. United States 3.6 2. China 7.03. Morocco 1.9 3. United States 4.14. Turkey 1.8 4. Russian Federation 2.25. Switzerland 1.7 5. Algeria 1.8 Unspecified destinations 2.9 Unspecified origins 0.0
COMMERCIAL SERVICES TRADE Value2010 2009
123 010 86 576
2010 3.33 2.47
Breakdown in economy's total exports By principal services item
15.6 22.6 42.7 19.4 41.7 58.0
INDUSTRIAL PROPERTY
Madrid Total 3 843 46 617
October 2011
Spain
Annual percentage change2005-2010 2009 2010
Real GDP (2005=100) 1 -4 00 -12 ...
-2 -18 ...
Final bound
Non ad-valorem duties (% total tariff lines) Number of disputes (complainant - defendant) Requests for consultation
in agricultural goods (AOA) in non-agricultural goods
2010Share in world total exports Share in world total imports
Breakdown in economy's total imports By principal services item
Transportation Transportation
Direct residents Direct non-residents
Travel Travel Other commercial services Other commercial services
2 357 245 2 602 41 051 1 723
Patent grants by patent office, 2009 Trademark registrations by office, 2009Residents Non-residents Total
Outstanding notifications in WTO Central Registry
MFN duty free imports (%, 2009)
a Refers to 2009 and to the average annual percentage change for 2005-2009. b Breakdowns by destination/origin refer to 2009.
World Trade OrganizationTrade Profiles 2011
159Download the data:www.wto.org/statistics
CO
UN
TRY
PR
OFI
LES
BASIC INDICATORS Population (thousands, 2010) 20 860 Rank in world trade, 2010 Exports ImportsGDP (million current US$, 2010) 49 552 Merchandise 90 80GDP (million current PPP US$, 2010) 105 139 excluding intra-EU trade 66 58Current account balance (million US$, 2010) - 1 418 Commercial services 86 79Trade per capita (US$, 2008-2010) 1 167 excluding intra-EU trade 60 57Trade to GDP ratio (2008-2010) 54.7
2010 136
Exports of goods and services (volume, 2005=100) ...Imports of goods and services (volume, 2005=100) ...
TRADE POLICY
WTO accession 1 January 1995 Contribution to WTO budget (%, 2011) 0.071Trade Policy Review 4, 5 November 2010 Import duties collected (%, 2006-2008) GPA accession Observer in total tax revenue 11.3Tariffs and duty free imports to total imports 4.0
Tariff binding coverage (%) 38.1 Number of notifications to WTO and measures in force MFN tariffs Applied 2010 38
Simple average of import duties Goods RTAs - services EIAs notified to WTO 6 - 0All goods 30.2 10.6 Anti-dumping (30 June 2010) ...
Agricultural goods (AOA) 50.0 26.3 Countervailing duties (30 June 2010) ...Non-agricultural goods 19.6 8.2 Safeguards (22 October 2010) 0
0.5 3.01 - 0
14.1 Original panel / Appellate Body (AB) reports 0 - 0 64.1 Compliance panel / AB reports (Article 21.5 DSU) 0 - 0
Agricultural products 30.1 Agricultural products 15.3Fuels and mining products 1.0 Fuels and mining products 24.0Manufactures 65.0 Manufactures 58.6
1. European Union (27) 35.0 1. India 20.62. United States 21.3 2. Singapore 13.13. India 5.6 3. European Union (27) 12.44. United Arab Emirates 3.0 4. China 10.15. Russian Federation 2.9 5. Iran, Islamic Rep. of 5.3
COMMERCIAL SERVICES TRADE Value2010 2009
2 448 3 084
2010 0.07 0.09
Breakdown in economy's total exports By principal services item
47.2 66.0 23.5 14.7 29.3 19.3
INDUSTRIAL PROPERTY
Madrid Total ... 2 184
October 2011
Sri Lanka
Annual percentage change2005-2010 2009 2010
Real GDP (2005=100) 6 4 8... ... ...... ... ...
Final bound
Non ad-valorem duties (% total tariff lines) Number of disputes (complainant - defendant) Requests for consultation
in agricultural goods (AOA) in non-agricultural goods
2010Share in world total exports Share in world total imports
Breakdown in economy's total imports By principal services item
Transportation Transportation
Direct residents Direct non-residents
Travel Travel Other commercial services Other commercial services
54 37 91 907 1 277
Patent grants by patent office, 2007 Trademark registrations by office, 2008Residents Non-residents Total
Outstanding notifications in WTO Central Registry
MFN duty free imports (%, 2009)
Sri Lanka
World Trade OrganizationTrade Profiles 2011
160 Download the data:www.wto.org/statistics
Sudan
BASIC INDICATORS Population (thousands, 2010) 43 552 Rank in world trade, 2010 Exports ImportsGDP (million current US$, 2010) 62 046 Merchandise 79 87GDP (million current PPP US$, 2010) 97 512 excluding intra-EU trade 56 63Current account balance (million US$, 2010) - 1 165 Commercial services 152 83Trade per capita (US$, 2008-2010) 518 excluding intra-EU trade 126 61Trade to GDP ratio (2008-2010) 37.8
2010 142
Exports of goods and services (volume, 2005=100) a 165Imports of goods and services (volume, 2005=100) a 104
TRADE POLICY
WTO accession Observer Contribution to WTO budget -Trade Policy Review - Import duties collected GPA accession - in total tax revenue ...Tariffs and duty free imports to total imports ...
Tariff binding coverage (%) - Number of notifications to WTO and measures in force MFN tariffs Applied 2010 -
Simple average of import duties Goods RTAs - services EIAs notified to WTO 3 - 0All goods - 19.9 Anti-dumping -
Agricultural products 6.9 Agricultural products 16.0Fuels and mining products 88.0 Fuels and mining products 4.9Manufactures 0.8 Manufactures 77.6
1. China 65.3 1. China 16.62. United Arab Emirates 10.5 2. European Union (27) 14.43. Canada 8.8 3. Japan 9.54. Saudi Arabia, Kingdom of 2.8 4. Saudi Arabia, Kingdom of 7.65. Japan 2.3 5. United Arab Emirates 7.4
COMMERCIAL SERVICES TRADE Value2010 2009 224
2 792
2010 0.01 0.08
Breakdown in economy's total exports By principal services item
2.1 57.4 42.1 40.0 55.8 2.7
INDUSTRIAL PROPERTY
Madrid Total 736 736
October 2011
Sudan
Annual percentage change2005-2010 2009 2010
Real GDP (2005=100) 7 4 418 ... ...1 ... ...
Final bound
Non ad-valorem duties (% total tariff lines) Number of disputes (complainant - defendant) Requests for consultation
in agricultural goods (AOA) in non-agricultural goods
2010Share in world total exports Share in world total imports
Breakdown in economy's total imports By principal services item
Transportation Transportation
Direct residents Direct non-residents
Travel Travel Other commercial services Other commercial services
140 ... 140 ... ...
Patent grants by patent office, 2007 Trademark registrations by office, 2009Residents Non-residents Total
Outstanding notifications in WTO Central Registry
MFN duty free imports (%, 2009)
a Refers to 2008 and to the average annual percentage change for 2005-2008. b Breakdowns by destination/origin refer to 2009.
World Trade OrganizationTrade Profiles 2011
161Download the data:www.wto.org/statistics
CO
UN
TRY
PR
OFI
LES
BASIC INDICATORS Population (thousands, 2010) 525 Rank in world trade, 2010 Exports ImportsGDP (million current US$, 2009) 3 252 Merchandise 126 158GDP (million current PPP US$, 2009) 3 949 excluding intra-EU trade 101 132Current account balance (million US$, 2010) 692 Commercial services 156 164Trade per capita (US$, 2008-2010) 6 934 excluding intra-EU trade 130 138Trade to GDP ratio (2007-2009) 113.4
2009 118
Exports of goods and services (volume, 2005=100) ...Imports of goods and services (volume, 2005=100) ...
TRADE POLICY
WTO accession 1 January 1995 Contribution to WTO budget (%, 2011) 0.015Trade Policy Review 12, 14 July 2004 Import duties collected GPA accession - in total tax revenue ...Tariffs and duty free imports to total imports ...
Tariff binding coverage (%) 26.7 Number of notifications to WTO and measures in force MFN tariffs Applied 2010 32
Simple average of import duties Goods RTAs - services EIAs notified to WTO 2 - 2All goods 18.2 10.4 Anti-dumping (30 June 2010) ...
Agricultural goods (AOA) 19.8 18.4 Countervailing duties (30 June 2010) ...Non-agricultural goods 16.5 9.2 Safeguards (22 October 2010) 0
0.0 0.00 - 0
... Original panel / Appellate Body (AB) reports 0 - 0
Agricultural products 2.8 Agricultural products 14.8Fuels and mining products 13.0 Fuels and mining products 19.9Manufactures 1.9 Manufactures 61.6
1. Canada 28.5 1. United States 24.62. European Union (27) 18.5 2. Trinidad and Tobago 23.73. United Arab Emirates 13.7 3. European Union (27) 22.64. Switzerland 8.8 4. China 7.25. United States 7.6 5. Brazil 3.9
COMMERCIAL SERVICES TRADE Value2010 2009 207 236
2010 0.01 0.01
Breakdown in economy's total exports By principal services item
14.9 30.7 29.4 16.6 55.7 52.7
INDUSTRIAL PROPERTY
Madrid Total ... 1 531
October 2011
Suriname
Annual percentage change2005-2009 2008 2009
Real GDP (2005=100) 4 5 3... ... ...... ... ...
Final bound
Non ad-valorem duties (% total tariff lines) Number of disputes (complainant - defendant) Requests for consultation
in agricultural goods (AOA) in non-agricultural goods
2010Share in world total exports Share in world total imports
Breakdown in economy's total imports By principal services item
Transportation Transportation
Direct residents Direct non-residents
Travel Travel Other commercial services Other commercial services
... ... ... 69 1 462
Patent grants by patent office Trademark registrations by office, 1996Residents Non-residents Total
Outstanding notifications in WTO Central Registry
MFN duty free imports
Suriname
World Trade OrganizationTrade Profiles 2011
162 Download the data:www.wto.org/statistics
Swaziland
BASIC INDICATORS Population (thousands, 2010) 1 186 Rank in world trade, 2010 Exports ImportsGDP (million current US$, 2010) 3 645 Merchandise 135 154GDP (million current PPP US$, 2010) 5 969 excluding intra-EU trade 110 128Current account balance (million US$, 2009) - 414 Commercial services 157 146Trade per capita (US$, 2007-2009) 3 729 excluding intra-EU trade 131 120Trade to GDP ratio (2007-2009) 147.6
2010 111
Exports of goods and services (volume, 2005=100) 114Imports of goods and services (volume, 2005=100) 118
TRADE POLICY
WTO accession 1 January 1995 Contribution to WTO budget (%, 2011) 0.015Trade Policy Review 4, 6 November 2009 Import duties collected GPA accession - in total tax revenue ...Tariffs and duty free imports to total imports ...
Tariff binding coverage (%) 96.4 Number of notifications to WTO and measures in force MFN tariffs Applied 2010 56
Simple average of import duties Goods RTAs - services EIAs notified to WTO 4 - 0All goods 19.0 7.7 Anti-dumping (30 June 2010) ...
Agricultural goods (AOA) 39.5 9.1 Countervailing duties (30 June 2010) ...Non-agricultural goods 15.8 7.4 Safeguards (22 October 2010) 0
0.0 2.20 - 0
42.8 Original panel / Appellate Body (AB) reports 0 - 0 48.3 Compliance panel / AB reports (Article 21.5 DSU) 0 - 0
Agricultural products 16.8 Agricultural products 14.8Fuels and mining products 1.1 Fuels and mining products 10.5Manufactures 78.5 Manufactures 69.9
1. South Africa 79.8 1. South Africa 81.42. European Union (27) 13.9 2. China 4.03. Namibia 2.8 3. European Union (27) 2.74. Mozambique 1.8 4. Japan 2.45. United Arab Emirates 0.5 5. Taipei, Chinese 1.9
COMMERCIAL SERVICES TRADE Value2009 2008 191 539
2009 0.01 0.02
Breakdown in economy's total exports By principal services item
3.9 33.4 20.8 13.3 75.3 53.3
INDUSTRIAL PROPERTY
Madrid Total 680 680
October 2011
Swaziland
Annual percentage change2005-2010 2009 2010
Real GDP (2005=100) 2 0 13 -6 -23 -3 1
Final bound
Non ad-valorem duties (% total tariff lines) Number of disputes (complainant - defendant) Requests for consultation
in agricultural goods (AOA) in non-agricultural goods
2009Share in world total exports Share in world total imports
Breakdown in economy's total imports By principal services item
Transportation Transportation
Direct residents Direct non-residents
Travel Travel Other commercial services Other commercial services
... ... ... ... ...
Patent grants by patent office Trademark registrations by office, 2009Residents Non-residents Total
Outstanding notifications in WTO Central Registry
MFN duty free imports (%, 2007)
a Breakdowns by destination/origin refer to 2007.
World Trade OrganizationTrade Profiles 2011
163Download the data:www.wto.org/statistics
CO
UN
TRY
PR
OFI
LES
BASIC INDICATORS Population (thousands, 2010) 9 379 Rank in world trade, 2010 Exports ImportsGDP (million current US$, 2010) 458 004 Merchandise 26 28GDP (million current PPP US$, 2010) 365 286 excluding intra-EU trade - -Current account balance (million US$, 2010) 29 022 Commercial services 19 22Trade per capita (US$, 2008-2010) 45 074 excluding intra-EU trade - -Trade to GDP ratio (2008-2010) 93.3
2010 107
Exports of goods and services (volume, 2005=100) a 102Imports of goods and services (volume, 2005=100) a 106
TRADE POLICY
WTO accession 1 January 1995 Contribution to WTO budget (%, 2011) 1.316Trade Policy Review 6, 8 July 2011 Import duties collected GPA accession 1 January 1996 in total tax revenue ...Tariffs and duty free imports to total imports ...
Tariff binding coverage (%) 100 Number of notifications to WTO and measures in force MFN tariffs Applied 2010 18
Simple average of import duties Goods RTAs - services EIAs notified to WTO 31 - 10All goods 5.0 5.1 Anti-dumping (30 June 2010) 149
Agricultural goods (AOA) 12.3 12.8 Countervailing duties (30 June 2010) 8Non-agricultural goods 3.9 4.0 Safeguards (22 October 2010) 0
4.8 4.785 - 71
41.1 Original panel / Appellate Body (AB) reports 33 - 32 51.4 Compliance panel / AB reports (Article 21.5 DSU) 4 - 4
Agricultural products 8.9 Agricultural products 10.5Fuels and mining products 12.4 Fuels and mining products 17.2Manufactures 76.3 Manufactures 72.0
1. European Union (27) 57.0 1. European Union (27) 68.02. Norway 10.0 2. Norway 9.13. United States 7.3 3. Russian Federation 4.84. China 3.1 4. China 4.15. Russian Federation 1.8 5. United States 3.2
COMMERCIAL SERVICES TRADE Value2010 2009
63 968 48 307
2010 1.73 1.38
Breakdown in economy's total exports By principal services item
16.1 17.1 17.3 27.8 66.6 55.1
INDUSTRIAL PROPERTY
Madrid Total 2 062 10 514
October 2011
Sweden
Annual percentage change2005-2010 2009 2010
Real GDP (2005=100) 1 -5 61 -12 ...2 -13 ...
Final bound
Non ad-valorem duties (% total tariff lines) Number of disputes (complainant - defendant) Requests for consultation
in agricultural goods (AOA) in non-agricultural goods
2010Share in world total exports Share in world total imports
Breakdown in economy's total imports By principal services item
Transportation Transportation
Direct residents Direct non-residents
Travel Travel Other commercial services Other commercial services
1 037 187 1 224 7 763 689
Patent grants by patent office, 2008 Trademark registrations by office, 2009Residents Non-residents Total
Outstanding notifications in WTO Central Registry
MFN duty free imports (%, 2009)
a Refers to 2009 and to the average annual percentage change for 2005-2009.
Sweden
World Trade OrganizationTrade Profiles 2011
164 Download the data:www.wto.org/statistics
Switzerland
BASIC INDICATORS Population (thousands, 2010) 7 825 Rank in world trade, 2010 Exports ImportsGDP (million current US$, 2010) 523 772 Merchandise 24 23GDP (million current PPP US$, 2010) 361 643 excluding intra-EU trade 18 17Current account balance (million US$, 2010) 70 364 Commercial services 16 27Trade per capita (US$, 2008-2010) 74 084 excluding intra-EU trade 9 17Trade to GDP ratio (2008-2010) 113.3
2010 110
Exports of goods and services (volume, 2005=100) a 114Imports of goods and services (volume, 2005=100) a 107
TRADE POLICY
WTO accession 1 July 1995 Contribution to WTO budget (%, 2011) 1.342Trade Policy Review 15, 16 December 2008 Import duties collected (%, 2006-2008) GPA accession 1 January 1996 in total tax revenue 2.4Tariffs and duty free imports to total imports 1.1
Tariff binding coverage (%) 99.5 Number of notifications to WTO and measures in force MFN tariffs Applied 2010 9
Simple average of import duties Goods RTAs - services EIAs notified to WTO 23 - 6All goods 8.1 5.2 Anti-dumping (30 June 2010) ...
Agricultural goods (AOA) 48.2 27.2 Countervailing duties (30 June 2010) ...Non-agricultural goods 2.0 1.9 Safeguards (22 October 2010) 0
81.1 80.04 - 0
18.2 Original panel / Appellate Body (AB) reports 1 - 0 37.7 Compliance panel / AB reports (Article 21.5 DSU) 0 - 0
Agricultural products 4.1 Agricultural products 6.8Fuels and mining products 6.8 Fuels and mining products 11.4Manufactures 88.3 Manufactures 80.7
1. European Union (27) 58.7 1. European Union (27) 77.52. United States 10.1 2. United States 5.43. China 3.7 3. China 3.34. Japan 3.3 4. Japan 2.05. Hong Kong, China 3.2 5. Viet Nam 1.6
COMMERCIAL SERVICES TRADE Value2010 2009
77 745 37 884
2010 2.11 1.08
Breakdown in economy's total exports By principal services item
8.0 22.3 19.1 28.8 72.9 48.8
INDUSTRIAL PROPERTY
Madrid Total 12 659 26 800
October 2011
Switzerland
Annual percentage change2005-2010 2009 2010
Real GDP (2005=100) 2 -2 33 -9 ...2 -5 ...
Final bound
Non ad-valorem duties (% total tariff lines) Number of disputes (complainant - defendant) Requests for consultation
in agricultural goods (AOA) in non-agricultural goods
2010Share in world total exports Share in world total imports
Breakdown in economy's total imports By principal services item
Transportation Transportation
Direct residents Direct non-residents
Travel Travel Other commercial services Other commercial services
592 377 969 10 254 3 887
Patent grants by patent office, 2009 Trademark registrations by office, 2009Residents Non-residents Total
Outstanding notifications in WTO Central Registry
MFN duty free imports (%, 2009)
a Refers to 2009 and to the average annual percentage change for 2005-2009.
World Trade OrganizationTrade Profiles 2011
165Download the data:www.wto.org/statistics
CO
UN
TRY
PR
OFI
LES
BASIC INDICATORS Population (thousands, 2010) 20 447 Rank in world trade, 2010 Exports ImportsGDP (million current US$, 2010) 59 103 Merchandise 75 74GDP (million current PPP US$, 2010) 107 304 excluding intra-EU trade 53 52Current account balance (million US$, 2009) - 1 161 Commercial services 62 80Trade per capita (US$, 2007-2009) 1 714 excluding intra-EU trade 40 58Trade to GDP ratio (2007-2009) 68.7
2010 127
Exports of goods and services (volume, 2005=100) 157Imports of goods and services (volume, 2005=100) 128
TRADE POLICY
WTO accession Observer Contribution to WTO budget -Trade Policy Review - Import duties collected GPA accession - in total tax revenue ...Tariffs and duty free imports to total imports ...
Tariff binding coverage (%) - Number of notifications to WTO and measures in force MFN tariffs Applied 2009 -
Simple average of import duties Goods RTAs - services EIAs notified to WTO 3 - 0All goods - 14.2 Anti-dumping -
Agricultural products 22.2 Agricultural products 22.7Fuels and mining products 42.4 Fuels and mining products 13.3Manufactures 31.0 Manufactures 63.5
1. European Union (27) 35.6 1. European Union (27) 25.02. Iraq 17.8 2. Russian Federation 13.03. Lebanon 9.3 3. China 10.94. Saudi Arabia, Kingdom of 7.2 4. Ukraine 9.85. Egypt 5.1 5. Saudi Arabia, Kingdom of 3.7
COMMERCIAL SERVICES TRADE Value2009 2008
4 583 2 755
2009 0.14 0.09
Breakdown in economy's total exports By principal services item
9.5 52.0 82.0 32.0 8.6 16.0
INDUSTRIAL PROPERTY
Madrid Total 2 272 2 272
October 2011
Syrian Arab Republic
Annual percentage change2005-2010 2009 2010
Real GDP (2005=100) 5 6 39 6 65 6 8
Final bound
Non ad-valorem duties (% total tariff lines) Number of disputes (complainant - defendant) Requests for consultation
in agricultural goods (AOA) in non-agricultural goods
2009Share in world total exports Share in world total imports
Breakdown in economy's total imports By principal services item
Transportation Transportation
Direct residents Direct non-residents
Travel Travel Other commercial services Other commercial services
... ... ... ... ...
Patent grants by patent office Trademark registrations by office, 2009Residents Non-residents Total
Outstanding notifications in WTO Central Registry
MFN duty free imports (%, 2008)
a Breakdowns by destination/origin refer to 2008.
Syrian Arab Republic
World Trade OrganizationTrade Profiles 2011
166 Download the data:www.wto.org/statistics
Taipei, Chinese
BASIC INDICATORS Population (thousands, 2010) 23 162 Rank in world trade, 2010 Exports ImportsGDP (million current US$, 2010) 429 918 Merchandise 16 17GDP (million current PPP US$, 2010) ... excluding intra-EU trade 11 11Current account balance (million US$, 2010) 39 900 Commercial services 24 28Trade per capita (US$, 2008-2010) 23 050 excluding intra-EU trade 13 18Trade to GDP ratio (2008-2010) 132.3
2010 122
Exports of goods and services (volume, 2005=100) 141Imports of goods and services (volume, 2005=100) 116
TRADE POLICY
WTO accession 1 January 2002 Contribution to WTO budget (%, 2011) 1.672Trade Policy Review 5, 7 July 2010 Import duties collected GPA accession 15 July 2009 in total tax revenue ...Tariffs and duty free imports to total imports ...
Tariff binding coverage (%) 100 Number of notifications to WTO and measures in force MFN tariffs Applied 2010 7
Simple average of import duties Goods RTAs - services EIAs notified to WTO 4 - 4All goods 6.3 6.1 Anti-dumping (30 June 2010) 5
Agricultural goods (AOA) 16.9 16.5 Countervailing duties (30 June 2010) ...Non-agricultural goods 4.7 4.5 Safeguards (22 October 2010) 0
1.1 1.13 - 0
43.8 Original panel / Appellate Body (AB) reports 2 - 0 73.5 Compliance panel / AB reports (Article 21.5 DSU) 0 - 0
Agricultural products 2.0 Agricultural products 5.3Fuels and mining products 7.1 Fuels and mining products 28.0Manufactures 85.4 Manufactures 65.2
1. China 26.7 1. Japan 20.82. Hong Kong, China 14.5 2. China 14.03. United States 11.6 3. United States 10.54. European Union (27) 10.5 4. European Union (27) 9.05. Japan 7.1 5. Korea, Republic of 6.0
COMMERCIAL SERVICES TRADE Value2010 2009
40 182 37 097
2010 1.09 1.06
Breakdown in economy's total exports By principal services item
24.3 25.8 21.5 25.2 54.2 48.9
INDUSTRIAL PROPERTY
Madrid Total ... ...
October 2011
Taipei, Chinese
Annual percentage change2005-2010 2009 2010
Real GDP (2005=100) 4 -2 117 -9 263 -13 28
Final bound
Non ad-valorem duties (% total tariff lines) Number of disputes (complainant - defendant) Requests for consultation
in agricultural goods (AOA) in non-agricultural goods
2010Share in world total exports Share in world total imports
Breakdown in economy's total imports By principal services item
Transportation Transportation
Direct residents Direct non-residents
Travel Travel Other commercial services Other commercial services
8 2 10 190 361
Patent grants by patent office, 2009 Trademark registrations by office, 2009Residents Non-residents Total
Outstanding notifications in WTO Central Registry
MFN duty free imports
Tajikistan
World Trade OrganizationTrade Profiles 2011
168 Download the data:www.wto.org/statistics
Tanzania
BASIC INDICATORS Population (thousands, 2010) 44 841 Rank in world trade, 2010 Exports ImportsGDP (million current US$, 2010) 23 057 Merchandise 114 100GDP (million current PPP US$, 2010) 62 233 excluding intra-EU trade 90 75Current account balance (million US$, 2010) - 1 978 Commercial services 91 103Trade per capita (US$, 2008-2010) 322 excluding intra-EU trade 65 77Trade to GDP ratio (2008-2010) 64.6
2010 139
Exports of goods and services (volume, 2005=100) 173Imports of goods and services (volume, 2005=100) 182
TRADE POLICY
WTO accession 1 January 1995 Contribution to WTO budget (%, 2011) 0.031Trade Policy Review 25, 27 October 2006 Import duties collected GPA accession - in total tax revenue ...Tariffs and duty free imports to total imports ...
Tariff binding coverage (%) 13.4 Number of notifications to WTO and measures in force MFN tariffs Applied 2010 40
Simple average of import duties Goods RTAs - services EIAs notified to WTO 3 - 0All goods 120.0 12.5 Anti-dumping (30 June 2010) ...
Agricultural goods (AOA) 120.0 19.7 Countervailing duties (30 June 2010) ...Non-agricultural goods 120.0 11.4 Safeguards (22 October 2010) 0
0.0 0.10 - 0
4.9 Original panel / Appellate Body (AB) reports 0 - 0 60.3 Compliance panel / AB reports (Article 21.5 DSU) 0 - 0
Agricultural products 31.9 Agricultural products 11.1Fuels and mining products 29.1 Fuels and mining products 29.3Manufactures 22.3 Manufactures 59.6
1. Switzerland 17.5 1. European Union (27) 14.42. China 16.2 2. India 11.23. European Union (27) 12.5 3. China 10.94. South Africa 10.7 4. South Africa 9.65. Kenya 8.0 5. United Arab Emirates 8.4
COMMERCIAL SERVICES TRADE Value2010 2009
2 047 1 840
2010 0.06 0.05
Breakdown in economy's total exports By principal services item
21.8 38.9 61.3 45.1 17.0 15.9
INDUSTRIAL PROPERTY
Madrid Total ... 547
October 2011
Tanzania
Annual percentage change2005-2010 2009 2010
Real GDP (2005=100) 7 6 712 16 1113 14 11
Final bound
Non ad-valorem duties (% total tariff lines) Number of disputes (complainant - defendant) Requests for consultation
in agricultural goods (AOA) in non-agricultural goods
2010Share in world total exports Share in world total imports
Breakdown in economy's total imports By principal services item
Transportation Transportation
Direct residents Direct non-residents
Travel Travel Other commercial services Other commercial services
... ... ... 35 512
Patent grants by patent office Trademark registrations by office, 2007Residents Non-residents Total
Outstanding notifications in WTO Central Registry
MFN duty free imports (%, 2009)
a Break in series for merchandise: 2006 for exports.
World Trade OrganizationTrade Profiles 2011
169Download the data:www.wto.org/statistics
CO
UN
TRY
PR
OFI
LES
BASIC INDICATORS Population (thousands, 2010) 69 122 Rank in world trade, 2010 Exports ImportsGDP (million current US$, 2010) 318 847 Merchandise 25 22GDP (million current PPP US$, 2010) 586 824 excluding intra-EU trade 19 16Current account balance (million US$, 2010) 14 696 Commercial services 27 23Trade per capita (US$, 2008-2010) 5 737 excluding intra-EU trade 15 14Trade to GDP ratio (2008-2010) 138.3
2010 119
Exports of goods and services (volume, 2005=100) 124Imports of goods and services (volume, 2005=100) 112
TRADE POLICY
WTO accession 1 January 1995 Contribution to WTO budget (%, 2011) 1.068Trade Policy Review 26, 28 November 2007 Import duties collected (%, 2007-2009) GPA accession - in total tax revenue 5.7Tariffs and duty free imports to total imports 1.5
Tariff binding coverage (%) 75.0 Number of notifications to WTO and measures in force MFN tariffs Applied 2010 14
Simple average of import duties Goods RTAs - services EIAs notified to WTO 11 - 6All goods 28.0 9.9 Anti-dumping (30 June 2010) 24
Agricultural goods (AOA) 39.8 22.8 Countervailing duties (30 June 2010) ...Non-agricultural goods 25.4 8.0 Safeguards (22 October 2010) 0
19.1 10.113 - 3
14.2 Original panel / Appellate Body (AB) reports 6 - 2 48.1 Compliance panel / AB reports (Article 21.5 DSU) 0 - 0
Agricultural products 18.0 Agricultural products 6.6Fuels and mining products 6.2 Fuels and mining products 22.0Manufactures 72.5 Manufactures 67.0
1. European Union (27) 11.2 1. Japan 20.82. China 11.0 2. China 13.33. Japan 10.5 3. European Union (27) 7.64. United States 10.4 4. United States 5.95. Hong Kong, China 6.7 5. Malaysia 5.9
COMMERCIAL SERVICES TRADE Value2010 2009
33 806 45 601
2010 0.92 1.30
Breakdown in economy's total exports By principal services item
17.5 49.5 58.2 11.1 24.3 39.4
INDUSTRIAL PROPERTY
Madrid Total ... 22 483
October 2011
Thailand
Annual percentage change2005-2010 2009 2010
Real GDP (2005=100) 4 -2 84 -12 152 -21 21
Final bound
Non ad-valorem duties (% total tariff lines) Number of disputes (complainant - defendant) Requests for consultation
in agricultural goods (AOA) in non-agricultural goods
2010Share in world total exports Share in world total imports
Breakdown in economy's total imports By principal services item
Transportation Transportation
Direct residents Direct non-residents
Travel Travel Other commercial services Other commercial services
62 904 966 11 981 10 502
Patent grants by patent office, 2008 Trademark registrations by office, 2009Residents Non-residents Total
Outstanding notifications in WTO Central Registry
MFN duty free imports (%, 2009)
Thailand
World Trade OrganizationTrade Profiles 2011
170 Download the data:www.wto.org/statistics
Togo
BASIC INDICATORS Population (thousands, 2010) 6 028 Rank in world trade, 2010 Exports ImportsGDP (million current US$, 2010) 3 153 Merchandise 153 156GDP (million current PPP US$, 2010) 5 971 excluding intra-EU trade 127 130Current account balance (million US$, 2009) - 177 Commercial services 147 152Trade per capita (US$, 2007-2009) 455 excluding intra-EU trade 121 126Trade to GDP ratio (2007-2009) 89.1
2010 116
Exports of goods and services (volume, 2005=100) ...Imports of goods and services (volume, 2005=100) ...
TRADE POLICY
WTO accession 31 May 1995 Contribution to WTO budget (%, 2011) 0.015Trade Policy Review 3, 5 July 2006 Import duties collected (%, 2007-2009) GPA accession - in total tax revenue 22.9Tariffs and duty free imports to total imports 6.6
Tariff binding coverage (%) 14.0 Number of notifications to WTO and measures in force MFN tariffs Applied 2010 40
Simple average of import duties Goods RTAs - services EIAs notified to WTO 2 - 0All goods 80.0 11.9 Anti-dumping (30 June 2010) ...
Agricultural goods (AOA) 80.0 14.5 Countervailing duties (30 June 2010) ...Non-agricultural goods 80.0 11.5 Safeguards (22 October 2010) 0
0.0 0.00 - 0
0.0 Original panel / Appellate Body (AB) reports 0 - 0 9.7 Compliance panel / AB reports (Article 21.5 DSU) 0 - 0
Agricultural products 74.8 Agricultural products 22.2Fuels and mining products 22.7 Fuels and mining products 7.3Manufactures 2.3 Manufactures 69.9
1. Niger 12.7 1. European Union (27) 43.32. Benin 10.9 2. China 15.83. India 9.8 3. United States 4.24. Burkina Faso 9.7 4. Ghana 3.65. Mali 7.1 5. South Africa 3.0 Unspecified destinations 20.0 Unspecified origins 2.9
COMMERCIAL SERVICES TRADE Value2009 2008 265 374
2009 0.01 0.01
Breakdown in economy's total exports By principal services item
34.3 62.3 25.8 12.5 39.9 25.1
INDUSTRIAL PROPERTY
Madrid Total ... ...
October 2011
Togo
Annual percentage change2005-2010 2009 2010
Real GDP (2005=100) 3 3 3... ... ...... ... ...
Final bound
Non ad-valorem duties (% total tariff lines) Number of disputes (complainant - defendant) Requests for consultation
in agricultural goods (AOA) in non-agricultural goods
2009Share in world total exports Share in world total imports
Breakdown in economy's total imports By principal services item
Transportation Transportation
Direct residents Direct non-residents
Travel Travel Other commercial services Other commercial services
... ... ... ... ...
Patent grants by patent office Trademark registrations by officeResidents Non-residents Total
Outstanding notifications in WTO Central Registry
MFN duty free imports (%, 2007)
a Breakdowns by destination/origin refer to 2007.
World Trade OrganizationTrade Profiles 2011
171Download the data:www.wto.org/statistics
CO
UN
TRY
PR
OFI
LES
BASIC INDICATORS Population (thousands, 2010) 104 Rank in world trade, 2010 Exports ImportsGDP (million current US$, 2010) 357 Merchandise 202 198GDP (million current PPP US$, 2010) 477 excluding intra-EU trade 176 172Current account balance (million US$, 2008) - 60 Commercial services 185 190Trade per capita (US$, 2008-2010) 1 999 excluding intra-EU trade 159 164Trade to GDP ratio (2008-2010) 60.2
2010 103
Exports of goods and services (volume, 2005=100) ...Imports of goods and services (volume, 2005=100) ...
TRADE POLICY
WTO accession 27 July 2007 Contribution to WTO budget (%, 2011) 0.015Trade Policy Review ... Import duties collected GPA accession - in total tax revenue ...Tariffs and duty free imports to total imports ...
Tariff binding coverage (%) 100.0 Number of notifications to WTO and measures in force MFN tariffs Applied 2010 25
Simple average of import duties Goods RTAs - services EIAs notified to WTO 2 - 0All goods 17.6 11.7 Anti-dumping (30 June 2010) ...
Agricultural goods (AOA) 19.2 11.7 Countervailing duties (30 June 2010) ...Non-agricultural goods 17.3 11.7 Safeguards (22 October 2010) 0
0.0 0.20 - 0
... Original panel / Appellate Body (AB) reports 0 - 0
Agricultural products 87.7 Agricultural products 35.4Fuels and mining products 1.6 Fuels and mining products 21.0Manufactures 10.1 Manufactures 39.5
1. Hong Kong, China 33.2 1. New Zealand 30.42. New Zealand 25.7 2. Singapore 18.43. United States 16.0 3. United States 12.94. Australia 9.6 4. Australia 12.15. Japan 4.2 5. Fiji 9.1
COMMERCIAL SERVICES TRADE Value2010 2009 35 38
2010 a 0.00 0.00
Breakdown in economy's total exports By principal services item
14.9 63.8 56.3 19.7 28.8 16.5
INDUSTRIAL PROPERTY
Madrid Total ... 6
October 2011
Tonga
Annual percentage change2005-2010 2009 2010
Real GDP (2005=100) 1 2 0... ... ...... ... ...
Final bound
Non ad-valorem duties (% total tariff lines) Number of disputes (complainant - defendant) Requests for consultation
in agricultural goods (AOA) in non-agricultural goods
2010 aShare in world total exports Share in world total imports
Breakdown in economy's total imports By principal services item
Transportation Transportation
Direct residents Direct non-residents
Travel Travel Other commercial services Other commercial services
... ... ... ... 6
Patent grants by patent office Trademark registrations by office, 2002Residents Non-residents Total
Outstanding notifications in WTO Central Registry
MFN duty free imports
a Breakdowns by destination/origin refer to 2009. Breakdowns by services items refer to 2008.
Tonga
World Trade OrganizationTrade Profiles 2011
172 Download the data:www.wto.org/statistics
Trinidad and Tobago
BASIC INDICATORS Population (thousands, 2010) 1 341 Rank in world trade, 2010 Exports ImportsGDP (million current US$, 2010) 20 398 Merchandise 80 103GDP (million current PPP US$, 2010) 34 259 excluding intra-EU trade 57 78Current account balance (million US$, 2009) 1 614 Commercial services 120 153Trade per capita (US$, 2007-2009) 17 287 excluding intra-EU trade 94 127Trade to GDP ratio (2007-2009) 100.8
2010 117
Exports of goods and services (volume, 2005=100) ...Imports of goods and services (volume, 2005=100) ...
TRADE POLICY
WTO accession 1 March 1995 Contribution to WTO budget (%, 2011) 0.058Trade Policy Review 14, 16 September 2005 Import duties collected (%, 2006-2008) GPA accession - in total tax revenue 4.9Tariffs and duty free imports to total imports 3.9
Tariff binding coverage (%) 100 Number of notifications to WTO and measures in force MFN tariffs Applied 2008 10
Simple average of import duties Goods RTAs - services EIAs notified to WTO 3 - 2All goods 55.8 7.5 Anti-dumping (30 June 2010) 2
Agricultural goods (AOA) 89.9 18.1 Countervailing duties (30 June 2010) ...Non-agricultural goods 50.6 5.9 Safeguards (22 October 2010) 0
0.0 0.30 - 2
25.3 Original panel / Appellate Body (AB) reports 0 - 0 82.7 Compliance panel / AB reports (Article 21.5 DSU) 0 - 0
Agricultural products 3.3 Agricultural products 10.6Fuels and mining products 78.8 Fuels and mining products 35.7Manufactures 17.9 Manufactures 53.4
1. United States 54.4 1. United States 31.02. European Union (27) 14.3 2. European Union (27) 11.43. Jamaica 5.2 3. Colombia 9.94. Barbados 3.0 4. Russian Federation 7.85. Suriname 2.0 5. Gabon 7.0
COMMERCIAL SERVICES TRADE Value2009 2008 758 335
2009 0.02 0.01
Breakdown in economy's total exports By principal services item
28.4 38.8 48.3 31.4 23.3 29.7
INDUSTRIAL PROPERTY
Madrid Total ... 1 174
October 2011
Trinidad and Tobago
Annual percentage change2005-2010 2009 2010
Real GDP (2005=100) 3 -4 0... ... ...... ... ...
Final bound
Non ad-valorem duties (% total tariff lines) Number of disputes (complainant - defendant) Requests for consultation
in agricultural goods (AOA) in non-agricultural goods
2009Share in world total exports Share in world total imports
Breakdown in economy's total imports By principal services item
Transportation Transportation
Direct residents Direct non-residents
Travel Travel Other commercial services Other commercial services
2 79 81 225 949
Patent grants by patent office, 2006 Trademark registrations by office, 2002Residents Non-residents Total
Outstanding notifications in WTO Central Registry
MFN duty free imports (%, 2008)
a Breakdowns by destination/origin refer to 2009.
World Trade OrganizationTrade Profiles 2011
173Download the data:www.wto.org/statistics
CO
UN
TRY
PR
OFI
LES
BASIC INDICATORS Population (thousands, 2010) 10 549 Rank in world trade, 2010 Exports ImportsGDP (million current US$, 2010) 44 291 Merchandise 73 68GDP (million current PPP US$, 2010) 89 925 excluding intra-EU trade 51 46Current account balance (million US$, 2009) - 1 234 Commercial services 63 82Trade per capita (US$, 2008-2010) 4 391 excluding intra-EU trade 41 60Trade to GDP ratio (2008-2010) 106.9
2010 126
Exports of goods and services (volume, 2005=100) a 116Imports of goods and services (volume, 2005=100) a 133
TRADE POLICY
WTO accession 29 March 1995 Contribution to WTO budget (%, 2011) 0.125Trade Policy Review 5, 7 October 2005 Import duties collected (%, 2008-2009) GPA accession - in total tax revenue 8.1Tariffs and duty free imports to total imports 3.1
Tariff binding coverage (%) 58.0 Number of notifications to WTO and measures in force MFN tariffs Applied 2010 19
Simple average of import duties Goods RTAs - services EIAs notified to WTO 6 - 0All goods 57.9 16.5 Anti-dumping (30 June 2010) ...
Agricultural goods (AOA) 116.0 24.6 Countervailing duties (30 June 2010) ...Non-agricultural goods 40.7 15.2 Safeguards (22 October 2010) 0
0.0 0.00 - 0
0.0 Original panel / Appellate Body (AB) reports 0 - 0 25.7 Compliance panel / AB reports (Article 21.5 DSU) 0 - 0
Agricultural products 8.6 Agricultural products 10.9Fuels and mining products 16.2 Fuels and mining products 14.5Manufactures 75.2 Manufactures 73.9
1. European Union (27) 73.8 1. European Union (27) 62.52. Libyan Arab Jamahiriya 5.8 2. China 5.03. Algeria 3.1 3. United States 4.04. India 1.6 4. Russian Federation 3.65. Morocco 1.4 5. Turkey 3.0 Unspecified destinations 3.1 Unspecified origins 1.2
COMMERCIAL SERVICES TRADE Value2010 2009
5 192 2 857
2010 0.14 0.08
Breakdown in economy's total exports By principal services item
27.4 53.7 51.1 14.7 21.5 31.6
INDUSTRIAL PROPERTY
Madrid Total ... 2 884
October 2011
Tunisia
Annual percentage change2005-2010 2009 2010
Real GDP (2005=100) 5 3 44 -2 ...7 7 ...
Final bound
Non ad-valorem duties (% total tariff lines) Number of disputes (complainant - defendant) Requests for consultation
in agricultural goods (AOA) in non-agricultural goods
2010Share in world total exports Share in world total imports
Breakdown in economy's total imports By principal services item
Transportation Transportation
Direct residents Direct non-residents
Travel Travel Other commercial services Other commercial services
31 115 146 984 1 900
Patent grants by patent office, 1996 Trademark registrations by office, 1996Residents Non-residents Total
Outstanding notifications in WTO Central Registry
MFN duty free imports (%, 2009)
a Refers to 2009 and to the average annual percentage change for 2005-2009. b Breakdowns by destination/origin refer to 2009.
Tunisia
World Trade OrganizationTrade Profiles 2011
174 Download the data:www.wto.org/statistics
Turkey
BASIC INDICATORS Population (thousands, 2010) 72 752 Rank in world trade, 2010 Exports ImportsGDP (million current US$, 2010) 735 264 Merchandise 33 21GDP (million current PPP US$, 2010) 1 115 994 excluding intra-EU trade 22 15Current account balance (million US$, 2010) - 48 445 Commercial services 28 39Trade per capita (US$, 2008-2010) 4 751 excluding intra-EU trade 16 24Trade to GDP ratio (2008-2010) 49.2
2010 117
Exports of goods and services (volume, 2005=100) 116Imports of goods and services (volume, 2005=100) 112
TRADE POLICY
WTO accession 26 March 1995 Contribution to WTO budget (%, 2011) 0.945Trade Policy Review 10, 12 December 2007 Import duties collected (%, 2007-2009) GPA accession Observer in total tax revenue 1.5Tariffs and duty free imports to total imports 1.1
Tariff binding coverage (%) 50.3 Number of notifications to WTO and measures in force MFN tariffs Applied 2010 45
Simple average of import duties Goods RTAs - services EIAs notified to WTO 19 - 0All goods 28.5 9.9 Anti-dumping (30 June 2010) 121
Agricultural goods (AOA) 60.7 43.4 Countervailing duties (30 June 2010) 1Non-agricultural goods 17.0 4.8 Safeguards (22 October 2010) 10
0.1 0.82 - 8
23.5 Original panel / Appellate Body (AB) reports 1 - 2 40.2 Compliance panel / AB reports (Article 21.5 DSU) 0 - 0
Agricultural products 10.9 Agricultural products 6.9Fuels and mining products 8.2 Fuels and mining products 27.4Manufactures 77.6 Manufactures 62.5
1. European Union (27) 47.1 1. European Union (27) 38.92. Iraq 5.3 2. Russian Federation 11.63. Russian Federation 4.1 3. China 9.24. United States 3.3 4. United States 6.65. United Arab Emirates 2.9 5. Iran, Islamic Rep. of 4.1
COMMERCIAL SERVICES TRADE Value2010 2009
33 436 18 397
2010 0.91 0.52
Breakdown in economy's total exports By principal services item
25.1 45.5 63.5 26.3 11.4 28.2
INDUSTRIAL PROPERTY
Madrid Total 7 328 52 682
October 2011
Turkey
Annual percentage change2005-2010 2009 2010
Real GDP (2005=100) 3 -5 93 -5 52 -14 15
Final bound
Non ad-valorem duties (% total tariff lines) Number of disputes (complainant - defendant) Requests for consultation
in agricultural goods (AOA) in non-agricultural goods
2010Share in world total exports Share in world total imports
Breakdown in economy's total imports By principal services item
Transportation Transportation
Direct residents Direct non-residents
Travel Travel Other commercial services Other commercial services
406 242 648 41 360 3 994
Patent grants by patent office, 2009 Trademark registrations by office, 2009Residents Non-residents Total
Outstanding notifications in WTO Central Registry
MFN duty free imports (%, 2009)
World Trade OrganizationTrade Profiles 2011
175Download the data:www.wto.org/statistics
CO
UN
TRY
PR
OFI
LES
BASIC INDICATORS Population (thousands, 2010) 5 042 Rank in world trade, 2010 Exports ImportsGDP (million current US$, 2010) 21 074 Merchandise 98 107GDP (million current PPP US$, 2010) 39 488 excluding intra-EU trade 74 82Current account balance (million US$, 2010) ... Commercial services 74 78Trade per capita (US$, 2008-2010) ... excluding intra-EU trade 50 56Trade to GDP ratio (2008-2010) ...
2010 158
Exports of goods and services (volume, 2005=100) a 286Imports of goods and services (volume, 2005=100) a 236
TRADE POLICY
WTO accession Non-member and non-observer Contribution to WTO budget -Trade Policy Review - Import duties collected GPA accession - in total tax revenue ...Tariffs and duty free imports to total imports ...
Tariff binding coverage (%) - Number of notifications to WTO and measures in force MFN tariffs Applied -
Simple average of import duties Goods RTAs - services EIAs notified to WTO 5 - 0All goods - ... Anti-dumping -
2010Share in world total exports Share in world total imports
Breakdown in economy's total imports By principal services item
Transportation Transportation
Direct residents Direct non-residents
Travel Travel Other commercial services Other commercial services
32 63 95 ... ...
Patent grants by patent office, 1999 Trademark registrations by office, 2009Residents Non-residents Total
Outstanding notifications in WTO Central Registry
MFN duty free imports
a Refers to 2009 and to the average annual percentage change for 2005-2009.
Turkmenistan
World Trade OrganizationTrade Profiles 2011
176 Download the data:www.wto.org/statistics
Uganda
BASIC INDICATORS Population (thousands, 2010) 33 425 Rank in world trade, 2010 Exports ImportsGDP (million current US$, 2010) 17 011 Merchandise 130 119GDP (million current PPP US$, 2010) 42 215 excluding intra-EU trade 105 94Current account balance (million US$, 2010) - 1 740 Commercial services 116 106Trade per capita (US$, 2008-2010) 265 excluding intra-EU trade 90 80Trade to GDP ratio (2008-2010) 54.6
2010 147
Exports of goods and services (volume, 2005=100) 273Imports of goods and services (volume, 2005=100) 220
TRADE POLICY
WTO accession 1 January 1995 Contribution to WTO budget (%, 2011) 0.018Trade Policy Review 25, 27 October 2006 Import duties collected (%, 2007-2009) GPA accession - in total tax revenue 11.7Tariffs and duty free imports to total imports 4.2
Tariff binding coverage (%) 15.7 Number of notifications to WTO and measures in force MFN tariffs Applied 2010 19
Simple average of import duties Goods RTAs - services EIAs notified to WTO 2 - 0All goods 73.4 12.5 Anti-dumping (30 June 2010) ...
Agricultural goods (AOA) 77.6 19.6 Countervailing duties (30 June 2010) ...Non-agricultural goods 50.8 11.4 Safeguards (22 October 2010) 0
0.0 0.10 - 0
15.4 Original panel / Appellate Body (AB) reports 0 - 0 57.7 Compliance panel / AB reports (Article 21.5 DSU) 0 - 0
Agricultural products 60.5 Agricultural products 13.8Fuels and mining products 6.9 Fuels and mining products 21.8Manufactures 31.1 Manufactures 64.4
1. European Union (27) 22.6 1. European Union (27) 15.62. Sudan 12.9 2. India 14.73. Kenya 11.8 3. Kenya 11.04. Congo, Dem. Rep. of 11.4 4. China 8.95. Rwanda 9.2 5. United Arab Emirates 8.4
COMMERCIAL SERVICES TRADE Value2010 2009 984
1 809
2010 0.03 0.05
Breakdown in economy's total exports By principal services item
4.8 55.4 74.2 13.8 21.0 30.8
INDUSTRIAL PROPERTY
Madrid Total ... 629
October 2011
Uganda
Annual percentage change2005-2010 2009 2010
Real GDP (2005=100) 8 7 522 16 617 25 8
Final bound
Non ad-valorem duties (% total tariff lines) Number of disputes (complainant - defendant) Requests for consultation
in agricultural goods (AOA) in non-agricultural goods
Agricultural products 20.3 Agricultural products 10.3Fuels and mining products 15.2 Fuels and mining products 35.7Manufactures 63.6 Manufactures 52.8
1. Russian Federation 26.1 1. Russian Federation 36.52. European Union (27) 25.4 2. European Union (27) 31.43. Turkey 5.9 3. China 7.74. Belarus 3.7 4. Belarus 4.25. India 2.8 5. United States 2.9
COMMERCIAL SERVICES TRADE Value2010 2009
16 466 11 679
2010 0.45 0.33
Breakdown in economy's total exports By principal services item
47.4 31.0 23.0 32.0 29.6 37.0
INDUSTRIAL PROPERTY
Madrid Total 8 366 8 366
October 2011
Ukraine
Annual percentage change2005-2010 2009 2010
Real GDP (2005=100) 1 -15 4-5 -26 6-1 -39 9
Final bound
Non ad-valorem duties (% total tariff lines) Number of disputes (complainant - defendant) Requests for consultation
in agricultural goods (AOA) in non-agricultural goods
2010Share in world total exports Share in world total imports
Breakdown in economy's total imports By principal services item
Transportation Transportation
Direct residents Direct non-residents
Travel Travel Other commercial services Other commercial services
2 394 1 608 4 002 ... ...
Patent grants by patent office, 2009 Trademark registrations by office, 2009Residents Non-residents Total
Outstanding notifications in WTO Central Registry
MFN duty free imports (%, 2009)
Ukraine
World Trade OrganizationTrade Profiles 2011
178 Download the data:www.wto.org/statistics
United Arab Emirates
BASIC INDICATORS Population (thousands, 2010) 7 512 Rank in world trade, 2010 Exports ImportsGDP (million current US$, 2009) 230 252 Merchandise 19 26GDP (million current PPP US$, 2009) 264 294 excluding intra-EU trade 13 19Current account balance (million US$, 2008) 22 278 Commercial services 49 25Trade per capita (US$, 2008-2010) 61 995 excluding intra-EU trade 31 16Trade to GDP ratio (2007-2009) 172.6
2009 120
Exports of goods and services (volume, 2005=100) ...Imports of goods and services (volume, 2005=100) ...
TRADE POLICY
WTO accession 10 April 1996 Contribution to WTO budget (%, 2011) 1.020Trade Policy Review 24, 26 April 2006 Import duties collected GPA accession - in total tax revenue ...Tariffs and duty free imports to total imports ...
Tariff binding coverage (%) 100 Number of notifications to WTO and measures in force MFN tariffs Applied 2009 27
Simple average of import duties Goods RTAs - services EIAs notified to WTO 2 - 0All goods 14.3 4.9 Anti-dumping (30 June 2010) ...
Agricultural goods (AOA) 25.1 6.6 Countervailing duties (30 June 2010) ...Non-agricultural goods 12.6 4.7 Safeguards (22 October 2010) 0
0.0 0.60 - 0
44.9 Original panel / Appellate Body (AB) reports 0 - 0 21.8 Compliance panel / AB reports (Article 21.5 DSU) 0 - 0
Agricultural products 1.7 Agricultural products 7.4Fuels and mining products 35.0 Fuels and mining products 3.8Manufactures 24.0 Manufactures 59.9
1. Taipei, Chinese 34.4 1. European Union (27) 21.62. India 11.0 2. India 17.23. Iran, Islamic Rep. of 4.7 3. China 10.34. Iraq 2.3 4. United States 8.55. Switzerland 2.2 5. Japan 5.9 Unspecified destinations 27.5 Unspecified origins 1.5
COMMERCIAL SERVICES TRADE Value2010 2009
11 028 40 908
2010 0.30 1.17
Breakdown in economy's total exports By principal services item
22.2 62.1 77.8 28.9 0.0 9.0
INDUSTRIAL PROPERTY
Madrid Total ... ...
October 2011
United Arab Emirates
Annual percentage change2005-2009 2008 2009
Real GDP (2005=100) 5 5 -1... ... ...... ... ...
Final bound
Non ad-valorem duties (% total tariff lines) Number of disputes (complainant - defendant) Requests for consultation
in agricultural goods (AOA) in non-agricultural goods
2010Share in world total exports Share in world total imports
Breakdown in economy's total imports By principal services item
Transportation Transportation
Direct residents Direct non-residents
Travel Travel Other commercial services Other commercial services
... ... ... ... ...
Patent grants by patent office Trademark registrations by officeResidents Non-residents Total
Outstanding notifications in WTO Central Registry
MFN duty free imports (%, 2008)
World Trade OrganizationTrade Profiles 2011
179Download the data:www.wto.org/statistics
CO
UN
TRY
PR
OFI
LES
BASIC INDICATORS Population (thousands, 2010) 62 219 Rank in world trade, 2010 Exports ImportsGDP (million current US$, 2010) 2 246 079 Merchandise 10 6GDP (million current PPP US$, 2010) 2 231 150 excluding intra-EU trade - -Current account balance (million US$, 2010) - 55 850 Commercial services 3 4Trade per capita (US$, 2008-2010) 22 431 excluding intra-EU trade - -Trade to GDP ratio (2008-2010) 58.8
2010 102
Exports of goods and services (volume, 2005=100) a 97Imports of goods and services (volume, 2005=100) a 94
TRADE POLICY
WTO accession 1 January 1995 Contribution to WTO budget (%, 2011) 4.841Trade Policy Review 6, 8 July 2011 Import duties collected GPA accession 1 January 1996 in total tax revenue ...Tariffs and duty free imports to total imports ...
Tariff binding coverage (%) 100 Number of notifications to WTO and measures in force MFN tariffs Applied 2010 18
Simple average of import duties Goods RTAs - services EIAs notified to WTO 31 - 10All goods 5.0 5.1 Anti-dumping (30 June 2010) 149
Agricultural goods (AOA) 12.3 12.8 Countervailing duties (30 June 2010) 8Non-agricultural goods 3.9 4.0 Safeguards (22 October 2010) 0
4.8 4.785 - 71
41.1 Original panel / Appellate Body (AB) reports 33 - 33 51.4 Compliance panel / AB reports (Article 21.5 DSU) 4 - 4
Agricultural products 7.2 Agricultural products 10.8Fuels and mining products 16.8 Fuels and mining products 15.0Manufactures 74.2 Manufactures 72.7
1. European Union (27) 53.6 1. European Union (27) 51.52. United States 14.3 2. China 9.43. China 2.8 3. United States 9.04. Switzerland 2.0 4. Norway 5.35. Canada 1.6 5. Canada 2.2
COMMERCIAL SERVICES TRADE Value2010 2009
226 844 160 938
2010 6.14 4.58
Breakdown in economy's total exports By principal services item
14.2 19.0 13.4 30.2 72.4 50.8
INDUSTRIAL PROPERTY
Madrid Total 4 356 27 642
October 2011
United Kingdom
Annual percentage change2005-2010 2009 2010
Real GDP (2005=100) 0 -5 1-1 -11 ...-2 -12 ...
Final bound
Non ad-valorem duties (% total tariff lines) Number of disputes (complainant - defendant) Requests for consultation
in agricultural goods (AOA) in non-agricultural goods
2010Share in world total exports Share in world total imports
Breakdown in economy's total imports By principal services item
Transportation Transportation
Direct residents Direct non-residents
Travel Travel Other commercial services Other commercial services
2 118 3 310 5 428 23 286 ...
Patent grants by patent office, 2009 Trademark registrations by office, 2009Residents Non-residents Total
Outstanding notifications in WTO Central Registry
MFN duty free imports (%, 2009)
a Refers to 2009 and to the average annual percentage change for 2005-2009.
United Kingdom
World Trade OrganizationTrade Profiles 2011
180 Download the data:www.wto.org/statistics
United States
BASIC INDICATORS Population (thousands, 2010) 309 051 Rank in world trade, 2010 Exports ImportsGDP (million current US$, 2010) 14 582 400 Merchandise 2 1GDP (million current PPP US$, 2010) 14 582 400 excluding intra-EU trade 3 2Current account balance (million US$, 2010) - 470 250 Commercial services 1 1Trade per capita (US$, 2008-2010) 12 919 excluding intra-EU trade 2 2Trade to GDP ratio (2008-2010) 27.7
2010 105
Exports of goods and services (volume, 2005=100) a 114Imports of goods and services (volume, 2005=100) a 91
TRADE POLICY
WTO accession 1 January 1995 Contribution to WTO budget (%, 2011) 12.422Trade Policy Review 29 September, 1 October 2010 Import duties collected (%, 2007-2009) GPA accession 1 January 1996 in total tax revenue 1.0Tariffs and duty free imports to total imports 1.2
Tariff binding coverage (%) 100.0 Number of notifications to WTO and measures in force MFN tariffs Applied 2010 11
Simple average of import duties Goods RTAs - services EIAs notified to WTO 11 - 10All goods 3.5 3.5 Anti-dumping (30 June 2010) 257
Agricultural goods (AOA) 4.8 4.9 Countervailing duties (30 June 2010) 43Non-agricultural goods 3.3 3.3 Safeguards (22 October 2010) 0
8.2 8.197 - 113
41.6 Original panel / Appellate Body (AB) reports 37 - 61 51.4 Compliance panel / AB reports (Article 21.5 DSU) 6 - 12
Agricultural products 11.2 Agricultural products 5.9Fuels and mining products 10.0 Fuels and mining products 20.7Manufactures 73.8 Manufactures 69.5
1. Canada 19.4 1. China 19.42. European Union (27) 18.8 2. European Union (27) 16.63. Mexico 12.7 3. Canada 14.24. China 7.2 4. Mexico 11.85. Japan 4.7 5. Japan 6.3
COMMERCIAL SERVICES TRADE Value2010 2009
518 335 358 074
2010 14.04 10.20
Breakdown in economy's total exports By principal services item
13.7 21.5 25.6 22.9 60.7 55.6
INDUSTRIAL PROPERTY
Madrid Total 2 058 178 780
October 2011
United States
Annual percentage change2005-2010 2009 2010
Real GDP (2005=100) 1 -3 33 -10 ...
-2 -14 ...
Final bound
Non ad-valorem duties (% total tariff lines) Number of disputes (complainant - defendant) Requests for consultation
in agricultural goods (AOA) in non-agricultural goods
2010Share in world total exports Share in world total imports
Breakdown in economy's total imports By principal services item
Transportation Transportation
Direct residents Direct non-residents
Travel Travel Other commercial services Other commercial services
82 382 84 967 167 349 142 458 34 264
Patent grants by patent office, 2009 Trademark registrations by office, 2009Residents Non-residents Total
Outstanding notifications in WTO Central Registry
MFN duty free imports (%, 2009)
a Refers to 2009 and to the average annual percentage change for 2005-2009.
World Trade OrganizationTrade Profiles 2011
181Download the data:www.wto.org/statistics
CO
UN
TRY
PR
OFI
LES
Uruguay
BASIC INDICATORS Population (thousands, 2010) 3 357 Rank in world trade, 2010 Exports ImportsGDP (million current US$, 2010) 40 265 Merchandise 96 93GDP (million current PPP US$, 2010) 47 922 excluding intra-EU trade 72 69Current account balance (million US$, 2010) - 160 Commercial services 85 113Trade per capita (US$, 2008-2010) 5 578 excluding intra-EU trade 59 87Trade to GDP ratio (2008-2010) 54.5
2010 135
Exports of goods and services (volume, 2005=100) 143Imports of goods and services (volume, 2005=100) 160
TRADE POLICY
WTO accession 1 January 1995 Contribution to WTO budget (%, 2011) 0.043Trade Policy Review 17, 19 May 2006 Import duties collected (%, 2007-2009) GPA accession - in total tax revenue 6.0Tariffs and duty free imports to total imports 3.9
Tariff binding coverage (%) 100 Number of notifications to WTO and measures in force MFN tariffs Applied 2010 12
Simple average of import duties Goods RTAs - services EIAs notified to WTO 5 - 1All goods 31.6 10.5 Anti-dumping (30 June 2010) ...
Agricultural goods (AOA) 33.9 10.2 Countervailing duties (30 June 2010) ...Non-agricultural goods 31.2 10.6 Safeguards (22 October 2010) 0
0.0 0.01 - 1
23.6 Original panel / Appellate Body (AB) reports 0 - 0 44.4 Compliance panel / AB reports (Article 21.5 DSU) 0 - 0
Agricultural products 71.8 Agricultural products 12.0Fuels and mining products 3.0 Fuels and mining products 20.1Manufactures 23.6 Manufactures 67.2
1. Brazil 20.4 1. Argentina 23.62. European Union (27) 15.4 2. Brazil 21.13. Argentina 6.4 3. China 11.94. China 4.3 4. European Union (27) 10.85. Russian Federation 4.0 5. United States 8.2 Unspecified destinations 15.0 Unspecified origins 0.3
COMMERCIAL SERVICES TRADE Value2010 2009
2 458 1 365
2010 0.07 0.04
Breakdown in economy's total exports By principal services item
18.1 45.2 60.9 30.7 21.0 24.1
INDUSTRIAL PROPERTY
Madrid Total ... 12 484
October 2011
Uruguay
Annual percentage change2005-2010 2009 2010
Real GDP (2005=100) 6 3 87 2 14
10 -9 19
Final bound
Non ad-valorem duties (% total tariff lines) Number of disputes (complainant - defendant) Requests for consultation
in agricultural goods (AOA) in non-agricultural goods
2010Share in world total exports Share in world total imports
Breakdown in economy's total imports By principal services item
Transportation Transportation
Direct residents Direct non-residents
Travel Travel Other commercial services Other commercial services
8 56 64 4 468 8 016
Patent grants by patent office, 2008 Trademark registrations by office, 2008Residents Non-residents Total
Outstanding notifications in WTO Central Registry
MFN duty free imports (%, 2009)
a Breakdowns by destination/origin refer to 2009.
World Trade OrganizationTrade Profiles 2011
182 Download the data:www.wto.org/statistics
Uzbekistan
BASIC INDICATORS Population (thousands, 2010) 28 160 Rank in world trade, 2010 Exports ImportsGDP (million current US$, 2010) 38 982 Merchandise 76 98GDP (million current PPP US$, 2010) 87 026 excluding intra-EU trade 54 73Current account balance (million US$, 2010) ... Commercial services 108 154Trade per capita (US$, 2008-2010) 772 excluding intra-EU trade 82 128Trade to GDP ratio (2008-2010) 64.4
2010 150
Exports of goods and services (volume, 2005=100) ...Imports of goods and services (volume, 2005=100) ...
TRADE POLICY
WTO accession Observer Contribution to WTO budget -Trade Policy Review - Import duties collected GPA accession - in total tax revenue ...Tariffs and duty free imports to total imports ...
Tariff binding coverage (%) - Number of notifications to WTO and measures in force MFN tariffs Applied 2009 -
Simple average of import duties Goods RTAs - services EIAs notified to WTO 4 - 0All goods - 15.4 Anti-dumping -
2010Share in world total exports Share in world total imports
Breakdown in economy's total imports By principal services item
Transportation Transportation
Direct residents Direct non-residents
Travel Travel Other commercial services Other commercial services
129 106 235 840 648
Patent grants by patent office, 2009 Trademark registrations by office, 2009Residents Non-residents Total
Outstanding notifications in WTO Central Registry
MFN duty free imports
World Trade OrganizationTrade Profiles 2011
183Download the data:www.wto.org/statistics
CO
UN
TRY
PR
OFI
LES
BASIC INDICATORS Population (thousands, 2010) 240 Rank in world trade, 2010 Exports ImportsGDP (million current US$, 2010) 729 Merchandise 185 191GDP (million current PPP US$, 2010) 1 096 excluding intra-EU trade 159 165Current account balance (million US$, 2007) - 34 Commercial services 149 176Trade per capita (US$, 2008-2010) 2 769 excluding intra-EU trade 123 150Trade to GDP ratio (2008-2010) 98.9
2010 130
Exports of goods and services (volume, 2005=100) ...Imports of goods and services (volume, 2005=100) ...
TRADE POLICY
WTO accession Observer Contribution to WTO budget -Trade Policy Review - Import duties collected GPA accession - in total tax revenue ...Tariffs and duty free imports to total imports ...
Tariff binding coverage (%) - Number of notifications to WTO and measures in force MFN tariffs Applied 2009 -
Simple average of import duties Goods RTAs - services EIAs notified to WTO 3 - 0All goods - 15.5 Anti-dumping -
2010 aShare in world total exports Share in world total imports
Breakdown in economy's total imports By principal services item
Transportation Transportation
Direct residents Direct non-residents
Travel Travel Other commercial services Other commercial services
... ... ... ... ...
Patent grants by patent office Trademark registrations by officeResidents Non-residents Total
Outstanding notifications in WTO Central Registry
MFN duty free imports (%, 2007)
a Breakdowns by destination/origin refer to 2007. Breakdowns by services items refer to 2007.
Vanuatu
World Trade OrganizationTrade Profiles 2011
184 Download the data:www.wto.org/statistics
Venezuela, Bolivarian Rep. of
BASIC INDICATORS Population (thousands, 2010) 28 834 Rank in world trade, 2010 Exports ImportsGDP (million current US$, 2010) 387 852 Merchandise 44 52GDP (million current PPP US$, 2010) 344 753 excluding intra-EU trade 30 34Current account balance (million US$, 2010) 14 378 Commercial services 99 54Trade per capita (US$, 2008-2010) 4 459 excluding intra-EU trade 73 37Trade to GDP ratio (2008-2010) 37.0
2010 118
Exports of goods and services (volume, 2005=100) 75Imports of goods and services (volume, 2005=100) 154
TRADE POLICY
WTO accession 1 January 1995 Contribution to WTO budget (%, 2011) 0.372Trade Policy Review 27, 29 November 2002 Import duties collected (%, 2003-2005) GPA accession - in total tax revenue 8.7Tariffs and duty free imports to total imports 6.3
Tariff binding coverage (%) 100.0 Number of notifications to WTO and measures in force MFN tariffs Applied 2010 74
Simple average of import duties Goods RTAs - services EIAs notified to WTO 2 - 0All goods 36.5 12.5 Anti-dumping (30 June 2010) 2
Agricultural goods (AOA) 55.7 15.0 Countervailing duties (30 June 2010) 0Non-agricultural goods 33.6 12.1 Safeguards (22 October 2010) 0
0.0 0.01 - 2
0.0 Original panel / Appellate Body (AB) reports 1 - 0 1.7 Compliance panel / AB reports (Article 21.5 DSU) 0 - 0
Agricultural products 0.1 Agricultural products 16.3Fuels and mining products 95.3 Fuels and mining products 2.3Manufactures 2.2 Manufactures 81.1
1. United States 0.9 1. United States 27.32. Colombia 0.7 2. European Union (27) 13.33. European Union (27) 0.6 3. Colombia 11.44. China 0.5 4. China 10.45. Mexico 0.4 5. Brazil 8.8 Unspecified destinations 32.4 Unspecified origins 0.0
COMMERCIAL SERVICES TRADE Value2010 2009
1 493 10 081
2010 0.04 0.29
Breakdown in economy's total exports By principal services item
37.4 39.9 41.4 15.6 21.2 44.4
INDUSTRIAL PROPERTY
Madrid Total ... 18 454
October 2011
Bolivarian Rep. of Venezuela
Annual percentage change2005-2010 2009 2010
Real GDP (2005=100) 3 -3 -2-6 -13 -29 -20 5
Final bound
Non ad-valorem duties (% total tariff lines) Number of disputes (complainant - defendant) Requests for consultation
in agricultural goods (AOA) in non-agricultural goods
2010Share in world total exports Share in world total imports
Breakdown in economy's total imports By principal services item
Transportation Transportation
Direct residents Direct non-residents
Travel Travel Other commercial services Other commercial services
14 742 756 9 744 8 710
Patent grants by patent office, 2000 Trademark registrations by office, 2000Residents Non-residents Total
Outstanding notifications in WTO Central Registry
MFN duty free imports (%, 2009)
a Breakdowns by destination/origin refer to 2009.
World Trade OrganizationTrade Profiles 2011
185Download the data:www.wto.org/statistics
CO
UN
TRY
PR
OFI
LES
BASIC INDICATORS Population (thousands, 2010) 86 936 Rank in world trade, 2010 Exports ImportsGDP (million current US$, 2010) 103 572 Merchandise 39 35GDP (million current PPP US$, 2010) 276 546 excluding intra-EU trade 26 23Current account balance (million US$, 2009) - 6 116 Commercial services 56 55Trade per capita (US$, 2008-2010) 1 774 excluding intra-EU trade 37 38Trade to GDP ratio (2008-2010) 157.3
2010 140
Exports of goods and services (volume, 2005=100) 130Imports of goods and services (volume, 2005=100) 148
TRADE POLICY
WTO accession 11 January 2007 Contribution to WTO budget (%, 2011) 0.351Trade Policy Review ... Import duties collected GPA accession - in total tax revenue ...Tariffs and duty free imports to total imports ...
Tariff binding coverage (%) 100 Number of notifications to WTO and measures in force MFN tariffs Applied 2010 26
Simple average of import duties Goods RTAs - services EIAs notified to WTO 8 - 4All goods 11.4 9.8 Anti-dumping (30 June 2010) ...
Agricultural goods (AOA) 18.5 17.0 Countervailing duties (30 June 2010) ...Non-agricultural goods 10.4 8.7 Safeguards (22 October 2010) 0
0.0 0.11 - 0
44.5 Original panel / Appellate Body (AB) reports 1 - 0 44.0 Compliance panel / AB reports (Article 21.5 DSU) 0 - 0
Agricultural products 18.9 Agricultural products 9.8Fuels and mining products 11.6 Fuels and mining products 12.7Manufactures 68.9 Manufactures 72.0
1. United States 20.0 1. China 22.02. European Union (27) 16.5 2. Singapore 10.03. Japan 11.1 3. Japan 9.84. China 9.5 4. Korea, Republic of 9.65. Switzerland 4.4 5. Taipei, Chinese 8.7
COMMERCIAL SERVICES TRADE Value2010 2009
7 355 9 771
2010 0.20 0.28
Breakdown in economy's total exports By principal services item
31.3 67.5 60.5 15.0 8.1 17.5
INDUSTRIAL PROPERTY
Madrid Total 3 982 3 982
October 2011
Viet Nam
Annual percentage change2005-2010 2009 2010
Real GDP (2005=100) 7 5 75 11 128 7 9
Final bound
Non ad-valorem duties (% total tariff lines) Number of disputes (complainant - defendant) Requests for consultation
in agricultural goods (AOA) in non-agricultural goods
Agricultural products 5.6 Agricultural products 33.7Fuels and mining products 90.8 Fuels and mining products 8.6Manufactures 3.6 Manufactures 57.0
1. China 25.2 1. European Union (27) 14.72. India 20.1 2. United Arab Emirates 9.93. Thailand 18.4 3. China 9.34. Singapore 6.9 4. United States 6.45. South Africa 6.3 5. Japan 5.6
COMMERCIAL SERVICES TRADE Value2010 2009
1 412 2 213
2010 a 0.04 0.06
Breakdown in economy's total exports By principal services item
4.2 46.2 82.9 10.5 12.9 43.3
INDUSTRIAL PROPERTY
Madrid Total ... 2 146
October 2011
Yemen
Annual percentage change2005-2009 2008 2009
Real GDP (2005=100) 3 4 4... ... ...... ... ...
Final bound
Non ad-valorem duties (% total tariff lines) Number of disputes (complainant - defendant) Requests for consultation
in agricultural goods (AOA) in non-agricultural goods
2010 aShare in world total exports Share in world total imports
Breakdown in economy's total imports By principal services item
Transportation Transportation
Direct residents Direct non-residents
Travel Travel Other commercial services Other commercial services
... ... ... 644 1 502
Patent grants by patent office Trademark registrations by office, 2008Residents Non-residents Total
Outstanding notifications in WTO Central Registry
MFN duty free imports (%, 2009)
a Breakdowns by destination/origin refer to 2009. Breakdowns by services items refer to 2009. b Break in series for commercial services: 2007 for exports.
World Trade OrganizationTrade Profiles 2011
187Download the data:www.wto.org/statistics
CO
UN
TRY
PR
OFI
LES
BASIC INDICATORS Population (thousands, 2010) 12 926 Rank in world trade, 2010 Exports ImportsGDP (million current US$, 2010) 16 193 Merchandise 94 111GDP (million current PPP US$, 2010) 20 041 excluding intra-EU trade 70 86Current account balance (million US$, 2010) 615 Commercial services 145 130Trade per capita (US$, 2008-2010) 859 excluding intra-EU trade 119 104Trade to GDP ratio (2008-2010) 74.9
2010 136
Exports of goods and services (volume, 2005=100) a 147Imports of goods and services (volume, 2005=100) a 133
TRADE POLICY
WTO accession 1 January 1995 Contribution to WTO budget (%, 2011) 0.025Trade Policy Review 27, 29 July 2009 Import duties collected GPA accession - in total tax revenue ...Tariffs and duty free imports to total imports ...
Tariff binding coverage (%) 16.8 Number of notifications to WTO and measures in force MFN tariffs Applied 2010 25
Simple average of import duties Goods RTAs - services EIAs notified to WTO 2 - 0All goods 106.5 13.4 Anti-dumping (30 June 2010) ...
Agricultural goods (AOA) 123.4 19.0 Countervailing duties (30 June 2010) ...Non-agricultural goods 42.7 12.5 Safeguards (22 October 2010) 0
0.0 0.00 - 0
19.7 Original panel / Appellate Body (AB) reports 0 - 0 41.7 Compliance panel / AB reports (Article 21.5 DSU) 0 - 0
Agricultural products 6.8 Agricultural products 5.3Fuels and mining products 83.2 Fuels and mining products 32.6Manufactures 8.9 Manufactures 61.7
1. Switzerland 51.0 1. South Africa 34.42. China 20.2 2. Congo, Dem. Rep. of 23.83. South Africa 9.1 3. Kuwait 9.64. Congo, Dem. Rep. of 4.6 4. European Union (27) 9.15. European Union (27) 4.4 5. China 5.4
COMMERCIAL SERVICES TRADE Value2010 2009 312 901
2010 0.01 0.03
Breakdown in economy's total exports By principal services item
49.0 55.8 40.0 7.5 11.0 36.7
INDUSTRIAL PROPERTY
Madrid Total 795 795
October 2011
Zambia
Annual percentage change2005-2010 2009 2010
Real GDP (2005=100) 6 6 821 ... ...15 ... ...
Final bound
Non ad-valorem duties (% total tariff lines) Number of disputes (complainant - defendant) Requests for consultation
in agricultural goods (AOA) in non-agricultural goods
Annual percentage change2005-2010 2009 2010
Merchandise exports , f.o.b. (million US$) b ... -15 67Merchandise imports , c.i.f. (million US$) b ... -25 40
2010Share in world total exports Share in world total imports
Breakdown in economy's total imports By main commodity group (ITS) By main commodity group (ITS)
2010Share in world total exports Share in world total imports
Breakdown in economy's total imports By principal services item
Transportation Transportation
Direct residents Direct non-residents
Travel Travel Other commercial services Other commercial services
... 29 29 ... ...
Patent grants by patent office, 2001 Trademark registrations by office, 2009Residents Non-residents Total
Outstanding notifications in WTO Central Registry
MFN duty free imports (%, 2009)
a Refers to 2007 and to the average annual percentage change for 2005-2007. b Break in series for merchandise: 2008.
Zambia
World Trade OrganizationTrade Profiles 2011
188 Download the data:www.wto.org/statistics
Zimbabwe
BASIC INDICATORS Population (thousands, 2010) 12 571 Rank in world trade, 2010 Exports ImportsGDP (million current US$, 2010) 7 474 Merchandise 121 130GDP (million current PPP US$, 2010) ... excluding intra-EU trade 96 104Current account balance (million US$, 2010) ... Commercial services 155 145Trade per capita (US$, 2008-2010) ... excluding intra-EU trade 129 119Trade to GDP ratio (2008-2010) ...
2010 92
Exports of goods and services (volume, 2005=100) 79Imports of goods and services (volume, 2005=100) 127
TRADE POLICY
WTO accession 5 March 1995 Contribution to WTO budget (%, 2011) 0.015Trade Policy Review ... Import duties collected GPA accession - in total tax revenue ...Tariffs and duty free imports to total imports ...
Tariff binding coverage (%) 21.9 Number of notifications to WTO and measures in force MFN tariffs Applied 2010 39
Simple average of import duties Goods RTAs - services EIAs notified to WTO 3 - 0All goods 89.2 19.5 Anti-dumping (30 June 2010) ...
Agricultural goods (AOA) 140.1 24.4 Countervailing duties (30 June 2010) ...Non-agricultural goods 11.0 18.8 Safeguards (22 October 2010) 0
0.6 6.10 - 0
18.1 Original panel / Appellate Body (AB) reports 0 - 0 20.4 Compliance panel / AB reports (Article 21.5 DSU) 0 - 0
Agricultural products 27.0 Agricultural products 20.7Fuels and mining products 36.4 Fuels and mining products 24.3Manufactures 36.3 Manufactures 50.5
1. South Africa 54.2 1. South Africa 50.22. European Union (27) 11.2 2. United States 8.53. United Arab Emirates 10.3 3. European Union (27) 8.44. China 7.4 4. China 6.25. Mozambique 2.9 5. United Arab Emirates 5.3
COMMERCIAL SERVICES TRADE Value2010 2009
...
...
2010... ...
Breakdown in economy's total exports By principal services item
... ...
... ...
... ...
INDUSTRIAL PROPERTY
Madrid Total ... 20
October 2011
Zimbabwe
Annual percentage change2005-2010 2009 2010
Real GDP (2005=100) -2 6 9-5 5 215 36 7
Final bound
Non ad-valorem duties (% total tariff lines) Number of disputes (complainant - defendant) Requests for consultation
in agricultural goods (AOA) in non-agricultural goods
2010Share in world total exports Share in world total imports
Breakdown in economy's total imports By principal services item
Transportation Transportation
Direct residents Direct non-residents
Travel Travel Other commercial services Other commercial services
... 29 29 2 18
Patent grants by patent office, 2001 Trademark registrations by office, 2001Residents Non-residents Total
Outstanding notifications in WTO Central Registry
MFN duty free imports (%, 2009)
World Trade OrganizationTrade Profiles 2011
Download the data:www.wto.org/statistics 189
Acknowledgements are due to the International Monetary Fund, the International Trade Centre, the Organisation for Economic Cooperation and Development, the Statistical Office of the European Communities, United Nations Conference on Trade and Development, the United Nations Statistics Division, the World Bank and the World Intellectual Property Organization. The assistance of all these organizations in supplying statistics as well as other information has greatly facilitated the work of the WTO Secretariat.
Acknowledgements
About the WTO
The World Trade Organization deals with the global rules of trade between nations. Its main function is to ensure that trade flows as smoothly, predictably and freely as possible.
About this publication
Trade Profiles combine information on trade flows and trade policy measures of members, observers and other selected economies. The information is retrieved from various WTO Divisions and external sources and presented in standardized format for quick reference.
For more information
The statistical tables included in this report can be downloaded from the WTO web site at www.wto.org/statistics
To order, please contact:WTO Publications World Trade Organization 154, rue de Lausanne CH-1211 Geneva 21Tel: +41 (0)22 739 52 08 Fax: +41 (0)22 739 54 58 Email: [email protected] WTO bookshophttp://onlinebookshop.wto.org
This publication is available online at:www.wto.org/statisticsIf you would like more information on the contents of this report or if you have any comments or suggestions for improvement please contact the International Trade Statistics Section ([email protected]).
ISBN 978-92-870-3795-4Also available in French and Spanish:Profils commerciaux 2011 ISBN 978-92-870-3796-1Perfiles comerciales 2011 ISBN 978-92-870-3797-8
Trade Profiles 2011 provides the latest information on the trade flows and trade policy measures of WTO members, observers and other selected economies. With information for each economy provided in a standardized format, the publication is an invaluable quick reference tool for anyone looking for essential trade statistics. The data provided for each economy include basic economic indicators (such as GDP), trade policy indicators (such as tariffs, import duties, number of disputes, notifications outstanding and contingency measures in force), merchandise trade flows (broken down by broad product categories and major origins and destinations), services trade flows (with a breakdown by major components) and industrial property indicators. With one page devoted to each economy, Trade Profiles offers a concise overview of global trade.