28
TRANSNET CAPITAL PROJECTS CESA Presentation 3 rd June 2010 Presented by: Neville Eve General Manager: Project Development & Execution

TRANSNET CAPITAL PROJECTSCESA Presentation
3rd June 2010
Presented by: Neville EveGeneral Manager: Project Development & Execution
INDEX
1
Overview of Transnet
• Mandate, vision and values
• Turnaround over last 5 years
• Overview of 2009/2010 performance
Transnet 2010/11 Corporate Plan
Strategic priorities
Summary of Shareholder Compact and targets
Key commodities to be prioritised
Transnet‟s role in SA Infrastructure
Overview of national infrastructure investments
Challenges in rolling out investment plans

Vision and mission
• Transnet is a focused freight transport company, delivering integrated, efficient,
safe, reliable and cost-effective services to promote economic growth in South
Africa.
• This is to be achieved through increasing our market share, improving productivity
and profitability and by providing appropriate capacity to our customers ahead of
demand.
Values
We would like our customers to prefer us because:
• We are reliable, trustworthy, responsive and safe; and because:
• Our employees are committed, safety conscious, accountable, ethical, disciplined
and results orientated.
INTRODUCTION
• Transnet‟s key role is to assist in lowering the cost of doing business in South Africa
and enabling economic growth through providing appropriate ports, rail and pipeline
infrastructure and operations in a cost-effective and efficient manner and within
acceptable benchmark standards.
• Transnet is self-funded and does not receive subsidies from the State and
accordingly Transnet must earn an appropriate return on investment to ensure the
sustainability of the company over the long term.
Shareholder mandate
2
3
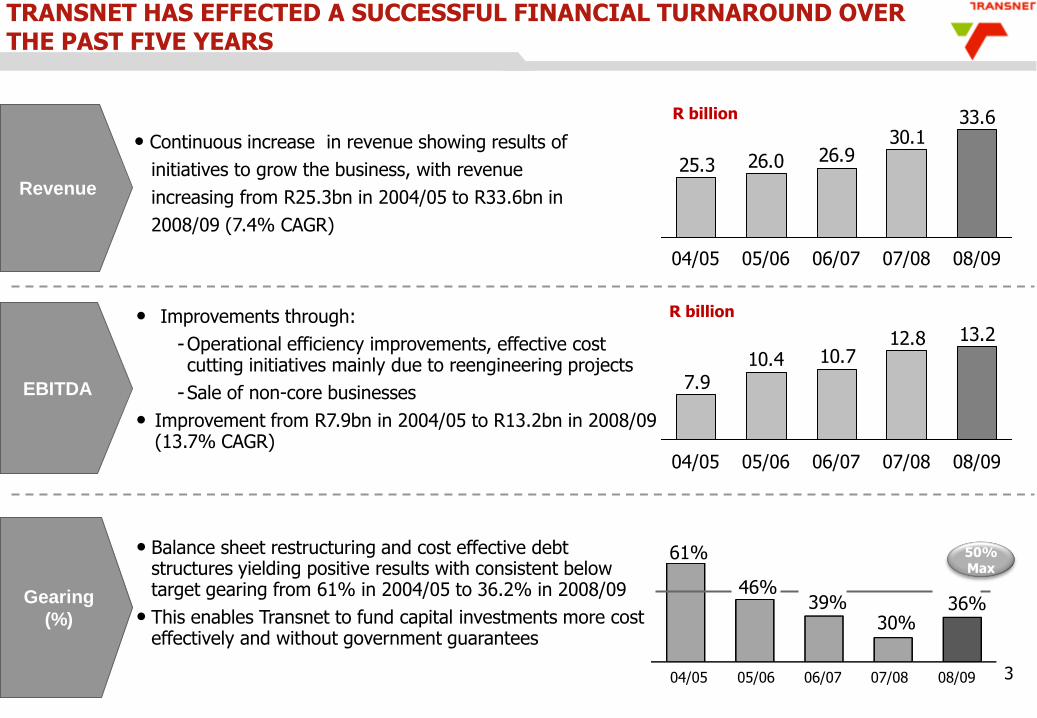
Revenue
• Continuous increase in revenue showing results of
initiatives to grow the business, with revenue
increasing from R25.3bn in 2004/05 to R33.6bn in
2008/09 (7.4% CAGR)
EBITDA
• Improvements through:
Operational efficiency improvements, effective cost cutting initiatives mainly due to reengineering projects
Sale of non-core businesses
• Improvement from R7.9bn in 2004/05 to R13.2bn in 2008/09 (13.7% CAGR)
• Balance sheet restructuring and cost effective debt structures yielding positive results with consistent below target gearing from 61% in 2004/05 to 36.2% in 2008/09
• This enables Transnet to fund capital investments more cost effectively and without government guarantees
08/09
36%
07/08
30%
06/07
39%
05/06
46%
04/05
61% 50%Max
Gearing
(%)
TRANSNET HAS EFFECTED A SUCCESSFUL FINANCIAL TURNAROUND OVER THE PAST FIVE YEARS
13.212.810.710.4
7.9
04/05 05/06 06/07 07/08 08/09
33.630.1
26.926.025.3
08/0907/0806/0705/0604/05
R billion
R billion
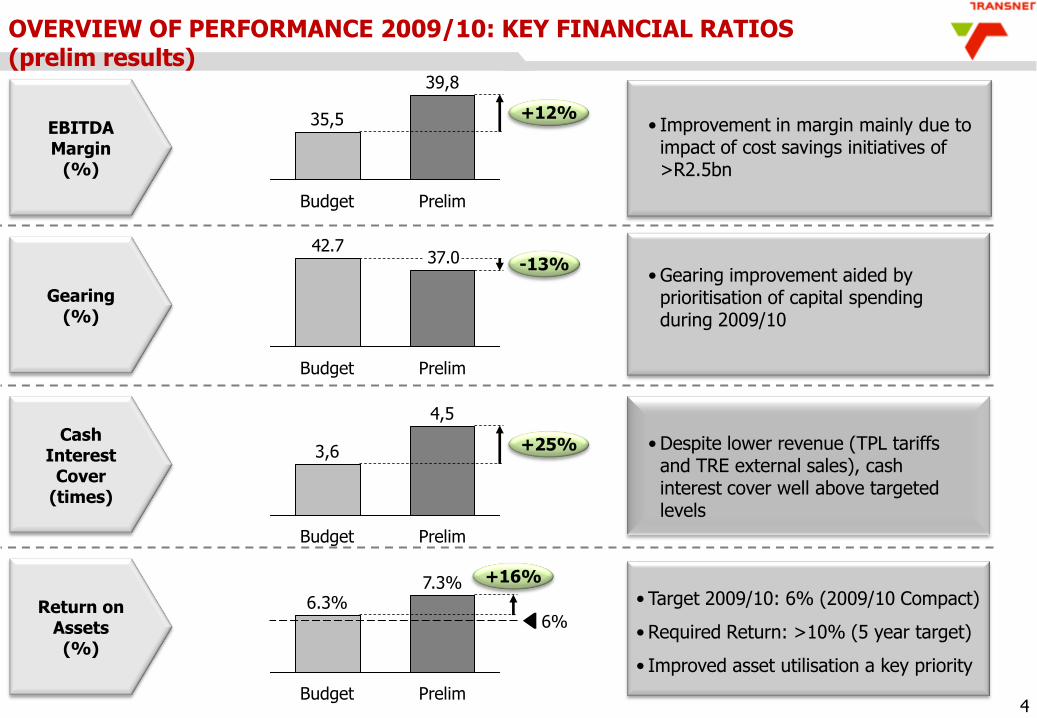
EBITDA Margin
(%)
35,5
PrelimBudget
39,8
+12%
Gearing(%)
Cash Interest
Cover(times)
Return on Assets (%)
37.042.7
Budget Prelim
-13%
4,5
Budget Prelim
3,6 +25%
7.3%
Budget
6%
Prelim
6.3%
+16%
• Improvement in margin mainly due to impact of cost savings initiatives of >R2.5bn
• Gearing improvement aided by prioritisation of capital spending during 2009/10
• Despite lower revenue (TPL tariffs and TRE external sales), cash interest cover well above targeted levels
• Target 2009/10: 6% (2009/10 Compact)
• Required Return: >10% (5 year target)
• Improved asset utilisation a key priority
4
OVERVIEW OF PERFORMANCE 2009/10: KEY FINANCIAL RATIOS (prelim results)

OVERVIEW OF PERFORMANCE 2009/10: CAPITAL INVESTMENT
5
• The following major milestones in creating capacity ahead of demand have successfully been rolled out during theyear:• Durban Harbour entrance channel widening and deepening was successfully commissioned in March 2010. The
entrance channel has been widened to 225m from 140m and dredged to a depth of 18m from the initial 12m.• Locomotive programme: 6 of the 110 dual voltage (19E) locomotives for the Coal Line have been commissioned, 37
units are expected to be delivered in 2010/11 and all 50 of the EMD „like new‟ locomotives have been delivered andoperating in the general freight business. Three of the 44 locomotives for the iron ore (15Es) have been deliveredand are currently undergoing acceptance testing.
• Cape Town Container Terminal Capacity Expansion and Equipment on track with spending to date of R0.9bn.• Port of Ngqura commenced operations in October 2009.
• Transnet will continue to focus on the nature and extent of capital investment spending during the 2010/11 financialyear in order to ensure an optimal capital portfolio in line with business needs and capacity requirements.
Transnet Group Historical Capital Investment(R billion)
18.519.4
15.8
11.7
6.6
2009/10Prelim
2008/092007/082006/072005/06
Total Investment over
past 5 years:R72bn
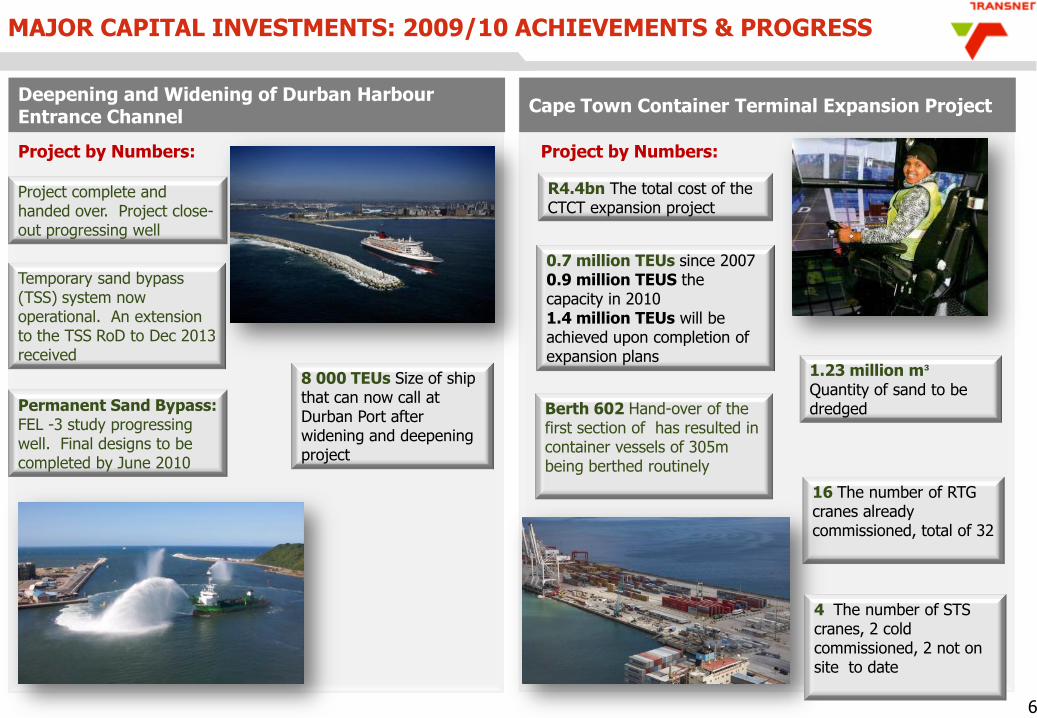
MAJOR CAPITAL INVESTMENTS: 2009/10 ACHIEVEMENTS & PROGRESS
6
Deepening and Widening of Durban HarbourEntrance Channel
Cape Town Container Terminal Expansion Project
Project by Numbers:
Project complete and handed over. Project close-out progressing well
Temporary sand bypass (TSS) system now operational. An extension to the TSS RoD to Dec 2013 received
Permanent Sand Bypass: FEL -3 study progressing well. Final designs to be completed by June 2010
8 000 TEUs Size of ship that can now call at Durban Port after widening and deepening project
Project by Numbers:
R4.4bn The total cost of the CTCT expansion project
Berth 602 Hand-over of the first section of has resulted in container vessels of 305m being berthed routinely
0.7 million TEUs since 20070.9 million TEUS the capacity in 20101.4 million TEUs will be achieved upon completion of expansion plans
1.23 million m³
Quantity of sand to be dredged
16 The number of RTG cranes already commissioned, total of 32
4 The number of STS cranes, 2 cold commissioned, 2 not on site to date
MAJOR CAPITAL INVESTMENTS: 2009/10 ACHIEVEMENTS & PROGRESS
7
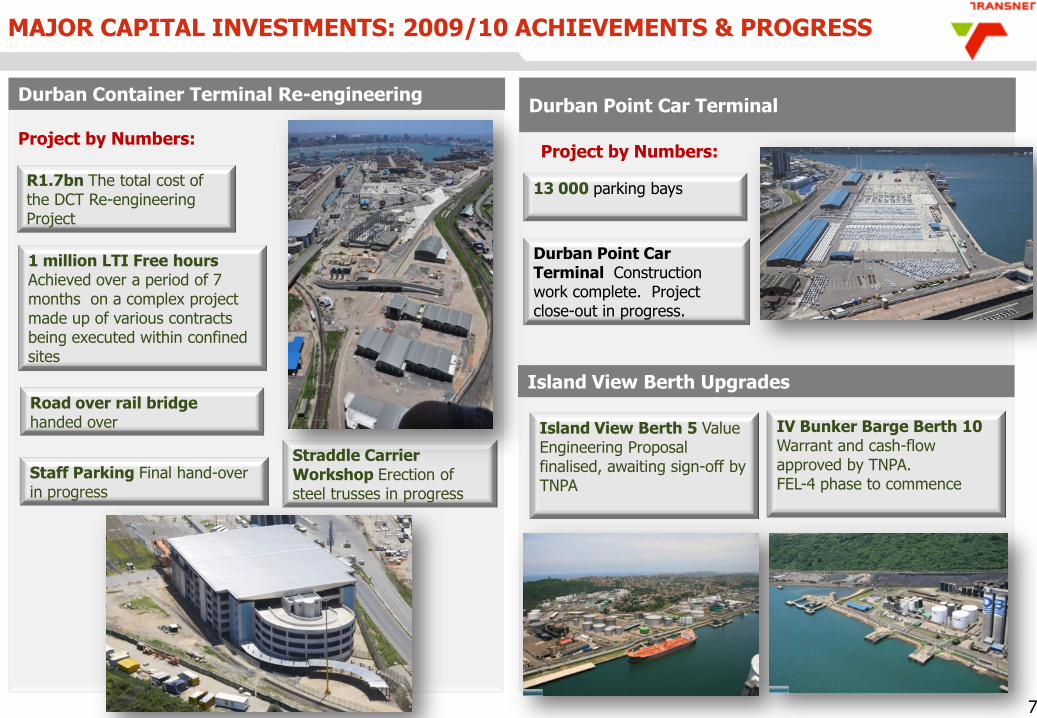
Durban Container Terminal Re-engineeringDurban Point Car Terminal
Project by Numbers:
R1.7bn The total cost of the DCT Re-engineering Project
Straddle Carrier Workshop Erection of steel trusses in progress
Project by Numbers:
13 000 parking bays
Durban Point Car Terminal Construction work complete. Project close-out in progress.
IV Bunker Barge Berth 10 Warrant and cash-flow approved by TNPA. FEL-4 phase to commence
Island View Berth 5 Value Engineering Proposal finalised, awaiting sign-off by TNPA
1 million LTI Free hours Achieved over a period of 7 months on a complex project made up of various contracts being executed within confined sites
Staff Parking Final hand-over in progress
Road over rail bridge handed over
Island View Berth Upgrades

MAJOR CAPITAL INVESTMENTS: 2009/10 ACHIEVEMENTS & PROGRESS
8
Salisbury Island and Maydon WharfRoads: Edwin Swales & Link Roads
Project by Numbers:
Negotiations taking placebetween Transnet and Dept. of Public Works to conclude a Land sale agreement
Replacement Facilities for the Navy Construction to commence during 2010
Project by Numbers:
Feasibility study is in progress with geotechnical studies complete
Environmental approval to commence in 2010
Designs complete. Tenders are being called forat present.
Maydon Wharf Berth 12 Reconstruction Designs complete. Construction to start in Aug 2010
Reconstruction of steel sheet pile berths Funds allocated over next 5 year period for reconstruction
Bayhead Road Widening & Upgrade
Construction to commence by Jul 2010

MAJOR CAPITAL INVESTMENTS: 2009/10 ACHIEVEMENTS & PROGRESS
9
Berth Deepening: Container BerthsRichcor: Port Projects
Project by Numbers:
Scour protection to Container berths to commence in next 2months
In terms of current design, dredging from 11.5m to 12.8m in the container channel and on the berths is nearing completion
Project by Numbers:
Port to Nsezi Rail Link Draft Board and public notices fore EIA process has been finalised
Richard Bay Dry Bulk Terminal Refurbishment Hot commissioning of the IMG MAN shiploader is due for completion during May 2010.
71 mtpa Task order issuedto RME to commence construction of track switchstructure for Delmas, Argent & Kendal traction subs
Feasibility study for deepening of container berths complete-some elements being verified
Environmental authorisationprocess to commence in next 2 months
Rail Projects (Coal Line)
81 mtpa Capital investmentApplication approved, includesThe FEL-3 study and EIA.
Berth deepening to commence within the 5-year capital program
HMG JV handover to TCP is progressing well
FEL-3 Study Team beingmobilised

MAJOR CAPITAL INVESTMENTS: 2009/10 ACHIEVEMENTS & PROGRESS
10
Port of Ngqura Locomotive fleet renewal
Project by Numbers:
Ngqura Master Plans report in the process of being finalised
Project close-out in progress
3rd Tug will be delivered by 31 May 2010. First 2 tugs fully operational
Flooding of quay wallscheduled for 27 May 2010
Project by Numbers:
R3.2bn The total estimated cost of 50 EMD‟s and 100 diesel electric locos
>30 years The average age of TFR‟sexisting fleet
<15 years The average age of a “Class 1” railway‟s locomotives (TFR target ~20 years)
50 The number of EMD locomotives commissioned as at March 2010 (flag-ship CSDP)
59 The number of new mainline locos (inclEMD) in operation as at March 2010 (130 by 2011)
Spatial/Site Development plan with the CDC (for approval by Municipality, and Emergency Plan for Marshalling Yard submitted to CDC
Dredging tender has been penned and site inspection scheduled for 20 May 2010

MAJOR CAPITAL INVESTMENTS: 2009/10 ACHIEVEMENTS & PROGRESS
11
Port of Ngqura Port of PE: Manganese Refurbishment
Project by Numbers:
R7bn Transnet‟s investment in Port of Ngqura
Port Control Equipped with world-class maritime equipment including high tech vessel traffic management information systems
60 hectares The size of the Ngqura Container Terminal
800 000 TEUs The current capacity in TUEs of the Ngqura Container Terminal
Project by Numbers:
R1bn investment required to refurbish the facility
Physical project is complete.
4.2mtpa Restoration of capacity to this level. Previous capacity was constrained to 2.8mtpa
6mtpa Plans are to increase to this level of throughput as per design capacity of terminal
22 The number of rubber-tyred gantry cranes in use at the port,6 ship-to-shore cranes,2 rail mounted gantry cranes
1.5 million TEUs The capacity in TEUs the terminal is set to reach by 2015
Potential solution or noise and centre chute wearing off on new Reclaimer B recommended and being discussed
MAJOR CAPITAL INVESTMENTS: 2009/10 ACHIEVEMENTS & PROGRESS
12
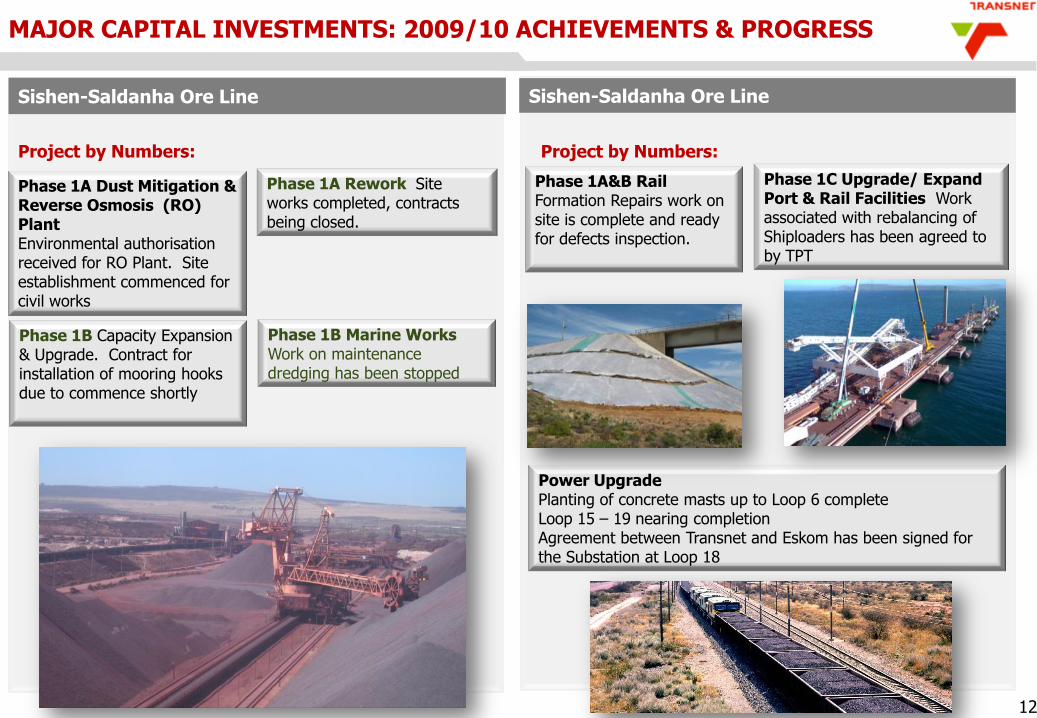
Sishen-Saldanha Ore Line Sishen-Saldanha Ore Line
Project by Numbers:
Phase 1A Dust Mitigation & Reverse Osmosis (RO) PlantEnvironmental authorisationreceived for RO Plant. Site establishment commenced for civil works
Phase 1A Rework Site works completed, contracts being closed.
Phase 1B Capacity Expansion & Upgrade. Contract for installation of mooring hooks due to commence shortly
Project by Numbers:
Phase 1A&B Rail Formation Repairs work on site is complete and ready for defects inspection.
Power Upgrade Planting of concrete masts up to Loop 6 completeLoop 15 – 19 nearing completionAgreement between Transnet and Eskom has been signed for the Substation at Loop 18
Phase 1B Marine Works Work on maintenance dredging has been stopped
Phase 1C Upgrade/ Expand Port & Rail Facilities Work associated with rebalancing of Shiploaders has been agreed to by TPT

MAJOR CAPITAL INVESTMENTS: 2009/10 ACHIEVEMENTS & PROGRESS
13
New Multi-Product Pipeline (NMPP)
Project by Numbers:
Pipeline Construction (PL3)The Uncle Charlie‟s Horizontal Directional Drilling (HDD) has been completed.
Pipeline 1 (PL1)The Durban section of PL1 achieved 1 million accident free hours (LTI‟s)
Project by Numbers:
R15,4 billion Cost of the project
The Integrated Project Team (IPT) achieved 500 000 accident free hours (LTI‟s) for the first time since the start of the project
PL1 (Jameson Park to Durban) Five trenching machines mobilised on the project. 199km excavated to date
353km of pipeline delivered to pipe yards330km strung on the Right of Way (RoW)138km bedding and lowering achieved103km backfilled
14 trenchless crossing sleeves completed with 24 remaining
PL4 (Anglo Coal Section) Pipe stringing and bending completed at the Anglo Coal Section.3.8km has been welded, coated and ready for lowering-in.
INDEX
14
Overview of Transnet
• Mandate, vision and values
• Turnaround over last 5 years
• Overview of 2009/2010 performance
Transnet 2010/11 Corporate Plan
Strategic priorities
Summary of Shareholder Compact
Transnet‟s role in SA Infrastructure
Overview of national infrastructure investments
Challenges in rolling out investment plans

Investment
Governance and performance management
Client orientated planning and execution through integrated commercial management
• Focusing on five key corridors,providingend-to-end logistics services to customers
• Focus on key commodities
• Inform policy and regulatory reform.
• Procurement Strategy (including CSDP and BBBEE).
• Shared services.
• Environment and climate change focus.
• Effective reputation management.
• Revise operating model and structure for effective strategy execution.
• Performance management linked to SPOs and incentive schemes.
• Implement sustainability measurement framework.
• Replacement and expansion of infrastructure to support growth (ahead of demand).
• Obtain returns greater than weighted average cost of capital (WACC).
• Maintain financial metrics (gearing and cash interest cover levels).
• PSPs.
• Branch lines.
Reengineering,
integration,
productivity and efficiency
• Operational efficiency and productivity improvement.
Capital Optimisation and
Financial Management
• Optimal cost structures.
• Effective funding.
• Strong balance sheet.
Safety, risk and environment
• Reduce safety incidents and cost of losses.
• Enterprise risk management.
• Improved environmental management.
Human Capital Optimisation
• Capacity and skills development.
• Transformation (EE)
• Reshaping the workforce
Key elements for growth
STRATEGIC PRIORITIES: 2010/11
• Africa
• Domestic Intermodal
• PSPs to fund expansions
Expansion intonew business
15
Productivity and efficiency improvements across the company

SUMMARY OF STRATEGIC OBJECTIVES IN SHAREHOLDER COMPACT: 2010/11
• Grow rail volumes in key General Freight Business sectors
• Actively and vigorously contribute towards the reduction on overall transport and logistics costVolume and
Revenue Growth
• Transnet shall maintain a strong balance sheet with gearing at appropriate levels and sufficient cash interest cover
• Earn an appropriate return on investment to ensure the sustainability of the company
Capital and financial efficiency
• Improve operating efficiencies and effectiveness in line with industry standards
• Net operating margin improvement in key business units, based on cost reduction and containment
Operational efficiency
• Make appropriate investment in ports, rail and pipelines to enable growth where the investment return is greater than Transnet's WACC
Infrastructure Investments
• Contribute towards ASGI-SA through its core business and leveraging the economic benefits from associated activities (i.e. Competitive Supplier Development Program)
• Skills development and Black Economic Empowerment
Developmental objectives
• Increase focus on significantly improving health and safety standards in line with leading practices
• Ensure compliance with environmental laws and proactively reduce negative environmental impacts
SHEQ
16
Aligned with Transnet‟s Growth Strategy
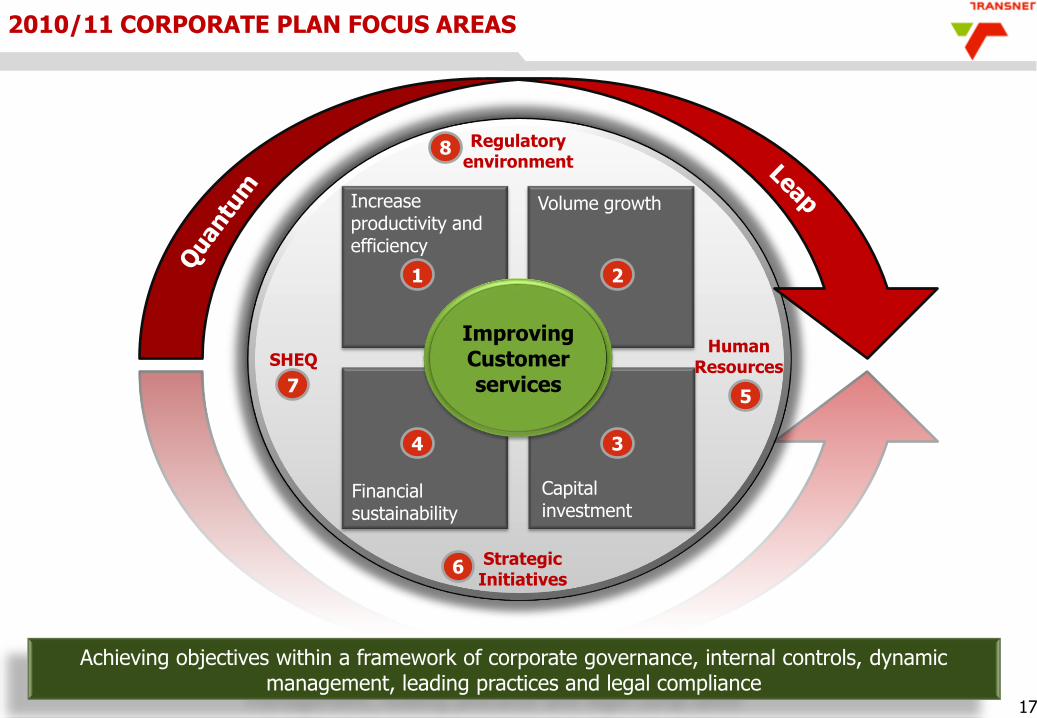
2010/11 CORPORATE PLAN FOCUS AREAS
17
Volume growth
Capital investment
Financial sustainability
Increase productivity and efficiency
Regulatory environment
SHEQHuman
Resources
Strategic Initiatives
2
34
1
Achieving objectives within a framework of corporate governance, internal controls, dynamic management, leading practices and legal compliance
5
6
8
7
Improving Customer services
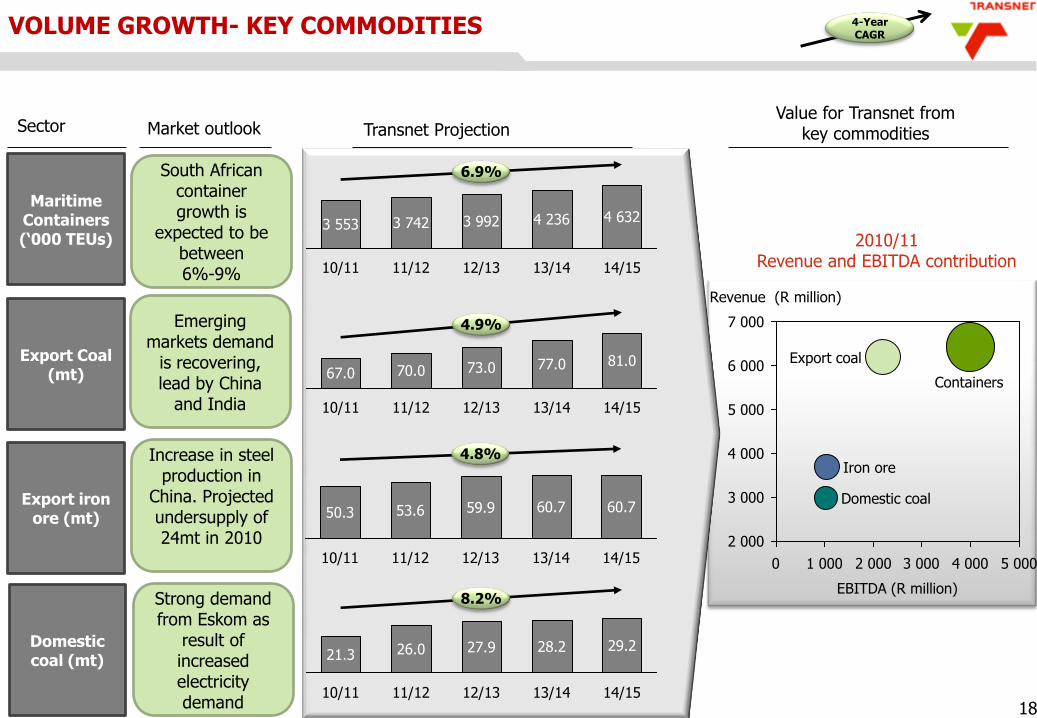
VOLUME GROWTH- KEY COMMODITIES
18
Sector Market outlook Transnet ProjectionValue for Transnet from
key commodities
Maritime Containers(‘000 TEUs)
14/15
4 632
13/14
4 236
12/13
3 992
11/12
3 742
10/11
3 553
6.9%
Export Coal(mt)
Export iron ore (mt)
Domestic coal (mt)
4.9%
14/15
81.0
13/14
77.0
12/13
73.0
11/12
70.0
10/11
67.0
4.8%
10/11
50.3
14/15
60.7
13/14
60.7
12/13
59.9
11/12
53.6
8.2%
14/15
29.2
13/14
28.2
12/13
27.9
11/12
26.0
10/11
21.3
South African container growth is
expected to be between 6%-9%
Emerging markets demand
is recovering,lead by China
and India
Increase in steel production in
China. Projected undersupply of 24mt in 2010
Strong demand from Eskom as
result of increased electricity demand
Revenue (R million)
7 000
6 000
5 000
4 000
3 000
2 000
EBITDA (R million)
5 0004 0003 0002 0001 0000
Domestic coal
Iron ore
Export coal
Containers
2010/11 Revenue and EBITDA contribution
4-Year CAGR

19
Sector Market outlook Transnet ProjectionValue for Transnet from
key commodities
Manganese(mt)
5.5%
14/15
7.0
13/14
7.0
12/13
7.0
11/12
6.2
10/11
5.6
Magnetite(mt)
PipelinePetroleum
(Bn.l)
Rail containers (‘000 TEUs)
12.3%
14/15
5.7
13/14
5.2
12/13
4.6
11/12
4.1
10/11
3.6
3.4%
14/15
17.9
13/14
19.4
12/13
20.1
11/12
19.6
10/11
20.5
9.7%
14/15
838
13/14
777
12/13
712
11/12
641
10/11
579
Strong demand from Rio Tinto in Phalaborwa. Rio
Tinto contracting for
3mt export
Steady growth in petroleum volumes are aligned to
approximately GDP-1%
Opportunity for TFR to gain
market share if fuel prices continue to
increase
Revenue (R million)
800
400
2 000
1 600
1 200
0
EBITDA (R million)
8007006005004003002001000
Containers on rail
Petroleum
Magnetite
Manganese
Production growth over the next 3-years is approximately 5.6%p.a. (industry
indicate 14mt in future years)
2010/11 Revenue and EBITDA contribution
VOLUME GROWTH- KEY COMMODITIES 4-Year CAGR

VOLUME GROWTH – CAPITALISE ON OPPORTUNITIES
20
EXPANSION INTO NEW BUSINESS PRIVATE SECTOR PARTICIPATION
Africa Strategy: Enabling economic trade
Due-diligence on Africa opportunities:
− Partnership with regional ports (Luanda)
− Intensive cooperation with Port of Maputo
− Growing volumes on SADC corridors
− Development of Southern Africa transhipment
hub
Domestic Intermodal Business
• Finalise domestic container strategy and
develop roll out plan
• Enable optimal resource requirements to
support strategy
• Secure volumes contracts
Develop a detailed PSP Framework and
strategy:
Develop robust business cases for potential
projects within approved PSP framework
Obtain necessary governance approvals
(Board/Shareholder)
Establish transparent processes to engage
private sector partnerships
Key deliverablesin 2010/11
Expanding existing operations (export
iron ore/ manganese
expansion, export coal)
New business (i.e. intermodal/Africa)

21
Competitive Supplier Development Programme
Transnet will continue to implement the Competitive
Supply Development Programme (CSDP) to contribute
towards the competitiveness of the domestic supply
chain and procurement environment
Leveraging the procurement capacity of Original
Equipment Manufacturers (OEMs) through the
development of downstream suppliers
Expanding the local supplier base
Close collaboration with all stakeholders to develop
local suppliers and to maximise localisation
opportunities
INITIATIVES TO SUPPORT STRATEGIC OBJECTIVES Quantum Leap
• 50 “Like-new” programme now complete under the equivalent of the CSDPFramework using Transnet Rail Engineering
• First major tender issued with CSDP obligation which will yield an investment of R335m for TRE together with significant skills transfer and >R300m for other local suppliers
• TRE will be a centre of excellence for locomotive OEMs

INDEX
22
Overview of Transnet
• Mandate, vision and values
• Turnaround over last 5 years
• Overview of 2009/2010 performance
Transnet 2010/11 Corporate Plan
Strategic priorities
Summary of Shareholder Compact
Transnet‟s role in SA Infrastructure
Overview of national infrastructure investments
Challenges in rolling out investment plans
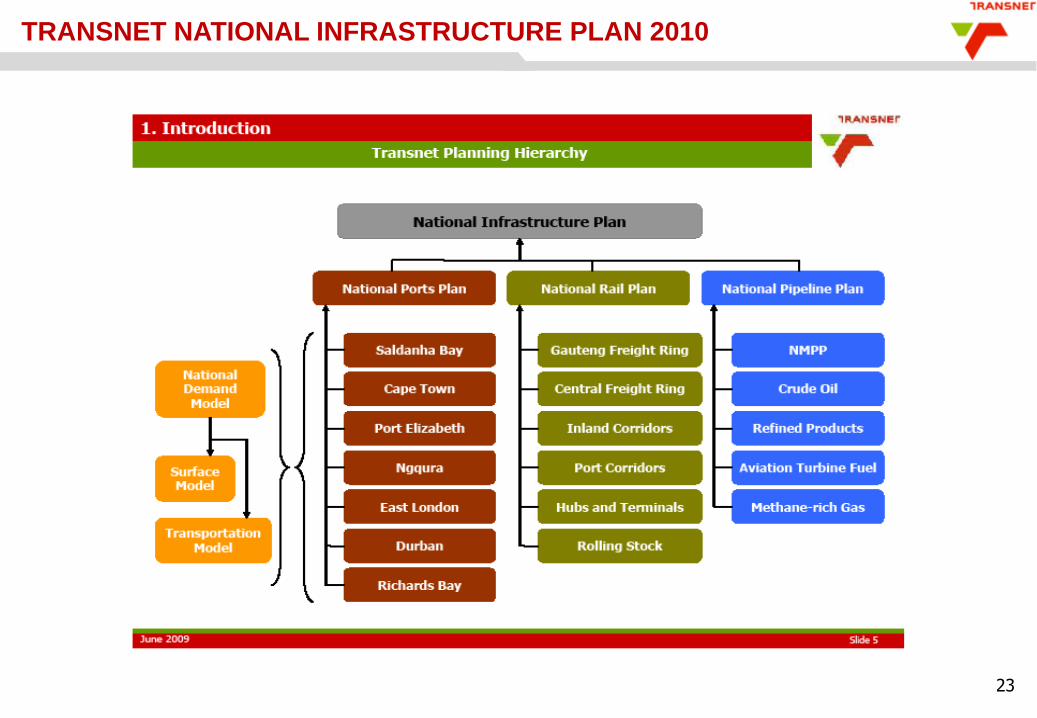
TRANSNET NATIONAL INFRASTRUCTURE PLAN 2010
23
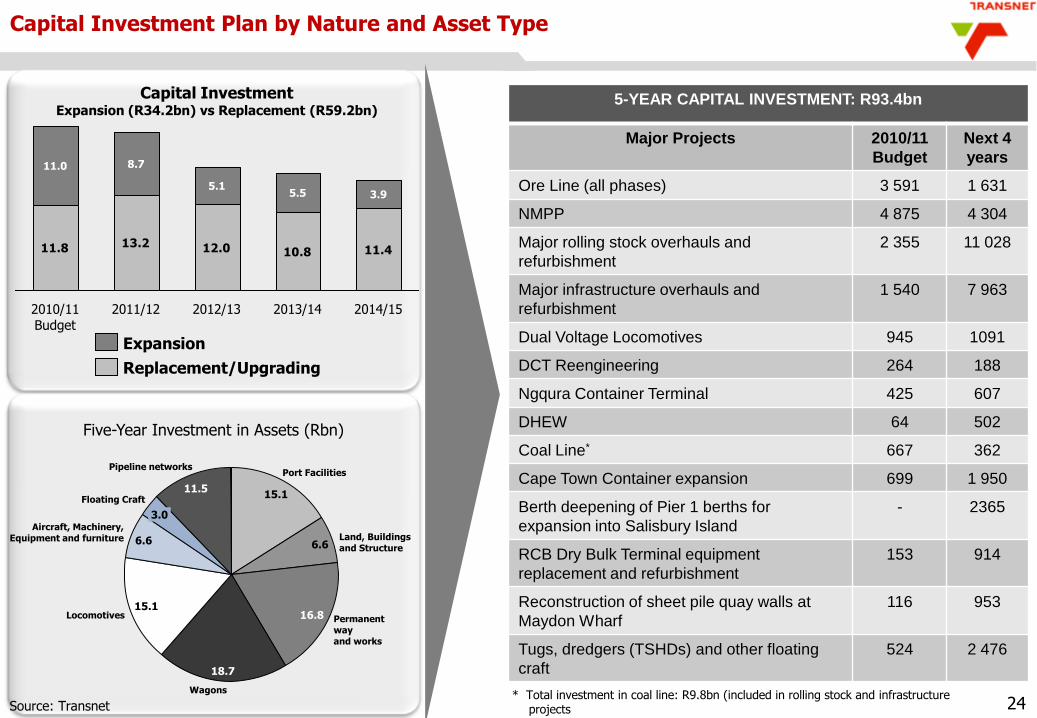
Capital Investment Plan by Nature and Asset Type
11.8 13.2 12.0 10.8 11.4
2014/15
3.9
2013/14
5.5
2012/13
5.1
2011/12
8.7
2010/11 Budget
11.0
Replacement/Upgrading
Expansion
Capital Investment Expansion (R34.2bn) vs Replacement (R59.2bn)
Pipeline networks
11.5
Aircraft, Machinery, Equipment and furniture 6.6
Wagons
18.7
16.8 Permanent wayand works
Land, Buildingsand Structure6.6
Port Facilities
15.1
15.1Locomotives
3.0
Floating Craft
Five-Year Investment in Assets (Rbn)
5-YEAR CAPITAL INVESTMENT: R93.4bn
Major Projects 2010/11
Budget
Next 4
years
Ore Line (all phases) 3 591 1 631
NMPP 4 875 4 304
Major rolling stock overhauls and
refurbishment
2 355 11 028
Major infrastructure overhauls and
refurbishment
1 540 7 963
Dual Voltage Locomotives 945 1091
DCT Reengineering 264 188
Ngqura Container Terminal 425 607
DHEW 64 502
Coal Line* 667 362
Cape Town Container expansion 699 1 950
Berth deepening of Pier 1 berths for
expansion into Salisbury Island
- 2365
RCB Dry Bulk Terminal equipment
replacement and refurbishment
153 914
Reconstruction of sheet pile quay walls at
Maydon Wharf
116 953
Tugs, dredgers (TSHDs) and other floating
craft
524 2 476
* Total investment in coal line: R9.8bn (included in rolling stock and infrastructure projectsSource: Transnet 24

5 YEAR CAPITAL INVESTMENT PLAN: REPLACEMENT AND EXPANSION
25
Equipment Existing fleetNew/Additional
(over the next 5 years)Comments
Locomotives 1 978 304 (within 3 years) Address capacity increase in Coal (110), Ore (44) and GFB (150).
Wagons 72 643 7 231 Address capacity increases in Coal, iron ore and GFB.
Cranes 95 19 Container handling cranes at PECT and CTCT. Capacity at other terminals to be extracted through improvement in efficiency.
Capacity Creation Existing capacityFuture capacity
(over the next 5 years)Comments
Containers 4.56mTEUs 6.26mTEUs Surplus capacity in system – will review on annual basis
Pipeline (NMPP) 4.4bn litres 8.7bn litres (2012) Provision to increase in future years
Coal 71mt 81mt (2015) Working with industry on feasibility to increase to >90mtpa
Iron Ore 47mt 60mt (2012) Working with industry on feasibility to increase iron ore >80mtpa and manganese to >12mtpa
15% new
10% new
20% new

The Transnet capital investment programme makes a major contribution in terms of additional GDP – both in terms of magnitude and spread
(2018 difference with and without
investment programme) Direct impact Indirect impact Induced impact Total impact
Impact on GDP (m) R 38 436 R 31 712 R 42 399 R 112 548
Impact on Capital Formation (m) R 116 797 R 67 079 R 86 043 R 269 920
Impact on Employment [numbers] 119 108 193 154 263 594 575 856
Skilled 27 105 43 589 62 742 133 436
Semi-skilled 57 475 79 869 105 435 242 778
Unskilled 34 529 69 696 95 417 199 642
Impact on Households (m): R 71 697
Low Income Households R 12 266
Medium Income Households R 14 876
High Income Households R 44 555
Fiscal Impact (m): R 32 809
National Government R 31 909
Provincial Government R 218
Local Government R 682
Impact on the Balance of Payments (m) R 44 383
Source: DPE Study, Measurement of the impact of Transnet on the South African economy, 2010
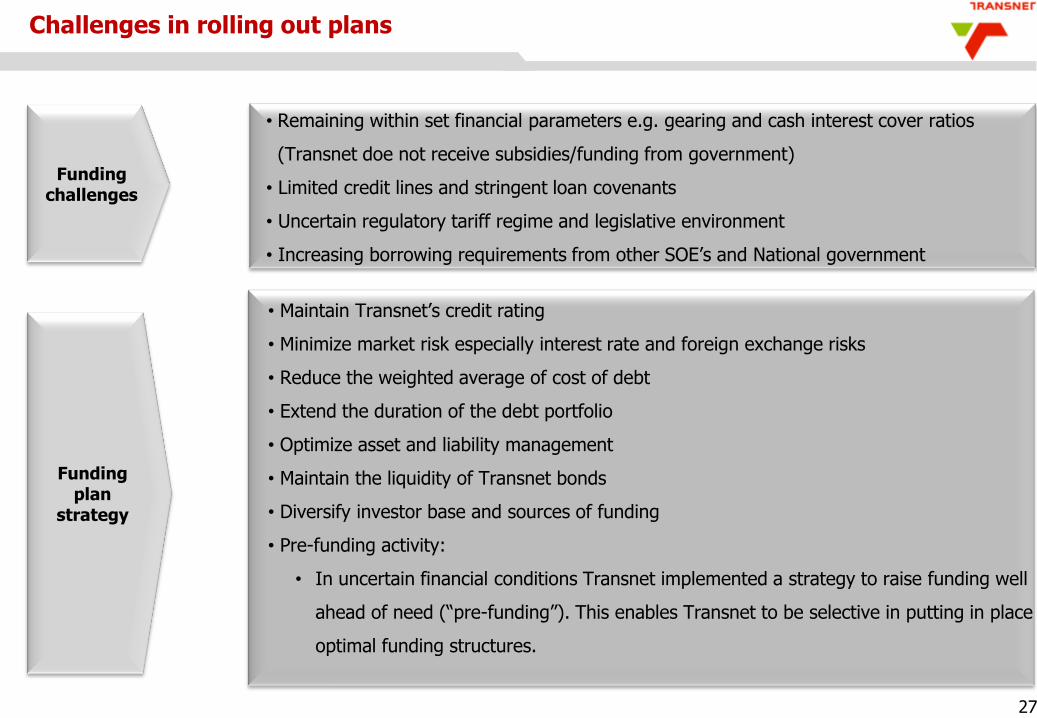
Challenges in rolling out plans
27
• Maintain Transnet‟s credit rating
• Minimize market risk especially interest rate and foreign exchange risks
• Reduce the weighted average of cost of debt
• Extend the duration of the debt portfolio
• Optimize asset and liability management
• Maintain the liquidity of Transnet bonds
• Diversify investor base and sources of funding
• Pre-funding activity:
• In uncertain financial conditions Transnet implemented a strategy to raise funding well
ahead of need (“pre-funding”). This enables Transnet to be selective in putting in place
optimal funding structures.
Funding challenges
Funding plan
strategy
• Remaining within set financial parameters e.g. gearing and cash interest cover ratios
(Transnet doe not receive subsidies/funding from government)
• Limited credit lines and stringent loan covenants
• Uncertain regulatory tariff regime and legislative environment
• Increasing borrowing requirements from other SOE‟s and National government


