Submitted to the Annals of Applied Statistics arXiv: math.PR/0000000 TREE-GUIDED GROUP LASSO FOR MULTI-RESPONSE REGRESSION WITH STRUCTURED SPARSITY, WITH AN APPLICATION TO EQTL MAPPING * By Seyoung Kim and Eric P. Xing † Carnegie Mellon University We consider the problem of estimating a sparse multi-response regression function, with an application to expression quantitative trait locus (eQTL) mapping, where the goal is to discover genetic variations that influence gene-expression levels. In particular, we in- vestigate a shrinkage technique capable of capturing a given hierar- chical structure over the responses, such as a hierarchical clustering tree with leaf nodes for responses and internal nodes for clusters of related responses at multiple granularity, and we seek to leverage this structure to recover covariates relevant to each hierarchically-defined cluster of responses. We propose tree-guided group lasso, or tree lasso, for estimating such structured sparsity under multi-response regres- sion by employing a novel penalty function constructed from the tree. We describe a systematic weighting scheme for the overlapping groups in the tree-penalty such that each regression coefficient is pe- nalized in a balanced manner despite the inhomogeneous multiplicity of group memberships of the regression coefficients due to overlaps among groups. For efficient optimization, we employ a smoothing proximal gradient method that was originally developed for a gen- eral class of structured-sparsity-inducing penalties. Using simulated and yeast datasets, we demonstrate that our method shows a su- perior performance in terms of both prediction errors and recovery of true sparsity patterns, compared to other methods for learning a multivariate-response regression. 1. Introduction. Recent advances in high-throughput technology for profiling gene expressions and assaying genetic variations at a genome-wide scale have provided researchers an unprecedented opportunity to comprehen- sively study the genetic causes of complex diseases such as asthma, diabetes, and cancer. Expression quantitative trait locus (eQTL) mapping considers gene expression measurements, also known as gene-expression traits, as in- termediate phenotypes, and aims to identify the genetic markers such as * Supported by NIH 1R01GM087694. † Supported by ONR N000140910758, NSF DBI-0640543, NSF CCF-0523757, and an Alfred P. Sloan Research Fellowship. Keywords and phrases: lasso, structured sparsity, high-dimensional regression, genetic association mapping, eQTL analysis 1
Transcript
Submitted to the Annals of Applied StatisticsarXiv: math.PR/0000000
TREE-GUIDED GROUP LASSO FOR MULTI-RESPONSEREGRESSION WITH STRUCTURED SPARSITY, WITH
AN APPLICATION TO EQTL MAPPING∗
By Seyoung Kim and Eric P. Xing†
Carnegie Mellon University
We consider the problem of estimating a sparse multi-responseregression function, with an application to expression quantitativetrait locus (eQTL) mapping, where the goal is to discover geneticvariations that influence gene-expression levels. In particular, we in-vestigate a shrinkage technique capable of capturing a given hierar-chical structure over the responses, such as a hierarchical clusteringtree with leaf nodes for responses and internal nodes for clusters ofrelated responses at multiple granularity, and we seek to leverage thisstructure to recover covariates relevant to each hierarchically-definedcluster of responses. We propose tree-guided group lasso, or tree lasso,for estimating such structured sparsity under multi-response regres-sion by employing a novel penalty function constructed from thetree. We describe a systematic weighting scheme for the overlappinggroups in the tree-penalty such that each regression coefficient is pe-nalized in a balanced manner despite the inhomogeneous multiplicityof group memberships of the regression coefficients due to overlapsamong groups. For efficient optimization, we employ a smoothingproximal gradient method that was originally developed for a gen-eral class of structured-sparsity-inducing penalties. Using simulatedand yeast datasets, we demonstrate that our method shows a su-perior performance in terms of both prediction errors and recoveryof true sparsity patterns, compared to other methods for learning amultivariate-response regression.
1. Introduction. Recent advances in high-throughput technology forprofiling gene expressions and assaying genetic variations at a genome-widescale have provided researchers an unprecedented opportunity to comprehen-sively study the genetic causes of complex diseases such as asthma, diabetes,and cancer. Expression quantitative trait locus (eQTL) mapping considersgene expression measurements, also known as gene-expression traits, as in-termediate phenotypes, and aims to identify the genetic markers such as
∗Supported by NIH 1R01GM087694.†Supported by ONR N000140910758, NSF DBI-0640543, NSF CCF-0523757, and an
Alfred P. Sloan Research Fellowship.Keywords and phrases: lasso, structured sparsity, high-dimensional regression, genetic
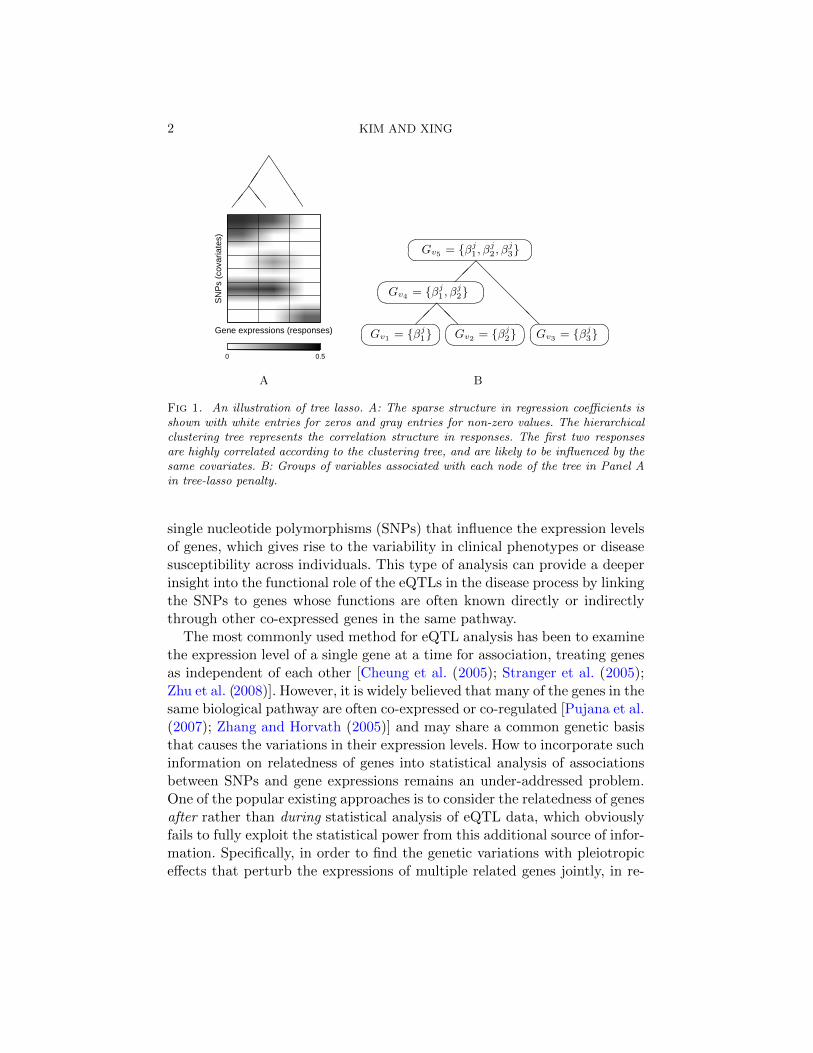
Fig 1. An illustration of tree lasso. A: The sparse structure in regression coefficients isshown with white entries for zeros and gray entries for non-zero values. The hierarchicalclustering tree represents the correlation structure in responses. The first two responsesare highly correlated according to the clustering tree, and are likely to be influenced by thesame covariates. B: Groups of variables associated with each node of the tree in Panel Ain tree-lasso penalty.
single nucleotide polymorphisms (SNPs) that influence the expression levelsof genes, which gives rise to the variability in clinical phenotypes or diseasesusceptibility across individuals. This type of analysis can provide a deeperinsight into the functional role of the eQTLs in the disease process by linkingthe SNPs to genes whose functions are often known directly or indirectlythrough other co-expressed genes in the same pathway.
The most commonly used method for eQTL analysis has been to examinethe expression level of a single gene at a time for association, treating genesas independent of each other [Cheung et al. (2005); Stranger et al. (2005);Zhu et al. (2008)]. However, it is widely believed that many of the genes in thesame biological pathway are often co-expressed or co-regulated [Pujana et al.(2007); Zhang and Horvath (2005)] and may share a common genetic basisthat causes the variations in their expression levels. How to incorporate suchinformation on relatedness of genes into statistical analysis of associationsbetween SNPs and gene expressions remains an under-addressed problem.One of the popular existing approaches is to consider the relatedness of genesafter rather than during statistical analysis of eQTL data, which obviouslyfails to fully exploit the statistical power from this additional source of infor-mation. Specifically, in order to find the genetic variations with pleiotropiceffects that perturb the expressions of multiple related genes jointly, in re-
TREE LASSO FOR EQTL MAPPING 3
cent eQTL studies, the expression traits for individual genes were analyzedseparately, and then, the results were examined for all genes in light of genemodules to see if any gene sets are enriched for association with a commonSNP [Zhu et al. (2008); Emilsson et al. (2008); Chen et al. (2008)]. This typeof analysis uses the information on gene modules only in the post-processingstep after a set of single-gene analyses, instead of directly incorporating thecorrelation pattern in gene expressions in the process of searching for SNPswith pleitropic effects.
Recently, a different approach for searching for SNPs with pleiotropiceffects has been proposed to leverage information on gene modules moredirectly [Segal et al. (2003); Lee et al. (2006)]. In this approach, the modulenetwork originally developed for discovering clusters of co-regulated genesfrom gene expression data was extended to include SNPs as potential regu-lators that can influence the activity of gene modules. The main weakness ofthis method is that it computed the averages of gene-expression levels overthose genes within each module and looked for SNPs that affect the averagegene expressions of the module. The operation of computing averages canlead to a significant loss of information on the detailed activity of individualgenes and negative correlations within a module.
In this article, we propose tree-guided group lasso, or tree lasso, thatdirectly combines statistical strength across multiple related genes in geneexpression data to identify SNPs with pleiotropic effects by leveraging anygiven knowledge of hierarchical clustering tree over genes.1 The hierarchicalclustering tree contains clusters of genes at multiple granularity, and geneswithin a cluster have correlated expression levels. The leaf nodes of the treecorrespond to individual genes, and each internal node represents a clus-ter of genes at the leaf nodes of the subtree rooted at the internal node inquestion. Furthermore, each internal node in the tree is associated with aweight that represents the height of the subtree, or how tightly the genesin the cluster for that internal node are correlated. As illustrated in Figure1A, the expression levels of genes in each cluster are likely to be influencedby a common set of SNPs, and this type of sharing of genetic effects amongcorrelated genes is stronger among tightly correlated genes in the cluster atthe lower-levels with a smaller height in the tree, than among loosely cor-
1Here we focus on making use of the given knowledge of related genes to enhance thepower of eQTL analysis, rather than discovering or evaluating how genes are related, whichare interesting problems in their own right, and are studied widely [Segal et al. (2003)].If the gene co-expression pattern is not available, one can simply run any off-the-shelfhierarchical agglomerative clustering algorithm on the gene-expression data to obtain onebefore applying our method. It is beyond the scope of this paper to discuss, compare, andfurther develop such algorithms for clustering genes or learning trees.
4 KIM AND XING
related genes in the cluster near the root of the tree with a greater height.This multi-level grouping structure of genes can be available either as priorknowledge from domain experts, or can be learned from the gene-expressiondata using various clustering algorithms such as the hierarchical agglomer-ative clustering algorithm [Golub et al. (1999)].
Our method is based on a multivariate regression method with a regu-larization function that is constructed from the hierarchical clustering tree.This regularizer induces a structured shrinkage effect that encourages mul-tiple correlated responses to share a similar set of relevant covariates, ratherthan having independent sets of relevant covariates. This is a biologicallyand statistically desirable bias not present in existing methods for identifyingeQTLs. For example, assuming that the SNPs are represented as covariates,gene expressions as responses, and the association strengths as regressioncoefficients in a regression model, a multivariate regression with an L1 regu-larization, called lasso, has been applied to identify a small number of SNPswith non-zero association strengths [Wu et al. (2009)]. Here, lasso treatsmultiple responses as independent of each other and selects relevant covari-ates for each response variable separately. Although the L1 penalty in lassocan be extended to the L1/L2 penalty, also known as group-lasso penalty, forunion support recovery, where all of the responses are constrained to havethe same relevant covariates [Obozinski, Wainwright, and Jordan (2008);Obozinski, Taskar, and Jordan (2009)], in this case, the rich and hetero-geneous relatedness among the responses as captured by a weighted treecannot be taken into account.
Our method extends the L1/L2 penalty to tree-lasso penalty by lettingthe hierarchically-defined groups overlap. Tree-lasso penalty achieves struc-tured sparsity, where the related responses (i.e., gene expressions) in thesame group share a common set of relevant covariates (i.e., SNPs), in a waythat is properly calibrated to the strength of their relatedness and consis-tent with their overlapping group organization. Although several schemeshave been previously proposed to use the group-lasso penalty with overlap-ping groups to take advantage of a more complex structural information onresponse variables, due to their ad hoc weighting scheme for different over-lapping groups in the regularization function, some regression coefficientswere penalized arbitrarily more heavily than others, leading to an incon-sistent estimate [Zhao, Rocha, and Yu (2009); Jacob, Obozinski, and Vert(2009); Jenatton, Audibert, and Bach (2009)]. In contrast, we propose asystematic weighting scheme for overlapping groups that applies a balancedpenalization to all of the regression coefficients. Since tree lasso is a specialcase of overlapping group lasso, where the weights and overlaps of groups
TREE LASSO FOR EQTL MAPPING 5
are determined according to the hierarchical clustering tree, we adopt forefficient optimization the smoothing proximal gradient (SPG) method [Chenet al. (2011)] that was developed for optimizing a convex loss function witha general class of structured-sparsity-inducing penalty functions includingoverlapping group lasso.
Compared to our previous work on graph-guided fused lasso that lever-ages a network structure over responses to achieve structured sparsity [Kimand Xing (2009)], tree lasso has a considerably lower computational time,and allows more than thousands of response variables to be analyzed si-multaneously as is necessary in a typical eQTL mapping. This is in partbecause the computation time in graph-guided fused lasso depends on thenumber of edges in the graph that can be as large as |V | × |V |, where |V |is the number of response variables, whereas in tree lasso, it is determinedby the number of nodes in the tree, which is bounded by twice the numberof response variables. Another potential advantage of tree lasso is that itrelaxes the constraint in the graph-guided fusion penalty that the regressioncoefficients should take the similar values for a covariate relavant to multi-ple correlated responses. Although introducing this bias through the fusionpenalty in graph-guided fused lasso offered the benefit of combining weakassociation signals and reducing false positives, it is expected that relaxingthis constraint could further increase the power. The L1/L2 penalty in ourtree regularization achieves a joint selection of covariates for multiple re-lated responses, while allowing different values for the regression coefficientscorresponding to the selected covariate and correlated response variables.
Although the hierarchical agglomerative clustering algorithm has beenwidely popular as a preprocessing step for regression or classification tasks[Golub et al. (1999); Srlie et al. (2001); Hastie et al. (2001)], our proposedmethod is the first to make use of the full results from the clustering algo-rithm given as tree structure and subtree-height information. Most of theprevious classification or regression methods that build on the hierarchicalclustering algorithm used summary statistics extracted from the hierarchicalclustering tree such as subsets of genes forming clusters or averages of geneexpressions within each cluster, rather than using the tree as it is [Golubet al. (1999); Hastie et al. (2001)]. In tree lasso, we use the full hierarchi-cal clustering tree as prior knowledge to construct a regularization function.Thus, tree lasso incorporates the full information present in both the rawdata and the hierarchical clustering tree to maximize the power for detectingweak association signals and reduce false positives. In our experiments, wedemonstrate that our proposed method can be successfully applied to selectSNPs affecting the expression levels of multiple genes, using both simulated
6 KIM AND XING
and yeast datasets.The remainder of the paper is organized as follows. In Section 2, we pro-
vide a brief discussion of previous work on sparse regression estimation.In Section 3, we introduce tree lasso and describe an efficient optimizationmethod based on SPG. We present experimental results on simulated andyeast eQTL datasets in Section 4, and conclude in Section 5.
2. Background on Multivariate Regression Approach for eQTLMapping. Let us assume that data are collected for J SNPs and K gene-expression traits over N individuals. Let X denote the N × J matrix ofSNP genotypes for covariates, and Y the N ×K matrix of gene-expressionmeasurements for responses. In eQTL mapping, each element of the X takesvalues from 0, 1, 2 according to the number of minor alleles at the givenlocus in each individual. Then, we assume a linear model for the functonalmapping from covariates to response variables:
Y = XB + E,(2.1)
where B is the J ×K matrix of regression coefficients and E is the N ×Kmatrix of noise terms distributed as mean 0 and a constant variance. Wecenter each column of X and Y such that the mean is zero, and considerthe model without an intercept. Throughout this paper, we use subscriptsand superscripts to denote rows and columns of a matrix, respectively (e.g.,βj and βk for the jth row and kth column of B).
When J is large and the number of relevant covariates is small, lassooffers an effective method for identifying the small number of non-zero ele-ments in B [Tibshirani (1996)]. Lasso obtains Blasso by solving the followingoptimization problem:
Blasso = arg minB
1
2||Y −XB||2F + λ||B||1,(2.2)
where || · ||F is the Frobenius norm, || · ||1 is the matrix L1 norm, and λis a tuning parameter that controls the amount of sparsity in the solution.Setting λ to a small value leads to a smaller number of non-zero regressioncoefficients.
The lasso estimation in Eq. (2.2) is equivalent to selecting relevant co-variates for each of the K responses separately, and does not provide anymechanism to enforce a joint selection of common relevant covariates formultiple related responses. In the literature of multi-task learning, an L1/L2
penalty, also known as group lasso penalty [Yuan and Lin (2006)], has been
TREE LASSO FOR EQTL MAPPING 7
adopted in multivariate-response regression to take advantage of the related-ness of the response variables and recover the union support – the pattern ofnon-zero regression coefficients shared across all of the responses [Obozinski,Wainwright, and Jordan (2008)]. This method is widely known as L1/L2-regularized multi-task regression in machine learning community, and itsestimate for regression coefficients is given as:
BL1/L2 = arg minB
1
2||Y −XB||2F + λ
∑j
‖βj‖2,(2.3)
where || · ||2 denotes an L2 norm. In L1/L2-regularized multi-task regression,an L2 norm is applied to the regression coefficients for all responses foreach covariate, βj , and these L2 norms for the J covariates are combinedthrough an L1 norm to encourage only a small number of covariates to takenon-zero regression coefficients. Since the L2 part of the penalty does nothave the property of encouraging sparsity, if the jth covariate is selected asrelevant, then all of the elements of βj would take non-zero values, althoughthe regression coefficient values for the covariate are still allowed to varyacross different responses. When applied to eQTL mapping, this method issignificantly limited since it is not realistic to assume that the expressionlevels of all of the genes are influenced by the same set of relevant SNPs. Asubset of co-expressed genes may be perturbed by a common set of SNPs,and genes in different pathway are less likely to be affected by the sameSNPs. Sparse group lasso [Friedman, Hastie, and Tibshirani ( 2010)] canbe adopted to relax this constraint by adding a lasso penalty to Eq. (2.3)so that individual regression coefficients within each L2 norm can be set tozeros. However, this method shares the same limitation as L1/L2-regularizedmulti-task regression that it cannot incorporate complex grouping structuresin the responses such as groups at multiple granularity as in the hierarchicalclustering tree.
3. Tree Lasso for Exploiting Hierarchical Clustering Tree ineQTL Mapping. We introduce tree lasso that considerably adds flexi-bility and power to these existing methods by taking advantage of the com-plex correlation structure given as a hierarchical clustering tree over theresponses. We present a highly efficient algorithm for estimating the param-eters in tree lasso that is based on the smoothing proximal gradient descentdeveloped for a general class of structured-sparsity-inducing norms.
3.1. Tree Lasso. In a microarray experiment, gene expression levels aremeasured for more than thousands of genes at a time, and many of the
8 KIM AND XING
genes show highly correlated expression levels across samples, implying theymay share a common regulator or participate in the same pathway. In ad-dition, in eQTL analysis, it is widely believed that genetic variations suchas SNPs perturb modules of related genes rather than acting on individualgenes. As these gene modules are often derived and visualized by runningthe hierarchical agglomerative clustering algorithm on gene expression data,a natural extension of sparse regression methods for eQTL mapping is toincorporate with them the output of the hierarchical clustering algorithm toidentify genetic variations that influence gene modules in the clustering tree.In this section, we build on the L1/L2-regularized regression and introducetree lasso that can directly leverage hierarchically-organized groups of genesto combine statistical strength across the expression levels of genes withineach group. Although our work is primarily motivated by eQTL mappingin genetics, tree lasso is generally applicable to any multivariate-responseregression problems, where the hierarchical group structure over the re-sponses is given as desirable sources of structural bias, such as in manycomputer vision [Yuan and Yan (2010)] and natural language processingapplications [Zhang (2010); Zhou, Jin, and Hoi (2010)], where dependen-cies among visual objects and among parts of speech are well known to bevaluable to enhance prediction performance.
Assume that the relationship among the K responses is represented astree T with a set of vertices V of size |V |. As illustrated in Figure 1A, eachof the K leaf nodes is associated with a response variable, and each of theinternal nodes represents a group of the responses located at the leaves of thesubtree rooted at the given internal node. Internal nodes near the bottomof the tree correspond to tight clusters of highly related responses, whereasthe internal nodes near the root represent groups with weak correlationsamong the responses in its subtree. This tree structure may be provided asprior knowledge by domain experts or external resources (e.g., gene ontologydatabases in our eQTL mapping problem), or can be learned from the datafor responses variables using methods such as the hierarchical agglomerativeclustering algorithm. We assume that each node v ∈ V of the tree is associ-ated with height hv of the subtree rooted at v, representing how tightly itsmembers are correlated. In addition, we assume that the heights hv’s of theinternal nodes are normalized so that the height of the root node is 1.
Given this tree T over the K responses, we generalize the L1/L2 regu-larization in Eq. (2.3) to a tree regularization by expanding the L2 part ofthe L1/L2 penalty into an overlapping group lasso penalty. The overlappinggroups in tree regularization are defined based on tree T as follows. Eachnode v ∈ V of tree T is associated with group Gv whose members are the
TREE LASSO FOR EQTL MAPPING 9
response variables at the leaf nodes of the subtree rooted at node v. Forexample, Figure 1B shows the groups of responses and the correspondingregression coefficients that are associated with each of the nodes of the treein Figure 1A. Given these overlapping groups, we define tree lasso as
BT = arg minB
1
2||Y −XB||2F + λ
∑j
∑v∈V
wv‖βGvj ‖2,(3.1)
where βGvj is a vector of regression coefficients βkj | k ∈ Gv. Since a treeassociated with K responses can have at most 2K nodes, the number of L2
terms that appear in the tree-lasso penalty is upper-bounded by |V | = 2Kfor each covariate.
Each group of regression coefficients βGvj in Eq. (3.1) is weighted with wvsuch that the group of responses near the leaf of the tree is more likely tohave common relevant covariates, while ensuring the amount of penalizationaggregated over all of the overlapping groups for each regression coefficientto be the same for all regression coefficients. We define wv’s in Eq. (3.1) interms of two quantities gv’s and sv’s, given as sv = hv and gv = 1 − hv,that are associated with each internal node v of height hv in tree T . Thesv represents the weight for selecting relevant covariates separately for theresponses associated with each child of node v, whereas the gv representsthe weight for selecting relevant covariates jointly for the responses for allof the children of node v. We first consider a simple case with two responses(K = 2) and a tree of three nodes that consists of two leaf nodes (v1 andv2) and one root node (v3), and then, generalize this to an arbitrary tree.When K = 2, the penalty term in Eq. (3.1) can be written as∑
j
∑v∈V
wv‖βjGv‖2 =∑j
[s3
(|βj1|+ |β
j2|)
+ g3
(√(βj1)2 + (βj2)2
)],(3.2)
where the group weights are set to wv1 = s3, wv2 = s3, and wv3 = g3. Eq.(3.2) has a similar form to the elastic-net penalty [Zou and Hastie (2005)]with the slight difference that the elastic net uses the square of L2 norm.The L1 norm and L2 norm in Eq. (3.2) are weighted by s3 and g3, andplay the role of setting β1j and β2j to non-zero values separately or jointly.A large value of gv indicates that the responses are highly related, and ajoint covariate selection is encouraged by heavily weighting the L2 part ofthe penalty. When s3 = 0, the penalty in Eq. (3.2) is equivalent to L1/L2-regularized multi-task regression in Eq. (2.3), where the responses share thesame set of relevant covariates, whereas setting g3 = 0 in Eq. (3.2) leads toa lasso penalty. In general, given a single-level tree with all of the responses
10 KIM AND XING
under a single parent node, the tree-lasso penalty corresponds to a linearcombination of L1 and L2 penalties as in Eq. (3.2).
Now, we generalize this process of obtaining wv’s in tree-lasso penaltyfor the special case of a single-level tree to an arbitrary tree. Starting fromthe root node and traversing down the tree recursively to the leaf nodes, ateach of the root and internal nodes, we apply the similar operation of linearcombination of L1 norm and L2 norm as in Eq. (3.2) as follows:∑
j
∑v∈V
wv‖βGvj ‖2 =∑j
Wj(vroot),(3.3)
where
Wj(v) =
sv ·
∑c∈Children(v)
|Wj(c)|+ gv · ‖βGvj ‖2, if v is an internal node,∑m∈Gv
|βmj |, if v is a leaf node.
Then, it can be shown that the following relationship holds between wv’sand (sv, gv)’s:
wv =
gv
∏m∈Ancestors(v)
sm, if v is an internal node,∏m∈Ancestors(v)
sm, if v is a leaf node.
The above weighting scheme extends the linear combination of L1 and L2
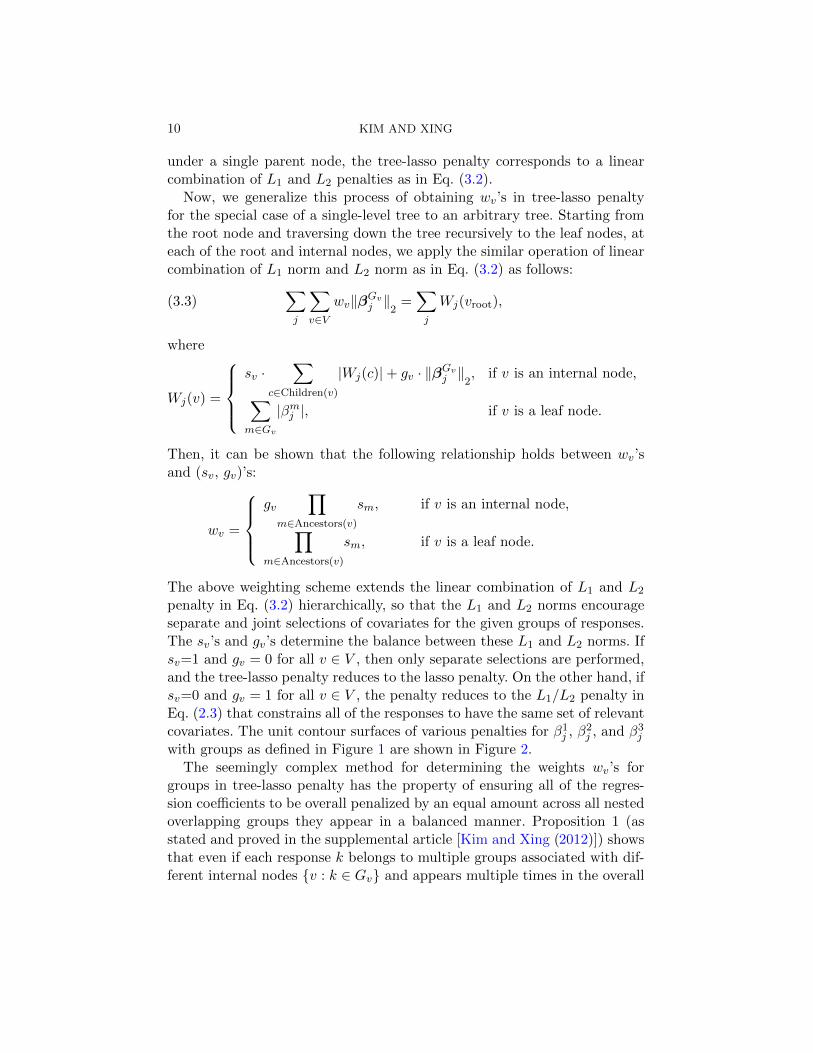
penalty in Eq. (3.2) hierarchically, so that the L1 and L2 norms encourageseparate and joint selections of covariates for the given groups of responses.The sv’s and gv’s determine the balance between these L1 and L2 norms. Ifsv=1 and gv = 0 for all v ∈ V , then only separate selections are performed,and the tree-lasso penalty reduces to the lasso penalty. On the other hand, ifsv=0 and gv = 1 for all v ∈ V , the penalty reduces to the L1/L2 penalty inEq. (2.3) that constrains all of the responses to have the same set of relevantcovariates. The unit contour surfaces of various penalties for β1j , β2j , and β3jwith groups as defined in Figure 1 are shown in Figure 2.
The seemingly complex method for determining the weights wv’s forgroups in tree-lasso penalty has the property of ensuring all of the regres-sion coefficients to be overall penalized by an equal amount across all nestedoverlapping groups they appear in a balanced manner. Proposition 1 (asstated and proved in the supplemental article [Kim and Xing (2012)]) showsthat even if each response k belongs to multiple groups associated with dif-ferent internal nodes v : k ∈ Gv and appears multiple times in the overall
TREE LASSO FOR EQTL MAPPING 11
A B C D E
Fig 2. Unit contour surfaces for β1j , β
2j , β
3j in various penalties, assuming the tree
structure over responses in Figure 1. A: Lasso, B: tree lasso with g1 = 0.5 and g2 = 0.5,C: g1 = 0.7 and g2 = 0.7, D: g1 = 0.2 and g2 = 0.7, and E: g1 = 0.7 and g2 = 0.2.
penalty in Eq. (3.3), the sum of weights over all of the groups that containthe given response is always one. Thus, the weighting scheme in Eq. (3.3)guarantees that all of the individual regression coefficients are overall pe-nalized equally. Although several variations of group lasso with overlappinggroups have been proposed previously, all of those methods weighted the L2
norms for overlapping groups with arbitrarily defined weights, resulting inunbalanced weights for different regression coefficients [Zhao, Rocha, and Yu(2009); Jenatton, Audibert, and Bach (2009)]. It was empirically shown thatthese arbitrary weighting schemes gave an inconsistent estimate [Jenatton,Audibert, and Bach (2009)].
Below, we provide an example of the process of constructing a tree-lassopenalty based on the simple tree over three responses in Figure 1A. For morecomplex trees over a large number of responses, the same procedure can beapplied, traversing the tree recursively from the root to the leaf nodes.
Example 1. Given the tree in Figure 1, for the jth covariate the penaltyof the tree lasso in Eq. (3.3) can be written as follows:
The tree-lasso penalty that we introduced above can be easily extendedto other related types of structures such as trees with different branchingfactors and a forest that consists of multiple trees. In addition, our proposedregularization can be applied to a pruned tree whose leaf nodes containgroups of variables instead of individual variables.
12 KIM AND XING
3.2. Parameter Estimation. Although the tree-lasso optimization prob-lem in Eq. (3.1) is convex, the main challenges for solving Eq. (3.1) arise fromthe non-separable L2 terms over βGvg ’s in the non-smooth penalty. While thecoordinate descent algorithm has been successfully applied to non-smoothpenalties such as lasso and group lasso with non-overlapping groups [Fried-man et al. (2007)], it cannot be applied to tree lasso because the overlappinggroups with non-separable terms in the penalty prevent us from obtaininga closed-form update equation for iterative optimization. While the opti-mization problem for tree lasso can be formulated as a second-order coneprogram and solved with the interior point method [Boyd and Vandenberghe(2004)], this approach does not scale to high dimensional problems such aseQTL mapping that involves a large number of SNPs and gene-expressionmeasurements. Recently, a smoothing proximal gradient (SPG) method wasdeveloped for an efficient optimization of a convex loss function with a gen-eral class of structured-sparsity-inducing penalty functions that share thesame challenges of non-smoothness and non-separability [Chen et al. (2011)].The SPG can handle a wide variety of penalties such as overlapping grouplasso and fused lasso, and as tree lasso is a special case of overlapping grouplasso, we adopt this method in our paper. As we detail below in this section,SPG first decouples the non-separable terms in the penalty by reformulat-ing it with a dual norm, and introduces a smooth approximation of thenon-smooth penalty. Then, SPG adopts fast iterative shrinkage threshold-ing algorithm (FISTA) [Beck and Teboulle (2009)], an accelerated gradientdescent method, to optimize the objective function with this smooth ap-proximation of the penalty.
3.2.1. Reformulation of the Penalty Function. We re-write Eq. (3.1) bysplitting the tree-lasso penalty into two parts corresponding to two setsof nodes in tree T , Vint = v||Gv| > 1 for all of the internal nodes andVleaf = v||Gv| = 1 for all of the leaf nodes, as follows:
BT = argmin1
2||Y −XB||2F + λ
J∑j=1
∑v∈Vint
wv‖βGvj ‖2(3.4)
+λJ∑j=1
∑v∈Vleaf
wv‖βGvj ‖2.
We notice that in the above equation, the first penalty term for Vint containsoverlapping groups, whereas the second penalty term for Vleaf is equivalentto weighted lasso penalty λ
∑Jj=1
∑Kk=1wv(k)|βkj |, where wv(k) represents the
weight for the leaf node associated with the kth response.
TREE LASSO FOR EQTL MAPPING 13
Since the penalty term associated with Vint contains overlapping groupsand therefore, is non-separable, we re-write this term by introducing a vectorof auxiliary variables αGv
j for each covariate j and group Gv and reformulat-
ing it with a dual norm representation ‖βGvj ‖2 = max‖αGvj ‖2≤1(αGv
j )TβGvjto obtain:
Ω(B) ≡ λJ∑j=1
∑v∈Vint
wv‖βGvj ‖2
= λJ∑j=1
∑v∈V ′
wv max‖αGvj ‖2≤1
(αGvj )TβGvj = max
A∈Q〈CBT ,A〉,(3.5)
where 〈U,V〉 ≡ Tr(UTV) denotes a matrix inner product, and A is a(∑
v∈Vint |Gv|)× J matrix given as
A =
αG11 . . . αG1
J...
. . ....
αG|Vint|1 . . . α
G|Vint|J
,
with domain Q ≡ A | ‖αGvj ‖2 ≤ 1, ∀ j ∈ 1, . . . , J , v ∈ Vint. In addition,
C in Eq. (3.5) is a (∑
v∈Vint |Gv|)×K matrix whose elements are defined as
Ck(v,i) =
λwv, if k ∈ Gv,0, otherwise,
with rows indexed by (v, i) such that v ∈ Vint and i ∈ Gv, and columnsindexed by k ∈ 1, . . . ,K. We note that the non-separable terms over βGvj ’sin the tree-lasso penalty are decoupled in the dual-norm representation inEq. (3.5).
3.2.2. Smooth Approximation to the Non-smooth Penalty. The re-formulationin Eq. (3.5) is still non-smooth in B, which makes it non-trivial to optimize.To overcome this challenge, SPG introduces a smooth approximation of Eq.(3.5) as follows:
(3.6) fµ(B) = maxA∈Q〈CBT ,A〉 − µd(A),
where d(A) ≡ 12‖A‖
2F is a smoothing function with the maximum value
D ≡ maxA∈Q d(A) = J |Vint|2 , and µ is the parameter that determines the
amount of smoothness. We notice that when µ = 0, we recover the original
14 KIM AND XING
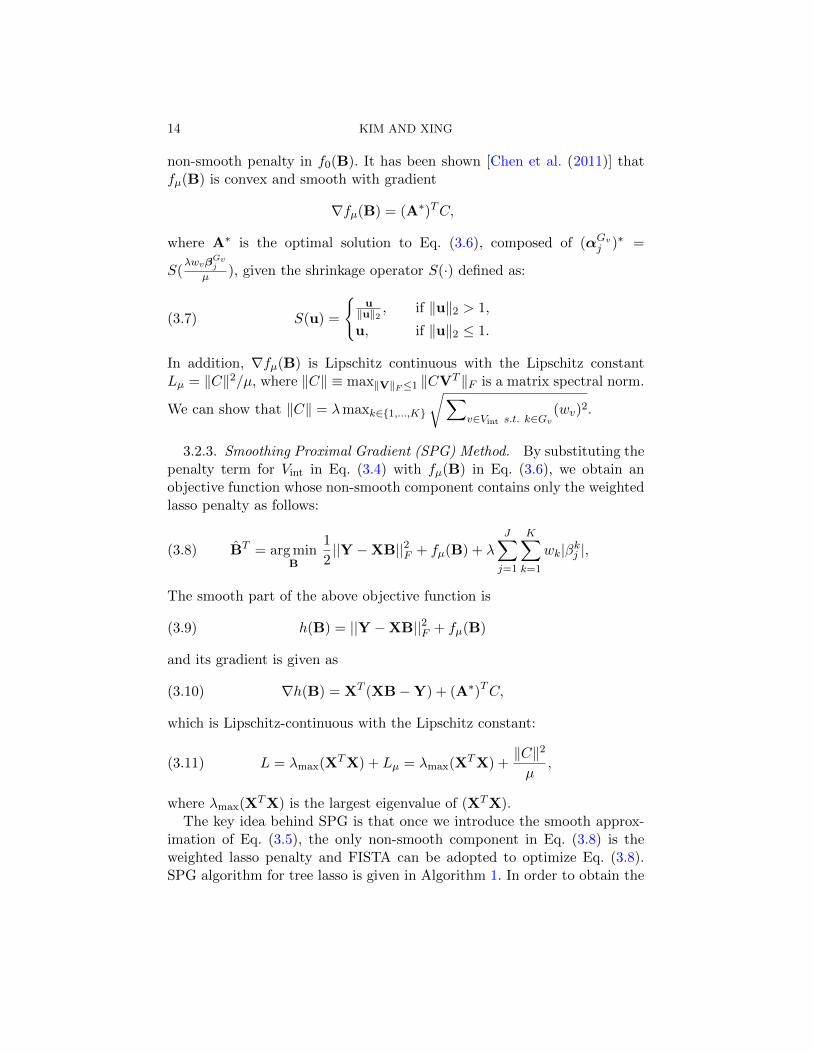
non-smooth penalty in f0(B). It has been shown [Chen et al. (2011)] thatfµ(B) is convex and smooth with gradient
∇fµ(B) = (A∗)TC,
where A∗ is the optimal solution to Eq. (3.6), composed of (αGvj )∗ =
S(λwvβ
Gvj
µ ), given the shrinkage operator S(·) defined as:
S(u) =
u‖u‖2 , if ‖u‖2 > 1,
u, if ‖u‖2 ≤ 1.(3.7)
In addition, ∇fµ(B) is Lipschitz continuous with the Lipschitz constantLµ = ‖C‖2/µ, where ‖C‖ ≡ max‖V‖F≤1 ‖CV
T ‖F is a matrix spectral norm.
We can show that ‖C‖ = λmaxk∈1,...,K
√∑v∈Vint s.t. k∈Gv
(wv)2.
3.2.3. Smoothing Proximal Gradient (SPG) Method. By substituting thepenalty term for Vint in Eq. (3.4) with fµ(B) in Eq. (3.6), we obtain anobjective function whose non-smooth component contains only the weightedlasso penalty as follows:
BT = arg minB
1
2||Y −XB||2F + fµ(B) + λ
J∑j=1
K∑k=1
wk|βkj |,(3.8)
The smooth part of the above objective function is
h(B) = ||Y −XB||2F + fµ(B)(3.9)
and its gradient is given as
∇h(B) = XT (XB−Y) + (A∗)TC,(3.10)
which is Lipschitz-continuous with the Lipschitz constant:
(3.11) L = λmax(XTX) + Lµ = λmax(XTX) +‖C‖2
µ,
where λmax(XTX) is the largest eigenvalue of (XTX).The key idea behind SPG is that once we introduce the smooth approx-
imation of Eq. (3.5), the only non-smooth component in Eq. (3.8) is theweighted lasso penalty and FISTA can be adopted to optimize Eq. (3.8).SPG algorithm for tree lasso is given in Algorithm 1. In order to obtain the
TREE LASSO FOR EQTL MAPPING 15
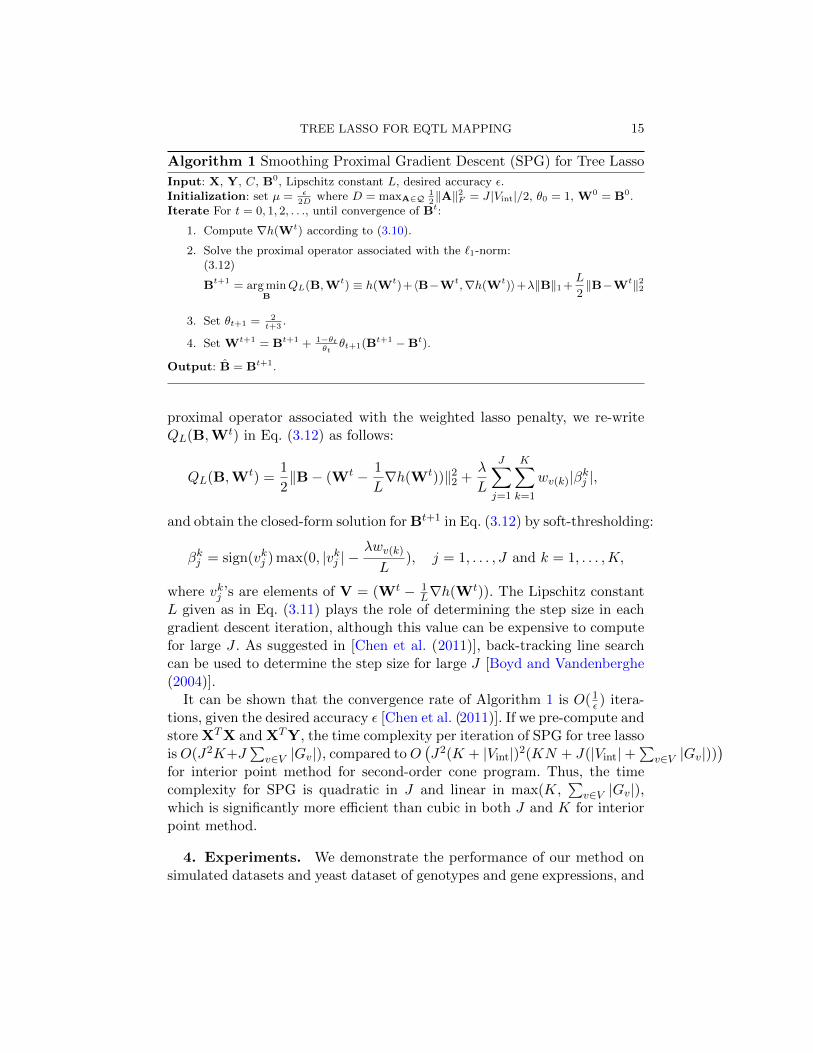
Algorithm 1 Smoothing Proximal Gradient Descent (SPG) for Tree Lasso
Input: X, Y, C, B0, Lipschitz constant L, desired accuracy ε.Initialization: set µ = ε
2Dwhere D = maxA∈Q
12‖A‖2F = J |Vint|/2, θ0 = 1, W0 = B0.
Iterate For t = 0, 1, 2, . . ., until convergence of Bt:
1. Compute ∇h(Wt) according to (3.10).
2. Solve the proximal operator associated with the `1-norm:(3.12)
Bt+1 = arg minB
QL(B,Wt) ≡ h(Wt)+〈B−Wt,∇h(Wt)〉+λ‖B‖1+L
2‖B−Wt‖22
3. Set θt+1 = 2t+3
.
4. Set Wt+1 = Bt+1 + 1−θtθt
θt+1(Bt+1 −Bt).
Output: B = Bt+1.
proximal operator associated with the weighted lasso penalty, we re-writeQL(B,Wt) in Eq. (3.12) as follows:
QL(B,Wt) =1
2‖B− (Wt − 1
L∇h(Wt))‖22 +
λ
L
J∑j=1
K∑k=1
wv(k)|βkj |,
and obtain the closed-form solution for Bt+1 in Eq. (3.12) by soft-thresholding:
βkj = sign(vkj ) max(0, |vkj | −λwv(k)
L), j = 1, . . . , J and k = 1, . . . ,K,
where vkj ’s are elements of V = (Wt − 1L∇h(Wt)). The Lipschitz constant
L given as in Eq. (3.11) plays the role of determining the step size in eachgradient descent iteration, although this value can be expensive to computefor large J . As suggested in [Chen et al. (2011)], back-tracking line searchcan be used to determine the step size for large J [Boyd and Vandenberghe(2004)].
It can be shown that the convergence rate of Algorithm 1 is O(1ε ) itera-tions, given the desired accuracy ε [Chen et al. (2011)]. If we pre-compute andstore XTX and XTY, the time complexity per iteration of SPG for tree lassoisO(J2K+J
∑v∈V |Gv|), compared toO
(J2(K + |Vint|)2(KN + J(|Vint|+
∑v∈V |Gv|))
)for interior point method for second-order cone program. Thus, the timecomplexity for SPG is quadratic in J and linear in max(K,
∑v∈V |Gv|),
which is significantly more efficient than cubic in both J and K for interiorpoint method.
4. Experiments. We demonstrate the performance of our method onsimulated datasets and yeast dataset of genotypes and gene expressions, and
16 KIM AND XING
compare the results with those from lasso and the L1/L2-regularized multi-task regression that do not assume any structure over responses. In all of ourexperiments, we determine the regularization parameter λ by fitting modelson a training set for a range of values for λ, computing the prediction errorof each model on a validation set, and then selecting the value of regular-ization parameter that gives the lowest prediction error. We evaluate thesemethods based on two criteria, sensitivity/specificity in detecting true rele-vant covariates and prediction errors on test datasets. We note that the 1−(specificity) and sensitivity are equivalent to type I error rate and 1− (typeII error rate), respectively. Test errors are obtained as mean squared differ-ences between the predicted and observed response measurements based ontest datasets that are independent of training and validation datasets.
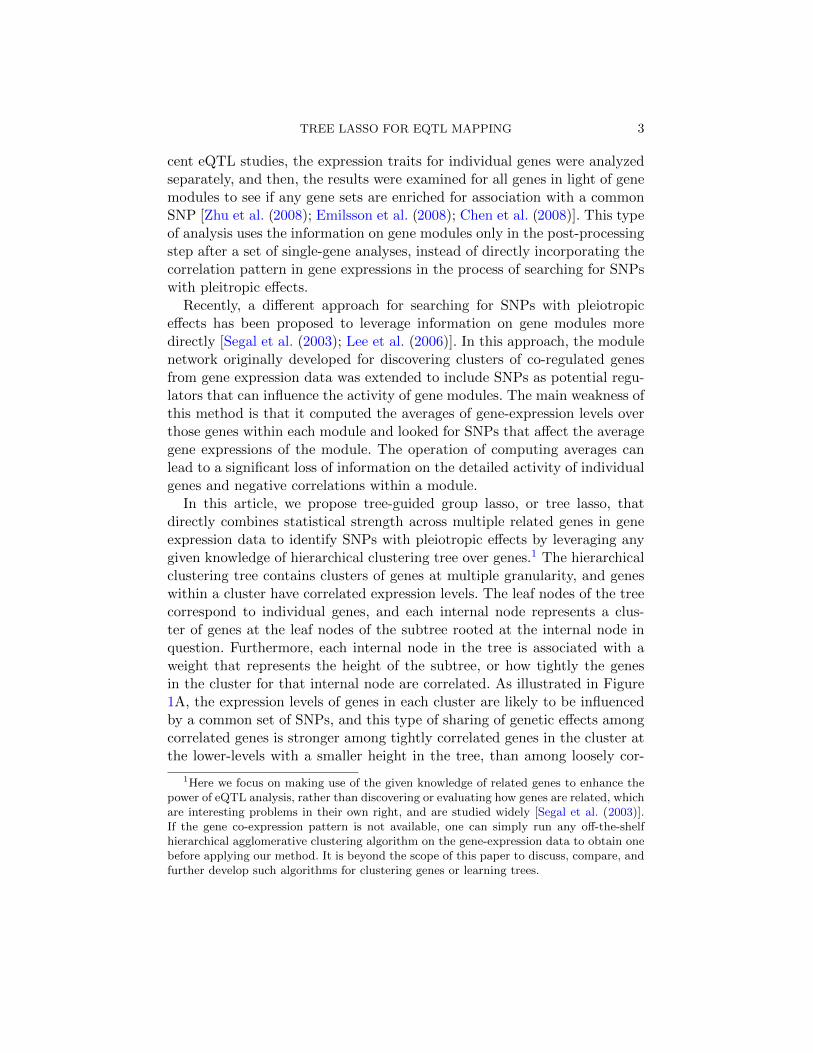
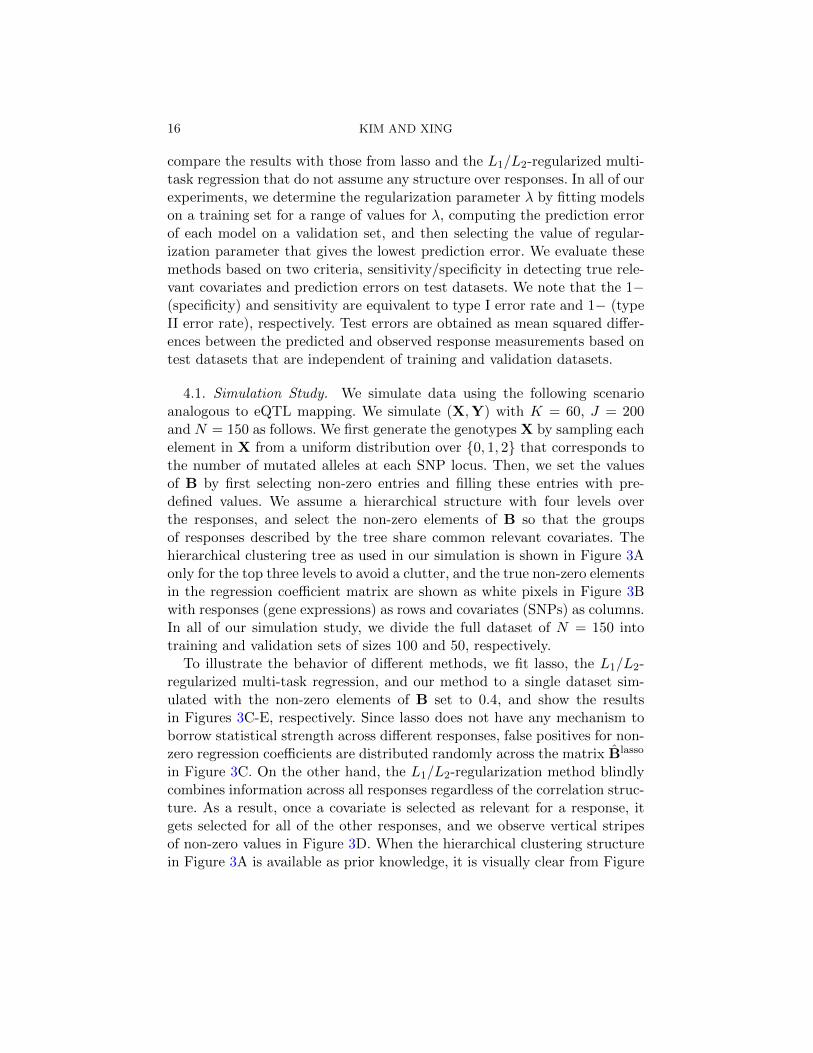
4.1. Simulation Study. We simulate data using the following scenarioanalogous to eQTL mapping. We simulate (X,Y) with K = 60, J = 200and N = 150 as follows. We first generate the genotypes X by sampling eachelement in X from a uniform distribution over 0, 1, 2 that corresponds tothe number of mutated alleles at each SNP locus. Then, we set the valuesof B by first selecting non-zero entries and filling these entries with pre-defined values. We assume a hierarchical structure with four levels overthe responses, and select the non-zero elements of B so that the groupsof responses described by the tree share common relevant covariates. Thehierarchical clustering tree as used in our simulation is shown in Figure 3Aonly for the top three levels to avoid a clutter, and the true non-zero elementsin the regression coefficient matrix are shown as white pixels in Figure 3Bwith responses (gene expressions) as rows and covariates (SNPs) as columns.In all of our simulation study, we divide the full dataset of N = 150 intotraining and validation sets of sizes 100 and 50, respectively.
To illustrate the behavior of different methods, we fit lasso, the L1/L2-regularized multi-task regression, and our method to a single dataset sim-ulated with the non-zero elements of B set to 0.4, and show the resultsin Figures 3C-E, respectively. Since lasso does not have any mechanism toborrow statistical strength across different responses, false positives for non-zero regression coefficients are distributed randomly across the matrix Blasso
in Figure 3C. On the other hand, the L1/L2-regularization method blindlycombines information across all responses regardless of the correlation struc-ture. As a result, once a covariate is selected as relevant for a response, itgets selected for all of the other responses, and we observe vertical stripesof non-zero values in Figure 3D. When the hierarchical clustering structurein Figure 3A is available as prior knowledge, it is visually clear from Figure
TREE LASSO FOR EQTL MAPPING 17
@@@
XXX
XXX
XXX
(((hhh(((hhh(((hhh(((hhh(((hhh(((hhh
A B C
D E
Fig 3. An example of regression coefficients estimated from a simulated dataset. A: Hi-erarchical clustering tree of four levels over responses. Only the top three levels are shownto avoid clutter. B: True regression coefficients. Estimated parameters are shown for C:lasso, D: L1/L2-regularized multli-task regression, and E: tree lasso. The rows representresponses and the columns covariates.
0 0.5 10
0.5
1
1−Specificity
Sensitiv
ity
LassoL
1L
2
T
Null Lasso T T0.9 T0.717
19
21
23
25
27
Te
st
err
or
L1/L
2
A B
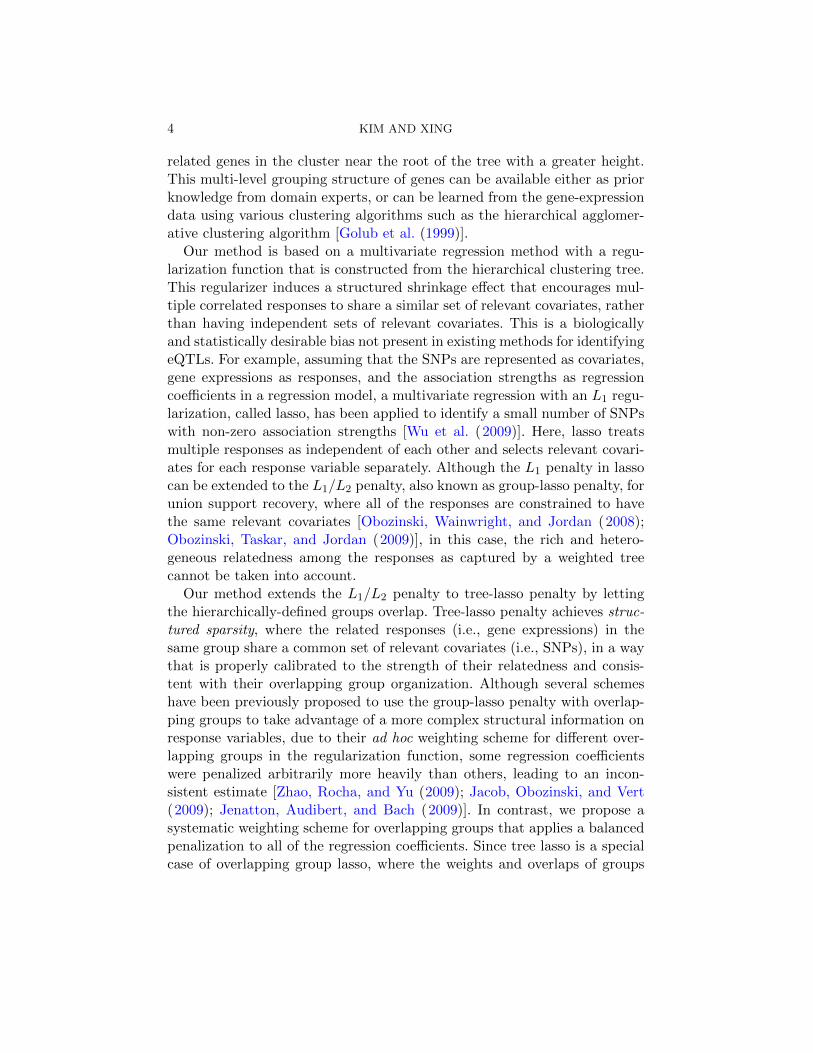
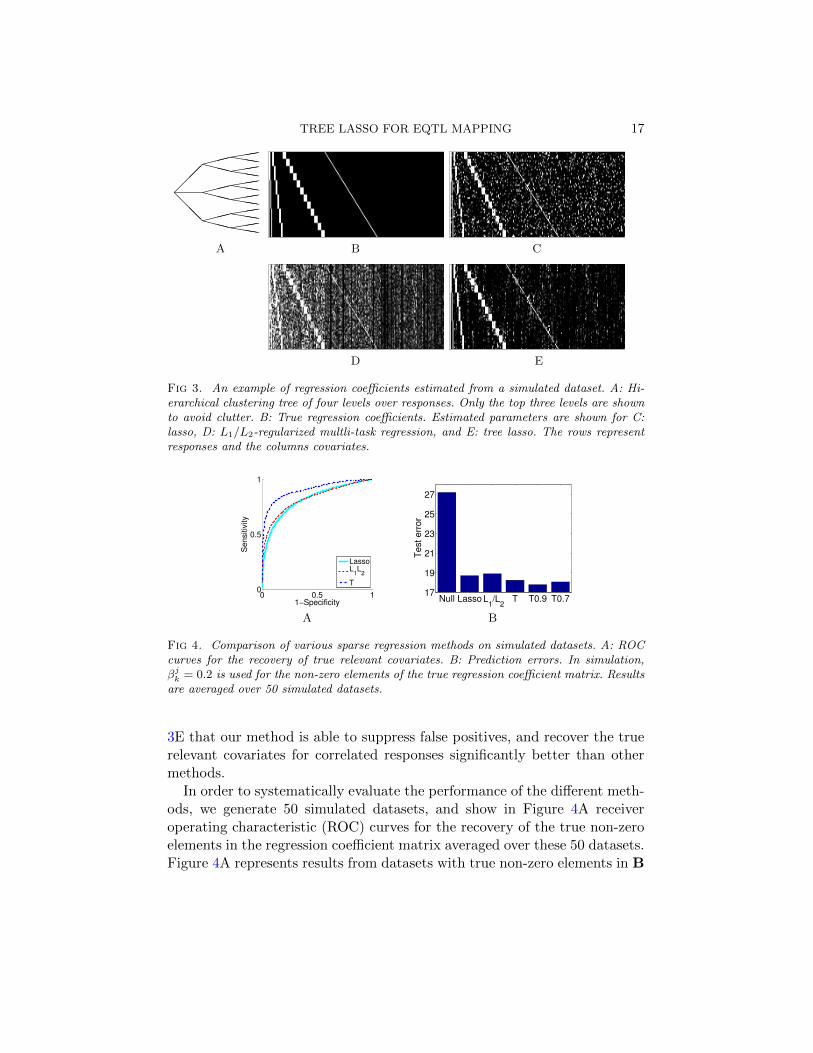
Fig 4. Comparison of various sparse regression methods on simulated datasets. A: ROCcurves for the recovery of true relevant covariates. B: Prediction errors. In simulation,βjk = 0.2 is used for the non-zero elements of the true regression coefficient matrix. Resultsare averaged over 50 simulated datasets.
3E that our method is able to suppress false positives, and recover the truerelevant covariates for correlated responses significantly better than othermethods.
In order to systematically evaluate the performance of the different meth-ods, we generate 50 simulated datasets, and show in Figure 4A receiveroperating characteristic (ROC) curves for the recovery of the true non-zeroelements in the regression coefficient matrix averaged over these 50 datasets.Figure 4A represents results from datasets with true non-zero elements in B
18 KIM AND XING
set to 0.2, while additional results for true non-zero elements in B set to 0.4and 0.6 are available in Online Appendix Figures 1A and 1B. Our methodclearly outperforms lasso and the L1/L2-regularized multi-task regression.Especially when the signal-to-noise ratio is low in Figure 4A, the advantageof incorporating the prior knowledge of the tree as a correlation structureover responses is significant.
We compare the performance of the different methods in terms of predic-tion errors, using additional 50 samples as test data. The prediction errorsaveraged over 50 simulated datasets are shown in Figure 4B for datasetsgenerated from 0.2 for true non-zero elements of regression coefficients. Ad-ditional results for datasets generated from 0.4 and 0.6 for true non-zeroelements of regression coefficients are shown in Online Appendix Figures2A and 2B, respectively. In addition to the results from sparse regressionmethods, we include the prediction errors from the null model that has onlyan intercept term. We find that our method shown as ‘T’ in Figure 4B haslower prediction errors than all of the other methods. In tree lasso, in addi-tion to directly using the true tree structure in Figure 3A, we also considerthe scenario in which the true tree structure is not known a priori. In thiscase, we learn a tree by running a hierarchical agglomerative clustering algo-rithm on the K ×K correlation matrix of the response measurements, anduse this tree along with the weights hv’s associated with each internal nodein our method. Since the tree obtained in this manner represents a noisyrealization of the true underlying tree structure, we discard the nodes forweak correlation near the root of the tree by thresholding the normalizedhv’s at ρ = 0.9 and 0.7, and show the prediction errors obtained from thesethresholded trees as ‘T0.9’ and ‘T0.7’ in Figure 4B. Even when the true treestructure is not available, our method is able to benefit from taking intoaccount the correlation structure among responses, and gives lower predic-tion errors. We performed the same experiment while varying the thresholdρ in the range of [0.6, 1.0], and obtained the similar prediction errors acrossdifferent values of ρ (results not shown). This shows that the meaningfulclustering information that tree lasso takes advantage of lies mostly in thetight clusters at the lower levels of a tree rather than the clusters of looselyrelated variables near the root of the tree.
4.2. Analysis of Yeast Data. We analyze yeast eQTL dataset of the geno-type and gene-expression data for 114 yeast strains [Zhu et al. (2008)] usingvarious sparse regression methods. We focus on the chromosome 3 with 21SNPs and expression levels of 3684 genes, after removing those genes whoseexpression levels are missing in more than 5% of the samples. Although it
TREE LASSO FOR EQTL MAPPING 19
A B C D E
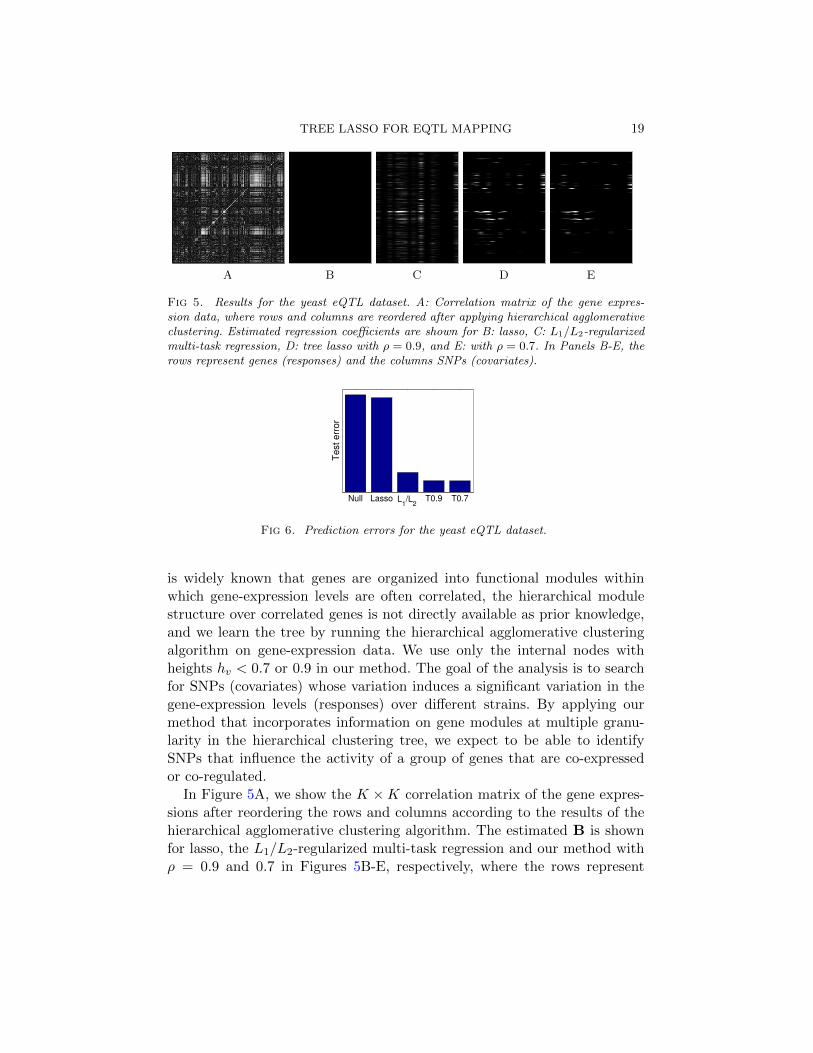
Fig 5. Results for the yeast eQTL dataset. A: Correlation matrix of the gene expres-sion data, where rows and columns are reordered after applying hierarchical agglomerativeclustering. Estimated regression coefficients are shown for B: lasso, C: L1/L2-regularizedmulti-task regression, D: tree lasso with ρ = 0.9, and E: with ρ = 0.7. In Panels B-E, therows represent genes (responses) and the columns SNPs (covariates).
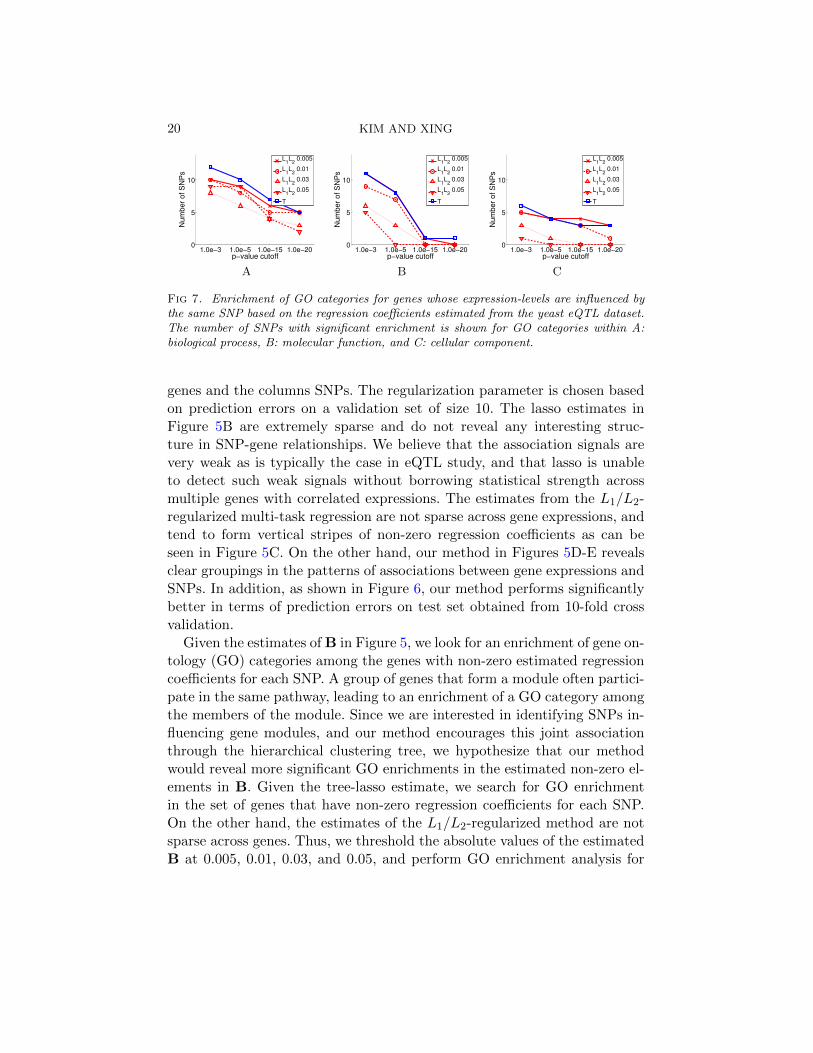
Null Lasso T0.9 T0.7
Te
st
err
or
L1/L
2
Fig 6. Prediction errors for the yeast eQTL dataset.
is widely known that genes are organized into functional modules withinwhich gene-expression levels are often correlated, the hierarchical modulestructure over correlated genes is not directly available as prior knowledge,and we learn the tree by running the hierarchical agglomerative clusteringalgorithm on gene-expression data. We use only the internal nodes withheights hv < 0.7 or 0.9 in our method. The goal of the analysis is to searchfor SNPs (covariates) whose variation induces a significant variation in thegene-expression levels (responses) over different strains. By applying ourmethod that incorporates information on gene modules at multiple granu-larity in the hierarchical clustering tree, we expect to be able to identifySNPs that influence the activity of a group of genes that are co-expressedor co-regulated.
In Figure 5A, we show the K ×K correlation matrix of the gene expres-sions after reordering the rows and columns according to the results of thehierarchical agglomerative clustering algorithm. The estimated B is shownfor lasso, the L1/L2-regularized multi-task regression and our method withρ = 0.9 and 0.7 in Figures 5B-E, respectively, where the rows represent
20 KIM AND XING
1.0e−3 1.0e−5 1.0e−15 1.0e−200
5
10
p−value cutoff
Num
ber
of S
NP
s
L1L
2 0.005
L1L
2 0.01
L1L
2 0.03
L1L
2 0.05
T
1.0e−3 1.0e−5 1.0e−15 1.0e−200
5
10
p−value cutoff
Num
ber
of S
NP
s
L1L
2 0.005
L1L
2 0.01
L1L
2 0.03
L1L
2 0.05
T
1.0e−3 1.0e−5 1.0e−15 1.0e−200
5
10
p−value cutoff
Num
ber
of S
NP
s
L1L
2 0.005
L1L
2 0.01
L1L
2 0.03
L1L
2 0.05
T
A B C
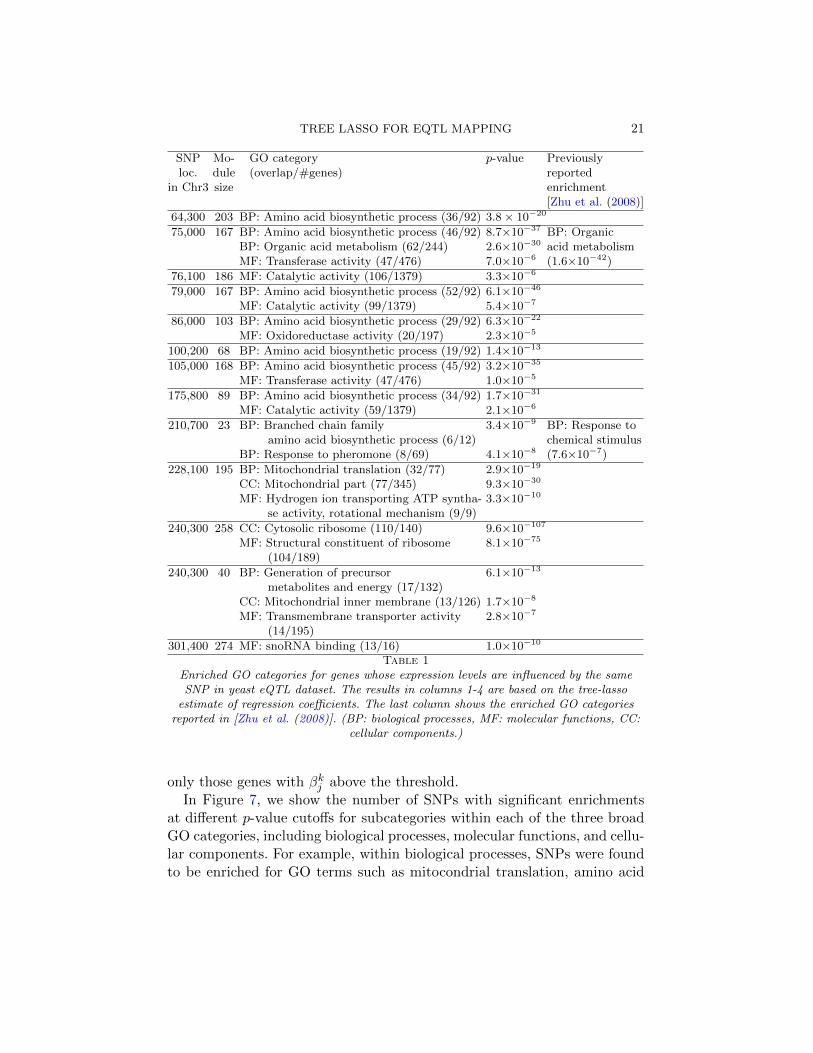
Fig 7. Enrichment of GO categories for genes whose expression-levels are influenced bythe same SNP based on the regression coefficients estimated from the yeast eQTL dataset.The number of SNPs with significant enrichment is shown for GO categories within A:biological process, B: molecular function, and C: cellular component.
genes and the columns SNPs. The regularization parameter is chosen basedon prediction errors on a validation set of size 10. The lasso estimates inFigure 5B are extremely sparse and do not reveal any interesting struc-ture in SNP-gene relationships. We believe that the association signals arevery weak as is typically the case in eQTL study, and that lasso is unableto detect such weak signals without borrowing statistical strength acrossmultiple genes with correlated expressions. The estimates from the L1/L2-regularized multi-task regression are not sparse across gene expressions, andtend to form vertical stripes of non-zero regression coefficients as can beseen in Figure 5C. On the other hand, our method in Figures 5D-E revealsclear groupings in the patterns of associations between gene expressions andSNPs. In addition, as shown in Figure 6, our method performs significantlybetter in terms of prediction errors on test set obtained from 10-fold crossvalidation.
Given the estimates of B in Figure 5, we look for an enrichment of gene on-tology (GO) categories among the genes with non-zero estimated regressioncoefficients for each SNP. A group of genes that form a module often partici-pate in the same pathway, leading to an enrichment of a GO category amongthe members of the module. Since we are interested in identifying SNPs in-fluencing gene modules, and our method encourages this joint associationthrough the hierarchical clustering tree, we hypothesize that our methodwould reveal more significant GO enrichments in the estimated non-zero el-ements in B. Given the tree-lasso estimate, we search for GO enrichmentin the set of genes that have non-zero regression coefficients for each SNP.On the other hand, the estimates of the L1/L2-regularized method are notsparse across genes. Thus, we threshold the absolute values of the estimatedB at 0.005, 0.01, 0.03, and 0.05, and perform GO enrichment analysis for
TREE LASSO FOR EQTL MAPPING 21
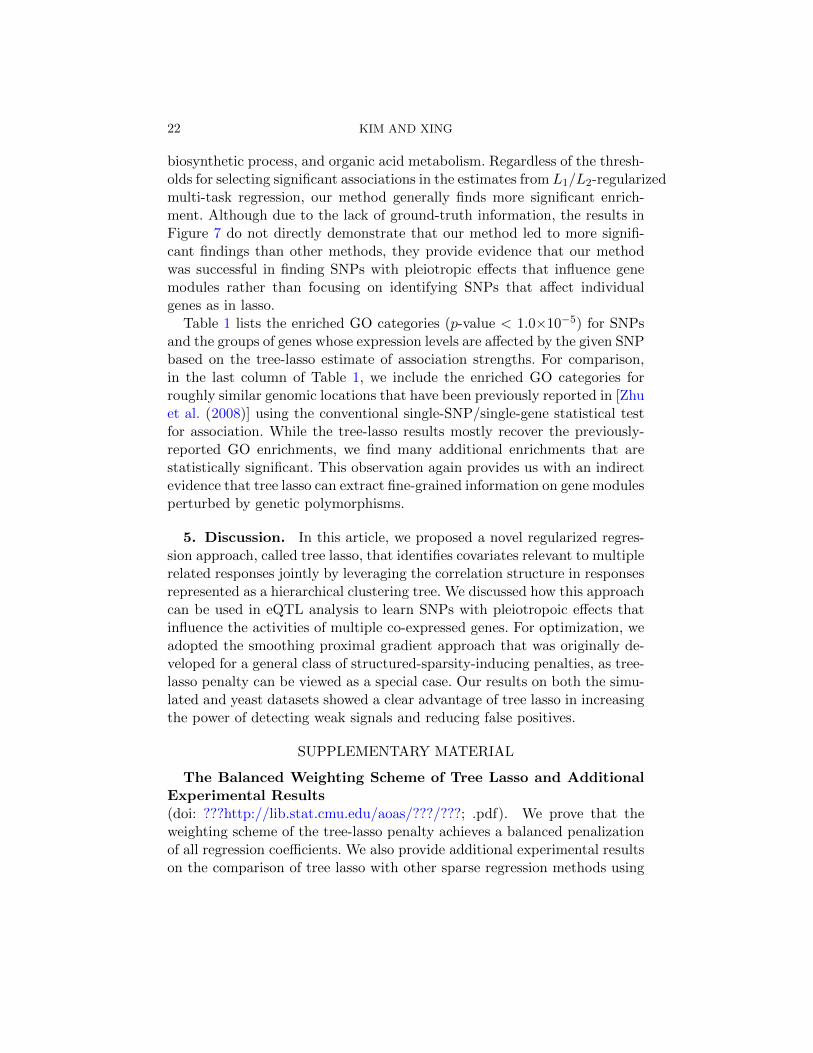
SNP Mo- GO category p-value Previouslyloc. dule (overlap/#genes) reported
in Chr3 size enrichment[Zhu et al. (2008)]
64,300 203 BP: Amino acid biosynthetic process (36/92) 3.8× 10⁻²⁰
metabolites and energy (17/132)CC: Mitochondrial inner membrane (13/126) 1.7×10⁻⁸
MF: Transmembrane transporter activity 2.8×10⁻⁷
(14/195)
301,400 274 MF: snoRNA binding (13/16) 1.0×10⁻¹⁰
Table 1Enriched GO categories for genes whose expression levels are influenced by the sameSNP in yeast eQTL dataset. The results in columns 1-4 are based on the tree-lasso
estimate of regression coefficients. The last column shows the enriched GO categoriesreported in [Zhu et al. (2008)]. (BP: biological processes, MF: molecular functions, CC:
cellular components.)
only those genes with βkj above the threshold.In Figure 7, we show the number of SNPs with significant enrichments
at different p-value cutoffs for subcategories within each of the three broadGO categories, including biological processes, molecular functions, and cellu-lar components. For example, within biological processes, SNPs were foundto be enriched for GO terms such as mitocondrial translation, amino acid
22 KIM AND XING
biosynthetic process, and organic acid metabolism. Regardless of the thresh-olds for selecting significant associations in the estimates from L1/L2-regularizedmulti-task regression, our method generally finds more significant enrich-ment. Although due to the lack of ground-truth information, the results inFigure 7 do not directly demonstrate that our method led to more signifi-cant findings than other methods, they provide evidence that our methodwas successful in finding SNPs with pleiotropic effects that influence genemodules rather than focusing on identifying SNPs that affect individualgenes as in lasso.
Table 1 lists the enriched GO categories (p-value < 1.0×10⁻⁵) for SNPsand the groups of genes whose expression levels are affected by the given SNPbased on the tree-lasso estimate of association strengths. For comparison,in the last column of Table 1, we include the enriched GO categories forroughly similar genomic locations that have been previously reported in [Zhuet al. (2008)] using the conventional single-SNP/single-gene statistical testfor association. While the tree-lasso results mostly recover the previously-reported GO enrichments, we find many additional enrichments that arestatistically significant. This observation again provides us with an indirectevidence that tree lasso can extract fine-grained information on gene modulesperturbed by genetic polymorphisms.
5. Discussion. In this article, we proposed a novel regularized regres-sion approach, called tree lasso, that identifies covariates relevant to multiplerelated responses jointly by leveraging the correlation structure in responsesrepresented as a hierarchical clustering tree. We discussed how this approachcan be used in eQTL analysis to learn SNPs with pleiotropoic effects thatinfluence the activities of multiple co-expressed genes. For optimization, weadopted the smoothing proximal gradient approach that was originally de-veloped for a general class of structured-sparsity-inducing penalties, as tree-lasso penalty can be viewed as a special case. Our results on both the simu-lated and yeast datasets showed a clear advantage of tree lasso in increasingthe power of detecting weak signals and reducing false positives.
SUPPLEMENTARY MATERIAL
The Balanced Weighting Scheme of Tree Lasso and AdditionalExperimental Results(doi: ???http://lib.stat.cmu.edu/aoas/???/???; .pdf). We prove that theweighting scheme of the tree-lasso penalty achieves a balanced penalizationof all regression coefficients. We also provide additional experimental resultson the comparison of tree lasso with other sparse regression methods using
A. Beck and M. Teboulle. A fast iterative shrinkage thresholding algorithm for linearinverse problems. SIAM Journal of Image Science, 2(1):183–202, 2009.
S. Boyd and L. Vandenberghe. Convex Optimization. Cambridge University Press, 2004.X. Chen, Q. Lin, S. Kim, J. Carbonell, and E.P. Xing. Smoothing proximal gradient
method for general structured sparse learning. In Proceedings of the 27th Conferenceon Uncertainty in Artificial Intelligence (UAI), pages 105–114. AUAI Press, 2011.
Y. Chen, J. Zhu, P.K. Lum, X. Yang, S. Pinto, D.J. MacNeil, C. Zhang, J. Lamb, S. Ed-wards, S.K. Sieberts, et al. Variations in DNA elucidate molecular networks that causedisease. Nature, 452(27):429–35, 2008.
V. Cheung, R. Spielman, K. Ewens, T. Weber, M. Morley, and J. Burdick. Mapping de-terminants of human gene expression by regional and genome-wide association. Nature,437:1365–1369, 2005.
V. Emilsson, G. Thorleifsson, B. Zhang, A.S. Leonardson, F. Zink, J. Zhu, S. Carlson,A. Helgason, G.B. Walters, S. Gunnarsdottir, et al. Genetics of gene expression and itseffect on disease. Nature, 452(27):423–28, 2008.
J. Friedman, T. Hastie, H. Hofling, and R. Tibshirani. Pathwise coordinate optimization.Annals of Applied Statistics, 1:302–332, 2007.
J. Friedman, T. Hastie, and R. Tibshirani. A note on the group lasso and a sparse grouplasso. Technical report, Department of Statistics, Stanford University, 2010.
T. R. Golub, D. K. Slonim, P. Tamayo, C. Huard, M. Gaasenbeek, J. P. Mesirov, H. Coller,M. L. Loh, J. R. Downing, M. A. Caligiuri, C. D. Bloomfield, and E. S. Lander. Molec-ular classification of cancer: class discovery and class prediction by gene expressionmonitoring. Science, 286:531–37, 1999.
T. Hastie, R. Tibshirani, D. Botstein, and P. Brown. Supervised harvesting of expressiontrees. Genome Biology, 2:research0003.1–0003.12, 2001.
L. Jacob, G. Obozinski, and J. Vert. Group lasso with overlap and graph lasso. InProceedings of the 26th International Conference on Machine Learning, 2009.
R. Jenatton, J. Audibert, and F. Bach. Structured variable selection with sparsity-inducingnorms. Technical report, INRIA, 2009.
S. Kim and E.P. Xing. Statistical estimation of correlated genome associations to a quan-titative trait network. PLoS Genetics, 5(8):e1000587, 2009.
S. Kim and E.P. Xing. Supplement to “Tree-guided group lasso for multi-response regres-sion with structured sparsity, with an application to eqtl mapping”. DOI: ??, 2012.
S.-I. Lee, D. Pe’er, A. Dudley, G. Church, and D. Koller. Identifying regulatory mechanismsusing individual variation reveals key role for chromatin modification. PNAS, 103(38):14062–67, 2006.
G. Obozinski, M.J. Wainwright, and M.J. Jordan. High-dimensional union support recov-ery in multivariate regression. In Advances in Neural Information Processing Systems21, 2008.
G. Obozinski, B. Taskar, and M. Jordan. Joint covariate selection and joint subspaceselection for multiple classification problems. Journal of Statistics and Computing,2009.
M.A. Pujana, J.J. Han, L.M. Starita, K.N. Stevens, M. Tewari, J.S. Ahn, G. Rennert,V. Moreno, T. Kirchhoff, B. Gold, et al. Network modeling links breast cancer suscep-tibility and centrosome dysfunction. Nature Genetics, 39:1338–49, 2007.
E. Segal, M. Shapira, A. Regev, D. Pe’er, D. Botstein, D. Koller, and N. Friedman. Module
24 KIM AND XING
networks: identifying regulatory modules and their condition-specific regulators fromgene expression data. Nature Genetics, 34:166–78, 2003.
B. Stranger, M. Forrest, A. Clark, M. Minichiello, S. Deutsch, R. Lyle, S. Hunt, B. Kahl,S. Antonarakis, S. Tavare, et al. Genome-wide associations of gene expression variationin humans. PLoS Genetics, 1(6):695–704, 2005.
T. Srlie, C. M. Perou, R. Tibshirani, T. Aas, S. Geisler, H. Johnsen, T. Hastie, M. B.Eisen, M. van de Rijn, S. S. Jeffrey, T. Thorsen, H. Quist, J. C. Matese, P. O. Brown,D. Botstein, P. E. Lnning, and A. Brresen-Dale. Gene expression patterns of breastcarcinomas distinguish tumor subclasses with clinical implications. PNAS, 98:10869–74,2001.
R. Tibshirani. Regression shrinkage and selection via the lasso. Journal of Royal StatisticalSociety, Series B, 58(1):267–288, 1996.
T. T. Wu, Y. F. Chen, T. Hastie, E. Sobel, and K. Lange. Genome-wide associationanalysis by lasso penalized logistic regression. Bioinformatics, 25(6):714–721, 2009.
M. Yuan and Y. Lin. Model selection and estimation in regression with grouped variables.Journal of Royal Statistical Society, Series B, 68(1):49–67, 2006.
X. Yuan and S. Yan. Visual classification with multi-task joint sparse representation. InProceedings of the 2010 IEEE Conference on Computer Vision and Pattern Recognition(CVPR), 2010.
B. Zhang and S. Horvath. A general framework for weighted gene co-expression networkanalysis. Statistical Applications in Genetics and Molecular Biology, 4(1):Article 17,2005.
Y. Zhang. Multi-task active learning with output constraints. In Proceedings of the 24thAAAI Conference on Artificial Intelligence (AAAI), 2010.
P. Zhao, G. Rocha, and B. Yu. The composite absolute penalties family for grouped andhierarchical variable selection. The Annals of Statistics, 37(6A):3468–3497, 2009.
Y. Zhou, R. Jin, and S.C.H. Hoi. Exclusive lasso for multi-task feature selection. InProceedings of the 13th International Conference on Artificial Intelligence and Statistics(AISTATS), 2010.
J. Zhu, B. Zhang, E.N. Smith, B. Drees, R.B. Brem, L. Kruglyak, R.E. Bumgarner, andE.E. Schadt. Integrating large-scale functional genomic data to dissect the complexityof yeast regulatory networks. Nature Genetics, 40:854–61, 2008.
H. Zou and T. Hastie. Regularization and variable selection via the elastic net. Journalof Royal Statistical Society, Series B, 67(2):301–320, 2005.
School of Computer ScienceCarnegie Mellon UniversityPittsburgh PA 15213USAE-mail: [email protected]