Trans. Nat. Acad. Sci. & Tech. (Phils.) !987.9:461-494 TRENDS IN THE HEALTH AND NUTRITION OF FILIPINO CHILDREN (0-19 YEARS) IN THE DECADE 1973 TO 1983 Fe del Mundo, Thaddeus Evangelista and Mario Arciaga Children's Medical Center, Philippines Banawe, Quezon City ABSTRACT A ten-year survey of the health and nutrition of Filipino children, from birth to 19 years old for the decade 1973 to 1983, is presented to detennine the attainments and achievement!: of agencies and organizations in and out of govern· ment and look into c urrent pr oblems and possible solutions. Of the total population in 1983. the sector below 20 years old (52.9%), showed a Life Expectancy of 62.5 years. an Infant Mortality Rate of 59.3 per 1000 live births and a Literacy Rate of 87 .7 . The nutritional status of pre- schoolers with weights higher t han 75 % of Filipino standard weight has improved to 8% in 1983. The morbidity and mortality rates have declined particularly for the immunizable diseases. Maternal Death Rate was 1.0 or a decrease of 28 .6. In general the basic health and development indi ca tors have show improve- ment but these arc stiU far from significant or satisfactory, even as compared to countries around the Philippines. Introduction All over the world there has been an encouraging and laudable increase in concern and attention given the health and well being of children. This is not only because the young continue to constitute the greater proportion of the popu- lation particularly in developing countries, but also because many adverse factors have occurred in recent years such as the economic recession, social unrest, popu- lation pressures and soaring prices. Interest in child health was highlighted during the lnternationa1 Year of the Child (IYC) in 1979. This event served as an impetus for new or innovative or revitalized programs, projects and activities for children. The theme of the IYC celebration, MANKIND OWES TO THE CHILD THE BEST IT HAS TO GIVE. and a continuous reminder that children are tomorrow's future, have provided incentives that encouraged countries to persist in the care of children. The historical global Alma Ata Conference (1978) or Primary Health Care influenced changes in the focus, directions, targets, strategies and policies in child health care. Impressive and significant priorities have been given to devel· 461
TRENDS IN THE HEALTH AND NUTRITION OF FILIPINO CHILDREN (0-19 YEARS) IN THE DECADE 1973 TO 1983
Fe del Mundo, Thaddeus Evangelista and Mario Arciaga Children's Medical Center, Philippines
Banawe, Quezon City
ABSTRACT
A ten-year survey of the health and nutrition of Filipino children, from birth to 19 years old for the decade 1973 to 1983, is presented to detennine the attainments and achievement!: of agencies and organizations in and out of govern· ment and look into current problem s and possible solutions.
Of the total population in 1983. the sector below 20 years old (52.9%), showed a Life Expectancy of 62.5 years. an Infant Mortality Rate of 59.3 per 1000 live births and a Literacy Rate of 87 .7. The nutritional status of preschoolers with weights higher than 75 % of Filipino standard weight has improved to 8% in 1983 . The morbidity and mortality rates have declined particularly for the immunizable diseases. Maternal Death Rate was 1.0 or a decrease of 28.6.
In general the basic health and development indicators have show improvement but these arc stiU far from significant or satisfactory, even as compared to countries around the Philippines.
Introduction
All over the world there has been an encouraging and laudable increase in concern and attention given the health and well being of children. This is not only because the young continue to constitute the greater proportion of the population particularly in developing countries, but also because many adverse factors have occurred in recent years such as the economic recession, social unrest, population pressures and soaring prices.
Interest in child health was highlighted during the lnternationa1 Year of the Child (IYC) in 1979. This event served as an impetus for new or innovative or revitalized programs, projects and activities for children. The theme of the IYC celebration, MANKIND OWES TO THE CHILD THE BEST IT HAS TO GIVE. and a continuous reminder that children are tomorrow's future, have provided incentives that encouraged countries to persist in the care of children.
The historical global Alma Ata Conference (1978) or Primary Health Care influenced changes in the focus, directions, targets, strategies and policies in child health care. Impressive and significant priorities have been given to devel·
461
462 Transactions National Academy of Science
oping countries, particularly the underserved and unreached through the use of low-cost, simple and unsophisticated procedures and methods, the shift from hospitals to community-based activities, emphasis given to breakthroughs that are affordable, accessible, acceptable and their practical implementation. Training and recruitment of health manpower have undergone changes from highly technical professionals and experts to paraprofessionals and even lay persons, thus allowing delivery of services more readily than in the past , to remote and difficult areas.
Yearly, the United Nations Children's Fund (UNICEF) through its Executive Director, presents a vivid and comprehensive analysis and report of the STATE OF THE WORLD'S CHILDREN which includes what have been accomplished or achleved in different regions or in individual countries. There have served as inspiring and encouraging models to all. The International Pediatric Association as an organized body or through its regional members has also reported on the status of children in Asia , Europe and other sectors. Other international or national groups have commendably followed suit.
In the Philippines, health surveys have been sporadically prepared. The present survey has gathered infonnation and data for the decade (1973-1983), from various sources as the Department of Health (DOH), the National Economic Development Authority (NEDA), the National Census and Statistics Center, as well as Annual reports of different health and nutrition organizations and centers and situational studies of government and private concerns particularly that of the Council for the Welfare of Children (1974 and 1985). Problems in gathering and coordinating the different findings are due to the fact that some are actual figures while others are estimates or projections.
Besides available statistics, the authors have looked into government policies related to health and nutrition and strategies for action to meet needs and problems that would operationalizc such policies.
Objectives
It is the purpose of this survey to determine the health and nutrition status of children and their trends in a developing country , the Philippines, where many unfavorable and even unexpected events and factors have affected and played a part in the overall situation of the young.
Although improvements have been noted following the universal trend, these have not been significant nor impressive in the Philippines. In fact, notwithstanding concerted efforts on the part of the government and private concerns to give our children the best they deserve comparable to those of developed countries, situational health studies of the Philippines show there is much to be desired.
It is expected that this particular review of a decade may give a picture of the present health status of children (0-19 years) in the Philippines. This may
del Muooo et al , Health and Nutrition of Filipino Children
STATUS OF FILIPINO CHILDREN (0-1t YEARS) 1973-1.:1
POPULATION OF CHILDREN (0-19 YEARS) INCREASED FROM 21.•21.000 TO 27,017,136
28.1% INCREASE
CRUDE BIRTH RATE INCREASED FROM 26.1 TO 21.0
11.1"' INCREASE
CRUDE DEATH RATE DECREASED FROM 7.0 TO 8.3
10.'"' DECREASE
INFANT MORTALITY RATE DECREASED FROM 71.7 to 59.3
22.K DECREAS£
NEONATAL MORTALITY RATE DECLINED FROM 30.2 TO 17 .•
G.~ DECREASE
MATERNAL DEATH RATE DECREASED FROM 1.4 TO 1.0
21.ft DECREASE
·~UNICABLE DIHAIU DEATH RATI DECREASED FROM B7.7 TO 212.1
2l.ft DECREASE
TUBERCULOIIa MORTAUTV RATE DECREASED FROM 14.7 TO 8.0
11.ft DECRIAII
CARDtOV.UCULAA DIIIAIII DEATH RATl DECREASED FROIII.o:l TO 1.01
O.lftDECREAIE
MALIGNANT NEOPlAal DEATH RATE INCREAIID FROM 1M TO l.o7
_, .ft INCIIIAII
LIFE EXJIKTANCY INCREASED FROIII1 VEAM TO Gl VIARS
I.A IIICIIIAII
463
464 Transactions National Academy of Science
serve as a basis for the identification of past and current problems, to clarify future action and direction in the formulation of policies and recommendations and to assist in the development of programs and in the implementation of projects which may benefit our children.
Specifically, this study aims to: a) provide information and indicators to measure the progress and impact of the delivery of services for children~ b) to identify the sources and statistical areas of concern and provide corresponding recommendations~ c) to broaden awareness of various agencies engaged in child development on roles each agency can play; d) to assist funding and supporting agencies to plan and program proper allocation of resources for children.
General Considerations
Demographic trend among children (0-19 years old)
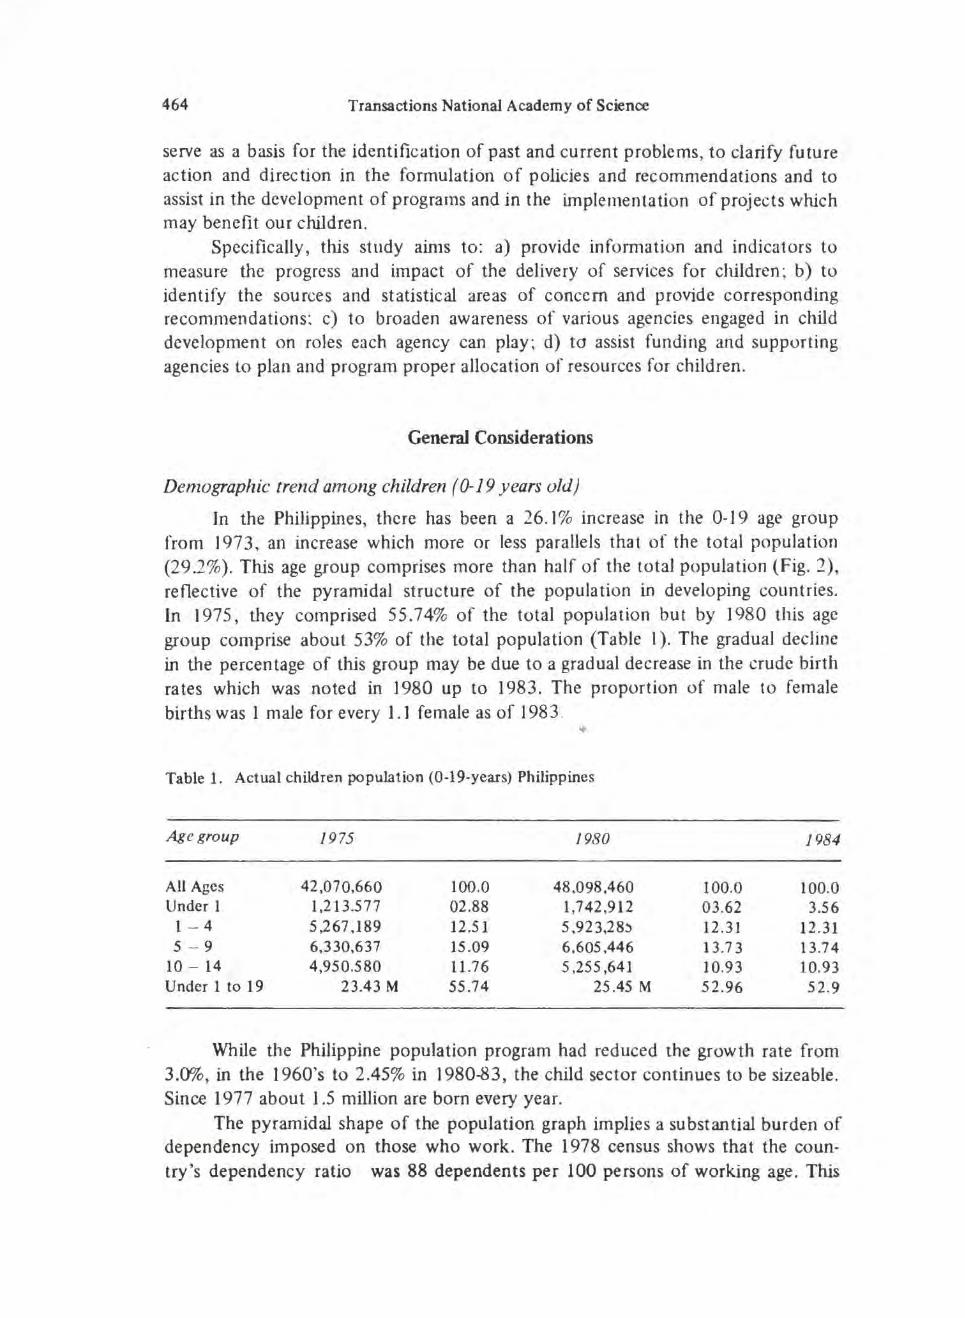
In the Philippines, there has been a 26.1% increase in the 0-19 age group from 1973 , an increase which more or less parallels that of the total population (29 .2%). This age group comprises more than half of the total population (Fig. 2}, reflective of the pyramidal structure of the population in developing countries. In 1975, they comprised 55.74% of the total population but by 1980 this age group comprise about 53% of the total population (Table I). The gradual decline in the percentage of this group may be due to a gradual decrease in the crude birth rates which was noted in 1980 up to 1983 . The proportion of male to female births was 1 male for every 1.1 female as of 198 3 .
Table 1. Actual children population (0-19-years) Philippines
Age group 1975 1980 1984
All Ages 42,070,660 100.0 48.098 ,460 100.0 100.0 Under 1 1,213.577 02.88 1,742,912 03.62 3.56
10 - 14 4,950.580 11.76 5,255,641 10.93 10.93 Under 1 to 19 23.43 M 55.74 25.45 M 52.96 52.9
While the Philippine population program had reduced the growth rate from 3.0%, in the 1960's to 2.45% in 1980-83, the child sector continues to be sizeable. Since 1977 about 1.5 million are born every year.
The pyramidal shape of the population graph implies a substantial burden of dependency imposed on those who work. The 1978 census shows that the coun· try's dependency ratio was 88 dependents per 100 persons of working age. This
del Mundo et aL, Health and Nutrition of Filipino Children 465
trend exerts tremendous pressure on the productive sectors of the economy to provide the basic needs of a predominantly young population.
With a total land area of 300,000 square kilometers the population density of the country is 140 per one (I) sq. km. In 1975 around 58 out of 100 Filipinos belonged to the age category below 21. On the average therefore there are about 81 children for every 3 square kilometers in the country.
National budget
It will be noted that in the Philippine allocation for health has always been the lowest among four services and considering that the population increases by 1.2 to 1.5 million yearly. it is not surprising that health services are correspondingly impaired.
Tatile 2 . National budget (in millions of pesos)
1970 1975 1978 1983
Total 4,053 19,049 27 ,808 5 3,729 s-:conomic Services 1,283 8,672 11,272 15.587 lJ;. of Total (21.6%) (45.5%) (40.5%) (29.0%) Defense 615 3,932 4,542 6,521 % of Total (15 .1%) (20.9%) (06.3%) (12.1 %) Education 1,133 2,212 3.582 6,381 % of Total (27.9%) ( 11.6%) (12 .8%) (11.2%) HeaJth 226 785 962 2,525 % of Total (5 .5%) (4.1%) (3.4%) (4.6%)
Health and nutrition manpower resources
The 1973 Health Manpower Resource of the MOH showed that there were 17,41 7 health professionals including sanitary health inspectors. Of this number 23.6% were nurses, 18.7% physicians, and 4.5% dentists. Also 2,980 were mid
wives who in the Ministry of Health are the mainstay of services in most communities. Regionwise , the survey registered:
Physicians Nurses Midwives
13,107 8,283 6,915
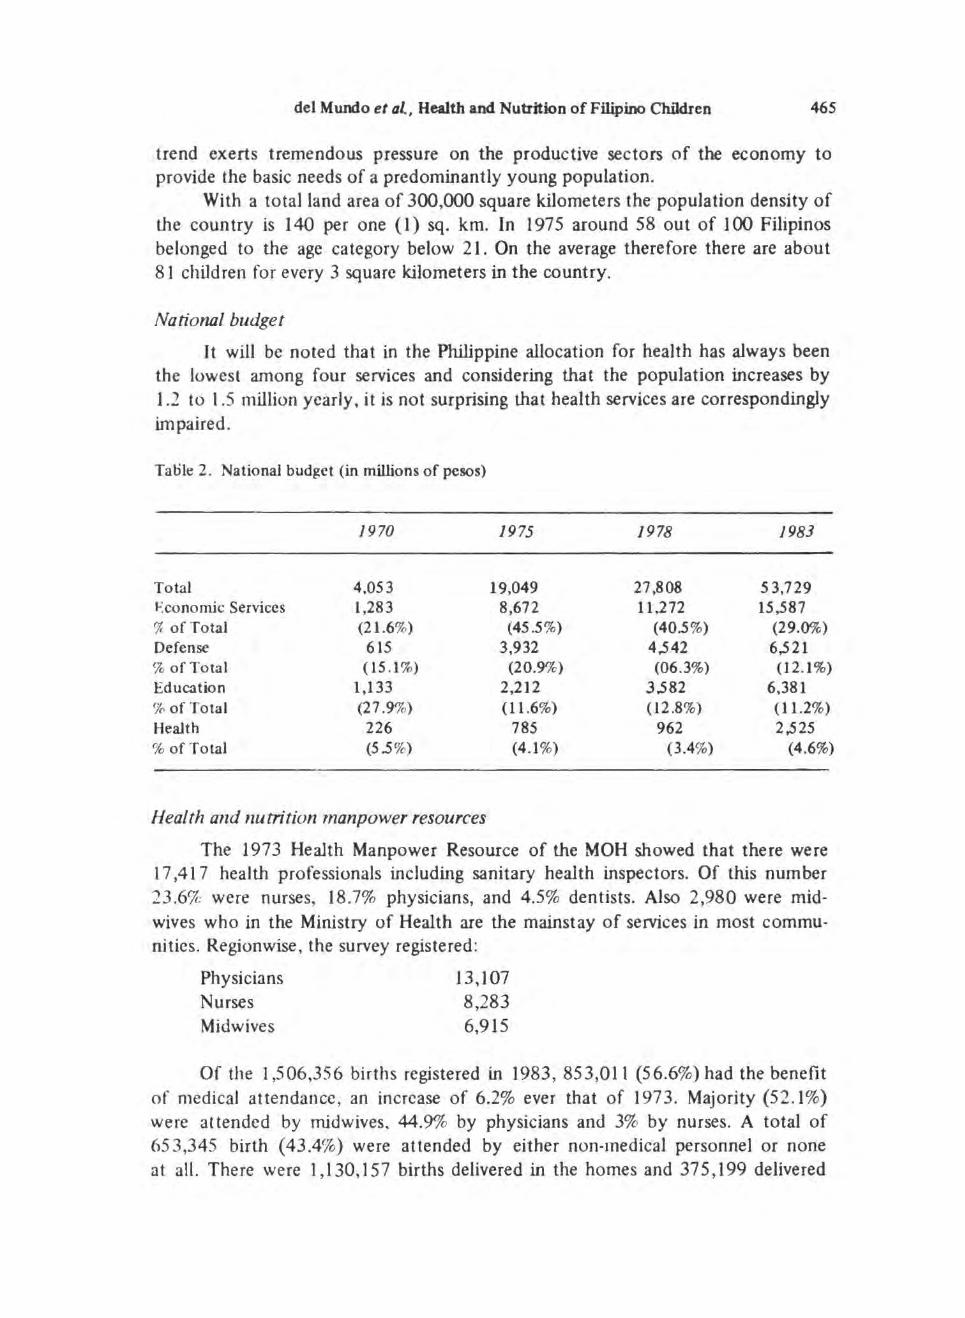
Of the 1,506,356 births registered in 1983, 853,011 (56.6%) had the benefit of medical attendance, an increase of 6.2% ever that of 1973. Majority (52.1%) were attended by midwives. 44.9% by physicians and 3% by nurses. A total of 65 3,345 birth ( 43.4%) were attended by either non-medical personnel or none at all. There were 1,130,157 births delivered in the homes and 375,199 delivered
fig. 2. Total population and the population of 0-19 years old
Philipines, 1973-1983
in the hospital representing 75% and 25% of the total respectively as depicted in Figs. 3 and 4.
Table 3. Medical manpower, Philippines (1984)
Philippine Medical Association
Region
Luzon Vi say as Mindanao Total MDs
Total Population
Philippine Pediatric Society (1984)
Metro Manila Previnces Total Children 0-19 years
7,029 (70%) 1,739 (15 %) 1,763 (15 %) 11 ,331
53.673,000
554 294 848
1:3700 1:7000 1:7200 1:5000
(approx. 4 million children) (approx. 22 million children)
pediatricians 26,5 35,937
del Mundo et al. , Health am Nutrition of Filipino Children
Births by attendance Philippines
1983
Traditional Midwife
Midwife
Physician
Nurse Others
Figure 3.
Births by place of birth Philippines
1983
Figure 4.
40.0%
29.8%
25.4%
1.7% 3.4%
467
468 Transactions National Academy of Science
Others 18 %
Field Health Serives 29%
Hospitals 53%
J-ig. 5. Share of hospitals in health budgets
PHILIPPINES ( 1982)
Source: World Bank and WHO
Table 4 . Number of health facilities, Philippines 1980 and 1984
Facility 1980
Hospitals* 345 Rural Health Units 1.991 Barangay Health Stations 7,353 Sanitaris 8 Chest Clinics 21 Skin Clinics
Travelling 16 Stationary 6
family Planning Clinics 1.743 Social Hy~iene Clinics 32 Mental Hygiene Clinics 23 Dental Clinics 520 Malaria Units 33 Schistosomiasis Units 23 Filariasis Central Units 3 Nutriward Units 168
•Hospitals under the MOH only.
IY84
367 I ,991
7.99 1 8
17
16 6
1.542 30 25
652 32 23
3 188
In the government subsystem in 1976 the health facilities are as enumerated above. Supportive are some 743 Puericulture Centers (private Maternal and Child Health facilities with Family Planning), 300 health centers, 51 maternity houses,
del Mundo et aL, Health and Nutrition of Filipino Children 469
mobile hospitals, 8 Sanitaris and 5 static clinics. The RHUs are the basic field health units of the Ministry of Heaith located in municipalities with their satellite barangay (village) health stations. The latter are more accessible to the rural population, particularly in depressed areas.
There has been a continuing increase in the number of barangay health stations and rural health units through the years.
Of all the health facilities and services , hospitals get the biggest share from the national health budget (Fig. 5 ) .
As of 1983 , there were a total of I ,705 hospitals all over the country, seventy percent (7CY~) of which are privately owned. There was a 122 .0% increase in the total number of hospitals built from 197 3 to 1983 .
Although 7f1% of the total number of hospitals are privately owned, the government hospitals held the bigger share (54%) of the total bed capacity .
Morbidi!J'
Philippine Statistics on the notifiable disease presented by the Disease Intel ligence Center, Department of Health were collected from the morbidity reports received weekly from all provincial and city health offices throughout the country.
A ten-year average ( 197 3-1983) of the rates of the 10 leading causes of morbidity specific for the age group 0-19 years old (Fig. 6), in accordance with notifiable disease specified by the Department of Health (Act 35 73).
Bronchitis had the highest morbidity rates (821.5 per 100,000 population of 0-1 9 years old) followed very closely by diarrheas (all forms) with a rate of R I Y .8 . It will be noted that bronchitis was not included as a notifiable disease in 1974 and 1975. Diarrhea includes cholera, typhoid, and paratyphoid fevers and other salmonella infection, food poisoning, all forms of dysentery (bacillary and amoebic) and non-specific diarrheas. Influenza, with a rate of 550.9 is a far third . Pncumonias which ranked fourth, include both viral and bacterial etiologies. Measles ranked fifth with a rate of 117.4 per 100,000 population of 0-19 year olds. Whooping cough. malaria and tuberculosis included all clinical forms but it has been noted that approximately 96% of illnesses due to tuberculosis in general, are respiratory in nature. Schistosomiasis, although endemic in a few areas, ranked 9th with a rate of 7.8. Malignant neoplasms ranked 1Oth with a rate of 7.1 and include all growths on any site of the body. This did not include leukemias.
There were only minimal changes in the rates and ranking of the I 0 leading causes of morbidity in 1973 and 1983. Malaria rose from 8th to the 6th rank although there was a decrease in the rate . Tuberculosis and schistosomiasis which ranked 6th and 9th in 1973, dropped to 8th and lOth respectively, in 1983. Their rates also decreased. Malignant neoplasms rose from the lOth in 1973 to 9th pl~ce in 1983, with a corresponding increase in rates. (Fig. 7).
It is noteworthy that except malignant neoplasm, all these leading causes of morbidity in the age group of 0-19 years, are communicable or infectious. Of
470
-! 'Ol c w
]
1
I
J
I
I
100
Transactions National Academy of Science
Bronchi tit
D~rrhees All Forms
Influenza I
Pneumoniat 1 Musles
Whoopi"Q Cou9h
Malar~
T ubetl::ulosis. Al l Forms
Sch is10IOITI iasil
Malignant Neopl.sm
• 200 300 500 600 700
Morbidity Rates Pill' 100,000 Population o1 0.19 Years Old
1 821 .5
J 819.8
550.9
371 .6
, 17.4
80.9
70.0
67.6
7.8
7.1
800
Fig. 6. Leading causes of morbidity among 0-19 years old : a 10-year average (1973-1983) Philip pines.
~ ;:. ... c
w
.I 0
Rates
Bronchitis 1,337.5
Diarrheas 1,041.1
774.4
PnetJmonias 354.0
Measles 12R.7
Tuberculosis 106.9
Whoopmg Cough 86.4
Malaria 85.4
Schistosomiasis 8.6
Malignant Neoplasm 5.0
500 1000 1500
Rates Per 100,()(X) Population of 0.19 Years 1973
l _-=..:....::..:.:.=..:..:..:..::.._· --· ----, ~ Bronchitis . ___j
Diarrheas _ _j .___._--.-1--- ! n!~ver~ ·~'
r-- ··,,t"•· ,_ t--·"
...., L_; I - ,
Tuberculosis
Maltgnant Neoplasm
500 1000
Rates
, ,038.4
932.5
541 .2
379.0
148.9
78.9
63.6
61 .4
8.8
6.8
1500
Rates Per 100,000 Population of 0.19 Years 1983
F'Jg. 7. Comparison of leading causes of morbidity among 0-19 years old in 1973 and 1983 Philippines.
0 ~ 0
~ ...: w >-c. -0
""' .,o ~~ Cj: CIC~
~ §. 8 -CIC
~
del Mundo et aL, Health and Nutrition of Filipino ChBdten
Hg. 9. Pneumonia: morbidity and mortality trends among 0-19 years old. Philippines 1973-1983.
471
472 Transactions National Academy of Science
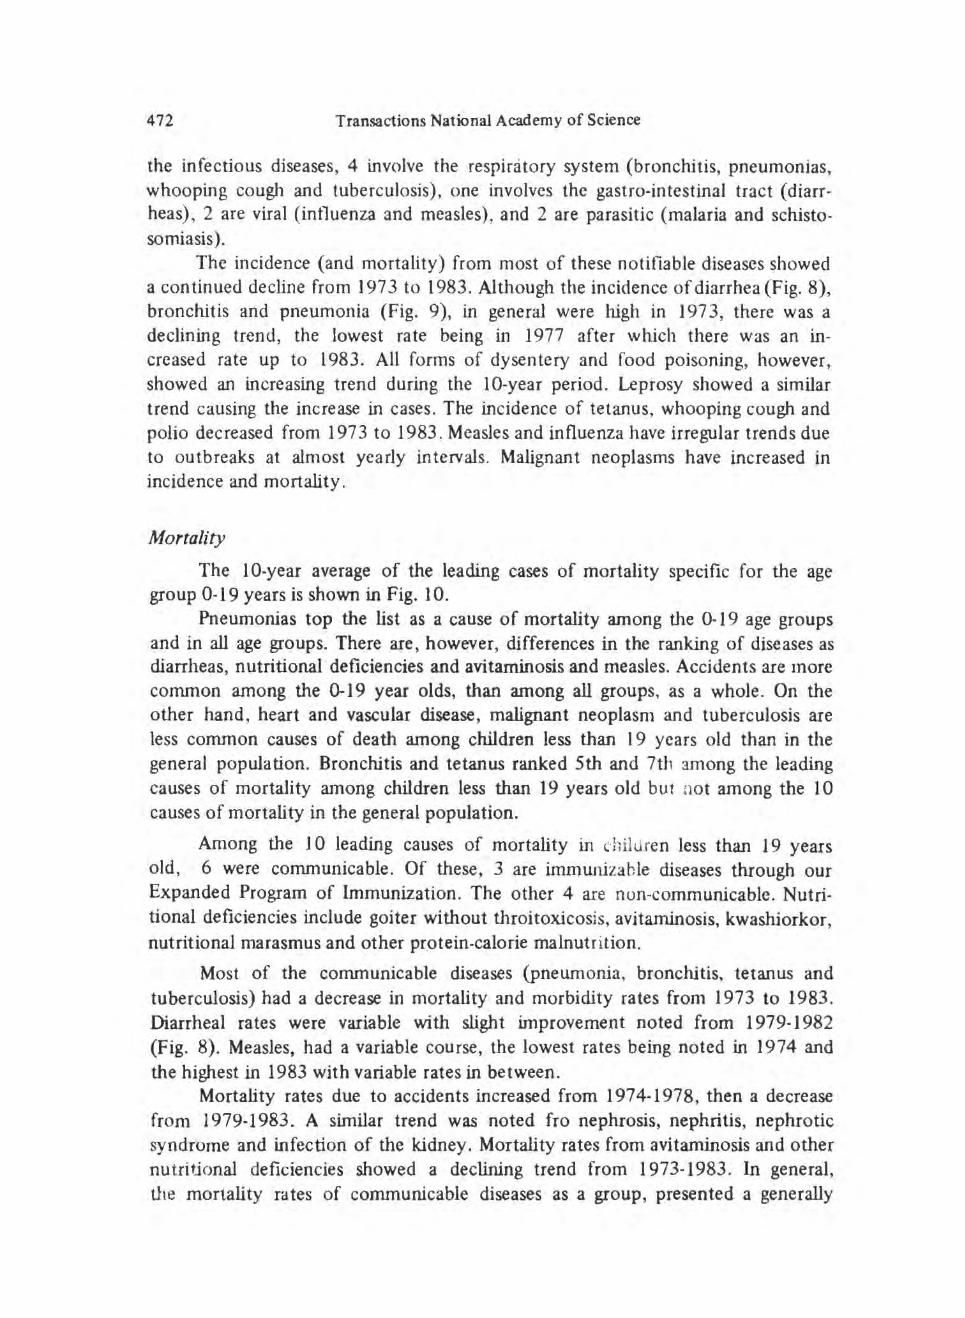
the infectious diseases, 4 involve the respiratory system (bronchitis, pneumonias, whooping cough and tuberculosis), one involves the gastro·intestinal tract (diarrheas), 2 are viral (intluenza and measles), and 2 are parasitic (malaria and schistosomiasis).
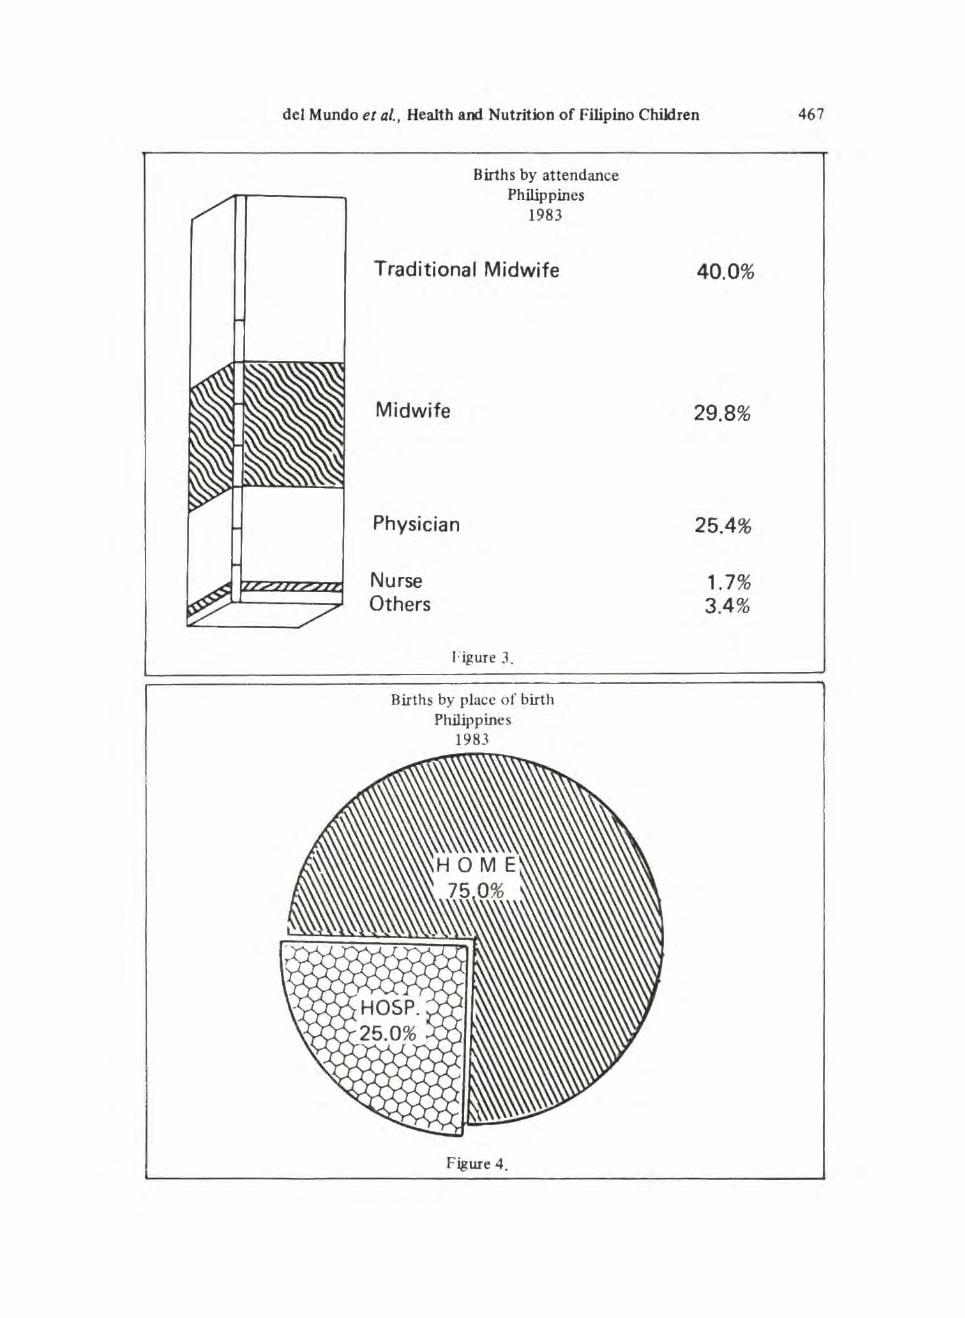
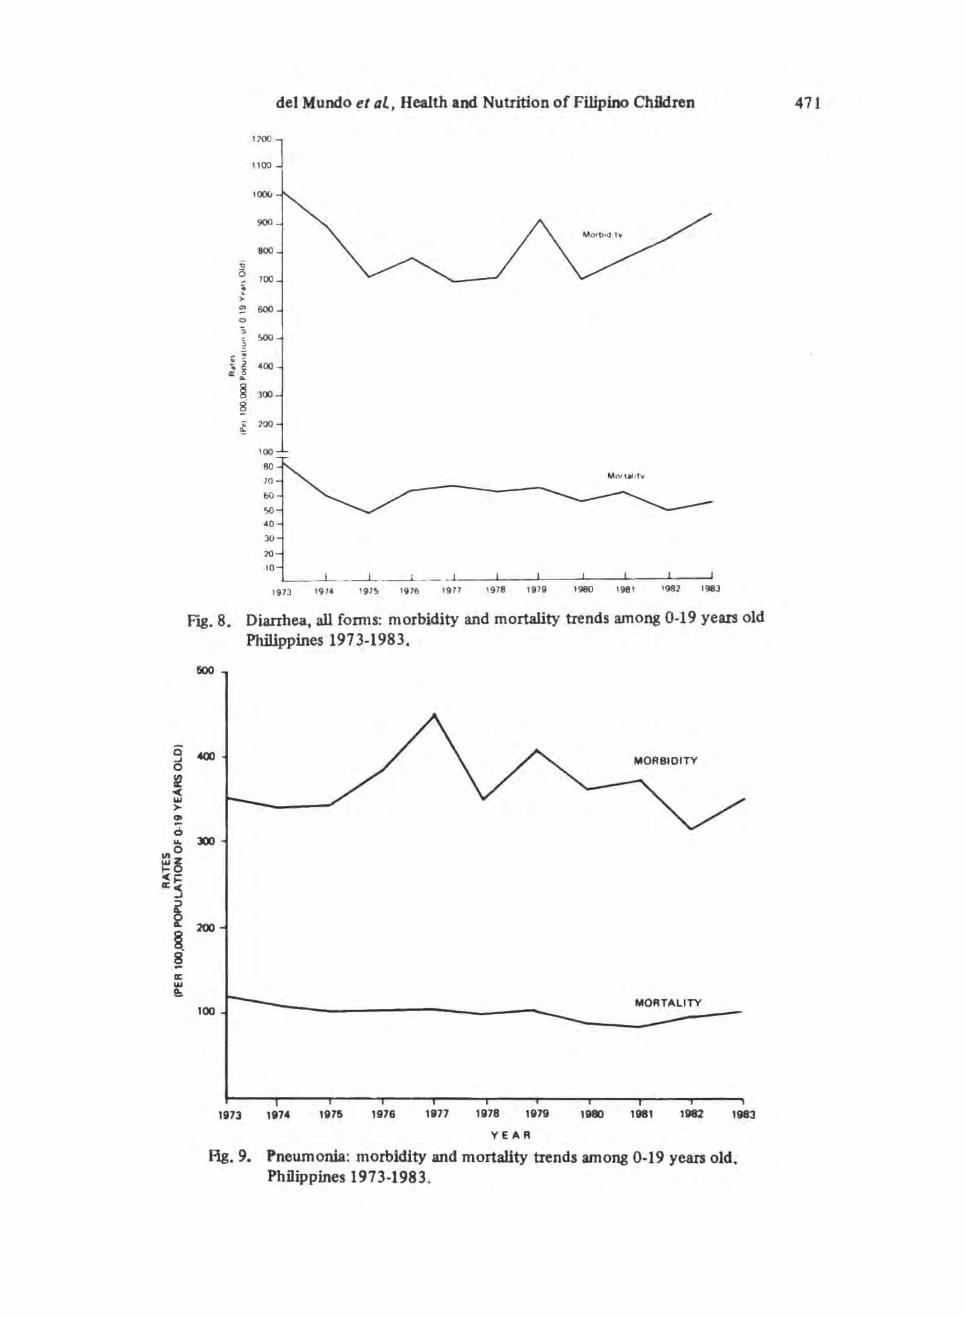
The incidence (and mortality) from most of these notit1able diseases showed a continued decline from 197 3 to 1983. Although the incidence of diarrhea (Fig. 8), bronchitis and pneumonia (Fig. 9), in general were high in 1973, there was a declining trend, the lowest rate being in 1977 after which there was an increased rate up to 1983. All forms of dysentery and food poisoning, however, showed an increasing trend during the 1 O·year period. Leprosy showed a similar trend causing the increase in cases. The incidence of tetanus, whooping cough and polio decreased from 1973 to 1983 . Measles and influenza have irregular trends due to outbreaks at almost yearly intervals. Malignant neoplasms have increased in incidence and mortality.
Mortality
The 10·year average of the leading cases of mortality specific for the age group 0-19 years is shown in Fig. 10.
Pneumonias top the list as a cause of mortality among the 0.19 age groups and in all age groups. There are, however, differences in the ranking of diseases as diarrheas, nutritional deficiencies and avitaminosis and measles. Accidents are more common among the 0.19 year olds, than among all groups, as a whole. On the other hand, heart and vascular disease, malignant neoplasm and tuberculosis are less common causes of death among children less than 19 years old than in the general population. Bronchitis and tetanus ranked 5th and 7th among the leading causes of mortality among children less than 19 years old but not among the I 0 causes of mortality in the general population.
Among the 10 leading causes of mortality in c.:-hiluren less than 19 years old, 6 were communicable. Of these, 3 are immw1izable diseases through our Expanded Program of Immunization. The other 4 are non-communicable. Nutritional deficiencies include goiter without throitox.icosis, avitaminosis, kwashiorkor, nutritional marasmus and other pr.otein.calorie malnutrition.
Most of the communicable diseases (pneumonia, bronchitis, tetanus and tuberculosis) had a decrease in mortality and morbidity rates from 1973 to 1983. Diarrheal rates were variable with slight improvement noted from 1979-1982 (Fig. 8). Measles, had a variable course, the lowest rates being noted in 1974 and the highest in 1983 with variable rates in between.
Mortality rates due to accidents increased from 1974-1978, then a decrease from 1979·1983. A similar trend was noted fro nephrosis, nephritis, nephrotic syndrome and infection of the kidney. Mortality rates from avitaminosis and other nutritional deficiencies showed a declining trend from 1973-1983. In general, the mortality rd tes of communicable diseases as a group, presented a generally
del Mundo et al., Health and Nutrition of Filipino Children
Pneumonias
Diarrheas All Forms
~-----' Avitaminosis and Other Nutritional Deficiency
Measles
Bronchitis
Accidents
Tetanus
Heart Disease
Tuberculosis all types
Malignant Neoplasm
Nephritis. Nephroses including infection of the Kidneys
Fig. 10. Leading causes of mortality among Filipino children 0-19 years old : a 10-year survey Philippines 1973-1983.
-
10
2 3 4 5
.AGE IN YEARS
.... ,.; -
6
01978
CX) .,; .::..
TOTAL
Fig. 11. Comparison of distribution of undernourished 0-16 years old children using weight for height standard by age. Philippines, 1978-1982.
Source: Phil. Journal of Nutiriton, April-June, 1985
474 Transactions National Academy of Science
decreasing pattern while heart diseases and malignant neoplasms showed a gradually increasing trend.
Accidents include a wide range of spec1rum namely: railway, motor vehicle and traffic accidents, water. air and space transport, poisoning, falls, fires and flames, submersion, suffocation and foreign bodies, accidents due to natural environment, adverse effects of drugs and medicaments, biological substances and late effects of accidental injury.
Cardiac diseases include acute rheun1atic fever, chronic rheumatic heart diseases, ischemic heart diseases, hypertension with heart involvement, and other forms of heart diseases.
Nephritis, nephrosis, nephrotic syndromes and infection of the kidneys and . malignant neoplasm show very similar rates and both occupy the I Oth rank.
Nutritional status of children
From 1973 to 1983, there have heen several number of surveys to assess the nutritional status of Filipinos. notably the Department of Health , Food and Nutrition Research Institute and the National Nutrition Center, with different fmdings which are in Table 5. To standardize data. we chose those of the Food and Nutrition Research lnstitue, in two (2) nationwide nutrition surveys of 1979 and 1982, which have been divided in 3 groups: food consumption, anthrop01netry, and clinical assessment.
a) Food consumption. In general. there has been an increase in the con· sumption of almost all food groups from 1978 to 1982. HighJy significant increases in consumption were noted for sugars; meat and poultry (including eggs); dried beans, nuts and seeds; green leafy and yellow vegetables; misceUaneous foods. The overall increase in the consumption of these food groups have been attributed largely to the following: considerable focus by both goven11nent and private sectors on production of tl1ese commodities; massive campaign on the importance of green leafy and yellow vegetables in the diet through the Philippine Nutrition Program ~ and continued encouragement given to hon1e production.
Reduced consumption were reflected in 2 food groups: cereals and cereaJ products and Vitamin-C rich foods.
Comparing nutrient intakes of the 2 survey periods, highly significant improvements were noted for riboflavin, protein and fat. Energy intake had no significant change. Ascorbic acid intake decreased from the 1978 intake level with the significant reduction in the consumption of Vitamic-C rich foods.
As regards nutrient sources of energy, the Filipino diet has remained characteristically carbohydrate in nature. In both surveys, carbohydrates constituted about 3/4 of the total one-day per capita.
b) Anthropometric measurements. The nutritional status of pre-schoolers {0-6 years old) was based on weight-for-height, weight-for-age and height-for-age indices. The pattern of malnutrition changes with each index for they measure different things.
del Mundo et al., Health and Nutrition of Filipino Children 475
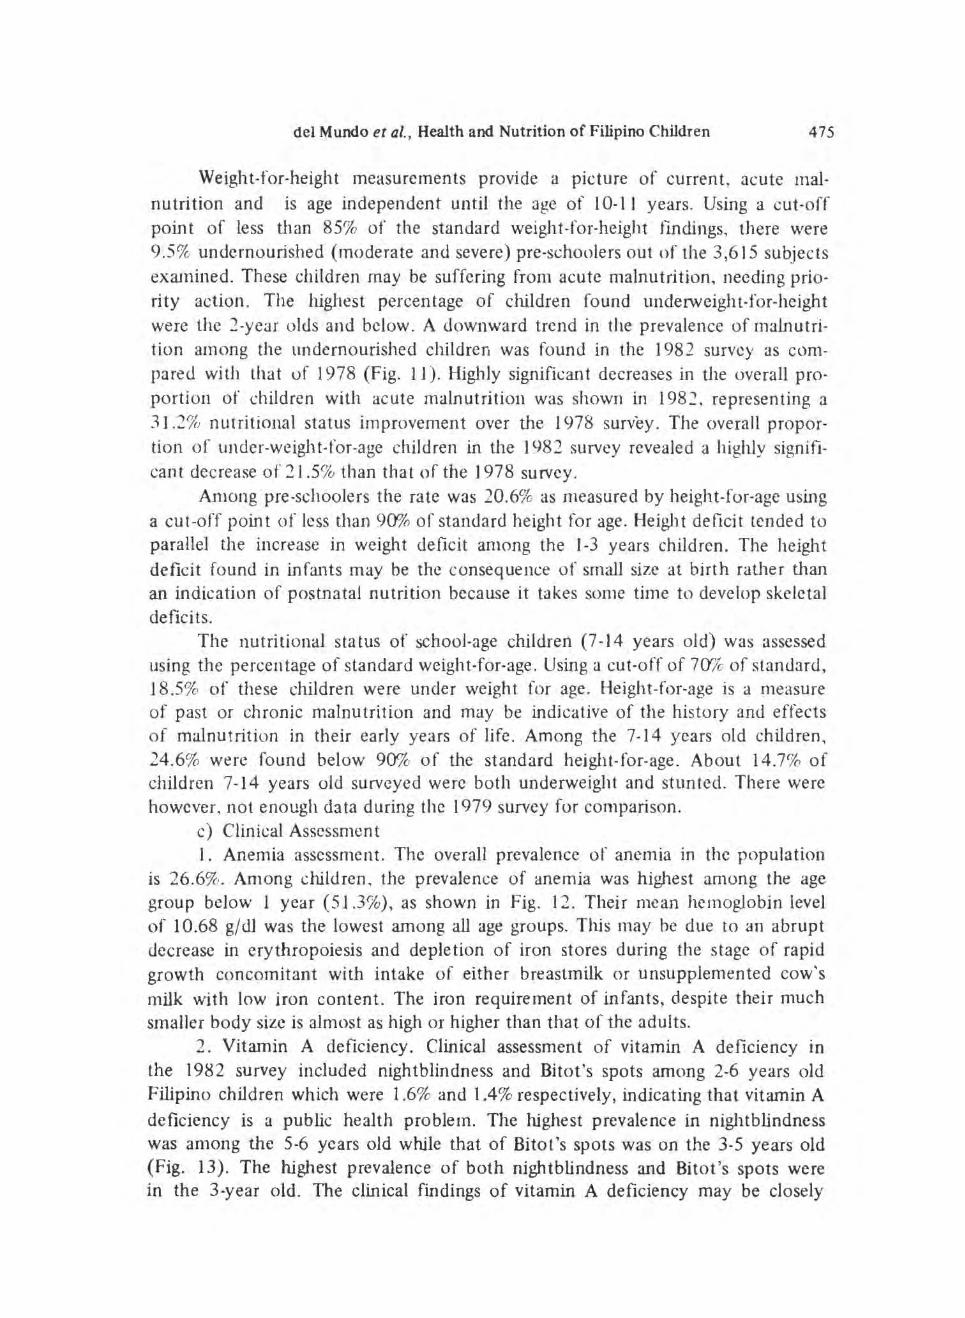
Weight-for-height measurements provide a picture of current, acute malnutrition and is age independent until the age of 10-11 years. Using a cut-off point of less than 85% of the standard weight-for-height findings, there were 9.5% undernourished (moderate and severe) pre-schoolers out of the 3,6 15 subjects exrunined. These children may be suffering from acute malnutrition. needing priority action. The highest percentage of children found underweight-for-height were the 2-year olds and below. A downward trend in the prevalence of malnutrition among the undernourished children was found in the 1982 survey as compared with that of 1978 (Fig. 1 J). Highly significant decreases in t11e overall proportion of children with acute main utrition was shown in 1982 ~ representing a 31.2% nutritional status improvement over the 1978 survey. The overall proportion of under-weight-for-age children in the 1982 survey revealed a highly significant decrease of 21 .5% than that of the 1978 survey.
Anwng pre-schoolers the rate was 20.6% as measured by height-for-age using a cut-off point of less than 9a% of standard height for age . Height deficit tended to parallel the increase in weight deficit among the 1-3 years children. The height deficit found in infants may be the consequence of small size at birth rather than an indication of postnatal nutrition because it takes some time to develop skeletal deficits.
The nutritional status of school-age children (7 -14 years old) was assessed using the percentage of standard weight-for-age. Using a cut-off of 7fYlc of standard, 18.5% of these children were under weight for age. Height-for-age is a measure of past or chronic malnutrition and may be indicative of the history and effects of malnutrition in their early years of life. Among the 7-14 years old children, 24.6% were found below 90% of the standard height-for-age. About 14.7% of children 7-14 years old surveyed were both underweight and stunted. There were however, not enough data during the 1979 survey for comparison.
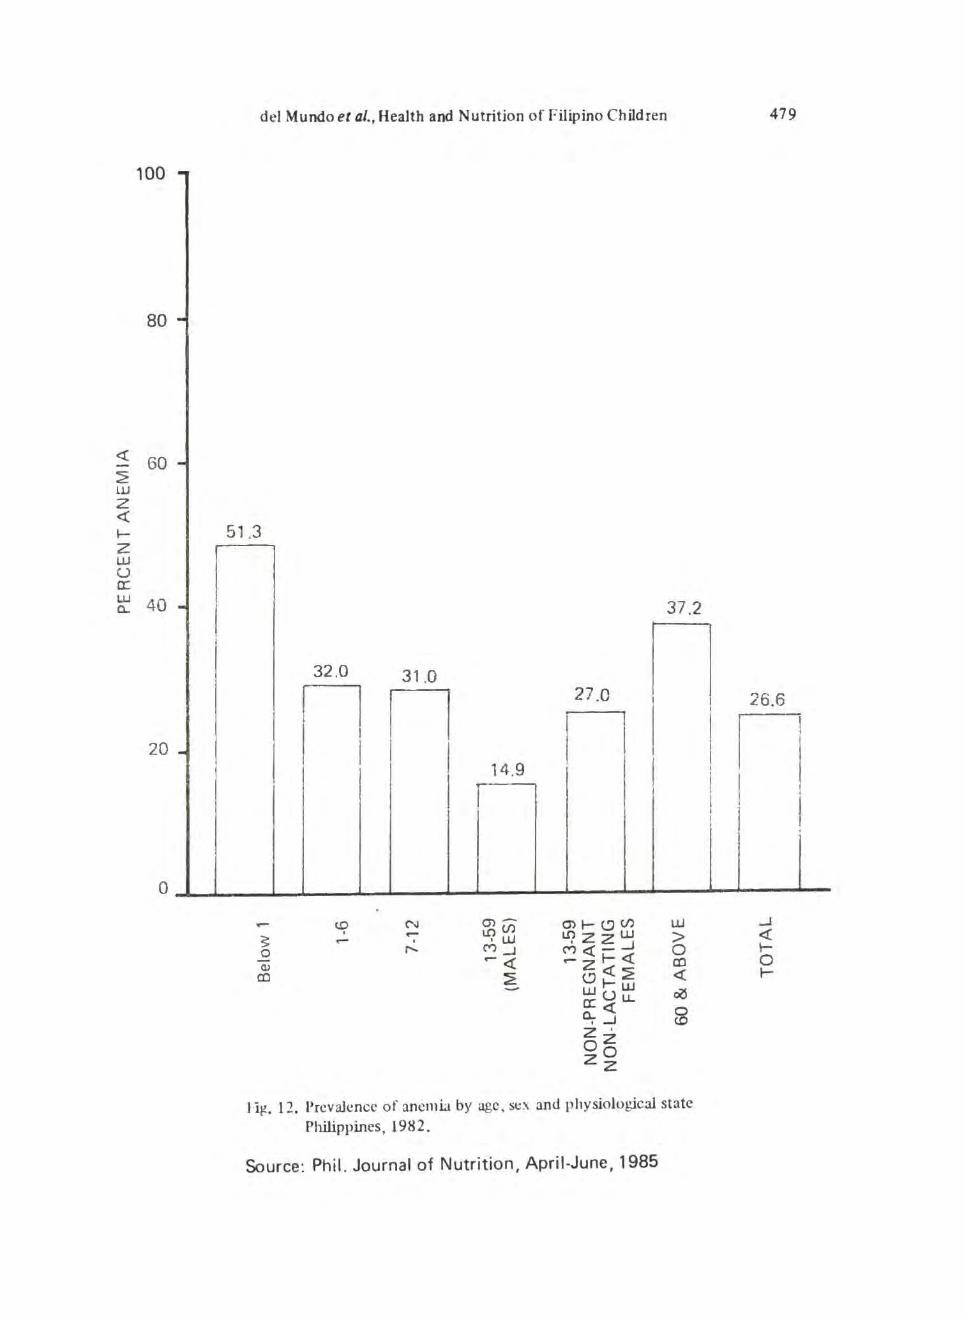
c) Clinical Asscssmen t I. Anemia assessment. The overall prevalence of anemia in the population
is 26.6%. Among children, the prevalence of anemia was highest among the age group below 1 year (51.3%), as shown in Fig. 12 . Their mean hemoglobin level of 10.68 g/ dl was the lowest among all age groups. This may he due to an abrupt decrease in erythropoiesis and depletion of iron stores during the stage of rapid growth concomitant with intake of either breastmilk or unsupplemented cow's milk with low iron content. The iron requirement of infants, despite their much stnaller body size is almost as high or higher than that of the adults.
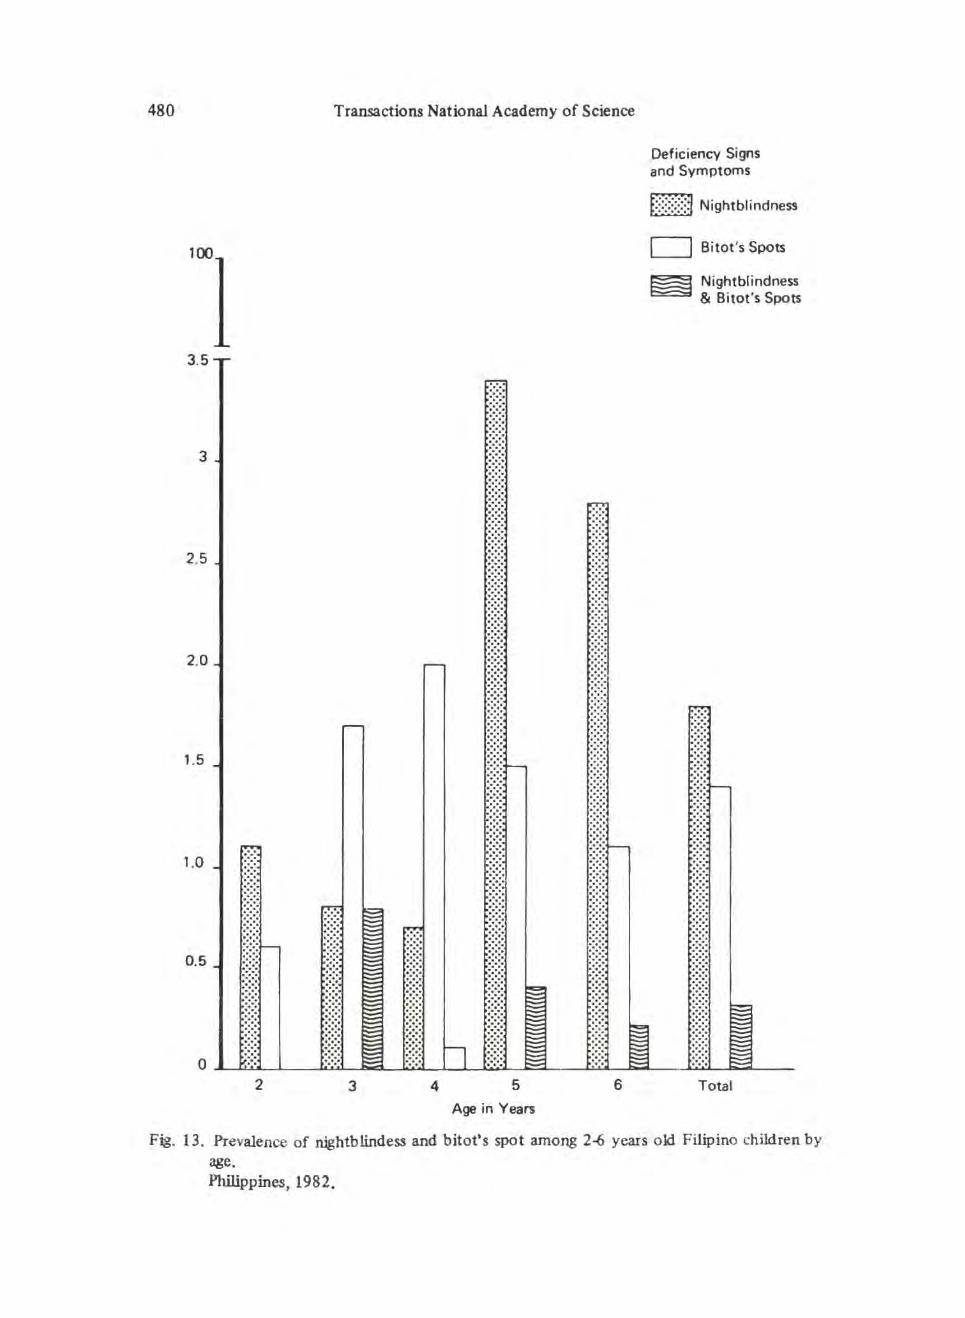
2 . Vitamin A deficiency. Clinical assessment of vitamin A deficiency in the 1982 survey included nightblindness and Bitot's spots among 2-6 years old Filipino children which were 1.6% and 1.4% respectively, indicating that vitamin A
deficiency is a public health problem. The highest prevalence in nightblindness was among the 5-6 years old while that of Bitot's spots was on the 3-5 years old (Fig. 13). The highest prevalence of both nightblindness and Bitot's spots were in the 3-year old. The clinical fmdings of vitamin A deficiency may be closely
476 Transactions National Academy of Science
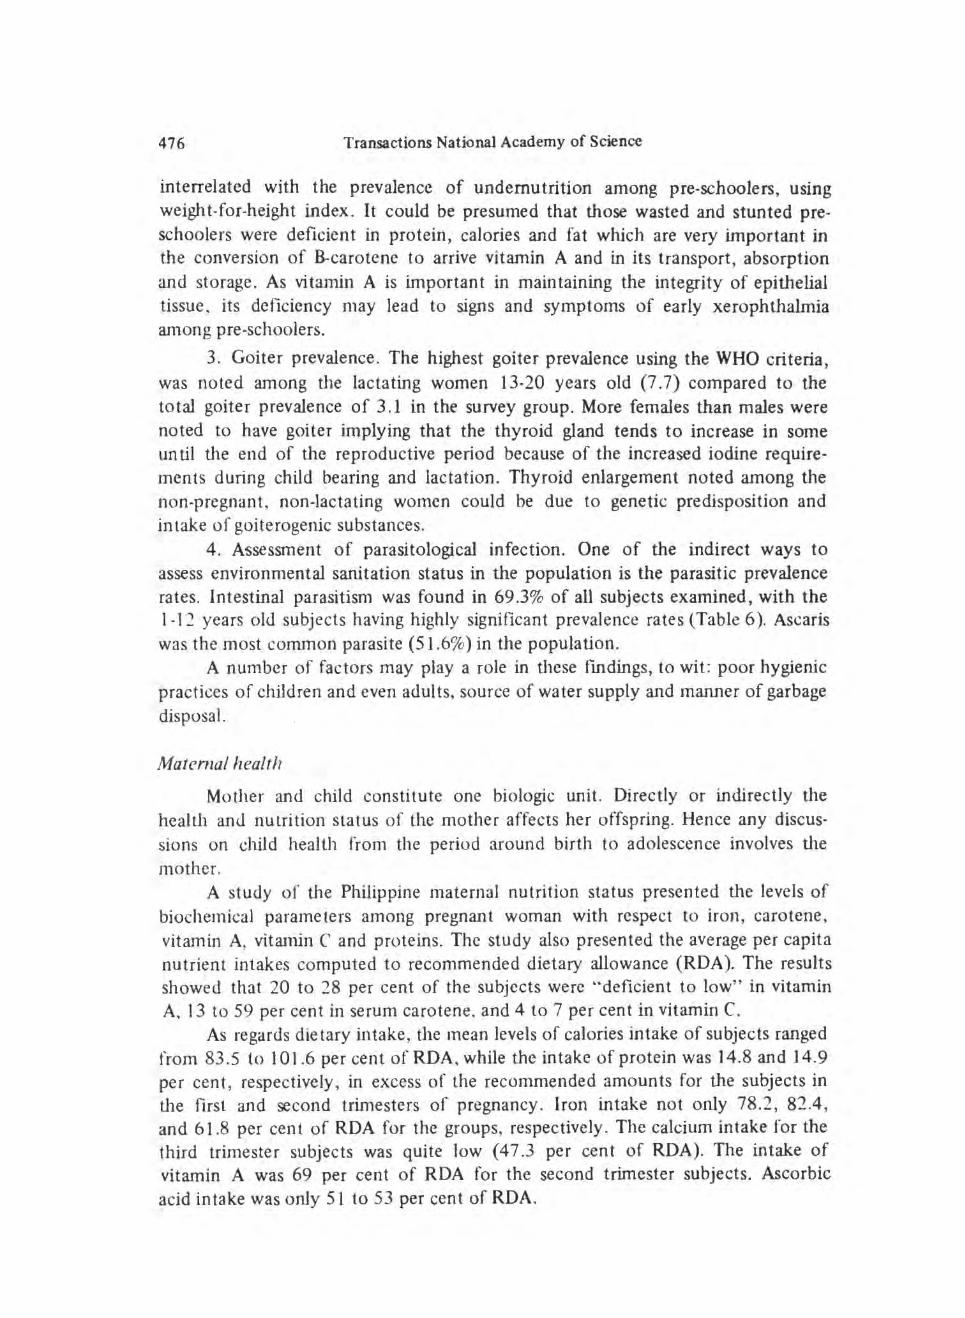
interrelated with the prevalence of undernutrition among pre-schoolers, using weight-for-height index. It could be presumed that those wasted and stunted preschoolers were deficient in protein, calories and fat which are very important in the conversion of B-carotene to arrive vitamin A and in its transport, absorption and storage. As vitam.in A is important in maintaining the integrity of epithelial tissue, its deficiency may lead to signs and symptoms of early xerophthalmia among pre ~schoolers.
3. Goiter prevalence . The highest goiter prevalence using the WHO criteria , was noted among t11e lactating women 13-20 years old (7. 7) compared to the total goiter prevalence of 3.1 in the survey group. More females than males were noted to have goiter implying that the thyroid gland tends to increase in some until the end of the reproductive period because of the increased iodine requirements during child bearing and lactation. Thyroid enlargement noted among the non-pregnant, non~lactating women could be due to genetic predisposition and intake o f goiterogenic substances.
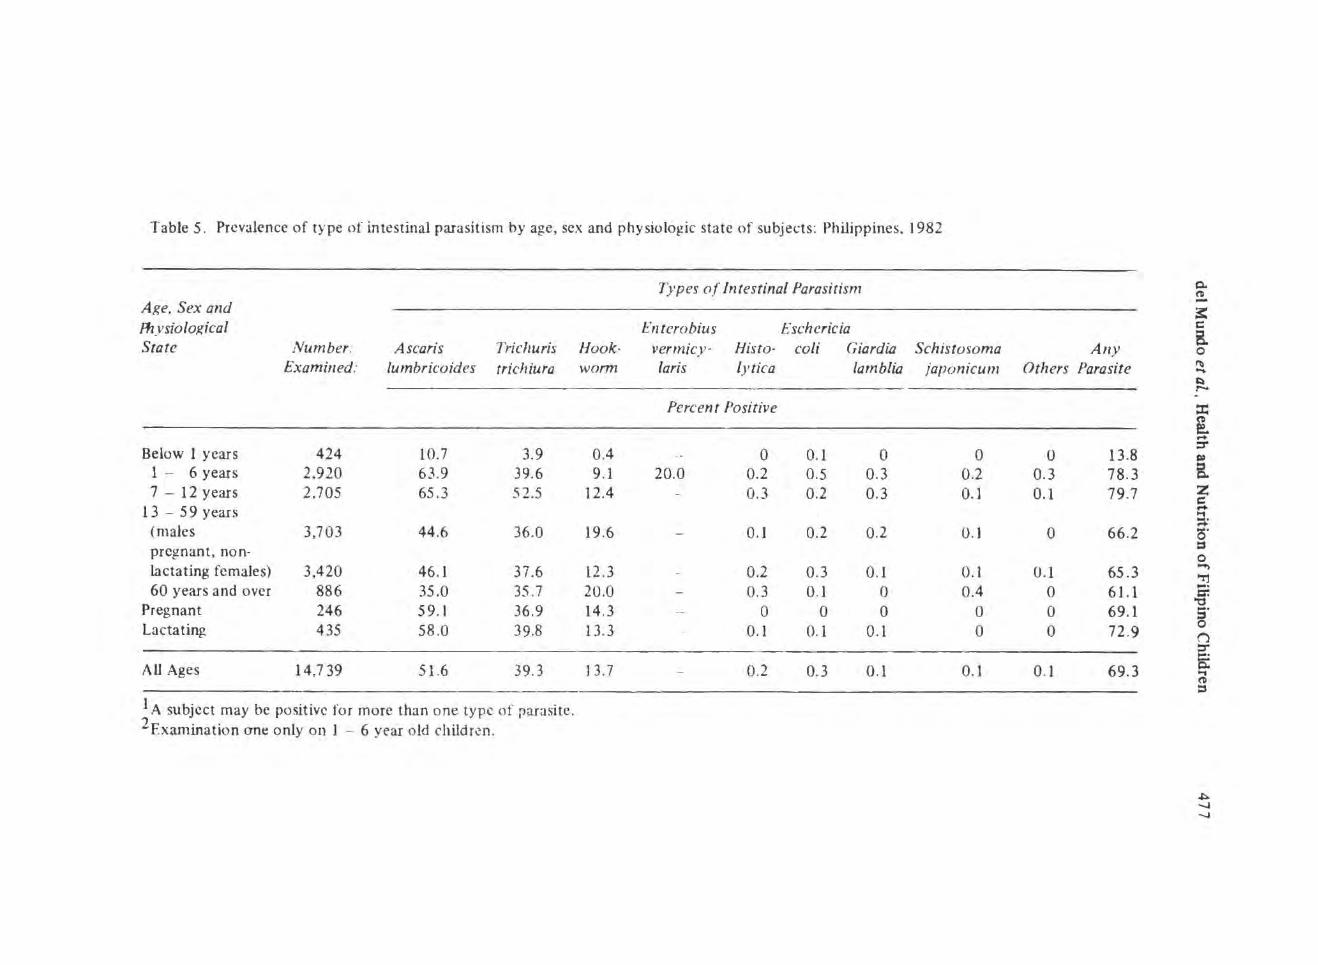
4. Assessment of parasitological infection. One of the indirect ways to assess environmental sanitation status in the population is the parasitic prevalence rates. Intestinal parasitism was found in 69.3% of all subjects examined, with the 1-12 years old subjects having highly significant prevalence rates (Table 6 ). Ascaris was the most common parasite (51 .6%) in the population.
A number of factors may play a role in these fmdings, to wit : poor hygienic practices of children and even adults, source of water supply and manner of garbage disposal.
Matenzal health
Motl1er and child constitute one biologic unit. Directly or indirectly the health and nutrition status of the mother affects her offspring. Hence any discussions on child health from the period around birth to adolescence involves the mother.
A study of the Philippine maternal nutrition status presented the levels of biochemical parameters among pregnant woman with respect to iron, carotene, vitamin A, vitamin C and proteins. The study also presented the average per capita nutrient intakes computed to recommended dietary allowance (RDA). The results showed that 20 to 28 per cent of the subjects were .. deficient to low" in vitamin A. 13 to 59 per cent in serum carotene. and 4 to 7 per cent in vitamin C.
As regards dietary intake, the mean levels of calories intake of subjects ranged from 83 .5 to 1 01 .6 per cent of RDA, while the intake of protein was 14.8 and 14.9 per cent , respectively, in excess of the recommended amounts for the subjects in the first and second trimesters of pregnancy. Iron intake not only 78.2, 82.4 , and 61.8 per cent of RDA for the groups, respectively . The calcium intake for the third trimester subjects was quite low ( 4 7 .3 per cent of RDA). The intake of vitamin A was 69 per cent of RDA for the second trimester subjects. Ascorbic acid intake was only 51 to 53 per cent of RDA.
Table 5. Prevalence of type of intestinal parasitism by age, sex and physiolo~ic state of subjects: Philippines. 1982
Types of Intestinal Parasitism Age, Sex and Fhysiolo}{ical Enterobius Eschericia State Number: Ascaris Trichuris Hook- vermicy· His to· coli Giardi£1 Schistosoma
Examined: lumbricoides trichiura worm laris lytic a lambli£1 japonicum
1 A subject may be positive for more than one type of parasite. 2Examination one only on 1 - 6 year o ld children.
Any Others Parasite
0 13.8 0.3 78.3 0. 1 79.7
0 66.2
0.1 65.3 0 61.1 0 69.1 0 72.9
0.1 69.3
0. (I -3: c B. 0 ~ .... ~ r-. :t: ~ ... :r
B. z c ... ~ (5' t:S 0 ...., "rj ~· cr.
"1:1 .... 5 ('j
~ (I :s
~ -...J -...J
478 Transactions National Academy of Science
The maternal mortality rate in 1975 was 1.4 per 1000 live births and 1.1 in 1979. The leading causes of maternal mortality in 1975 were hemorrhages (51.3%), hypertension (13 .8%) and abortion {11.3% ). By 1981 7 4.3% of birth occurred in the homes and 17.0% in hospitals, 2.5% in clinics and 6.2% in puericulture centers.
Basic health indicators
These are measures of progress commonly referred to as health indicators and include infant mortality , life expectancy and literacy. They represent aspirations of most nations and arc efforts for wider progress as well as measures of specific achievements. Thus infa11t Mortality Rate rctlects availability of safe water, mother's health and nutrition and quality of the home environment. Liter<Jcy ra tes represent the percen tagc of those over I 0 who can read and write but for the poor to contribute to and benefit from the process of development. Life expectancy conveys quality of life and chances of death.
These indicators were incorporated in the targets.of the International Development for the 1980s and were adopted by the UN General Assembly as goals for all nations to ailn at by the year 2000. specifically IMR of 50 or less an average life expectancy of 60 or more and acquire lasting literacy requiring that every child should have at least 4 years of primary school education.
Table 6. Philippine development indicators on health.
Indica tors 1972 1982 1983
Life E:-..pcctancy (in years) 57.0 62.6 62.5 Infant Mortality Rate
(per 1.000 live births) 78.4 60.6 59.3 Crude Death Rate
(per I ,000 population) 10.3 8.4 8.2 Hospital Bed-Population
Ratio 1:8 15 1:612 1:615 No. of Rural Health Units
(cumulative) I ,7 05 * 2,019 No. of Barangay Health Stations
del Mundo et al., Health and Nutrition of Filipino Children
51.3
37.2
32.0 31 .0 n n n 27 .0
n I
I I I I I I
14.9 I I f I
- t.O N 0')- 0'>1-(!)(/.l UJ
~ . - l!')(f) L.C?zzw > - I •W
0 ,...... M_J M<(-_J 0
<1> -<( -zt-<! co
co :E (!)<!:E <( wt-w cXS a:Uu.. Cl.<( ~ , _I z · oz zO
z
H~. 12. PrcvaJcncc of anemia by age, St!X and physiological state
Philippines, 1982.
Source: Phil. Journal of Nutrition, April-June, 1985
I I I I
I I l
479
26.6
n I I ! I .
_J <( \--0 t-
480
100
3.5
3
2.5
2.0
1.5
1.0
0.5
0 2
Transactions National Academy of Science
3 4 5
Age in Years
6
Deficiency Signs and Symptoms
6]3 Nightblindness
D Bitot's Spots
Nightblindness & Bitot's Spots
Total
Fig. 13. Prevalence of nightblindess and bitot's spot among 2~ years old Filipino children by age. Philippines, 1982.
del Mundo et al., Health and Nutrition of Filipino Children 481
Infant mortality rates (IMR)
Infant mortality rate, or the number of deaths below one year per thousand live births, is considered one of the most sensitive indicators of progress in children. It has been fittingly stated that IMR is the most revealing measures of how well a society is meeting the needs of its people. It reflects not only per capita stocks of food, clean water ~ and medical care but also the actual availability of such amenities to all members of the population.
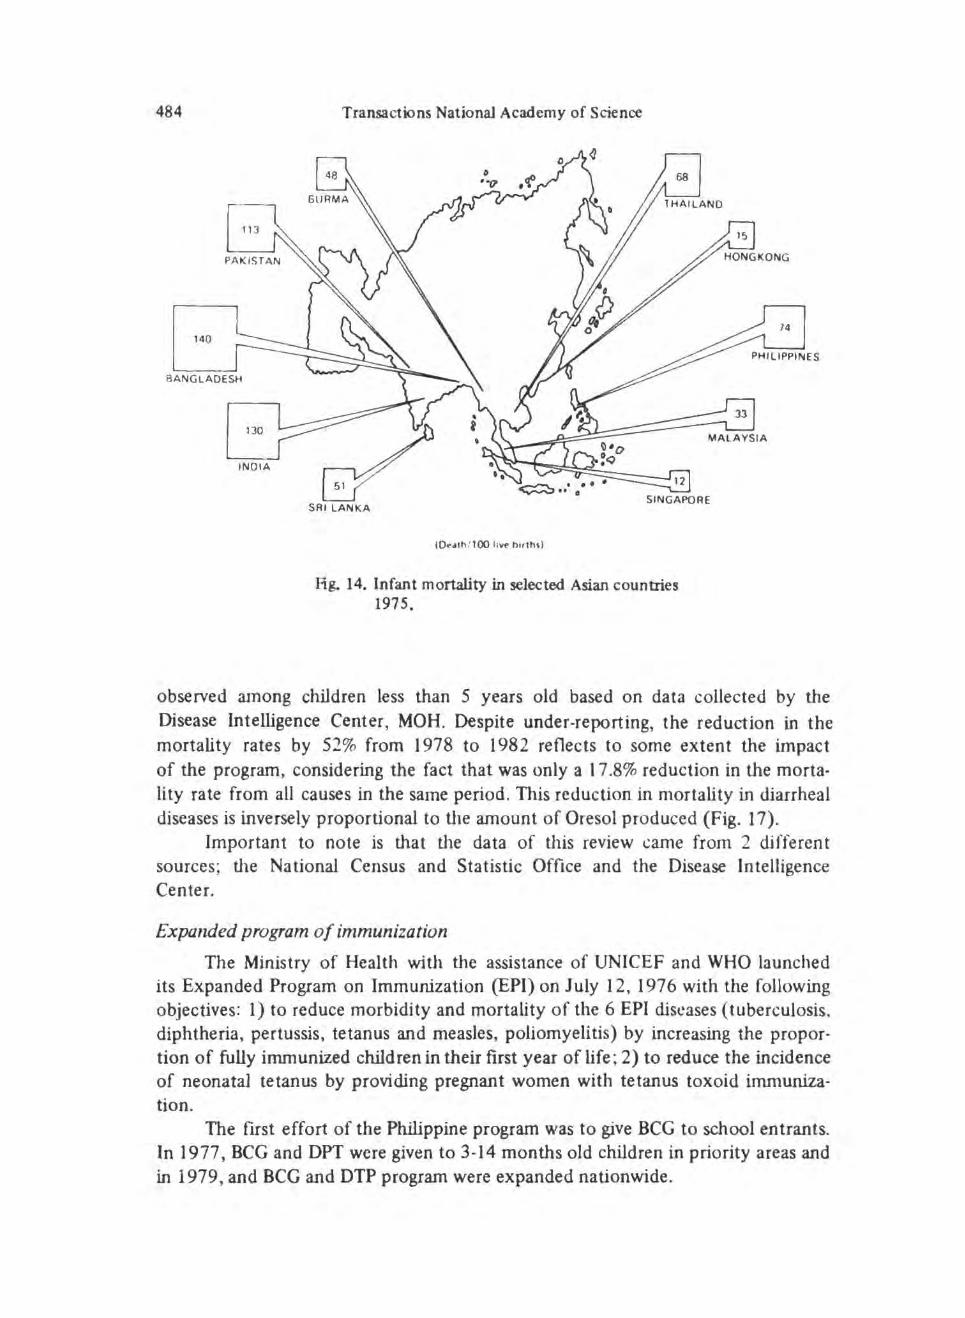
IMR is increasingly important not only because of the health aspects and effects on the quality of life but also because of its social and economic iJnplication and effects on national development. A graphic presentation of IMR in selected Asian countries is shown in Fig. 14.
In the Philippines, the IM R has decreased over the 1 0-year period under review, from 76.5 in 197 3 to 59.3 in 1983 (Fig. 1 ). The infant death rate curve has shown an irregular but marked declining trend . An all time low IMR for the country was observed in 1978 (53 .1). Mortality during the first 6 days of life account for 32.8% of infant deaths.
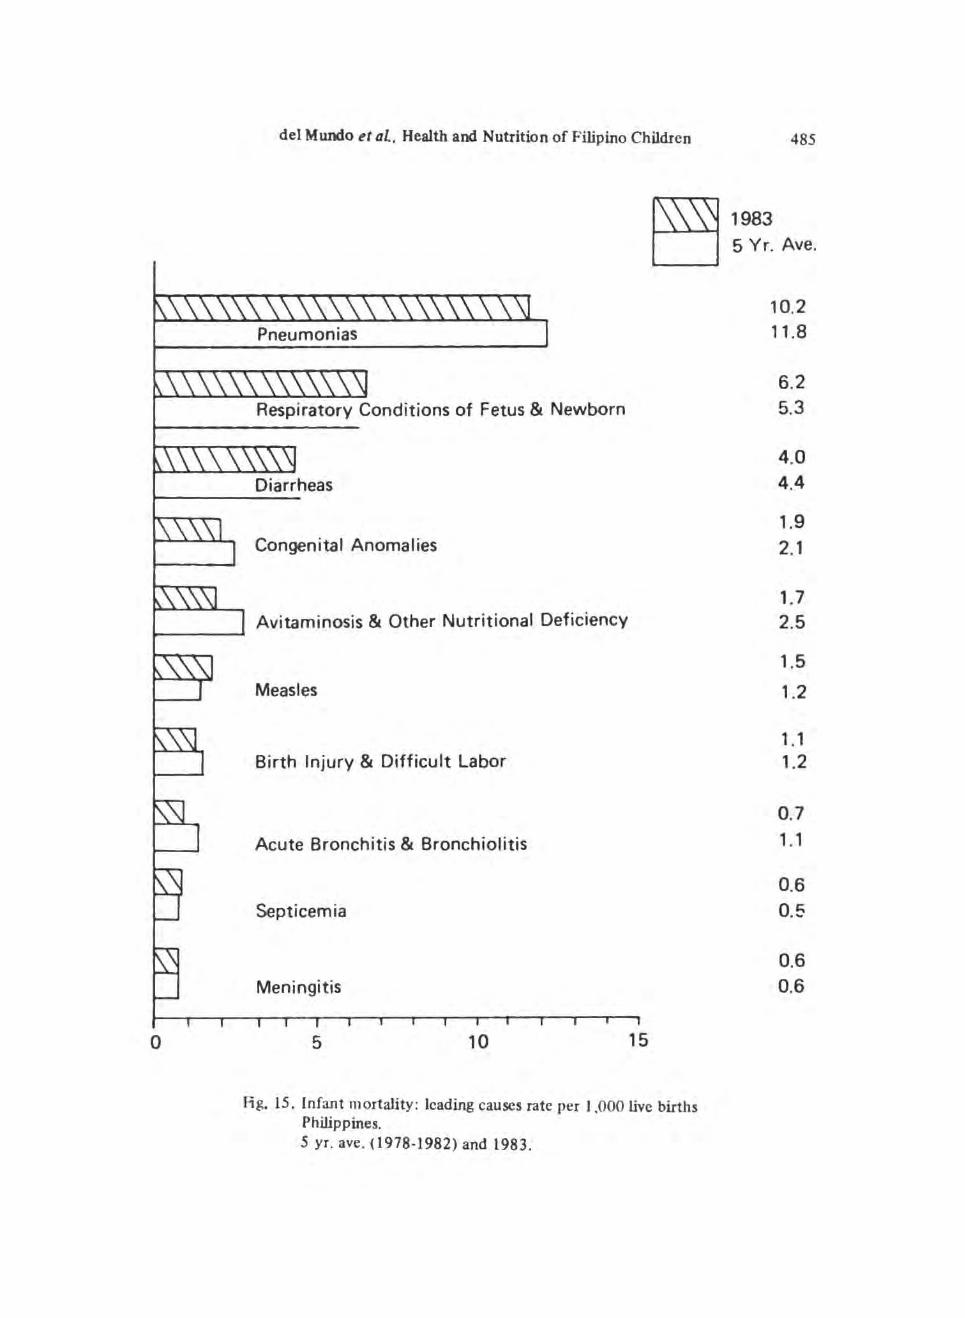
The leading causes of infant mortality are shown in Fig. 15 in practically the same order and with very slight differences from year to year. Pneumonias and gastroenteritis take the lead each year; seven (7) out of the ten causes are due to infections.
Life expectancy
Estimates indicate that the expectation of life at birth, or the average number of years that a baby,born during a specific period can expect to live , has accelerated to reach around 61 years in 1973 ; the increase has been slow but steady to 62.5 in 1983.
Table 7. Life expectancy in years (Projection only)
The national literacy rate of Filipinos 10 years and over was 83 .4% in 1975 and 82.7% in 1980. The urban literacy rates were higher than the rural rates with an average urban-rural difference of 12.9%. Despite this impressive record, studies show that college freshmen are poorly prepared for language skills. mathematics and the sciences.
The proportion of private household population 10 years old and over are able to read and write has slightly decreased from 83 .36% to 82.72%. This however may be due to sampling errors. There was no difference in the literacy rate of males (82 .82%) and females (82 .63%) as of 1980. There is a higher rate of literacy in urban areas than the rural areas which is to be expected in view of the concentration of schools and accessibility in urban areas.
Table 8. •Private household population 10 years old and older who were able to read and write
Total Male Female
1970
8 3. 36'f~.
1980
82.70"k 82.62% 82 .63<;~
• Private household population 7 years old and over by highest grade completed. Philip· pines 1975-1980.
Male Female
C:rtUie birth rate
Urban
93 .04% 92 .()'};
1980
Rural
76 .70% 76 .35%
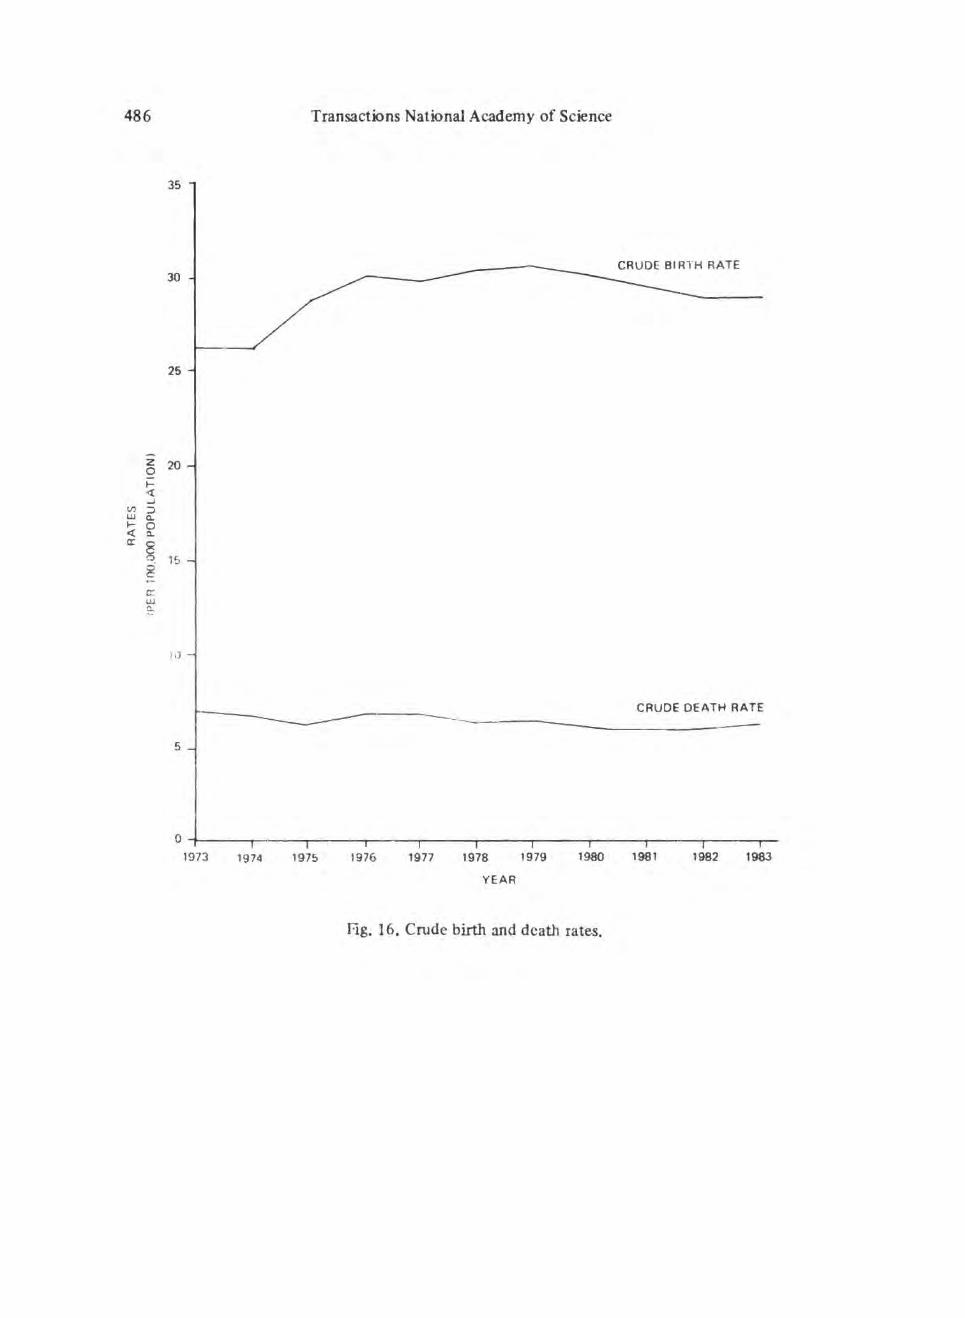
The crude birth rate which indicates the general magnitude of the fertility level of the population, has increast!d from 26.1 per 1,000 population in 1973 to 29.0 per I ,000 population in 1983, registering an 11 .1% increase in the 10-year span. The rates increased gradually with the highest (30.7%) rate being noted in 1979. followed by a gradual decline up to 1983 (Fig. 16). The lowest crude birth rate recorded was 24.8 per I ,000 population in 1972. Although the ~rude birth rate has shown a general declining trend since 5 decades ago, changes were rather slow and irregular.
del Mundo et al, Health and Nutrition of Filipino Children 483
Cnlde death rate
The crude death rate is a measure of the average risk of death of the population at large. It has decreased by 10% from 7/1000 population in 1973 to 6.3/ 1000 population 1983 as shown in Fig. 16 representing 327,260 deaths. This pattern of a general downward trend with slight thoughts as has been the pattern for the past 4 decades.
Programs and Strategies
Primary health care (PIIC)
It will be recalled that in 1978 a global conference was held in Alma Ata. Russia. in which PHC was promulgated and adopted by 130 nations. A bask approach was developed towards the provision of health services that are accessible, affordable and sustainable by the community. This brings health care closer to the children and their families and reaches out as far as possible to where people live, work and survive. PHC has been adopted and implemented in the Philippines as a national program and a major health activity since Octo her 19. 1979. DOH was directed to design and develop programs which will focus on health development at the community level particularly in rural areas and utilizing PHC
system to control and eradicate the immediate and specific health problems in Philippine communities.
In general the objective of PHC is to mobilize conununities and make thetn participate effectively in identifying their health needs and in providing their solutions through self-reliance and self-determination. Components of PHC are: a) health education; b) MCH and family planning; adequate food supply and proper nutrition ; c) environmental sanitation~ including adequate supply of safe water; prevention of communicable diseases ; the use of essential drugs.
1Vational program for the control of dia"heal diseases
The National Program of the Control of Diarrheal Diseases (CDD) of the ~linistry of Health (MOH) was formerly launched in October, 1980 with the following objectives. 1) to reduce mortality from the diarrheal diseases among children less than 5 years old by 7 5% in 1987 through extensive use of Oresol and 2) to bring down diarrhea morbidity by 50% in 1987 through strengthening the components of Environmental Sanitation, Nutrition, Maternal and Child Health, Surveillance, Epidemic Control and Health Education.
Oresol production, was started in 1977 on a smaii ~:(~ole and in 1980, its production has inaeascd 12.6 times.
After 4 years of implementation, the impact of the COD Program was eva
luated jointly by representatives of the MOH, WHO, UNICEF and USAID from January 28 - February 11, 1985. A report on the comprehensive program review has shown that some impact on the mortality from diarrheal diseases has been
484
140
Transactions National Academy of Science
SRI LANKA
CDt-<llh / 10() livr bHlh\ )
Hg. 14. Infant mortality in selected Asian countries 1975.
74
observed among children less than 5 years old based on data collected by the Disease Intelligence Center, MOH. Despite under-reporting, the reduction in the mortality rates by 52% from 1978 to 1982 reflects to some extent the impact of the program, considering the fact that was only a 1 7.8% reduction in the mortality rate from all causes in the same period. This reduction in mortality in diarrheal diseases is inversely proportional to the amount of Oresol produced (Fig. I 7).
Important to note is that the data of this review came from 2 different sources; the Na tiona! Census and Statistic Office and the Disease Intelligence Center.
Expanded program of immunization
The Ministry of Health with the assistance of UNICEF and WHO launched its Expanded Program on Immunization (EPI) on July I 2, 1976 with the following objectives: I) to reduce morbidity and mortality of the 6 EPI diseases (tuberculosis. diphtheria, pertussis, tetanus and measles, poliomyelitis) by increasing the proportion of fully immunized children in their first year of life; 2) to reduce the incidence of neonatal tetanus by providing pregnant women with tetanus toxoid immunization.
The first effort of the Philippine program was to give BCG to school entrants. In 1977, BCG and OPT were given to 3-14 months old children in priority areas and in 1979, and BCG and DTP program were expanded nationwide.
0
del Mundo d aL, Health and Nutrition of Filipino Children
Congenital Anomalies
Avitaminosis & Other Nutritional Deficiency
Measles
Birth Injury & Difficult Labor
Acute Bronchitis & Bronchiolitis
Septicemia
Meningitis
5 10 15
Fig. 15 . Infant mortality: leading causes rate per 1,000 live births Philippines. 5 yr. ave. (1978-1982) and 1983.
Hg. 17. Relationship of mortality rates from all causes and from diarrhea diseases with oresol* production. Philippines, 1978-1982.
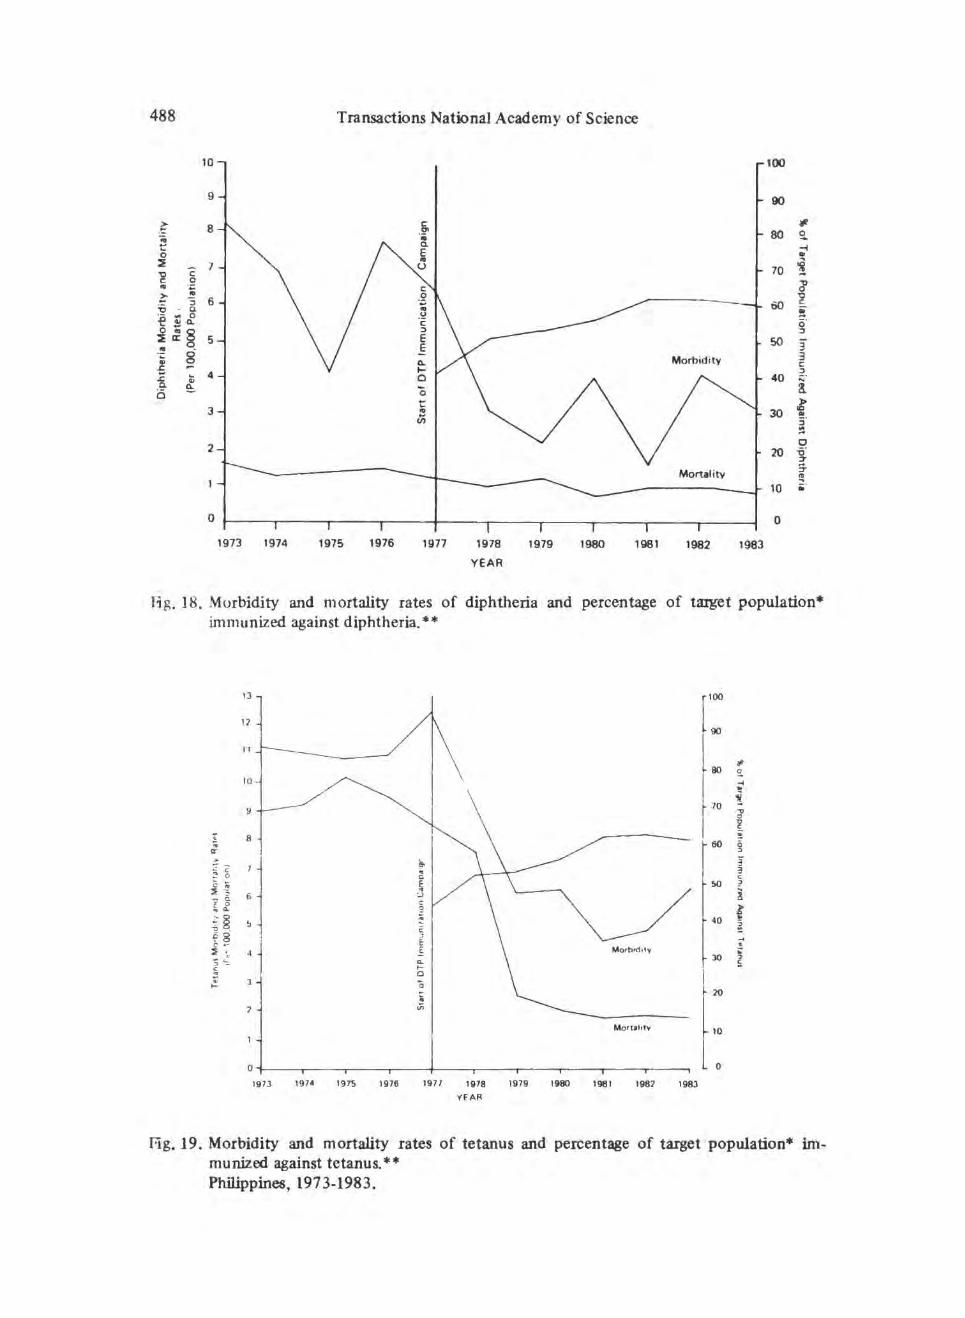
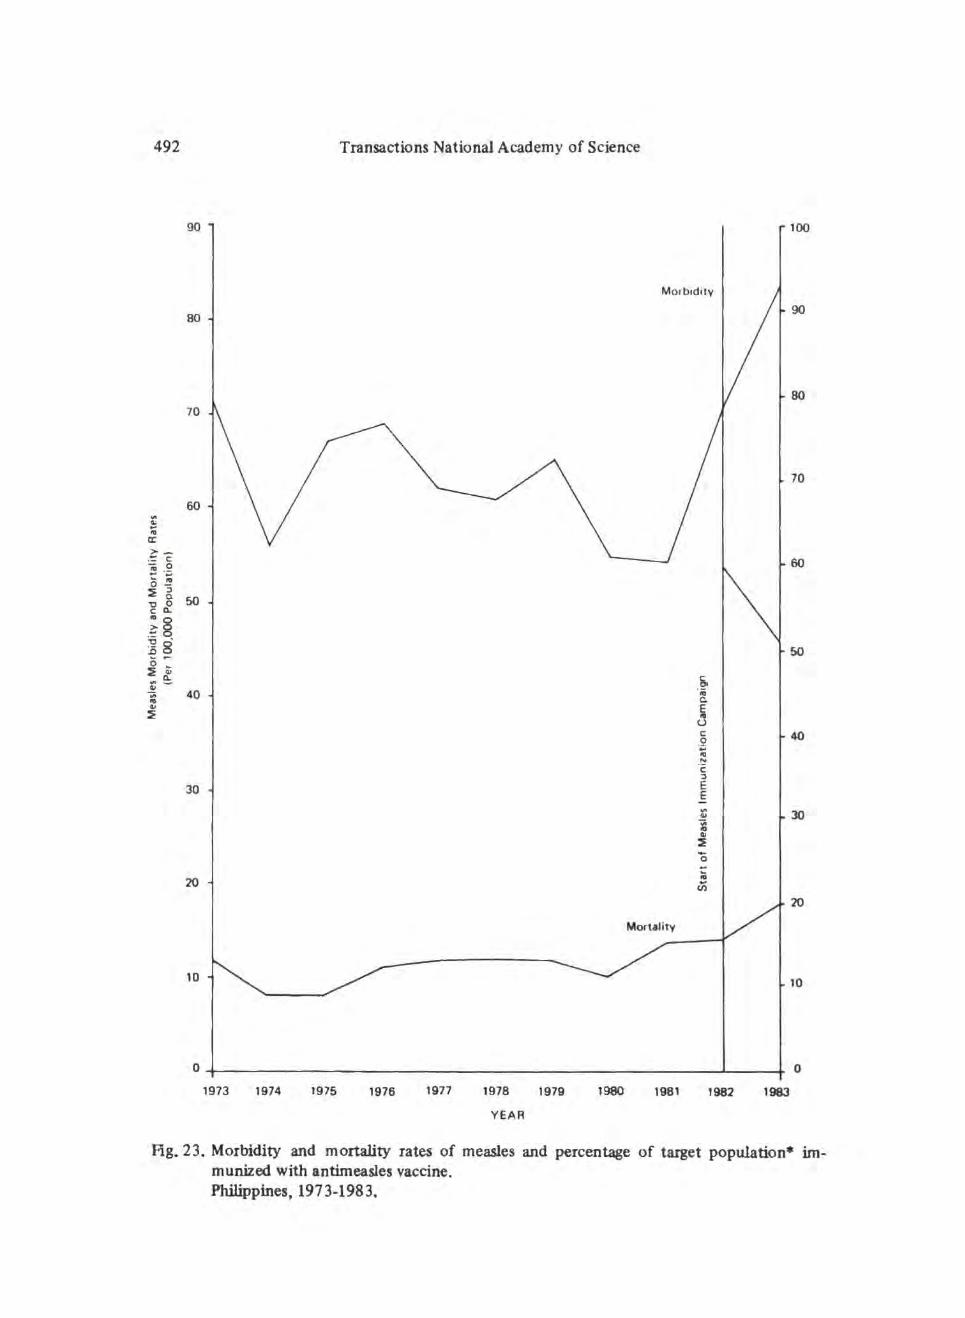
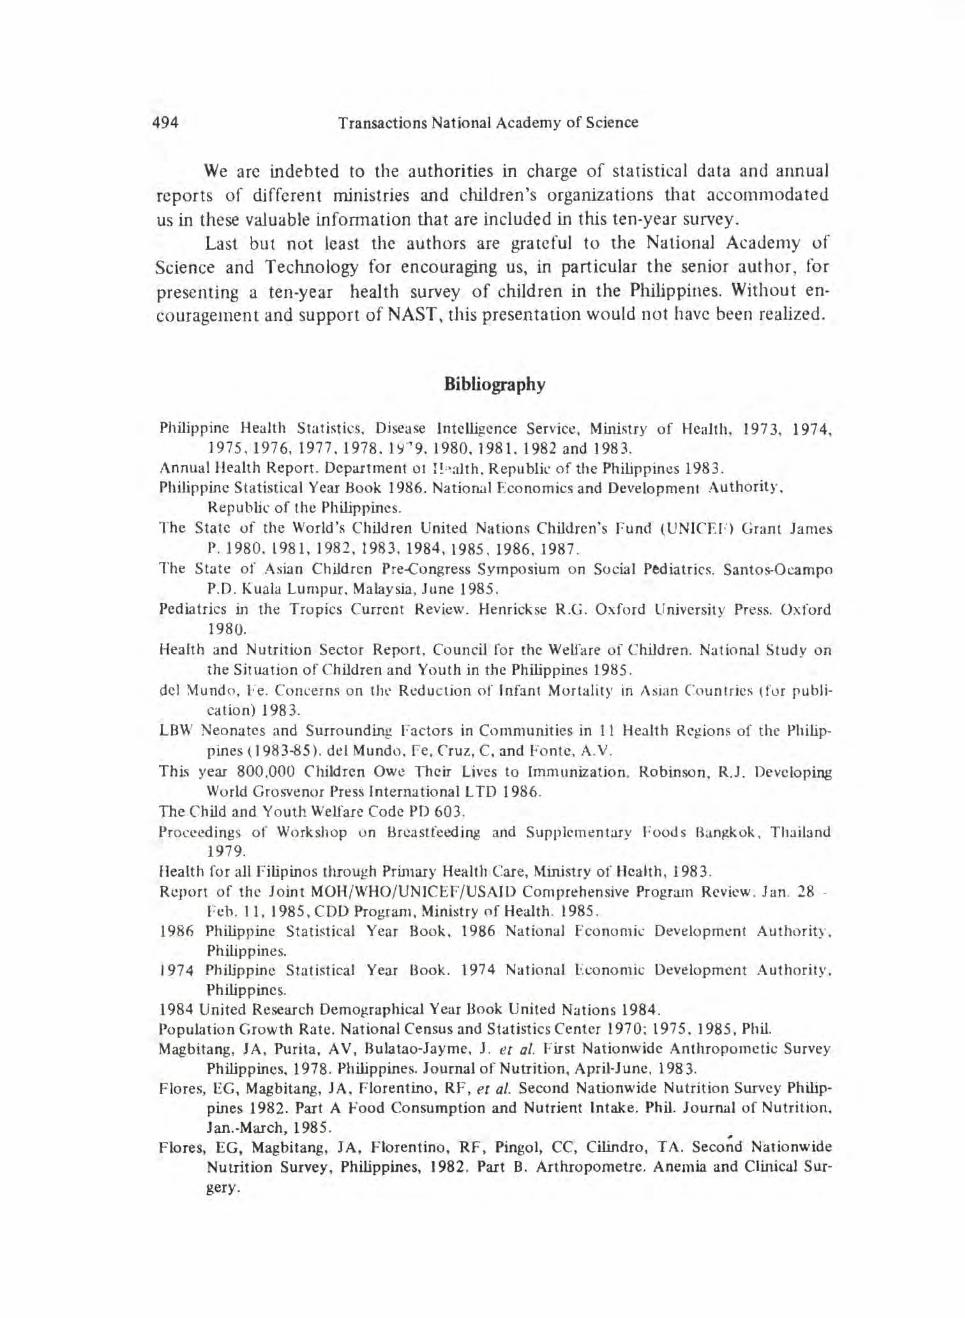
Oral polio vaccine was started in 1980 an10ng 3-14 months old children. In the same year, tetanus toxoid for pregnant women was given nationwide. Measles vaccination started recently in 1982 . Figs. 18-23 are shown the morbidity and mortality rates of the 6 immunizablc diseases among children 0-6 years old from 197 3 to I 983. Superimposed on these are the percentage of coverage of the vaccines
·~n their target-ed population.
There is a significant and sustained drop in the morbidity and mortality rates of poliomyelitis, diphtheria, pertussis and tuberculosis noted after the start of immunization campaigns on the specitlc diseases in a nationwide scope. Antimeasles .iJnmunization started in 1982 so that it would be too early to assess its effect on the morbidity and mortality rates of the disease .
Promotion of breastfeeding
Aware of the universally recognized fact that the unfavorable trend from breast to bottlefecding is detrimental to progress in nutrition and survival of infants , a ,.;ampaign to promote breastfeeding has been undertaken in the Philipp~nes, first through private individuals and groups but eventually under goverrunent leadership, through retraining of its personnel, using mass media to publicize superiority of breastfeeding over artificial formulas and instructions in hospitals and health centers. The present program in urban communities aims to change
lay and medical attitudes, including hospital routines adverse to breastfeeding promotion.
488 Transactions National Academy of Science
10 100
9 90
.~ 8 s. #
... ·~ 80 ~ t:: -1 0 ~ .. 2: ....
7 u 70 '! ~ c ... ·~ l > !! 6 .':: :) 60 'Q • Q ! ·- "" 0 -e~(l. g· :i~§ 5 50 3 ... . ·;: 8 3 £ c
fig. 22. Morbidity and mortality rates of poliomyelitis and percentage of target population immunized against poliomyelitis. Philippines, 1973-1983.
Quolcd in the llJ84 UNICEF report is the observation that in the Philippines by encouraging breastfeeding instead of bottlefeeding among newborns at Baguio General Hospital. dinical infections were reduced by 88%, diarrheas by 93% and infant mortality by 95%.
A study of the incidence of breastfecding in Luzon in 1974 indicated thal this is practised by only 52% of mothers in Luzon, with 2lh times by percentage of breastfeeding mothers in rural than in urban areas. On the other h;tnd, mixed and bottle feeding are practised more often by urban than by rural mothers. Notably there are low diarrheas cases in rural areas where by getting is still the practice .
The International Code on the Marketing of Breast Milk substitutes which· was readily adopted by 35 nations in 1981 to change marketing procedures has increased to 130. Political will has decidely given momentum to the promotion of breastfeeding. Favorable effects have been observed and commended as an
effective measure to reduce the "most unnecessary malnutrition of all". In the Philippines, the Code was fmally signed by the President in January, 1987.
Hg. 23. Morbidity and mortality rates of measles and percentage of target population• immunized with antimeasles vaccine. Philippines, 1973-1983.
del Mundo et al, Health and Nutrition of Filipino Children 493
Summary
A study of the trend in the health and nutrition of Filipino from birth to 19 years old was conducted for the decade 1973 to 1983 . The main objective is to gather data and information on the attainment and achievement of a decade by agencies in government or in private concerns, whether as individuals or in groups and to determine problems and possible solutions to improve quality of life of the future citizens and resources of the country.
As in most developing countries, children in the Philippines constitute the large proportion of the population (52 .9%) in 1983. This large young dependent sector necessarily have exerted pressures on the resources and facilities of the country.
Basic health and development indicators of the country show a life expectancy in 1983 of 62.5 years (an increase of 2.4% during the decade); an Infant Mortality Rate of 59.3 (a de~rease of22.5) and a Literacy Rate of 82.7.
Trends in these indicators show an improvement in the quality of life brought about by m~my factors including improv~d health and nutrition services and increased health education activities.
The morbidity and mortality rates have declined, particularly for the immunizable diseases (TB, 'diphtheria, tetanus, whooping cough, poliomyelitis and measles and also tetanus for mothers). The use of oral rehydration therapy has helped reduce mortality from diarrheas. In general, communicable diseases death rates decrease~ by 28.6. In the case of tuberculosis, mortality in this age group decreased hy 15%. Pneumonias remain as a major health problem.
The nutritional status of pre~schoolers with weights higher than 75% of Filipino stan'dard weight for age has ~proved by 8% in 1983.
Maternal death rate has decreased by 28.6% during the period under review. The leading causes of deaths were hemorrhages 5 1.3%, hypertension (13.8%) and abortion (ll.J,% ). More mothers delivered in the hospitals (74.3%) which was 75 to 78%· early in the decade. Maternal nutrition studies has shown that a small percentage had low levels of Vit. A and Vit. C while iron take was less than the recommended dietary allowance for the 3 trimesters, the lowest was in the last trimester.
An overall improvement in the health and nutritional status of children 0~ 19 years in the decade 1973 to 1983 is reported, although this may not be impressive nor highly significant.
Acknowledgment
The authors are grateful to Dr. Mario Romero and Mr. Diosdado Caracaz, who ably and patiently accomplished the figures and illustrations and to the clerical staff of the Children's Medical Center OPD, particularly Mrs. Julieta G. Morado, for the manuscripts during the presentation preparation and the fmal fonns.
494 Transactions National Academy of Science
We arc indebted to the authorities in charge of statistical data and annual reports of different ministries and children's organizations that accommodated us in these valuable information that are included in this ten-year survey.
Last but not least the authors are grateful to the National Academy of Science and Technology for encouraging us, in particular the senior author, for presenting a ten-year health survey of children in the Philippines. Without encouragement and support of NAST, this presentation would not have been realized .
Bibliography
Philippine Health Statistics, Disease Intelligence Service, Ministry of Health, 197 3. 197 4, 1975,1976, 1977 . 1978 . 1~{7 9.1980, 1981.1982 and 1983.
Annual Health Report. Department ot }! ; ~alth. Republic of the Philippines 1983. Philippine Statistical Year Book 1986. National Economics and Development Authority.
Republic of the Philippines. The State of the World's Children United Nations Children's f-und (UNICEF) Grant James
P. l980. 1981,1982 ,1983, 1984,1985 . 1986,1987. The State of Asian Children Pre-Congress Symposium o n Social Pediatrics. Santos-Ocampo
P.O. Kualli Lumpur. Malaysia, June 1985 . Pediatrics in the Tro pics Current Review. Henrickse R.G . Oxford University Press. Oxford
1980. Health and Nutrition Sector Report , Council for the Welfare of Children. National Study on
the Situation of Children and Youth in the Philippines 1985 . del ~undo, Fe. Concerns on tht' Reduc tion of Infant Mortality in Asian Countries (for publi·
cat ion) 1983. LBW Neonates and Surrounding Factors in Communities in ll Health Regions of the Philip
pines ( 1983-85). del Mundo. Fe, Cruz, C. and Fonte. A.Y.
Thi" year 800.000 Children Owe Their Lives to Immunizat ion. Robinson, R.J. Developing World Grosvenor Press International L TO 1986.
The Child a.nd Youth Welfare Code PD 603. Proceedings of Workshop o n Brcastfeeding and Supplementary Foods Ban~ok , Thailand
1979. Health for all Filipinos through Prin1ary Health Care, Ministry of Health, 1983. Report of the Joint MOH/ WHO/ UNICEF/USAID Comprehensive Program Review . 1 an. 28 -
Feb. 11, 1985, COD Program, Ministry of Health. 1985 . 1986 Philippine Statistical Year Boo k, 1986 National Fconomi~ Development Authority.
Philippines. I 97 4 Philippine Statistical Year Book. 197 4 National Eoonomic Development Authority.
Philippines. 1984 United Research Demographical Year Book United Nations 1984. Population Growth Rate . National Census and Statistics Center 1970; 197 5. 1985, Phil. Magbitang, J A, Purita, A V, Bulatao-Jayme, J. et a/. First Nationwide Anthropomctic Survey
Philippines, 1978. Philippines. Journal of Nutrition, April-June, 1983. Flores, EG, Magbitang, JA, Florentino, RF, et al. Second Nationwide Nutrition Survey Philip
pines 1982. Part A Food Consumption and Nutrient Intake . Phil. Journal of Nutrition. Jan.-March, 1985. ,
Flores, EG, Magbitang, JA, Florentino, RF , Pingol, CC, Cilindro, TA. Second Nationwide Nutrition Survey, Philippines, 1982. Part B. Arthropometrc. Anemia and Clinical Sur· gery.