20
EViews Training The Basics: EViews Desktop, Workfiles and Objects Note: Data and Workfiles for examples in this tutorial are: Data: Data.xlsx Results: Results.wf1
| Date post: | 18-Jul-2015 |
| Category: |
Economy & Finance |
| Upload: | birasa-fabrice-nyirimana |
| View: | 81 times |
| Download: | 1 times |

EViews TrainingThe Basics:
EViews Desktop, Workfiles and Objects
Note: Data and Workfiles for examples in this tutorial are:
Data: Data.xlsx
Results: Results.wf1

What is EViews?
• EViews is an easy-to-use statistical, econometric, and economic
modeling package.
• There are three ways to work in EViews:
• Graphical user interface (using mouse and menus/dialogs).
• Single commands (using the command window).
• Program files (commands assembled in a script executed in batch mode).
2

EViews Desktop
3
Command
Window
Object
Window/
Work Area

EViews Desktop Details
4
Main Menu
Path/directory Database Workfile
Note: Path/Database/Workfile
can be changed by double-clicking in each.
EViews Workfile and Objects
• EViews does NOT open up with a “blank” generic document
(unlike Word ®, Excel ®, etc.).
• EViews documents (aka “workfiles”) need to be created and are
not generic (they will contain information about your data, etc.).
• EViews is an “object”- oriented program. Objects are collections
of information related to a particular analysis (series, groups,
equations, graphs, tables).
• Workfiles are holders of these “objects”.
5

Object Types
6
Series, Groups
and Equations
are the most
common objects
in EViews.

EViews Workfile
7
Workfile title bar
Workfile:
Contains at least one
page
Each page contains a
list of objects on that
page
Workfile tool bar
Workfile Window

EViews Workfile (cont’d)
8
Name of the workfile
(Tutorial1_results in this example) Structure of the workfile
The data in this example
is dated and has
quarterly frequency
covering the period from
1980 to 2012.
Range: shows the entire
range of the data in the
workfile. Here the range
is from Q1 1980 to Q4
2012
Sample: This is the part of data we are
currently working with. In this example, the
sample runs from Q1 1992 to Q4 2001.

EViews Workfile and Objects
9
• This screenshot shows a list of
Objects in the workfile.
• It is color-coded by Object type:
Yellow icons are data objects
Blue icons are estimation objects
Green icons are view objects
(tables, graphs, etc…)
• Double clicking on one of these
Object icons will open it up.
• Each Object has its own menu.
• Once an object is open, the menus
in EViews change to represent the
features available for that object.

EViews Workfile and Objects (cont’d)
10
• EViews 8 provides you with a
more detailed look of the objects in
your workfile.
• For the “Details” view, Click on
View → Details +/- on the workfile
toolbar (or double click the
button on the workfile toolbar).
• The view changes as shown here.
• Each object now has a separate
column in the details view.
• You may sort the objects by an
attribute (Name, Type, etc.) by
clicking on the column header.
• You can also resize or drag the
columns which allows you to alter
their position and width.

The Object Window
11
Main menu
Workfile Toolbar
Object Toolbar
(in this example,
equation toolbar)
Object Window
(in this example,
equation window)

The Series Object
12
• This is the main data
object.
• gdp - has a yellow
icon with a little line graph
in it.
• It contains one column of
data.
• Opening a series will
reveal a spreadsheet
view with a single column
showing the data in the
series.

The Series Object (cont’d)
13
To open a Series
1. Double click on the series.
2. Once a series is open, you can click on View and Proc menus in the workfile to see
available actions. Since a Series is a single column of data, only actions for a single
column of data are available (views and tests).

The Group Object
14
• This is a collection of
series objects.
• group01 - has a yellow
icon with a capital G.
• It contains multiple
columns of data.
• Opening a group will
display a spreadsheet view
with multiple columns
showing the data in each
series in the group.

The Group Object (cont’d)
15
To open a Group
1. Double click on .
2. Once a Group is open, you can click on View and Proc menus to see available actions.
Actions that require multiple columns of data are now available (views and tests).
The Equation Object
16
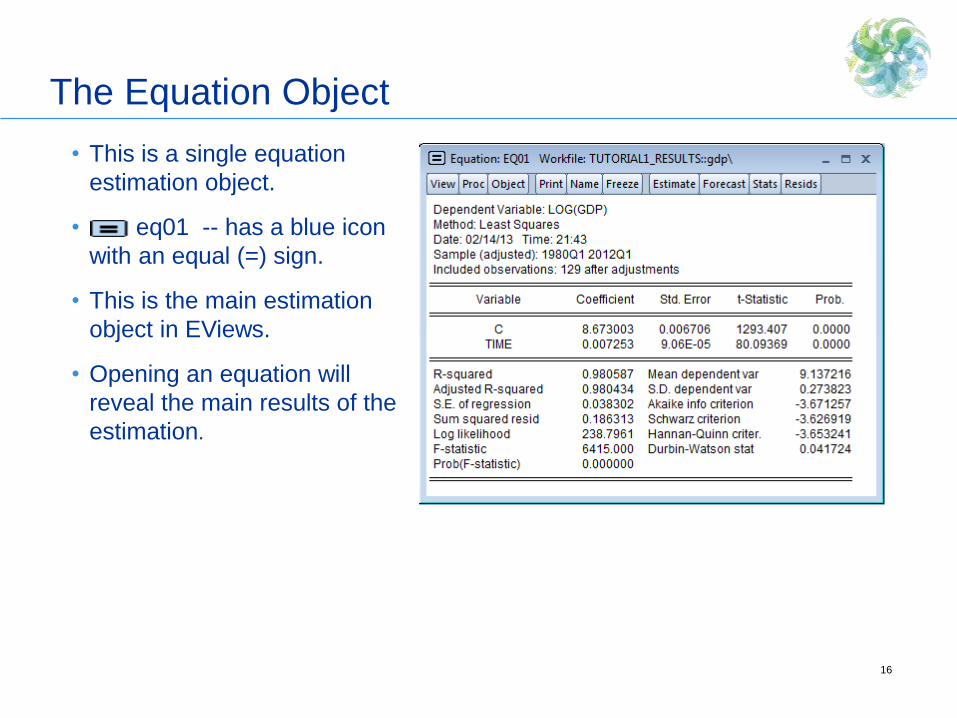
• This is a single equation
estimation object.
• eq01 -- has a blue icon
with an equal (=) sign.
• This is the main estimation
object in EViews.
• Opening an equation will
reveal the main results of the
estimation.

The Equation Object (cont’d)
17
To open an Equation Object
1. Double click on .
2. Once an Equation is open, you can click on View and Proc menus to see available
actions. Some of the items in the View and Proc menus will depend on the type of
Equation that was estimated.

Views Objects
18
• These objects hold “views” of data or estimation objects.
• graph01 - has a green icon.
• It is used to “freeze” a view of another object in time.
To create this view
1. Press the Freeze button
on another object (gdp
series, for example).
2. Use the Name button to
save it in the workfile.
3. Click OK.

Commands
• The command pane provides a scrollable record of the commands typed.
• You can scroll up to view previously executed commands.
• If you hit Enter in any previous lines, EViews will copy the line where the
cursor is and execute that command again.
19

Commands (cont’d)
• To recall a list of previous commands in the order in which they were entered
use “CTRL+UP”. The last command in the list will display in the command
window.
• Hold down the CTRL key and press UP arrow to display previous commands.
• For a record of the last 30 commands, press “CTRL+J”.
20


