42
UKCS Decommissioning July 2019 2019 Cost Estimate Report

UKCS Decommissioning
July 20192019 Cost Estimate Report


Contents
1. Executive summary 42. Introduction 63. Cost Reduction Analysis 12 3.1 Activity Costs 13 3.2 Cost Uncertainty Classification 16 3.3 Cost Management 174. Key Performance Indicators 205. Benchmarking 22
Appendix 1: Methodology 30Appendix 2: Stewardship review process 33Appendix 3: Representation of Cost Uncertainty 37Appendix 4: Benchmarks shown in S Curve Format 38Appendix 5: Probabilistic Cost Distributions 40
All costs in this report are in 2018 prices, based on forecast expenditure in 2019 and after, unless otherwise stated

UKCS Decommissioning Estimate - 20194
1. Executive summary
Figure 1: Decommissioning cost reductions towards 35% reduction target (Like-for-like1)
1 Costs in 2016 prices, for expenditure in 2017 and after
The total cost of decommissioning remaining UK offshore oil and gas production, transportation and processing infrastructure has reduced by 17%, on a like-for-like basis, to £49bn1 compared with a 2017 base-line estimate of £59.7bn1
59.7
39
7%
10%
49
18%
£30
£0
£35
£40
£45
£50
£55
£60
£65
2017 Estimate
2018 Estimate
Reduction
2019 Estimate
Reduction
2019 Estimate
Remainderto achieve
35% Target
IndustryTarget
Dec
om E
stim
ate
(bn)
Progression Towards 35% Target
0%
20%
40%
60%
80%
100%
120%
140%
160%
2016-17 2017-18 2018-19 2019-20 2020-21 2021-22 2022-23 2023-24 2024-25
Frac
tion
of B
asel
ine
(201
7) E
stim
ate
Like
for L
ike
Scop
e C
ompa
rison
UKCS Survey Year - Cost Estimate Year
Cost Estimate Vs Time
P90 P10 P50 Target
35% Industry Target

UKCS Decommissioning Estimate - 2019 5
The 10% cost reduction on a like-for-like basis in 2019, in addition to the 7% achieved in 2018, is primarily driven by continued improvement in planning and execution practices, leading to reductions in the estimated cost of:
• Well Abandonment (P&A) in the Northern North Sea (NNS) and Central North Sea (CNS)
• Post Cessation of Production (COP) platform running costs in the NNS
• Platform and subsea infrastructure removals in the NNS and CNS
• Reduced contingency associated with improved cost estimating definition
There is considerable opportunity for future cost improvements, to meet the targeted UKCS cost reduction target of greater than 35% (to levels below £39bn1), as decommissioning operators and contractors extend industry learning to other offshore assets, and other cost
categories. Threats and uncertainties with the potential to increase costs include inconsistent cost performance of different Operators and cost threats from oil-sector inflation.
Including £2bn for inventory changes since 2017, the total cost of decommissioning remaining UK offshore oil and gas production, transportation and processing infrastructure is estimated at £51bn.
59.71
561491
582
51
£0
£10
£20
£30
£40
£50
£60
£70
2017 Estimate 2018 Estimate 2019 Estimate
Decommissioning Estimate Change(probabilistic bn)
Full portfolio increment (Adjusted for post-2017 inventory changes, inflation, and spend to date)
2017 Like for Like (2017 inventory portfolio, period range, and prices)
Figure 2: Decommissioning Cost estimate changes with time
1 Costs shown in 2016 prices, for expenditure in 2017 and after2 Costs shown in 2017 prices, for expenditure in 2018 and after

UKCS Decommissioning Estimate - 20196
2. IntroductionThe Maximising Economic Recovery (MER) Strategy for the UK sets out a central obligation and supporting obligations, including clarifying the actions and behaviours required for decommissioning. Lower decommissioning costs will help maximise value extraction from the UKCS. For the supply chain, which holds the specialist skills, knowledge and equipment to execute the work, there is a clear and sizeable opportunity to develop an efficient, low cost and exportable industry capability.
The OGA takes a probabilistic approach2,3 to estimating total UKCS decommissioning costs, which takes into account the range of uncertainties inherent in cost estimation. Cost estimates for all fields are provided to the OGA by operators each year via the UKCS Stewardship Survey, with the 2018 survey forming the basis for the 2019 Report.
• Like-for-like estimates1: Cost reductions are measured against the £59.7bn1 baseline calculated in the 2017 report, after inflation-adjusting and like-for-like aligning the portfolio/inventory with that evaluated in 2017.
• Full Portfolio estimate: There have been various changes in the to-be-decommissioned portfolio since 2017. The remaining decommissioning cost for the updated Full Portfolio (i.e. the latest view of remaining inventory, as from the beginning of each report year) is also calculated.
1 Costs shown in 2016 prices, for expenditure in 2017 and after 2 2017 Cost Estimate Report: https://www.ogauthority.co.uk/media/4742/ukcs-decommissioning-cost-report-v2.pdf 3 2018 Cost Estimate Report: https://www.ogauthority.co.uk/media/4999/decommissioning-a5-2018-pdf-version.pdf

UKCS Decommissioning Estimate - 2019 7
The updated cost distribution ranges for these estimates are shown below (also see Appendix 5):
The 2019 Full Portfolio estimate includes £2bnP50 associated with as-yet Unsanctioned/Not-built projects.
Figure 3: Like-for-Like Trend and Full Portfolio cost trends
0%
20%
40%
60%
80%
100%
120%
140%
160%
2016-17 2017-18 2018-19 2019-20 2020-21 2021-22 2022-23 2023-24 2024-25
Frac
tion
of B
aseli
ne (2
017)
Est
imat
e Li
ke fo
r Like
Sco
pe C
ompa
rison
2
UKCS Survey Year - Cost Report Year
Cost Estimate Vs Time
P90 P10 P50 Target
35% Industry Target £39bn1
£49bn1
£64bn1
£43bn1
£56bn1
£73bn1
£44bn1
£59.7bn1
£83bn1
0%
20%
40%
60%
80%
100%
120%
140%
160%
2016-17 2017-18 2018-19 2019-20 2020-21
Frac
tion
of B
asel
ine
(201
7) E
stim
ate
Full P
ortfo
lio S
cope
Com
paris
on
UKCS Survey Year - Cost Report Year
Cost Estimate Vs Time
£40bn
£51bn
£67bn
£45bn2
£58bn2
£77bn2
£44bn1
£59.7bn1
£83bn1
21 2021-22 2022-23 2023-24 2024-25
P90 P10 P50
1 Costs shown in 2016 prices, for expenditure in 2017 and after2 Costs shown in 2017 prices, for expenditure in 2018 and after

UKCS Decommissioning Estimate - 20198
Figure 4: Decommissioning cost distribution by geography
WOS
CNS
NNS
IS SNS
Owners Cost
Well Abandonment
Removals
Subsea
Recycling, site remediation & monitoring
UK Decom Estimate2019+ Full Portfolio, Probabilistic
10%
26%
13%7%
44%

UKCS Decommissioning Estimate - 2019 9
Well P&A is 44% of the total, with the CNS comprising a disproportionately large element, due to the many costly-to-decommission subsea wells in the sector,
and a substantial number of high well-count production platforms.
Figure 5: Well P&A cost distribution by geography
£0 £2 £4 £6 £8 £10 £12
SNS
IS
CNS
NNS
WoS
Decommissioning Cost (billions, probabilistic)
Well P&A Costs by Type & Region2019 + Full Portfolio
Well Abandonment (platform) Well Abandonment (subsea) Well Abandonment (E&A wells)
Total£22bn

UKCS Decommissioning Estimate - 201910
Figure 6: Annualised Decommissioning cost profile
£0.0
£0.5
£1.0
£1.5
£2.0
£2.5
£3.0
£3.5
2019 2025 2030 2035 2040 2045 2050 2055 2060
Projected Annual UKCS Decommissioning Costs
2019 Unsanctioned2019 Estimate (exc Unsanctioned)2018 Estimate
£ bi
llion
(con
stan
t pric
es, R
eal-2
018)
An annualised forecast profile (averaged over 5 years) was created by scaling Operators stewardship submissions, proportionate to the skew of the associated uncertainty distributions. There is considerable uncertainty in this forecast but the
profile does show that the majority (approx. 90%) of decommissioning expenditure is projected to be incurred over the coming 20 years. There is also a lower annual run rate forecast over the next 20 years compared with the 2018 estimate.

UKCS Decommissioning Estimate - 2019 11
Reduced platform Running Costs
Benchmarked platform running costs after production cessation have reduced by 40%P50 over the past 2 years. This is a major cost category in the northern and central North Sea, due to the high costs of operating the large, numerous personnel-on-board platforms in these sectors. Operators have learned the means to achieving these lower costs (incl. early well abandonment and prompt de-manning), and almost all new projects are being managed to achieve running costs 50-80% below the already reduced benchmark of £98millionP50,cumulative.

UKCS Decommissioning Estimate - 201912
Compared with 2018, there has been more than £6bn reduction in the like-for-like cost estimate, due to a
decrease in forecast and executed activity costs, and reduced-risk in the operator cost estimates.
3. Cost Reduction Analysis
Figure 7: 2018 to 2019 Decommissioning Cost reductions
55.71
-3.71 -2.61
49.41
2018 Decom Cost Probabilistic Total
Change in survey totals Class Change & Probabilistic Impact
2019 Decom Cost Probabilistic Total
Dec
omm
issi
onin
g C
ost (
bn)
£0
£10
£20
£30
£40
£50
£60
2018 / 2019 Like for Like Cost Estimate Waterfall
1
1 Costs shown in 2016 prices, for expenditure in 2017 and after

UKCS Decommissioning Estimate - 2019 13
There has been a significant decrease in 2018 actual and forecast decommissioning activity costs compared with the 2018 cost estimate.
Well P&A costs have continued to benefit from improved scoping of required work, and better execution practices. In the case of subsea wells, 2018/2019 costs are also
benefiting from cyclically low rig/vessel rates. The unit cost of subsea well P&A has reduced by 40% since the last survey (see Figures 17 & 18).
3.1. Activity Costs
Figure 8: 2018 to 2019 Decommissioning Cost reduction categories2018 to 2019 Cost Estimate Waterfall by Category
Increase
2018 Decom CostProbablistic Total
55.7
-1.0-0.5
-0.3-0.4 -0.2
-1.2
-2.6
-49.4
Well Abandonment RemovalsS ubsea Post CoP FacilitiesRunning Cost
Other WBS Categories Other Class Change & Probablistic impact
2019 Decom Cost Probablistic Total
Dec
omm
issi
onin
g C
ost (
£bn)
£58
£56
£54
£52
£50
£48
£46
£44
£42
£40
Decrease Total
Other
WBS Changes ClassOther
S
1 Costs shown in 2016 prices, for expenditure in 2017 and after
1
1
11
11
1
1
1
-£0.7bn: Unsanctioned Projects, -£0.3bn: Onshore, Terminals. -£0.2bn: Removal of new 2019 items

UKCS Decommissioning Estimate - 201914
The running costs incurred after production has ceased continue to improve due to operators optimising P&A schedules to reduce warm phase durations. There is limited potential for further reductions in this area, as the reduced costs are now largely priced in.
Topsides and substructure removals are becoming less expensive over time. Lifting contractors have been rapidly developing their removals expertise and execution practices, showing real ingenuity with several recent projects.
Campaign approaches to subsea infrastructure decommissioning, combined with flexible timing, are helping reduce costs. These campaigns are still limited to those which individual Operators can assemble within their own portfolio, and opportunities from multi-Operator campaigns are yet to be capitalised on.
On a field-by-field basis there have also been significant cost reductions.
Figure 9: Major decommissioning total cost reductions relative to 2018 estimate
£0 £20 £40 £60 £80 £100 £120 £140 £160
Asset IAsset HAsset GAsset FAsset EAsset DAsset CAsset BAsset A
Decrease in deterministic costs (MM)
Fiel
ds w
ith la
rges
t cos
t red
uctio
n fro
m
2018
Cos
t Est
imat
e
Cost Reductions per Field against 2018 Estimate
Active decom
Forecast decom

UKCS Decommissioning Estimate - 2019 15
These cost reductions are, in many cases, being realised immediately. Actual decommissioning expenditure in 2018 was £400million lower than estimated the previous year (see Figure 10 below).
Around 90% of the variance is true total project cost reductions, with the remainder being deferral of activity/expenditure to later years, partially offset by minor accelerations and cost increases in 2018.
Figure 10: Forecast 2018 spend minus 2018 Actual spend
-£500
-£400
-£300
-£200
-£100
£0
£100
£200
2018 Outturn costs minus 2018 Estimate by Project
2018 Estimate Variance by Project Cumulative Variance
£0
£200
£400
£600
£800
£1,000
£1,200
£1,400
£1,600
£1,800
£2,000
1
Total (MM)
2018 Forecast
2018 Actual
£0.4bn(22%)
-£432MM
(deterministic, MM)
Varia
nce
by P
roje
ct (M
M)

UKCS Decommissioning Estimate - 201916
Figure 11: Decommissioning cost distribution by estimate quality Figure 12: Estimate Quality for spend in 2019-2021 and adherence to OGA KPI
72%
46%36%
20%
43%
43%
4%4%
8%
4%4%
4%
1%
2%
0%3%
6%
£0
£5
£10
£15
£20
£25
£30
£35
£40
£45
£50
2017 Decommissioning Estimate
2018 Decommissioning Estimate
2019 Decommissioning Estimate
Class Estimate Improvement
Actuals
class 1
class 2
class 3
class 4
class 5
92%89%
79%
65%
35%
Estimate Maturity for spend 2019 - 2021
Class 3 or better Class 4/5
Target: 90% Class 3 or better by 2021
The decommissioning estimates provided by operators have lower uncertainty than those submitted in earlier surveys, which has resulted in a risk-weighted cost reduction of £2.6bn. Nonetheless the fraction of decommissioning cost estimates with high uncertainty (AACE Class 4 & 5 quality) remains high, even for assets being decommissioned in the coming 5-6 years.
The OGA expectation is that, for 90% of expenditure within 3 years, cost estimation quality should be of AACE Class 3 or better. In this most recent survey, 65% of 3-year forecast expenditure meets this key performance indicator (see Appendix 1 for AACE definitions). This is an improvement from the previous survey, where the equivalent value was less than 40%.
3.2. Cost Uncertainty Classification

UKCS Decommissioning Estimate - 2019 17
The current positive progress on decommissioning costs is largely based on operators’ experience in 2016-2018 of being able to achieve significant cost reduction in platform running costs, well P&A costs and removal costs, in the NNS and CNS.
Several decommissioning estimate reductions in excess of £100 million (deterministic) contribute to the overall reduction, with a high proportion of these being driven by cost experience on active decommissioning programmes, with operators reducing costs by adopting different approaches, learning-from/sharing-with others, and challenging previous norms. The supply chain is also bringing new solutions to the market in terms of pricing structures, business models and technology.
The following are key opportunities for further cost reductions:
• The NNS and CNS together comprise 75% of the currently estimated cost of decommissioning, so the wider application of the 2016-2018 learnings, even to those sectors alone offers considerable promise. Many learnings will also be applicable in other sectors such as the Southern North Sea (SNS).
• Further improved asset stewardship to optimise value and costs through late-life and decommissioning.
• New service providers to the market initiating different, lower-cost approaches, contracting solutions, and pricing bases for decommissioning projects.
• Innovative cost reducing technologies or techniques are implemented for well P&A activities.
• Volume-based efficiencies from campaign or area-based approaches e.g. multi-operator well P&A and subsea infrastructure decommissioning campaigns, area-based operator collaborations to optimise schedules and contracts, etc.
• Regulations are complied with appropriately and consistently, to ensure safe and environmentally acceptable outcomes, at minimum cost.
• Continued and extended close working between the OGA and industry facilitates shared learning and knowledge, and increased collaboration.
3.3. Cost Management
UKCS Decommissioning Estimate - 201918
Ultimately increased competence and cost effectiveness of operators and their contractors will deliver the targeted >35% savings relative to the 2017 baseline. The OGA supports and facilitates this through:
• Systematic use of benchmarks derived from actuals to proactively assess estimates during stewardship reviews with individual operators, as well as during Decommissioning Programme (DP) discussions.
• The introduction of Key Performance Indicators (KPIs) to facilitate performance measurement and improvement (see Section 4)
• Decommissioning stewardship expectations, being updated in 2019, support increasingly effective OGA-Operator cost-reduction engagements.
• The OGA-operator stewardship engagement process (see Appendix 2) is proving an effective, and increasing, contributor to understanding and managing decommissioning performance
• Operator stewardship reviews for more than 80% of 10-year forecast expenditure were implemented in 2018, increasing to more than 90% in 2019
• Creating metrics from the UKCS Stewardship Survey and publishing these, with focus on high cost elements
• Working with operators and industry groups to ensure effective sharing of learning
• Improvements to the decommissioning component of the UKCS Stewardship Survey to maximise consistency and value of data collected.
• Promoting the development of innovative, collaborative contracting solutions
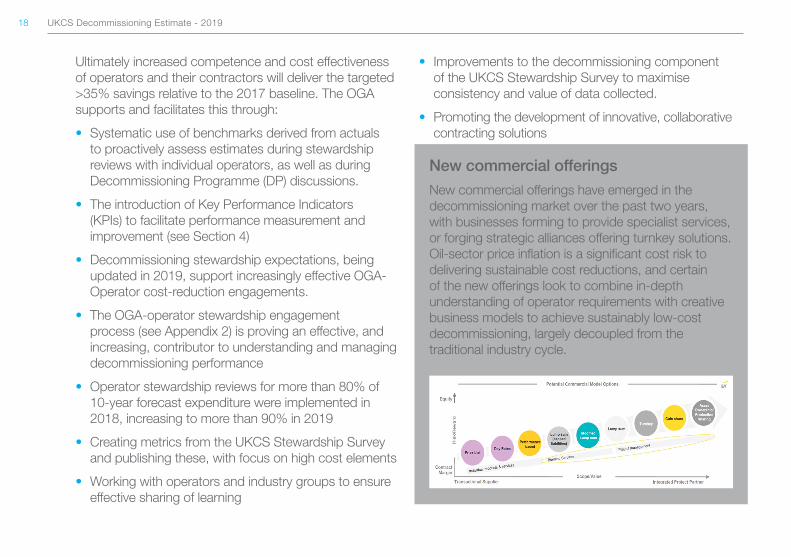
New commercial offerings
New commercial offerings have emerged in the decommissioning market over the past two years, with businesses forming to provide specialist services, or forging strategic alliances offering turnkey solutions. Oil-sector price inflation is a significant cost risk to delivering sustainable cost reductions, and certain of the new offerings look to combine in-depth understanding of operator requirements with creative business models to achieve sustainably low-cost decommissioning, largely decoupled from the traditional industry cycle.

UKCS Decommissioning Estimate - 2019 19
• Promoting enhanced supply chain capability
• Increasing market transparency through hosting of market intelligence platforms such as Oil & Gas Pathfinder
• Working with industry, the Oil and Gas Technology Centre (OGTC) and the National Decommissioning Centre (NDC) to promote the development and application of cost effective technologies and expertise
It is estimated that, in 2018, direct intervention by the OGA resulted in more than £100million in cost savings.
There are several key risks that need to be considered which may have an influence on future decommissioning costs, namely:
• The currently depressed supply chain market and strong competitive forces have contributed to the cost reductions, supplementing and contributing-to execution improvements. Decommissioning will continue for decades, over multiple economic cycles, with corresponding risks of less attractive price offerings.
• Subsea wells are disproportionately costly to abandon, relative to platform wells, so there is a strong incentive to reduce those costs. Recent cost trends have been very positive. However, since this activity typically uses equipment also used for other upstream activity (e.g. semi-submersible rigs), there is substantial risk from
increased day-rates as offshore development activity increases.
• Should it prove problematic to reduce subsea well P&A costs, it will be difficult to compensate by reducing other decommissioning cost types.
• Operators may commence planning for decommissioning too late, thereby precluding access to cost saving options.
• Traditional development project and contracting approaches if adopted for decommissioning projects could unnecessarily over-engineer the solutions and increase the cost.
• Financing constraints may result in sub-optimal decovmmissioning timing due to competing exploration and development funding needs.
• A lack of investment in new technologies and transfer of existing technologies from other sectors may fail to capture cost reduction opportunities.
• Some operators may be optimistic in developing provisioning estimates and this could result in unrepresentative estimate values, knowingly or otherwise.

UKCS Decommissioning Estimate - 201920
4. Key Performance Indicators Key Performance Indicators (KPIs) have been developed and introduced with industry in support of the two objectives of 35% cost reduction relative to the 2017 baseline, and more than 90% of expenditure within 3 years being at least an AACE Class 3 estimate quality.
Four key activities (Post-CoP Running Costs, Well P&A, Removals, Subsea Infrastructure decommissioning) constitute approximately 90% of overall decommissioning cost, and it is essential to reduce the costs of several, if not all, of these if the overall >35% cost reduction target is to be realised. Decommissioning KPIs are therefore focussed on these four cost areas, with industry guided to calibrate its ambitions accordingly e.g. reductions of 35-65% for well P&A being potentially achieved from a combination of improved downhole barrier technology/practices, rig-less expertise and campaign economies.
To-date reductions of 18%, 14%, 21% and 14% have been achieved for Well P&A, Removals, Subsea Infrastructure and Post-CoP Running Costs respectively.
Innovative laser technology for conductor cutting
Well abandonment represents a high fraction of the overall decommissioning cost and is an area of focus and innovation for operators/supply-chain/academia. As an example, the application of laser technology for cutting well conductors has been tested on wells/platforms in the Southern North Sea. The trials suggest that the technology may have the potential to increase efficiency through eliminating issues with mechanical components (e.g. blade breakage, diamond wire pinching), and consequently reduce the duration and cost of the cutting operations. If/when the technology matures, it could in principle be applied for the cutting of single and multistring well conductors/casings, and adapted for different deployment methods (rig/rigless/LWIV).

UKCS Decommissioning Estimate - 2019 21
Several combinations of the above savings would result in a >35% overall decommissioning cost reduction. High potential lines of action are being progressed (see Figure 13) including focussed technology maturation in collaboration with operators, suppliers and the Oil
and Gas Technology Centre (OGTC). Strengthened international standardisation of benchmarks and decommissioning performance measurement is being progressed to facilitate global comparisons and learning.
Figure 13: Decommissioning Key Performance Indicators
35%
£27bn £15bn
£39bn 2022 Target
£59.7bn 2016 Baseline
£6bn £4bn
WellP&A46%
Removals26%
Subsea Infra.10%
Post CoP
Running Cost7%
~£9-18bn(35-65%)
~£2-5bn(15-30%)
~£2-3bn(30-50%)
~£1-2bn(20-40%)
Reduce by Reduce by Reduce by Reduce by
P&A
1. Barrier technology2. Maximise well P&A rig-less/thru tubing3. Campaigns
Subsea
1. Scope aggregation2. Technology development for bundle
removal
Removals
1. Alternative technologies from heavy lift2. Contracting models3. Innovative transportation technologies
Post CoP Running Costs
1. Early execution of well P&A before CoP2. Simulation technology to enhance
planning and facilitate scope aggregation3. Improved clean and flush technology
Achieved to date 18% 14% 21% 14%
OGA Priority• Develop collaborative execution models• Develop an enhanced decommissioning
supply chain
Forward priorities/commitments

UKCS Decommissioning Estimate - 201922
5. BenchmarksThe information in this section summarises cost performance for key cost drivers, based on actual cost experience (i.e. not including cost estimates/forecasts).
• Definitions of P10, P50 and P90, referenced in the graphs, are listed in Appendix 3.
Cost performance continued to improve from the previous year. An exception was the unit cost of platform P&A activity, which increased relative to 2017, due to a combination of higher-cost Operators making up larger fractions of the work, and the impacts of costly platform-rig refurbishments. There are wide variations in operator performance, with certain operators having large fractions of their outcomes in the third and fourth cost performance quartiles, and other Operators’ predominantly in the first and second quartiles. In addition, the costs associated with re-instating/upgrading obsolete integrated platform drilling rigs, and their subsequent poor operating performance, are challenges which must be addressed to allow substantial further cost reductions to be achieved – This is an area of industry and OGA focus.
Platform well P&A costs are still low relative to 2016, due to a combination of batch P&A methods, de-risking through wellbore surveys when setting mechanical
reservoir plugs, improved casing milling performance and use of risk-based methods when defining scope.
Reduced subsea well abandonment costs
Well Plug and Abandonment (P&A) represents the largest fraction of decommissioning cost in the northern and central North Sea, and subsea well abandonments comprise the majority of this cost since, compared to platform wells, subsea wells are disproportionately costly to abandon. In 2018 operators nearly halved unit subsea P&A costs compared to the previous year, benefiting from extensive campaigning/batching of P&A opportunities, efficient logistics associated with such approaches, optimisation of well barrier and milling needs, wide-scale use of rig-deployed ROVs, and increased continuity and expertise of third-party personnel.

UKCS Decommissioning Estimate - 2019 23
The 2017 reductions in unit NNS/CNS well P&A cost have not been sustained, largely due to reduced activity by lower cost Operators, and high impacts from platform-rig reactivation. Significant variation in the P&A costs delivered by different Operators was an issue referenced in the 2018
report, and narrowing this range around the lower values has still not been achieved. While higher than 2017, the latest costs are still 25% below those achieved when OGA cost benchmarking commenced.
Figure 14: Change in platform P&A cost distribution: NNS & CNS
£0
£1
£2
£3
£4
£5
£6
£7
£8
£9
2017 Pre 2017 2018 2019 2020 2021 2022
Cost
per
wel
l (MM
)Platform Well P&A: Northern & Central North Sea
P10 P50 P90

UKCS Decommissioning Estimate - 201924
The 2017 reductions in unit SNS well P&A cost have not been sustained, largely due to reduced activity by lower cost Operators; unit costs have returned to earlier levels. Significant variation in the P&A costs delivered by different
Operators was an issue referenced in the 2018 report, and narrowing this range around the lower values has still not been achieved.
Figure 15: Change in platform P&A cost distribution: SNS
£0
£1
£2
£3
£4
£5
£6
2017 Pre 2017 2018 2019 2020 2021 2022
Cost
per
wel
l (MM
)Platform Well P&A: Southern North Sea
P10 P50 P90

UKCS Decommissioning Estimate - 2019 25
Certain platforms in the NNS and CNS do not have integrated rigs, and utilise jack-up rigs either in cantilever or tender mode when plugging and abandoning wells. There
was previously insufficient data to generate benchmarking statistics for this category before, hence the absence of pre-2018 data points.
Figure 16: Platform P&A Cost distribution using Jackup Rigs: NNS & CNS
£0
£1
£2
£3
£4
£5
£6
£7
£8
2017 Pre 2017 2018 2019 2020 2021 2022
Cost
per
wel
l (MM
)Platform Well P&A with JackUp Rig: Northern & Central North Sea
P10 P50 P90

UKCS Decommissioning Estimate - 201926
There was a significant increase in the number of NNS/CNS subsea wells abandoned in 2018 (6 wells in 2017 versus 26 wells in 2018), and costs have reduced substantially (45%)
due to a combination of improved planning and execution practices, and lower rig/vessel rates.
Figure 17: Subsea well P&A cost distribution: NNS & CNS
£0
£5
£10
£15
£20
£25
£30
£35
£40
£45
£50
2017 Pre 2017 2018 2019 2020 2021 2022
Cost
per
wel
l (MM
)Subsea Well P&A: Northern & Central North Sea
P10 P50 P90

UKCS Decommissioning Estimate - 2019 27
There was also a significant increase in the number of SNS subsea wells abandoned in 2018 (7 wells in 2017 versus 13 wells in 2018), and costs have reduced substantially (40%)
due to a combination of improved planning and execution practices, and lower rig/vessel rates.
Figure 18: Subsea well P&A cost distribution: SNS
£0
£2
£4
£6
£8
£10
£12
£14
£16
2017 Pre 2017 2018 2019 2020 2021 2022
Cost
per
wel
l (MM
)Subsea Well P&A: Southern North Sea
P10 P50 P90

UKCS Decommissioning Estimate - 201928
Platform Running Costs in the NNS have been reducing substantially, largely due to better optimisation of the late-life and warm/cold phases of decommissioning, with rapid reduction in running costs after cessation of production (CoP). Scheduling well P&A and Make Safe activities so as to minimise the inspection/maintenance-intensive warm phase, and then de-manning, has typically proven very cost effective.
Due to the infrequent and longer term nature of this benchmark, Figure 19 includes estimates for platforms still being decommissioned, where the relevant operator has a well defined plan and recent decommissioning experience with similar infrastructure. Even in these relatively advanced stage cases, cost decreases are being realised, albeit with the benefits diluted by the sunk costs.
Figure 19: Large Platform Post-CoP Running Cost distribution: NNS & CNS
£0
£50
£100
£150
£200
£250
2017 Pre 2017 2018 2019 2020 2021 2022
Tota
l Pos
t CoP
Run
ning
Cos
t (M
M)
Post CoP Running Costs: Northern & Central North Sea
P10 P50 P90

UKCS Decommissioning Estimate - 2019 29
New benchmarks developed showing the distribution of Normally Unmanned Installations (NUI) post-CoP running costs in the Southern North Sea are shown above. While
these costs are typically very low, they can be considerably impacted by poor commercial frameworks with host infrastructure or 3rd-party duty holders.
Figure 20: Platform (Normally Unmanned) Post-CoP Running Cost distribution: SNS & IS
£0
£1
£2
£3
£4
£5
£6
£7
£8
£9
£10
2017 Pre 2017 2018 2019 2020 2021 2022
Tota
l Pos
t CoP
Run
ning
Cos
t (M
M)
Post Cop Running Cost (NUI Installations): Southern North Sea
P10 P50 P90

UKCS Decommissioning Estimate - 201930
Appendix 1: MethodologyThe 2018 UKCS Stewardship Survey was used as the data source, with decommissioning cost inputs provided by all operators for all current and proposed offshore facilities, pipelines, development wells, suspended open water exploration and appraisal wells and onshore terminals. Data was collected using the Oil & Gas UK Work Breakdown Structure (WBS).
The OGA’s approach, unchanged from previous years, has been to develop a probabilistic cost estimate which takes into account the wide range of uncertainties in estimates submitted by operators. Estimate classes in the survey were requested with reference to the Association for the Advancement of Cost Engineering (AACE Recommended Practice No. 18R-97, see Figure 21) and AACE guidance followed for selecting the values from these ranges.
The estimate is comprised of various elements, not all having the same estimate classification. The estimate classification was requested from the operators responding to the UKCS Stewardship Survey and no adjustments were made to these operator self-assessments.
Figure 21: AACE Classification of estimates
Primary Characteristic
ESTIMATE CLASS
MATURITY LEVEL OF PROJECT DEFINITION
DELIVERABLES Expressed as % of complete definition
EXPECTED ACCURACY RANGE
Typical Variation in low and high ranges at an 80% confidence
interval
Class 5 0% to 2%L: -20% to -50%H: +30% to +100%
Class 4 1% to 15%L: -15% to -30%H: +20% to +50%
Class 3 10% to 40%L: -10% to -20%H: +10% to +30%
Class 2 30% to 75%L: -5% to -15%H: +5% to +20%
Class 1 65% to 100%L: -3% to -10%H: +3% to +15%
Secondary Characteristic

UKCS Decommissioning Estimate - 2019 31
The values within the ‘Expected Accuracy Range’ and used in the probabilistic distributions were selected at the higher end of the low (L) and higher end of the high (H) accuracy ranges shown above. For example, class 5 estimates were given an expected accuracy range of -20% / +100%. This was to address the possibility of estimating optimism from operators for decommissioning scope. This potential was assessed as being high for the following reasons:
• Estimates may be influenced by estimating bias
• Immaturity of decommissioning expertise within many UKCS operators
• The lack of industry experience generally with decommissioning
The project scope includes the decommissioning of all UKCS infrastructure including:
• Facilities and development wells still in place and yet to be decommissioned
• All facilities and development wells currently undergoing
decommissioning, excluding work performed prior to and including 2016
• All sanctioned facilities and wells not yet in place
• Proposed project developments, not yet sanctioned or built, weighted by probability of occurrence/execution.
• All intra-field pipelines and export lines
• Suspended open water exploration and appraisal wells
• Onshore terminals
The estimate raw data has been collected using the Oil & Gas UK decommissioning Work Breakdown Structure (WBS) which has the following categories:
• Operator Project Management
• Facility Running/Owner Costs (Post-CoP Running Costs)
• Well Plug & Abandonment
• Facilities/Pipelines Making Safe
• Topsides Preparation

UKCS Decommissioning Estimate - 201932
• Topsides Removal
• Substructure Removal
• Onshore Recycling
• Subsea Infrastructure (incl. subsea structures, pipelines, mattresses, etc)
• Site Remediation
• Monitoring
Where required, deflation factors have been taken from the “GDP deflators at market prices, and money GDP Statement”, published by HM Treasury from data provided by the Office for National Statistics (ONS) and Office for Budget Responsibility (OBR). Values are taken from the Spring statement each subsequent year.
2016-2017 deflation factor : 1.97%
2017-2018 deflation factor : 1.85%
Accelerated reduction in removal costs
Platform removal costs have improved further, with old benchmarks being rendered obsolete by the rapid development of expertise and execution efficiency. A recurrent theme is increased supply chain ownership of the engineering and management of the removal process, ranging from in-depth sharing of data and extended competitive dialogue with multiple supply chain parties, to assigning the conception, engineering and execution of the solution to selected vendors. Another theme is team integration and effective implementation of learning through continuity of experienced personnel.

UKCS Decommissioning Estimate - 2019 33
Appendix 2: Stewardship review processThe OGA interacts with decommissioning operators based on a ‘long glidepath’ strategy, by which early, structured engagements support operators to embed good practices in sufficient time to deliver cost effective decommissioning. The framework and requirements
are set out in the OGA Stewardship Expectations SE-10 Cost Effective Decommissioning.
Figure 22: ‘Long glidepath’ cost reduction strategy
Late life operation
Stewardship expectation
L O N G G L I D E P A T H
≥ 6 yrs to 3 yrs before CoP ≥ 3yrs before CoP
Benchmarking and cost forecast dashboard
Strategy (Corporate and UKCS)
Learning/knowledge review and implementation
Technology assessment
Plan for decommissioning
Scope aggregation opportunities
Evaluate asset condition
Potential for re-use/re-purposing
Contracting/Execution strategies (SCAP development)
Implement decommissioning preparations and activities

UKCS Decommissioning Estimate - 201934
Six or twelve-monthly ‘Tier 2’ strategic engagements are scheduled with operators, ranked primarily on the timing and materiality of their decommissioning costs. The engagements are structured on a standard
agenda, to ensure a comprehensive discussion and efficient follow-up of plans to mature cost reduction opportunities.
Figure 23: Standard OGA-operator stewardship agenda
1. Decommissioning portfolio• High-level decommissioning strategy Operator• Assets (incl. Open-water E&A wells) Operator• Schedule / schedule-changes Operator• Anticipated project outcome/end-state Operator• Estimated cost / cost-changes by cost-category Operator• Learning, & impact Operator / OGA
2. Cost reduction opportunities•Expected magnitude of savings (by cost-category/activity e.g. P&A, technology) OGA / Operator
3. Plan/schedule to mature cost reduction opportunities (‘Glidepath’)• Risks, Uncertainties, Decisions Operator• Supply Chain opportunities (incl. Supply Chain Action Plans) / Area Plans Operator
4. Future engagement schedule All
Standard Decom Meeting Agenda
Changes from standard agenda to be agreed in advance, and meeting materials ideally to be provided 3 days ahead. Operator to circulate meeting notes/actions within 2 weeks of meeting.

UKCS Decommissioning Estimate - 2019 35
A ‘Decommissioning Dashboard’, using the operators’ own data as submitted through the UKCS Stewardship Survey, is used as the basis for performance/cost
analysis and discussion. The Oil and Gas UK Decommissioning Work Breakdown Structure (WBS) is used as the basis for cost classifications.
Figure 24: Example Decommissioning Benchmarking DashboardDecommissioningProduction Installations 0 Northern North Sea Pipeline(s) Wells Execution Plan
Name DescriptionInstallation
CategoryPOB Mass (Te) Premise Ref.: Description OD (") Dist.(km) Product Premise Well Base OGUK Type Well-Count Late-Life Management
Alfalfa A Integrated platform Combination 110 12,000 Remove PL678 Kittiwake A Platform to Fulmar Receiver Tree 0 0 Gas Remove Type 0 0Alfalfa B NUI - Normally Unmanned Installation Combination 0 7,000 Remove PL123 Well-211/19- 2 to Murchison Platform 3 3 Light Oil Part Remove Type 1 0
0 PL517 Rob Roy Production Manifold to PL Seabed Location 5 5 Well Fluids Leave Type 2 00 0 0 Type 3 200 0 0 Type 4 0
Subsea structures Number Mass (Te) Premise 0 0 Type 0 2Mass: 0-25 Te Subsea Remove 0 0 Type 1 0Mass: 25-150 Te Subsea Remove 0 0 Type 2 0Mass: 150-500 Te Subsea Remove 0 0 Type 3 7 P&AMass: 500+ Te Subsea Remove 0 0 Type 4 0
Scope & Cost Phasing (£MM) Prior Years Future Cost L/Cycle Cost Est.Quality % Lifecycle 2018 2019 2020 2021 2022 2023 2024 2025 2026 2027 2028 2029 2030 2031 2032 +Operator Proj.Mgmt 0 MM£ 61 MM£ 61 MM£ AACE Class 4 12% £10 £10 £10 £10 £5 £5 £5 £5 £1 -£ -£ -£ -£ -£ -£ Running/Owners Costs 0 MM£ 125 MM£ 125 MM£ AACE Class 4 25% -£ £50 £50 £20 £5 -£ -£ -£ -£ -£ -£ -£ -£ -£ -£ Well P&A 0 MM£ 90 MM£ 90 MM£ AACE Class 4 18% £10 £20 £20 £10 £30 -£ -£ -£ -£ -£ -£ -£ -£ -£ -£ Fac./Pipelines Make Safe 0 MM£ 10 MM£ 10 MM£ AACE Class 4 2% -£ £10 -£ -£ -£ -£ -£ -£ -£ -£ -£ -£ -£ -£ -£ Topsides Preparation 0 MM£ 50 MM£ 50 MM£ AACE Class 4 £20 £20 £10 -£ -£ -£ -£ -£ -£ -£ -£ -£ -£ -£ -£ Topsides Removal 0 MM£ 90 MM£ 90 MM£ AACE Class 4 -£ -£ -£ -£ -£ £90 -£ -£ -£ -£ -£ -£ -£ -£ -£ Fac./Pipeline Make SafeSub-structure removal 0 MM£ 50 MM£ 50 MM£ AACE Class 3 -£ -£ -£ -£ -£ -£ £50 -£ -£ -£ -£ -£ -£ -£ -£ Super-/Sub-structure recycling 0 MM£ 6 MM£ 6 MM£ AACE Class 3 -£ -£ -£ -£ -£ -£ £2 £4 -£ -£ -£ -£ -£ -£ -£ Subsea infrastructure 0 MM£ 10 MM£ 10 MM£ AACE Class 4 -£ -£ -£ -£ -£ -£ -£ £10 -£ -£ -£ -£ -£ -£ -£ Site remediation 0 MM£ 1 MM£ 1 MM£ AACE Class 4 -£ -£ -£ -£ -£ -£ -£ £1 -£ -£ -£ -£ -£ -£ -£ Monitoring 0 MM£ 1 MM£ 1 MM£ AACE Class 4 0% -£ -£ -£ -£ -£ -£ -£ -£ £1 -£ -£ -£ -£ -£ -£ Cessation of Production (Year) 2019 494 MM£ 494 MM£ Warm StackCold Stack Removals & Recycling
Scope & Cost Phasing (£MM)Prior Years Future CostOperator Proj.Mgmt -£ 61£ Running/Owners Costs -£ 125£ Well P&A -£ 90£ Fac./Pipelines Make Safe -£ 10£ Topsides Preparation -£ 50£ ContractingTopsides Removal -£ 90£ Sub-structure removal -£ 50£ Super-/Sub-structure recycling -£ 6£ Subsea infrastructure -£ 10£ Site remediation -£ 1£ Monitoring -£ 1£
Business Environment
Operating Model
Industry Collaboration
Facilities re-use / Carbon Capture & Storage
Saving Opportunities vs P10s vs P50s
Project Management £36 £12 MMPost-CoP Running Costs £57 £0 MMWell P&A £18 £0 MMFacilities/Pipelines Make Safe £7 £0 MMTopsides & Substructure Prep. + Removal £147 £34 MMTopsides & Substructure recycling & disposal £4 £4 MMSubsea infrastructure £4 £0 MMSite remediation £1 £0 MMMonitoring £0 £0 MM
£275 £50 MM
Summary / Conclusion
Conclusion Added on Cost Category review tab
Conclusion Added on Cost Category review tab
Conclusion Added on Cost Category review tab
Conclusion Added on Cost Category review tab
Platform
Subsea
Conclusion Added on Cost Category review tab
Conclusion Added on Cost Category review tab
Conclusion Added on Cost Category review tab
Conclusion Added on Cost Category review tab
Conclusion Added on Cost Category review tab
42%
Conclusion Added on Cost Category review tab
Total
07 June 2018 I.Fozdar
£-
£20
£40
£60
£80
£100
£120
2018 2019 2020 2021 2022 2023 2024 2025 2026 2027 2028 2029 2030 2031 2032 +
MM
Decommissioning Cost Phasing
Operator Proj.Mgmt Running/Owners Costs Well P&A Fac./Pipelines Make Safe Topsides Preparation Topsides Removal Sub-structure removal Super-/Sub-structure recycling Subsea infrastructure Site remediation Monitoring
Decommissioning Cost Breakdown (WBS)
Operator Proj.Mgmt Running/Owners Costs Well P&A Fac./Pipelines Make Safe
Topsides Preparation Topsides Removal Sub-structure removal Super-/Sub-structure recycling
Subsea infrastructure Site remediation Monitoring
£0
£50
£100
£150
£200
£0
£50
£100
£150
£200
Project Management Post-CoP Running Costs Well P&A Facilities/Pipelines MakeSafe
Topsides & SubstructurePrep. + Removal
Topsides & Substructurerecycling & disposal
Subsea infrastructure Site remediation Monitoring
Decommissioning Project Cost Uncertainty and UKCS Benchmarks
Project P10 - P90 Range
Project Lifecycle Total Spend
UKCS Benchmark P10 - P50 Range

UKCS Decommissioning Estimate - 201936
In certain cases, the OGA may request operators to facilitate separate OGA reviews of certain decommissioning activities with key contractors involved. The purpose of this is to allow, with the benefit of hindsight, identification of unrealised savings or performance improvements which might not be apparent to the client/operator).
Non-proprietary, non-confidential elements of this may then be shared with industry through:
• Encouraging the parties to increase awareness through presentations at relevant conferences, or through industry knowledge-sharing portals (e.g. L2P2.net )
• the OGA making other operators aware directly through the operator engagement process, and perhaps including follow-up in the agreed cost-reduction plan.
• the OGA informing industry directly through its decommissioning knowledge-sharing website - (https://www.ogauthority.co.uk/lessons-learned/)
Figure 25: Illustration – OGA Decommissioning Learning website

UKCS Decommissioning Estimate - 2019 37
The terms P10, P50 and P90 are used extensively throughout this document, and in graphs used in the benchmarking section to illustrate cost performance of different cost elements.
Cost information is collected from all UK decommissioning operators. Comparable data is grouped (e.g. platform wells in the Southern North Sea), sorted from large to small, and then graphed as below. Reading from the vertical and horizontal axes then characterises the cost variances experienced for that parameter.
In the generic example (Figure 26), 10% of Activity A, as executed by all those contributing to the sample, was executed for £8 or less, 50% for £15 or less, and 90% for £44 or less. The terms P10, P50 and P90 refer to these values i.e. the cost values below which 10%, 50% and 90% of these activities are executed.
The P90 value, therefore represents the value at which 90% of cases were cheaper than this and figures at or above this are most expensive 10%. Conversely, figures below the P10 represent the cheapest 10%, and the P50 the value at which there are an equal fraction (i.e. 50%) of examples above and below.
Appendix 3: Representation of Cost UncertaintyFigure 26: Illustration – Example of ‘s-curve’ used to characterise uncertainty
Generic S-curve
Cost of doing Activity A£10P10=£8 P50=£15£0
0%
10%
20%
30%
40%
50%
60%
70%
80%
90%
100%
£20 £30 £40 £50P90=£44
Perc
enta
ge o
f dat
a po
ints
whe
re th
e ac
tivity
has
bee
n im
plem
ente
d fo
r les
s th
an
the
cost
on
the
horiz
onta
l axis

UKCS Decommissioning Estimate - 201938
Appendix 4: Benchmarks shown in S Curve FormatFigure 27: Cost performance ‘s-curves’ underlying graphics in Section 5
1. Platform well P&A (NNS/CNS) 2. Platform well P&A (SNS)
3. Platform well P&A via HDJU (NNS/CNS) 4. Subsea well P&A (NNS/CNS)
5. Subsea well P&A (SNS) 6. Post CoP Running cost (NNS/CNS)
7. Post CoP Running cost for NUI (SNS) 8. Removals (NNS/CNS)
9. Removals < 2000 tonne (SNS)
0%
10%
20%
30%
40%
50%
60%
70%
80%
90%
100%
£0 £2 £4 £6 £8 £10 £12
1 -P
roba
bilit
y of E
xcee
danc
e
MM / Well
Platform Well P&A: Northern & Central North Sea
2017 Benchmark2018 Benchmark
0%
10%
20%
30%
40%
50%
60%
70%
80%
90%
100%
£0 £2 £4 £6 £8 £10
1 -P
roba
bilit
y of E
xcee
danc
e
MM / Well
Platform Well P&A: Southern North Sea
2017 Benchmark2018 Benchmark
0%
10%
20%
30%
40%
50%
60%
70%
80%
90%
100%
£0 £2 £4 £6 £8 £10 £12 £14 £16 £18 £20
1 -P
roba
bilit
y of E
xcee
danc
e
MM / Well
Platform Well P&A with JackUp Rig: Northern & Central North Sea
2018 Benchmark
0%
10%
20%
30%
40%
50%
60%
70%
80%
90%
100%
£0 £10 £20 £30 £40 £50 £60
1 -P
roba
bilit
y of E
xcee
danc
e
MM / Well
Subsea Well P&A: Northern & Central North Sea
2017 Benchmark2018 Benchmark
0%
10%
20%
30%
40%
50%
60%
70%
80%
90%
100%
£0 £2 £4 £6 £8 £10 £12 £14 £16 £18
1 -P
roba
bilit
y of E
xcee
danc
e
MM / Well
Subsea Well P&A: Southern North Sea
2017 Benchmark2018 Benchmark
0%
10%
20%
30%
40%
50%
60%
70%
80%
90%
100%
£0 £2 £4 £6 £8 £10 £12
1 -P
roba
bilit
y of E
xcee
danc
e
MM Total
Post Cop Running Cost (NUI Installations): Southern North Sea
All activities benchmark
0%
10%
20%
30%
40%
50%
60%
70%
80%
90%
100%
£0 £1,000 £2,000 £3,000 £4,000 £5,000 £6,000 £7,000 £8,000 £9,000 £10,000
1 -P
roba
bilit
y of E
xcee
danc
e
Cost / Tonne
Platform Removals: Northern and Central North Sea
All activities benchmark
0%
10%
20%
30%
40%
50%
60%
70%
80%
90%
100%
£0 £2 £4 £6 £8 £10 £12 £14
1 -P
roba
bilit
y of E
xcee
danc
e
MM / Structure
Platform Removals (<2000t): Southern North Sea
All activities benchmark
0%
10%
20%
30%
40%
50%
60%
70%
80%
90%
100%
£0 £50 £100 £150 £200 £250
1 -P
roba
bilit
y of E
xcee
danc
e
MM / Well
Post CoP Running Costs: Northern & Central North Sea
2017 Benchmark2018 Benchmark

UKCS Decommissioning Estimate - 2019 39
1. Platform well P&A (NNS/CNS) 2. Platform well P&A (SNS)
3. Platform well P&A via HDJU (NNS/CNS) 4. Subsea well P&A (NNS/CNS)
5. Subsea well P&A (SNS) 6. Post CoP Running cost (NNS/CNS)
7. Post CoP Running cost for NUI (SNS) 8. Removals (NNS/CNS)
9. Removals < 2000 tonne (SNS)
0%
10%
20%
30%
40%
50%
60%
70%
80%
90%
100%
£0 £2 £4 £6 £8 £10 £12
1 -P
roba
bilit
y of E
xcee
danc
e
MM / Well
Platform Well P&A: Northern & Central North Sea
2017 Benchmark2018 Benchmark
0%
10%
20%
30%
40%
50%
60%
70%
80%
90%
100%
£0 £2 £4 £6 £8 £10
1 -P
roba
bilit
y of E
xcee
danc
e
MM / Well
Platform Well P&A: Southern North Sea
2017 Benchmark2018 Benchmark
0%
10%
20%
30%
40%
50%
60%
70%
80%
90%
100%
£0 £2 £4 £6 £8 £10 £12 £14 £16 £18 £20
1 -P
roba
bilit
y of E
xcee
danc
e
MM / Well
Platform Well P&A with JackUp Rig: Northern & Central North Sea
2018 Benchmark
0%
10%
20%
30%
40%
50%
60%
70%
80%
90%
100%
£0 £10 £20 £30 £40 £50 £60
1 -P
roba
bilit
y of E
xcee
danc
e
MM / Well
Subsea Well P&A: Northern & Central North Sea
2017 Benchmark2018 Benchmark
0%
10%
20%
30%
40%
50%
60%
70%
80%
90%
100%
£0 £2 £4 £6 £8 £10 £12 £14 £16 £18
1 -P
roba
bilit
y of E
xcee
danc
e
MM / Well
Subsea Well P&A: Southern North Sea
2017 Benchmark2018 Benchmark
0%
10%
20%
30%
40%
50%
60%
70%
80%
90%
100%
£0 £2 £4 £6 £8 £10 £12
1 -P
roba
bilit
y of E
xcee
danc
e
MM Total
Post Cop Running Cost (NUI Installations): Southern North Sea
All activities benchmark
0%
10%
20%
30%
40%
50%
60%
70%
80%
90%
100%
£0 £1,000 £2,000 £3,000 £4,000 £5,000 £6,000 £7,000 £8,000 £9,000 £10,000
1 -P
roba
bilit
y of E
xcee
danc
e
Cost / Tonne
Platform Removals: Northern and Central North Sea
All activities benchmark
0%
10%
20%
30%
40%
50%
60%
70%
80%
90%
100%
£0 £2 £4 £6 £8 £10 £12 £14
1 -P
roba
bilit
y of E
xcee
danc
e
MM / Structure
Platform Removals (<2000t): Southern North Sea
All activities benchmark
0%
10%
20%
30%
40%
50%
60%
70%
80%
90%
100%
£0 £50 £100 £150 £200 £250
1 -P
roba
bilit
y of E
xcee
danc
e
MM / Well
Post CoP Running Costs: Northern & Central North Sea
2017 Benchmark2018 Benchmark

UKCS Decommissioning Estimate - 201940
Full Portfolio P10 P50 P90
2019 Estimate £40bn £51bn £67bn2018 Estimate £45bn2 £58bn2 £77bn2
2017 Estimate £44bn1 £59.7bn1 £83bn1
Like-for-like P10 P50 P90
2019 Estimate £39bn1 £49.4bn1 £64bn1
2018 Estimate £43bn1 £55.7bn1 £73bn1
2017 Estimate £44bn1 £59.7bn1 £83bn1
Change from 2017 to 2019 -£5bn1 -£10.3bn1 -£19bn1
-17%
Appendix 5: Probabilistic Cost DistributionsFigure 28: Decommissioning cost distribution [Updated 2019 inventory, 2018 prices]
Figure 29: Decommissioning cost distribution [Like-for-like comparison with 2017 estimate, 2016 prices]
0
0.5
1
1.5
2
2.5
3
3.5
4
4.5
£32 £40 £47 £54 £62 £69 £77Total Decommissioning Cost (£billions)
Decommissioning Cost DistributionP10
£39bnP50
£49bn P90£64bn
TARGET£39bn
Prob
abili
ty D
ensi
ty F
unct
ion
Valu
e (1
0^-5
)
0
0.5
11.5
2
2.5
3
3.5
4
4.5
£33 £41 £49 £57 £65 £73 £81Prob
abili
ty D
ensi
ty F
unct
ion
Valu
e (1
0^-5
)
Total Decommissioning Cost (£billions)
Decommissioning Cost Distribution
P10£40bn
P50£51bn
P90£67bnTARGET
£39bn
1 Costs shown in 2016 prices, for expenditure in 2017 and after2 Costs shown in 2017 prices, for expenditure in 2018 and after

UKCS Decommissioning Estimate - 2019 41

Oil and Gas Authority is a limited company registered in England and Wales with registered number 09666504 and
VAT registered number 249433979. Our registered office is at 21 Bloomsbury Street, London, United Kingdom, WC1B 3HF
Copyright © Oil and Gas Authority 2019
ogauthority.co.uk


