29
UKCS Decommissioning 2017 Cost Estimate Report June 2017
UKCS Decommissioning 2017 Cost Estimate Report
June 2017
Contents
1 Executive summary 3
2 Introduction 4
3 Purpose of estimate report 6
4 Project scope description 7
5 Estimate methodology 8
6 Estimate class 10
7 Planning basis 11
8 Cost basis 11
9 Allowances 11
10 Assumptions 12
11 Exclusions 12
12 Exceptions 12
13 Risks and opportunities 13
14 Contingencies 14
15 Reconciliation 14
16 Benchmarking 15
17 Estimate quality assurance 15
18 Estimating team 16
Attachments 16
Cover page image courtesy of CNR International & HAF Consortium
UKCS Decommissioning Estimate - 2017 3
1. Executive summary
This report documents the purpose, scope, estimating methodology, inputs, analysis, assurance and outputs of the OGA’s 2017 United Kingdom Continental Shelf (UKCS) Decommissioning Cost Estimate.
The 2016 UKCS Stewardship Survey was used as the data source, with decommissioning cost inputs provided by 34 operators for all current and proposed offshore facilities, pipelines, development wells, suspended open water exploration and appraisal wells and onshore terminals. Data were collected using the Oil & Gas UK Work Breakdown Structure (WBS) as per previous estimates compiled by the Offshore Petroleum Regulator for Environment and Decommissioning (OPRED) and Oil & Gas UK.
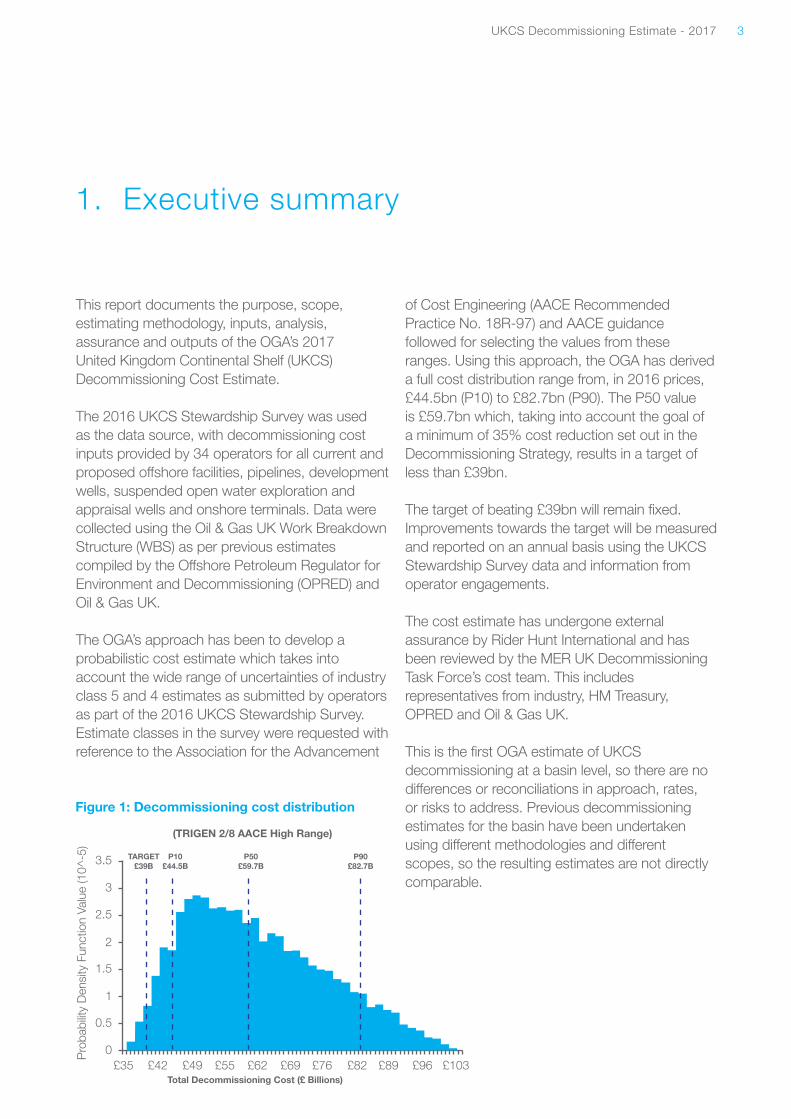
The OGA’s approach has been to develop a probabilistic cost estimate which takes into account the wide range of uncertainties of industry class 5 and 4 estimates as submitted by operators as part of the 2016 UKCS Stewardship Survey. Estimate classes in the survey were requested with reference to the Association for the Advancement
of Cost Engineering (AACE Recommended Practice No. 18R-97) and AACE guidance followed for selecting the values from these ranges. Using this approach, the OGA has derived a full cost distribution range from, in 2016 prices, £44.5bn (P10) to £82.7bn (P90). The P50 value is £59.7bn which, taking into account the goal of a minimum of 35% cost reduction set out in the Decommissioning Strategy, results in a target of less than £39bn.
The target of beating £39bn will remain fixed. Improvements towards the target will be measured and reported on an annual basis using the UKCS Stewardship Survey data and information from operator engagements.
The cost estimate has undergone external assurance by Rider Hunt International and has been reviewed by the MER UK Decommissioning Task Force’s cost team. This includes representatives from industry, HM Treasury, OPRED and Oil & Gas UK.
This is the first OGA estimate of UKCS decommissioning at a basin level, so there are no differences or reconciliations in approach, rates, or risks to address. Previous decommissioning estimates for the basin have been undertaken using different methodologies and different scopes, so the resulting estimates are not directly comparable.
(TRIGEN 2/8 AACE High Range)
Total Decommissioning Cost (£ Billions)£35 £42 £49 £55 £62 £69 £76 £82 £89 £96 £103
TARGET£39B
P10£44.5B
P50£59.7B
P90£82.7B
Pro
babi
lity
Den
sity
Fun
ctio
n Va
lue
(10^
-5)
0
0.5
1
1.5
2
2.5
3
3.5
Figure 1: Decommissioning cost distribution
UKCS Decommissioning Estimate - 2017 4
2. Introduction
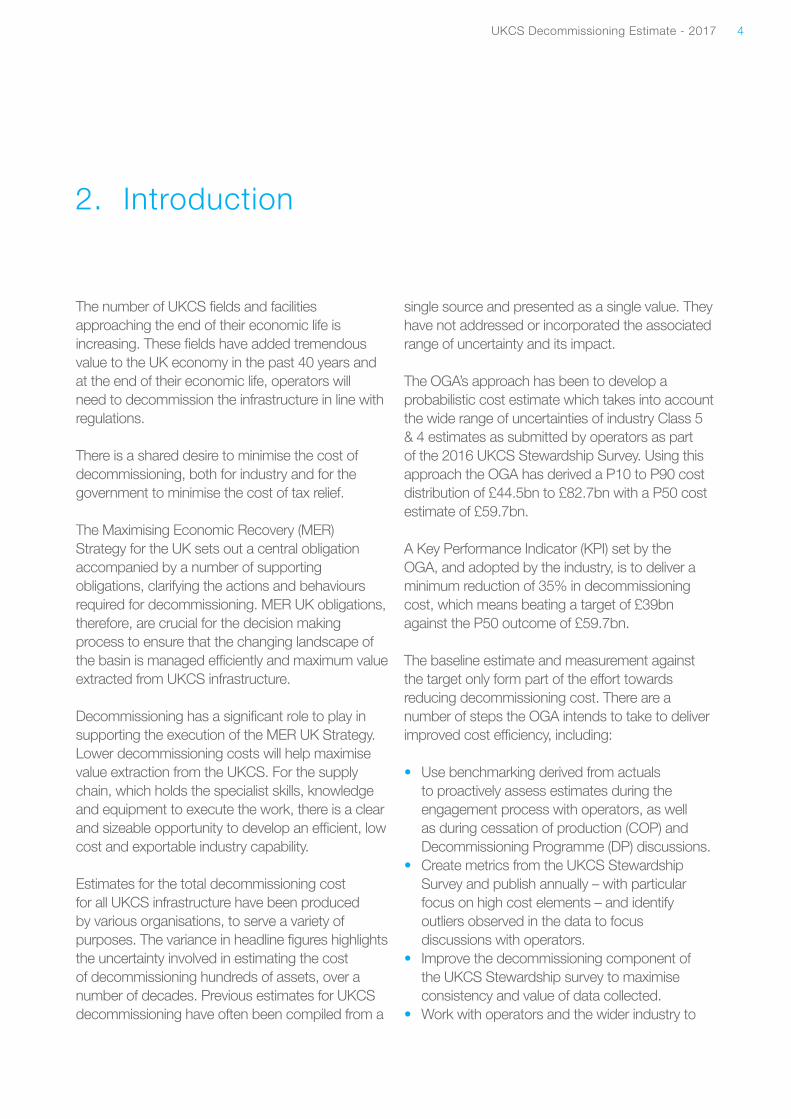
The number of UKCS fields and facilities approaching the end of their economic life is increasing. These fields have added tremendous value to the UK economy in the past 40 years and at the end of their economic life, operators will need to decommission the infrastructure in line with regulations.
There is a shared desire to minimise the cost of decommissioning, both for industry and for the government to minimise the cost of tax relief.
The Maximising Economic Recovery (MER) Strategy for the UK sets out a central obligation accompanied by a number of supporting obligations, clarifying the actions and behaviours required for decommissioning. MER UK obligations, therefore, are crucial for the decision making process to ensure that the changing landscape of the basin is managed efficiently and maximum value extracted from UKCS infrastructure.
Decommissioning has a significant role to play in supporting the execution of the MER UK Strategy. Lower decommissioning costs will help maximise value extraction from the UKCS. For the supply chain, which holds the specialist skills, knowledge and equipment to execute the work, there is a clear and sizeable opportunity to develop an efficient, low cost and exportable industry capability.
Estimates for the total decommissioning cost for all UKCS infrastructure have been produced by various organisations, to serve a variety of purposes. The variance in headline figures highlights the uncertainty involved in estimating the cost of decommissioning hundreds of assets, over a number of decades. Previous estimates for UKCS decommissioning have often been compiled from a
single source and presented as a single value. They have not addressed or incorporated the associated range of uncertainty and its impact.
The OGA’s approach has been to develop a probabilistic cost estimate which takes into account the wide range of uncertainties of industry Class 5 & 4 estimates as submitted by operators as part of the 2016 UKCS Stewardship Survey. Using this approach the OGA has derived a P10 to P90 cost distribution of £44.5bn to £82.7bn with a P50 cost estimate of £59.7bn.
A Key Performance Indicator (KPI) set by the OGA, and adopted by the industry, is to deliver a minimum reduction of 35% in decommissioning cost, which means beating a target of £39bn against the P50 outcome of £59.7bn.
The baseline estimate and measurement against the target only form part of the effort towards reducing decommissioning cost. There are a number of steps the OGA intends to take to deliver improved cost efficiency, including:
• Use benchmarking derived from actuals to proactively assess estimates during the engagement process with operators, as well as during cessation of production (COP) and Decommissioning Programme (DP) discussions.
• Create metrics from the UKCS Stewardship Survey and publish annually – with particular focus on high cost elements – and identify outliers observed in the data to focus discussions with operators.
• Improve the decommissioning component of the UKCS Stewardship survey to maximise consistency and value of data collected.
• Work with operators and the wider industry to
UKCS Decommissioning Estimate - 2017 5
ensure extensive sharing of lessons learned, develop innovative approaches to contracting strategy and enhance capability of the supply chain.
• Actively pursue innovative collaborative solutions to decommissioning, for example the multi-operator well plugging and abandonment (P&A) campaign.1
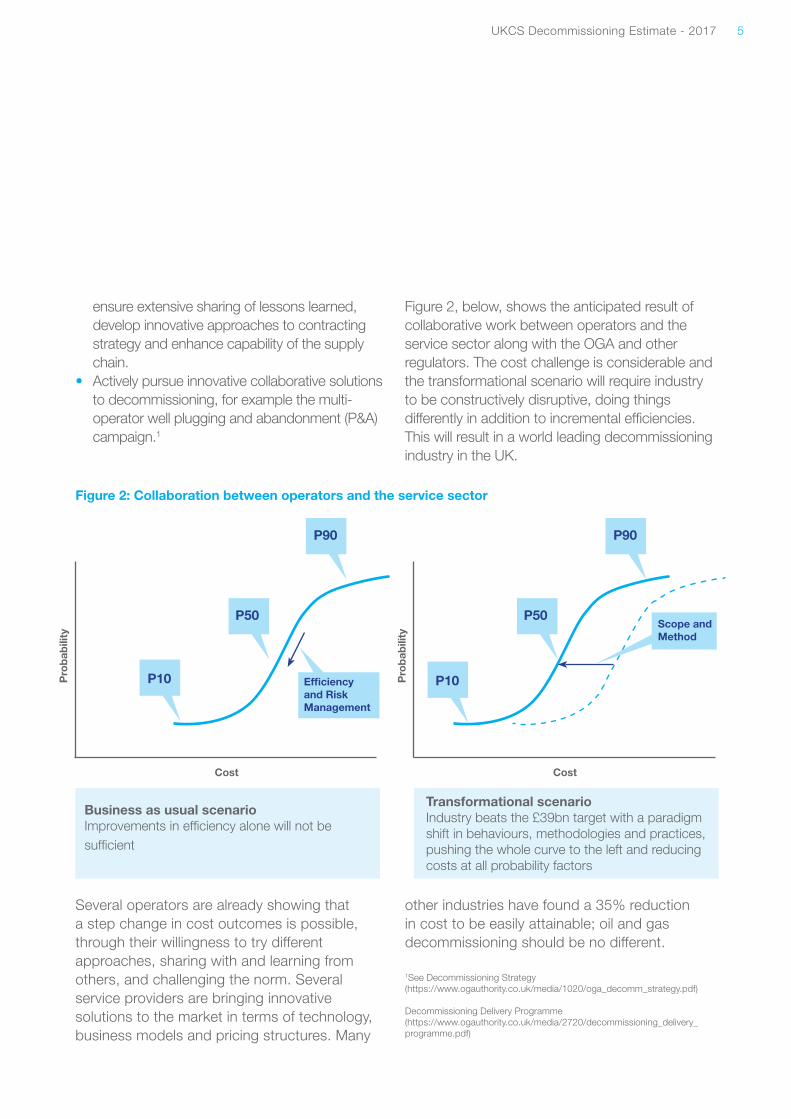
Figure 2, below, shows the anticipated result of collaborative work between operators and the service sector along with the OGA and other regulators. The cost challenge is considerable and the transformational scenario will require industry to be constructively disruptive, doing things differently in addition to incremental efficiencies. This will result in a world leading decommissioning industry in the UK.
Figure 2: Collaboration between operators and the service sector
Several operators are already showing that a step change in cost outcomes is possible, through their willingness to try different approaches, sharing with and learning from others, and challenging the norm. Several service providers are bringing innovative solutions to the market in terms of technology, business models and pricing structures. Many
other industries have found a 35% reduction in cost to be easily attainable; oil and gas decommissioning should be no different.
1See Decommissioning Strategy (https://www.ogauthority.co.uk/media/1020/oga_decomm_strategy.pdf)
Decommissioning Delivery Programme (https://www.ogauthority.co.uk/media/2720/decommissioning_delivery_programme.pdf)
Pro
bab
ility
Pro
bab
ility
CostCost
P10P10
P50P50
P90P90
Scope and Method
Efficiency and Risk Management
Business as usual scenarioImprovements in efficiency alone will not be sufficient
Transformational scenarioIndustry beats the £39bn target with a paradigm shift in behaviours, methodologies and practices, pushing the whole curve to the left and reducing costs at all probability factors
UKCS Decommissioning Estimate - 2017 6
The purpose of this estimate report is to:
• Document the intended use of the estimate• Communicate the critical aspects of the
project cost estimate • Document the processes and methodology
used to develop the estimate• Permit meaningful review and assessment of
the estimate quality
Further specific purposes of this estimate report include:
• Establish the baseline cost estimate to assist the OGA meet its Petroleum Act 1998, as amended by the Energy Act 2016, obligations to review operator estimates and drive cost efficiency
• Document and communicate the target cost for the total UKCS decommissioning effort, which represents a minimum 35% reduction from this estimate
• Document the proposed method for measuring progress towards and beyond the 35% reduction in cost
3. Purpose of estimate report
The project scope includes the decommissioning of UKCS infrastructure including:
• All facilities and development wells currently in place and yet to be decommissioned
• All facilities and development wells currently undergoing decommissioning, excluding work performed prior to and including 2016
• All sanctioned facilities and wells not yet in place
• All proposed project developments, not yet sanctioned or built weighted by probability
• All intra-field pipelines and export lines• Suspended open water exploration and
appraisal wells• Onshore terminals and Wytch Farm
For facilities due to cease production prior to, and including, 2025, the estimate raw data have
been collected using the following Oil & Gas UK Work Breakdown Structure:
• Project management• Facilities costs (Post COP OPEX)• Wells abandonment• Facilities making safe• Topsides preparation• Topsides removal• Substructure removal• Onshore recycling• Subsea infrastructure• Site remediation • Monitoring
For facilities due to cease production following 2025, the estimate raw data have been gathered at the overall facility level.
4. Project scope description
UKCS Decommissioning Estimate - 2017 7
5. Estimate methodology
This estimate has been prepared probabilistically, with an accompanying deterministic assurance estimate, using cost information sourced directly from operators from the 2016 UKCS Stewardship Survey.
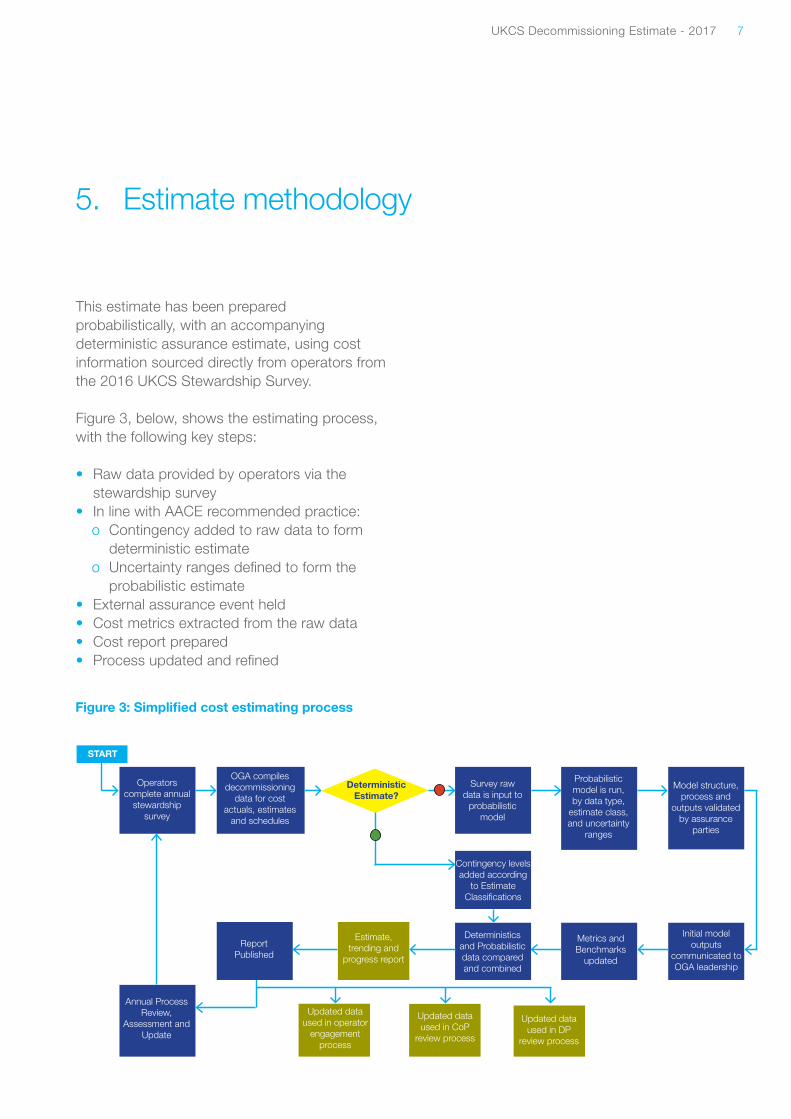
Figure 3, below, shows the estimating process, with the following key steps:
• Raw data provided by operators via the stewardship survey
• In line with AACE recommended practice:o Contingency added to raw data to form
deterministic estimateo Uncertainty ranges defined to form the
probabilistic estimate• External assurance event held• Cost metrics extracted from the raw data• Cost report prepared• Process updated and refined
Figure 3: Simplified cost estimating process
Operators complete annual
stewardship survey
OGA compiles decommissioning
data for cost actuals, estimates
and schedules
DeterministicEstimate?
Survey raw data is input to
probabilistic model
Probabilistic model is run, by data type,
estimate class, and uncertainty
ranges
Model structure, process and
outputs validated by assurance
parties
Contingency levels added according
to Estimate Classifications
Report Published
Estimate, trending and
progress report
Deterministics and Probabilistic data compared and combined
Metrics and Benchmarks
updated
Initial model outputs
communicated to OGA leadership
Annual Process Review,
Assessment and Update
START
Updated data used in operator
engagement process
Updated data used in CoP
review process
Updated data used in DP
review process
UKCS Decommissioning Estimate - 2017 8
The classification of estimate raw data, as provided by the survey respondents, was used to determine the appropriate contingency levels for the deterministic estimate and the ranges of uncertainty for the probabilistic estimate, all in line with recommended practice of the AACE.
The deterministic assurance estimate was established by the addition of a contingency percentage on the raw data to provide a point of comparison against the probabilistic P50.
For the probabilistic estimate, the estimate class defined the uncertainty range, as per AACE recommended practice. The tri-gen distribution shape was selected, to account for estimating bias, which tends to result in a narrow range of outcomes. The uncertainty, or accuracy, range results in the 90% confidence level of cost outcomes (18R-97 Feb 2005); that is, the project outcome can be expected to fall within the stated range 90% of the time. This is felt to
be the appropriate range for decommissioning projects.
The remaining 10% of possible outcomes was divided with 8% above the 90% confidence level and 2% below the confidence level. This unequal distribution was selected to reflect typical optimism of estimating and the probability of most estimates being provisioning rather than project estimates.
A Spearman rank-order correlation coefficient input value of 0.7 was applied across the cost data inputs due to the strong relationship between the variables. A simple sensitivity analysis of the distributions is included in Attachment D.
UKCS Decommissioning Estimate - 2017 9
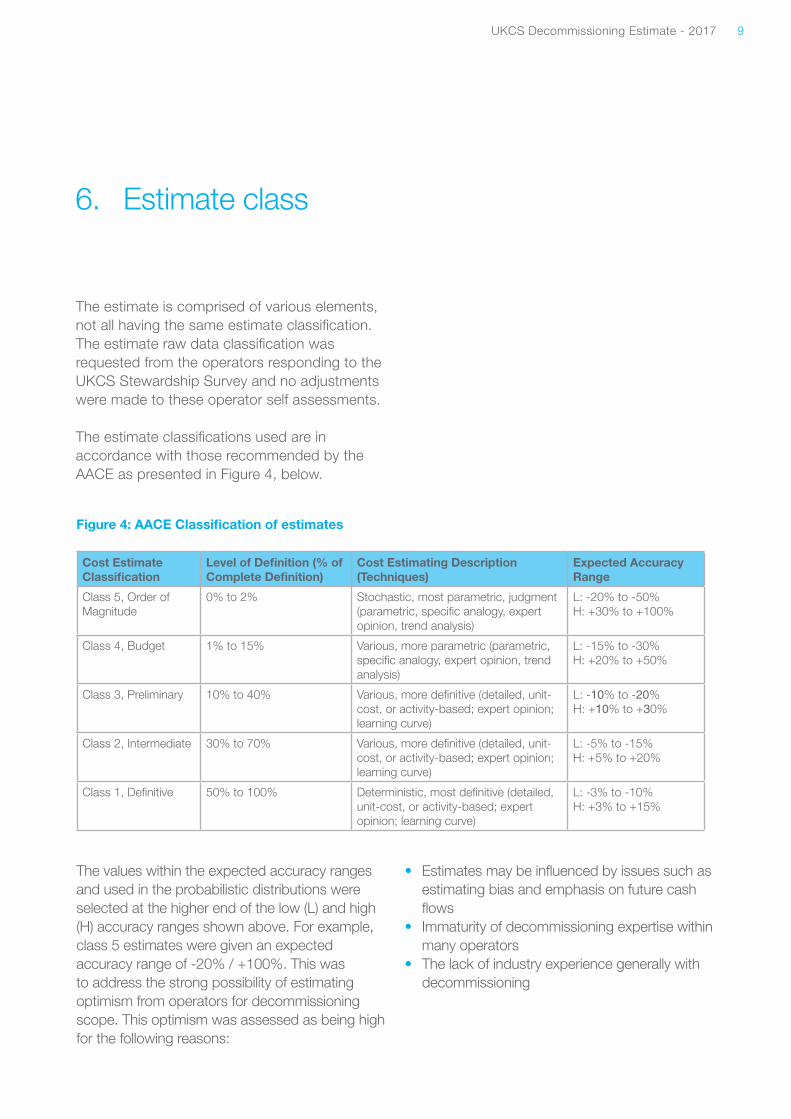
The estimate is comprised of various elements, not all having the same estimate classification. The estimate raw data classification was requested from the operators responding to the UKCS Stewardship Survey and no adjustments were made to these operator self assessments.
The estimate classifications used are in accordance with those recommended by the AACE as presented in Figure 4, below.
6. Estimate class
Cost Estimate Classification
Level of Definition (% of Complete Definition)
Cost Estimating Description (Techniques)
Expected Accuracy Range
Class 5, Order of Magnitude
0% to 2% Stochastic, most parametric, judgment (parametric, specific analogy, expert opinion, trend analysis)
L: -20% to -50%H: +30% to +100%
Class 4, Budget 1% to 15% Various, more parametric (parametric, specific analogy, expert opinion, trend analysis)
L: -15% to -30%H: +20% to +50%
Class 3, Preliminary 10% to 40% Various, more definitive (detailed, unit-cost, or activity-based; expert opinion; learning curve)
L: -10% to -20%H: +10% to +30%
Class 2, Intermediate 30% to 70% Various, more definitive (detailed, unit-cost, or activity-based; expert opinion; learning curve)
L: -5% to -15%H: +5% to +20%
Class 1, Definitive 50% to 100% Deterministic, most definitive (detailed, unit-cost, or activity-based; expert opinion; learning curve)
L: -3% to -10%H: +3% to +15%
Figure 4: AACE Classification of estimates
The values within the expected accuracy ranges and used in the probabilistic distributions were selected at the higher end of the low (L) and high (H) accuracy ranges shown above. For example,class 5 estimates were given an expectedaccuracy range of -20% / +100%. This wasto address the strong possibility of estimatingoptimism from operators for decommissioningscope. This optimism was assessed as being highfor the following reasons:
• Estimates may be influenced by issues such asestimating bias and emphasis on future cashflows
• Immaturity of decommissioning expertise withinmany operators
• The lack of industry experience generally withdecommissioning
UKCS Decommissioning Estimate - 2017 10
As requested within the UKCS Stewardship Survey, it has been assumed that operators have assessed the costs based on today’s market rates and with the application of today’s technology. There is a risk that allowances for “future factors” or technical advancement may have been taken and resulted in lower estimates, but given the approach in selecting estimate classes and accuracy ranges described in Section 5.0 above, it was considered inappropriate to adjust the estimates any further.
It is felt the current classification of estimates, as a largely ‘order of magnitude’ maturity allows for a number of execution and contracting strategy solutions, so no detail needed to be assumed at a work breakdown structure level.
Also, unlike specific project estimates, no event driven risks or discrete opportunities were quantified within the estimate.
7. Planning basis
The cost basis for the UKCS overall cost was derived from the operators as part of the 2016 UKCS Stewardship Survey. No detailed analyses of asset configuration were performed, on the basis that the operators were best placed to understand the scope, condition and proposed end-state of the decommissioning scope for specific facilities.As with the planning basis, it is felt that the
current classification of estimates, as a largely ‘order of magnitude’ maturity allows for a number of execution and contracting strategy solutions, so no detail on market prices, or rate sources, needed to be assumed at a work breakdown structure level.
8. Cost basis
9. Allowances
No additional allowances have been included.
UKCS Decommissioning Estimate - 2017 11
The following assumptions have been made regarding the framework and environment for the work within the estimate:
• 2016 pricing has been provided by the operators, as requested in survey
• Estimate classes as defined by operators are correct
• Current working and contracting methods are employed
• Post 2025 estimates provided by operators are all Class 5
• Contractor availability will not be a constraint and the work demand will be actively managed to ensure no pricing spikes
10. Assumptions
11. Exclusions
The following items are excluded from the estimate
• Future factors; for exampleo New technologyo Improved contracting methods
• Aggregation of scope across operators• Inflation• Event driven risks• Specific opportunities for cost reduction
No specific estimating exceptions have been considered.
12. Exceptions
UKCS Decommissioning Estimate - 2017 12
13. Risks and opportunities
No specific event driven risks or opportunities have been quantified within the estimate. The following issues are recognised, however, but not quantified. The recommended treatment to mitigate or eliminate these risks and issues is through effective and robust management plans.
Issues:
• Operator behaviours: There is a strong preference to favour cash flow over NPV in decision making around decommissioning. This can defer expenditures which can help in the short term, but could create problems and increased costs in the longer term.
• Estimating bias: Some operators may be pushed to be optimistic in developing provisioning estimates and this can result in lower values, knowingly or otherwise.
• Clear sea bed: A presumption of a clear sea bed in all circumstances, which may prevent operators from providing appropriately considered comparative assessment proposals.
In addition to the above issues, there are a number of event driven risks and opportunities. Again these have not been quantified and the recommended treatment is to effectively manage the risk and opportunities effectively to eliminate or realise them.
Key risks:
• Operators commence planning for decommissioning too late, thereby eliminating cost saving alternatives.
• Traditional investment project approaches are adopted for the planning, managing and executing of decommissioning projects, unnecessarily over-engineering the solutions and increasing the cost.
• A lack of investment in new technologies and transfer of existing technologies from other industry sectors fails to capture cost reduction opportunities.
Key opportunities:
• New entrants to the market initiate a different approach, contracting solutions, and pricing basis for decommissioning projects.
• Innovative cost reducing technologies or techniques are implemented for well P&A activities.
• Campaign-based approaches such as the multi-operator well P&A campaign.
• Regulations are complied with intelligently, consistently and appropriately, to ensure safe and environmentally acceptable outcomes, at minimum cost.
• Close working between the OGA and industry help facilitate lessons learned, improve knowledge and increase collaboration.
• Improving asset stewardship through late life into COP and decommissioning.
UKCS Decommissioning Estimate - 2017 13
Contingency for the deterministic estimate has been derived from the AACE recommended practice for the appropriate classification of estimates, as presented by operator respondents to the UKCS Stewardship Survey. Given the uncertainty of the frequency and level of contingency contained within the raw survey data, a judgment was made to add in only half the recommended contingency percentage for a class 5 cost estimate. This equated to a 25% contingency being added across all raw data.
Contingency requirements for the probabilistic are derived from the Monte Carlo runs, and are dependent on the degree of certainty (P-factor) selected, from P1 to P100. For a P50 level of confidence, this equates to a 27% contingency addition over the estimate raw data.
There is no separate allowance or calculation for management reserve.
14. Contingencies
15. Reconciliation
This is the first OGA estimate for UKCS decommissioning at the basin level, so there are no differences in approach, rates, or risks to address.
The previous estimates developed by OPRED, the most recent being £52bn, were deterministic estimates, using different data sources and excluded areas within the OGA estimate such as terminals, exploration and appraisal wells and future projects. This difference of source data, methodology and basis constrains meaningful reconciliation.
Moving forward, reconciliation on the estimate will be performed on an annual basis.
This reconciliation will not only document what has changed from one year to the next, but also communicate progress towards meeting and then beating the target total cost of less than £39bn for the UKCS decommissioning scope. More information on this process is included in Attachment C.
UKCS Decommissioning Estimate - 2017 14
There are limited cost outcomes for previously executed projects against which to benchmark the overall estimate.
Initial benchmarks and metrics will be constructed from the survey data and two comparisons will be carried out:
• The metrics extracted from the estimate will be compared against the limited number of actual project outcomes to compare estimates with actuals. As the number of executed projects increase, the usefulness of this comparison will increase dramatically.
• The metrics extracted from the estimate will be filtered and sorted to identify cost differentiators, thereby increasing their value and applicability to other projects and operators.
These metrics will be widely shared with the industry as part of future annual estimate updates. In addition, specific operator positioning within the range of metrics will be shared and discussed with operators as part of the engagement process and the reviews of applications for COP and submission of Decommissioning Programmes.
16. Benchmarking
17. Estimate quality assurance
The following assurances were carried out:
• Internal presentation and discussion of the process and outcomes
• Discussion of the estimate process and outcomes with the Decommissioning Task Force sponsor
• Review of the estimating process with an independent third party cost estimating expert (Rider Hunt International)
• Presentation of, and discussion relating to, the estimating process with HMT, HMRC and OPRED/BEIS
Assurance on the progress measurement process is ongoing internally within the OGA.
UKCS Decommissioning Estimate - 2017 15
The estimating team included the following:
• All operators through their completion of the UKCS Stewardship Survey
• The MER UK Decommissioning Task Force’s Cost Certainty and Reduction team, including:o OGAo OPREDo HMTo Oil & Gas UK
18. Estimating team
Attachments
Attachment A: Overall cost estimate graphicsAttachment B: Cost estimate statisticsAttachment C: Cost improvement measurement
processAttachment D: Estimate sensitivity analyses
UKCS Decommissioning Estimate - 2017 16
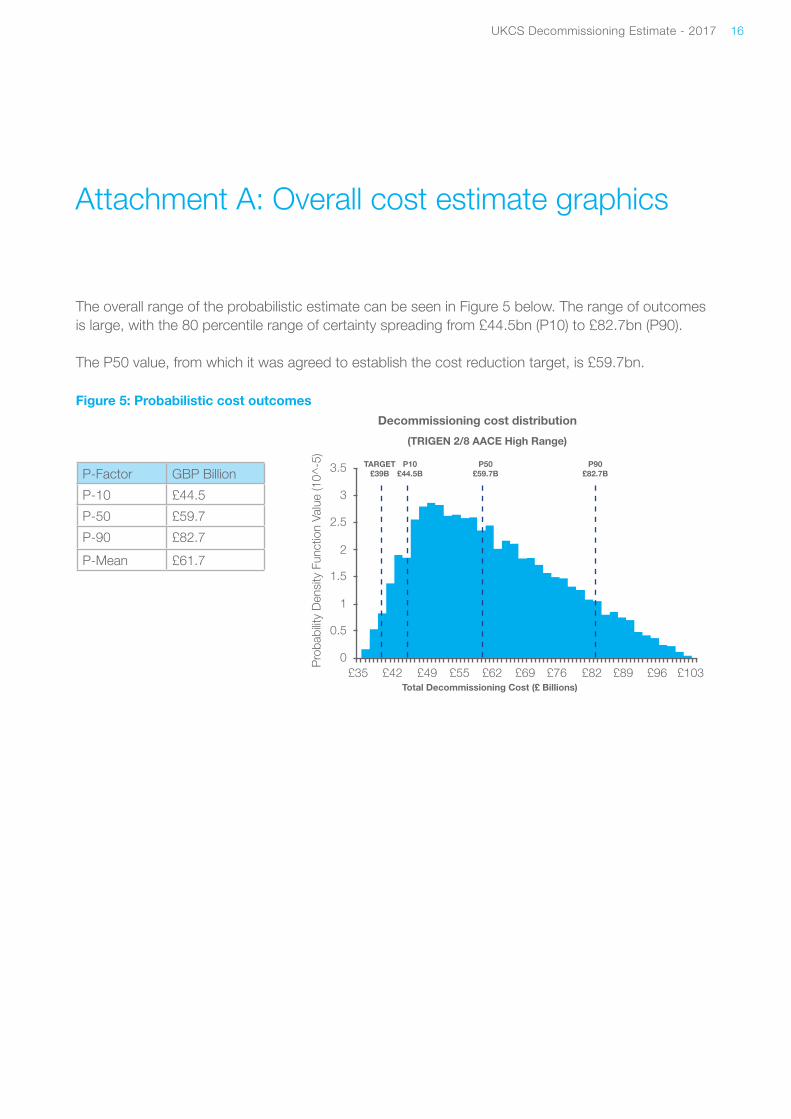
The overall range of the probabilistic estimate can be seen in Figure 5 below. The range of outcomes is large, with the 80 percentile range of certainty spreading from £44.5bn (P10) to £82.7bn (P90).
The P50 value, from which it was agreed to establish the cost reduction target, is £59.7bn.
Figure 5: Probabilistic cost outcomes
Attachment A: Overall cost estimate graphics
P-Factor GBP Billion
P-10 £44.5
P-50 £59.7
P-90 £82.7
P-Mean £61.7
(TRIGEN 2/8 AACE High Range)
Total Decommissioning Cost (£ Billions)£35 £42 £49 £55 £62 £69 £76 £82 £89 £96 £103
TARGET£39B
P10£44.5B
P50£59.7B
P90£82.7B
Pro
babi
lity
Den
sity
Fun
ctio
n Va
lue
(10^
-5)
0
0.5
1
1.5
2
2.5
3
3.5
Decommissioning cost distribution
UKCS Decommissioning Estimate - 2017 17
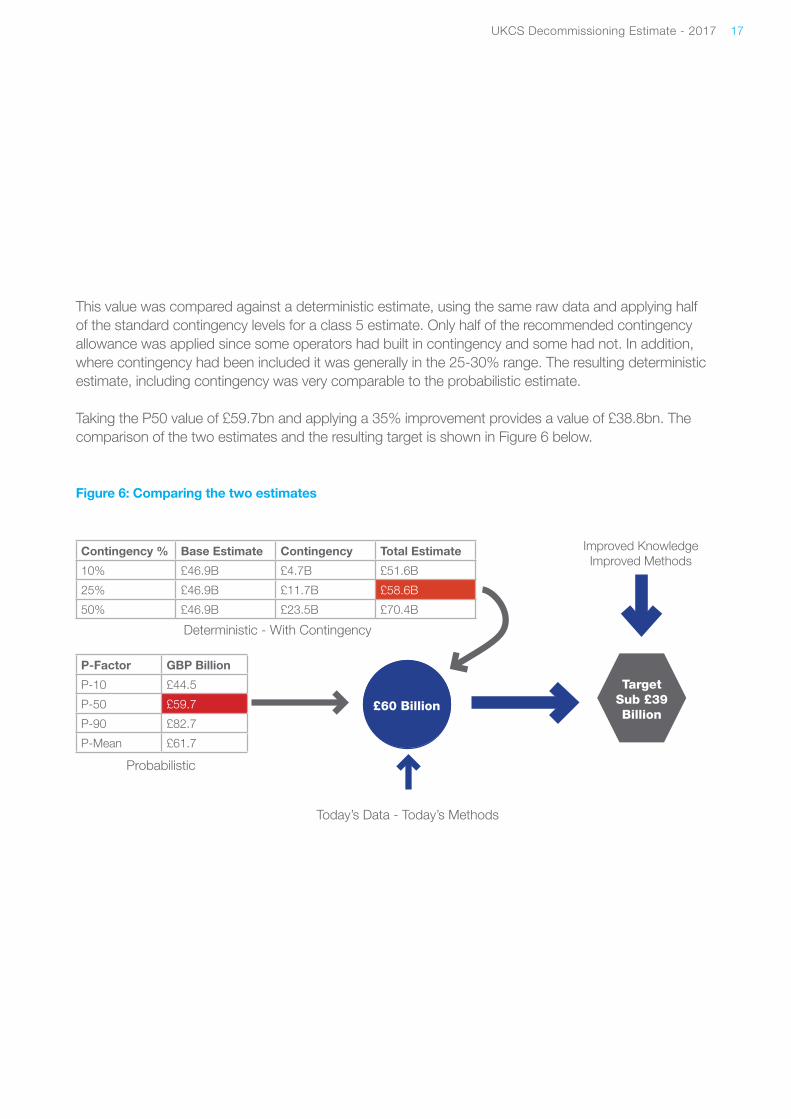
This value was compared against a deterministic estimate, using the same raw data and applying half of the standard contingency levels for a class 5 estimate. Only half of the recommended contingency allowance was applied since some operators had built in contingency and some had not. In addition, where contingency had been included it was generally in the 25-30% range. The resulting deterministic estimate, including contingency was very comparable to the probabilistic estimate.
Taking the P50 value of £59.7bn and applying a 35% improvement provides a value of £38.8bn. The comparison of the two estimates and the resulting target is shown in Figure 6 below.
Figure 6: Comparing the two estimates
Contingency % Base Estimate Contingency Total Estimate
10% £46.9B £4.7B £51.6B
25% £46.9B £11.7B £58.6B
50% £46.9B £23.5B £70.4B
P-Factor GBP Billion
P-10 £44.5
P-50 £59.7
P-90 £82.7
P-Mean £61.7
Deterministic - With Contingency
Probabilistic
£60 Billion
Improved KnowledgeImproved Methods
TargetSub £39Billion
Today’s Data - Today’s Methods
UKCS Decommissioning Estimate - 2017 18
The raw data provided in the 2016 UKCS Stewardship Survey can be analysed and presented in many ways. Initial views of the data are:
• Overall cost estimate broken down by geographical region• Overall cost estimate broken down by high level WBS element• Overall cost estimate broken down by estimate class
B.1 Overall geographical region weighting
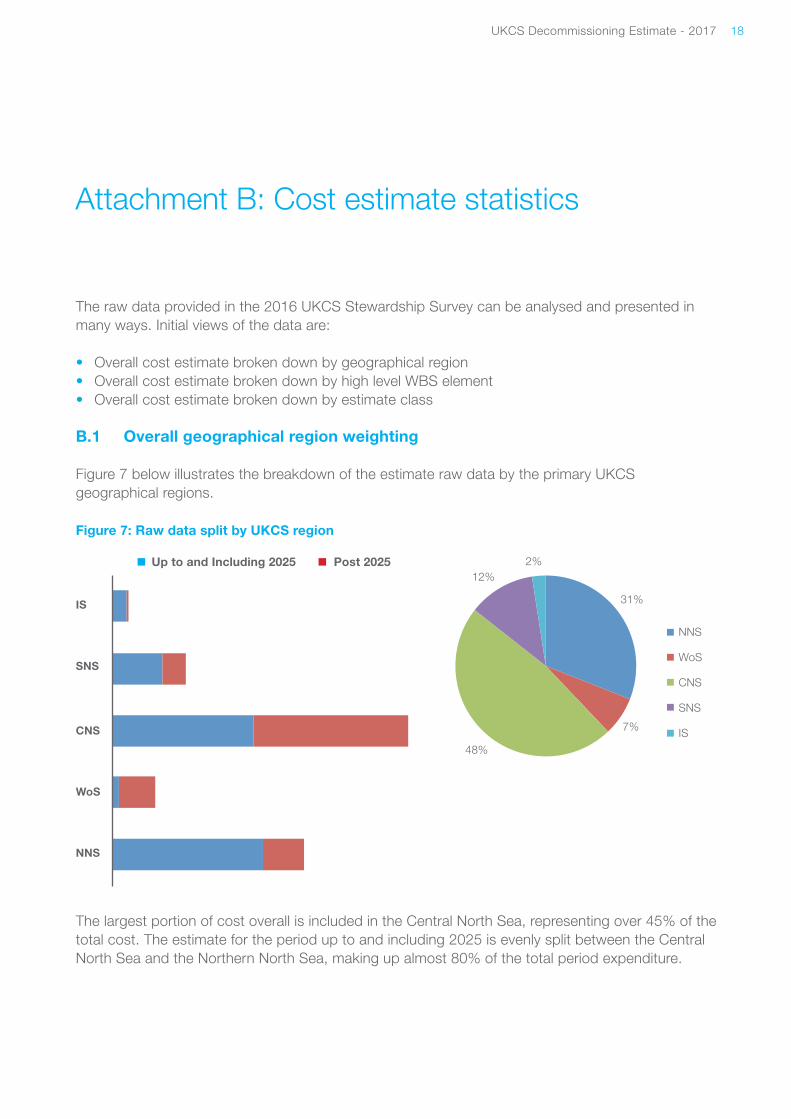
Figure 7 below illustrates the breakdown of the estimate raw data by the primary UKCS geographical regions.
Figure 7: Raw data split by UKCS region
The largest portion of cost overall is included in the Central North Sea, representing over 45% of the total cost. The estimate for the period up to and including 2025 is evenly split between the Central North Sea and the Northern North Sea, making up almost 80% of the total period expenditure.
Attachment B: Cost estimate statistics
IS
SNS
CNS
WoS
NNS
Up to and Including 2025 Post 2025
NNS
WoS
CNS
SNS
IS
48%
12%2%
31%
7%
UKCS Decommissioning Estimate - 2017 19
B.2 Overall WBS element weighting
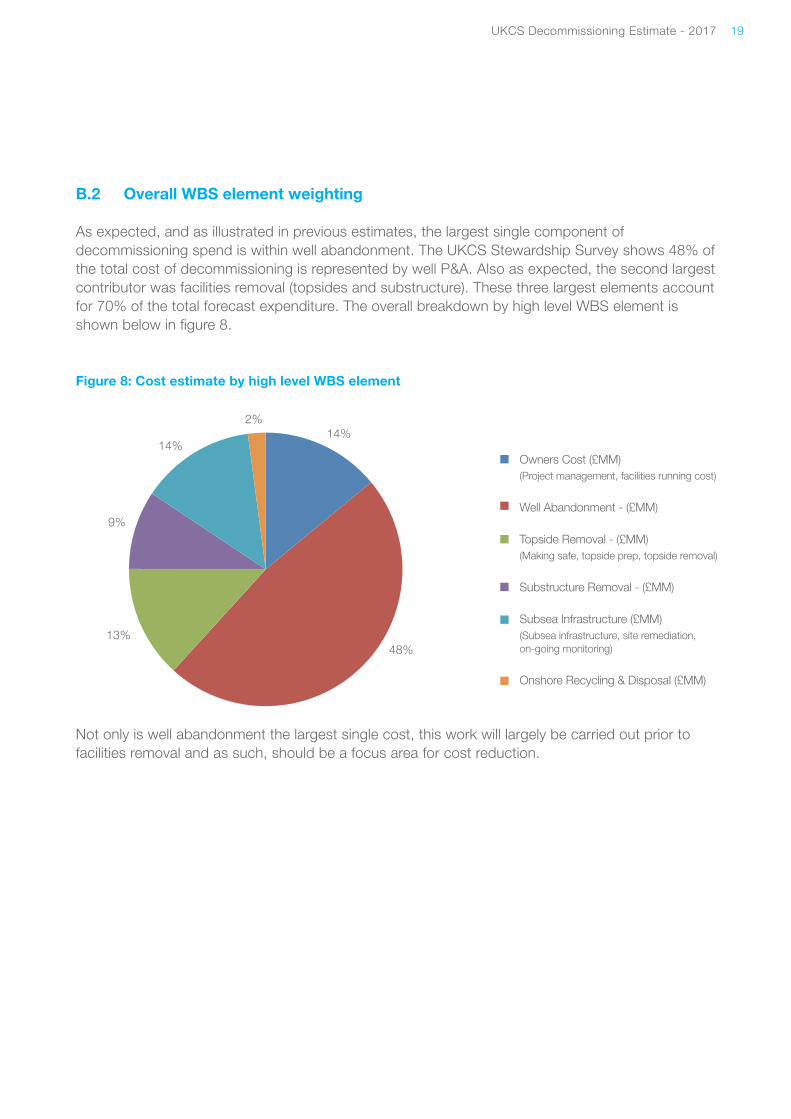
As expected, and as illustrated in previous estimates, the largest single component of decommissioning spend is within well abandonment. The UKCS Stewardship Survey shows 48% of the total cost of decommissioning is represented by well P&A. Also as expected, the second largest contributor was facilities removal (topsides and substructure). These three largest elements account for 70% of the total forecast expenditure. The overall breakdown by high level WBS element is shown below in figure 8.
Figure 8: Cost estimate by high level WBS element
Not only is well abandonment the largest single cost, this work will largely be carried out prior to facilities removal and as such, should be a focus area for cost reduction.
2%14%
48%
14%
9%
13%
Owners Cost (£MM)(Project management, facilities running cost)
Well Abandonment - (£MM)
Topside Removal - (£MM)(Making safe, topside prep, topside removal)
Substructure Removal - (£MM)
Subsea Infrastructure (£MM)(Subsea infrastructure, site remediation, on-going monitoring)
Onshore Recycling & Disposal (£MM)
UKCS Decommissioning Estimate - 2017 20
B.3 Overall cost estimate by estimate class
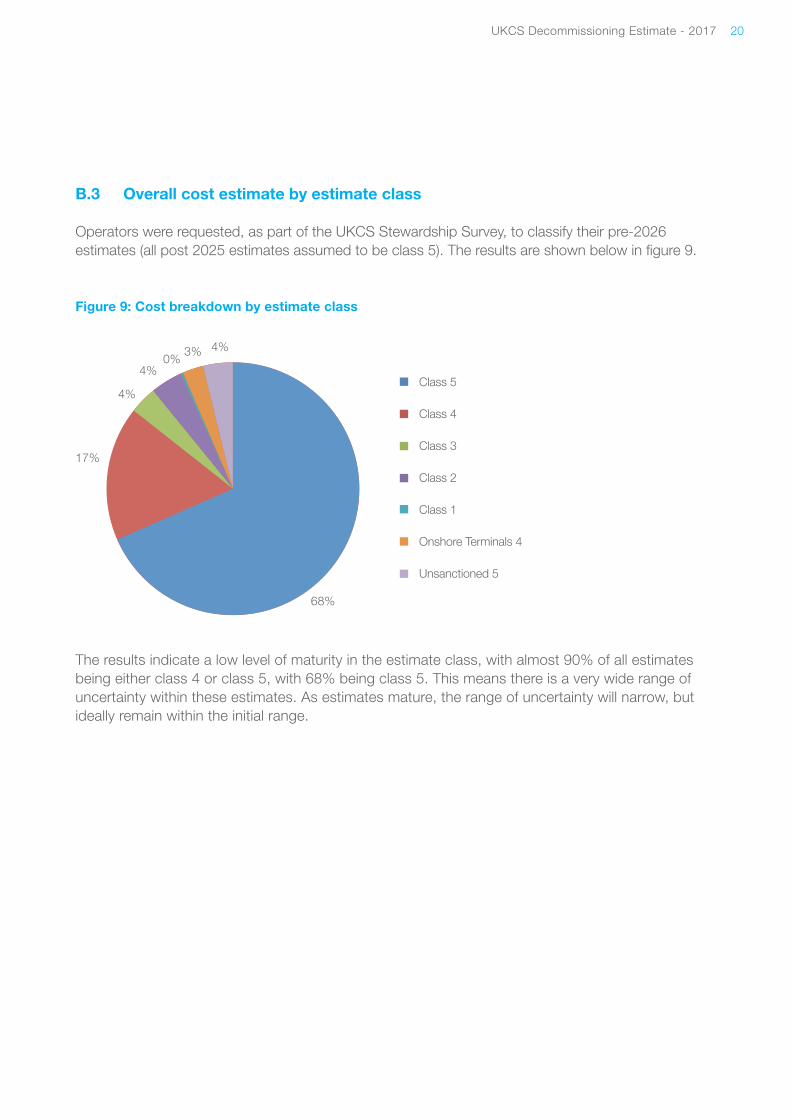
Operators were requested, as part of the UKCS Stewardship Survey, to classify their pre-2026 estimates (all post 2025 estimates assumed to be class 5). The results are shown below in figure 9.
Figure 9: Cost breakdown by estimate class
The results indicate a low level of maturity in the estimate class, with almost 90% of all estimates being either class 4 or class 5, with 68% being class 5. This means there is a very wide range of uncertainty within these estimates. As estimates mature, the range of uncertainty will narrow, but ideally remain within the initial range.
Class 5
Class 4
Class 3
Class 2
Class 1
Onshore Terminals 4
Unsanctioned 5
17%
4%
0%4%
3% 4%
68%
UKCS Decommissioning Estimate - 2017 21
C.1 Introduction
While the establishment of the initial estimating range and the cost reduction target are important steps towards the successful delivery of lower cost decommissioning, there is a need to define and agree a robust process for measuring and reporting progress towards this goal.
The communication of performance and progress must be simple and meaningful, demonstrating how the industry is moving towards, or further from, the target cost outcome.This process to generate this performance score should equally be clear, credible and reasonable, while still addressing the large number of variables that could impact the estimate values and range of uncertainty over such a large complex work scope, planned to be executed over a number of decades.
The following sections describe how the performance score can be measured and communicated, the process to achieve this score and the variables that need to be addressed as part of the process.
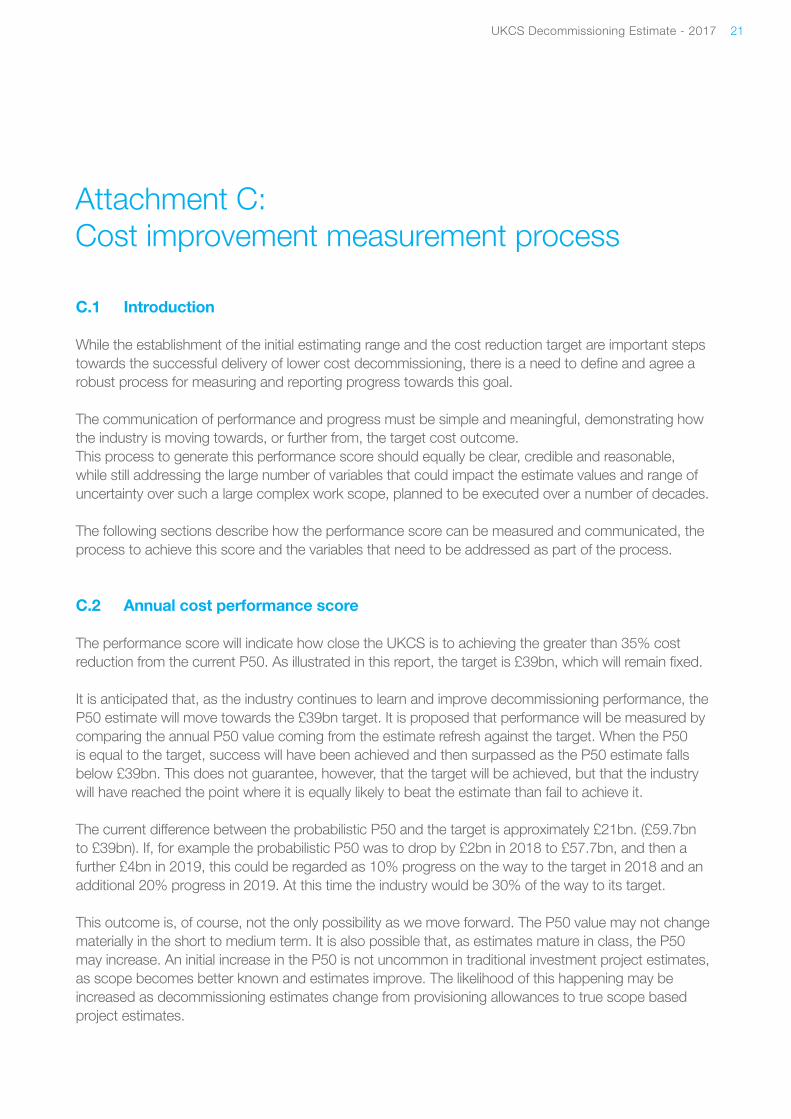
C.2 Annual cost performance score
The performance score will indicate how close the UKCS is to achieving the greater than 35% cost reduction from the current P50. As illustrated in this report, the target is £39bn, which will remain fixed.
It is anticipated that, as the industry continues to learn and improve decommissioning performance, the P50 estimate will move towards the £39bn target. It is proposed that performance will be measured by comparing the annual P50 value coming from the estimate refresh against the target. When the P50 is equal to the target, success will have been achieved and then surpassed as the P50 estimate falls below £39bn. This does not guarantee, however, that the target will be achieved, but that the industry will have reached the point where it is equally likely to beat the estimate than fail to achieve it.
The current difference between the probabilistic P50 and the target is approximately £21bn. (£59.7bn to £39bn). If, for example the probabilistic P50 was to drop by £2bn in 2018 to £57.7bn, and then a further £4bn in 2019, this could be regarded as 10% progress on the way to the target in 2018 and an additional 20% progress in 2019. At this time the industry would be 30% of the way to its target.
This outcome is, of course, not the only possibility as we move forward. The P50 value may not change materially in the short to medium term. It is also possible that, as estimates mature in class, the P50 may increase. An initial increase in the P50 is not uncommon in traditional investment project estimates, as scope becomes better known and estimates improve. The likelihood of this happening may be increased as decommissioning estimates change from provisioning allowances to true scope based project estimates.
Attachment C: Cost improvement measurement process
UKCS Decommissioning Estimate - 2017 22
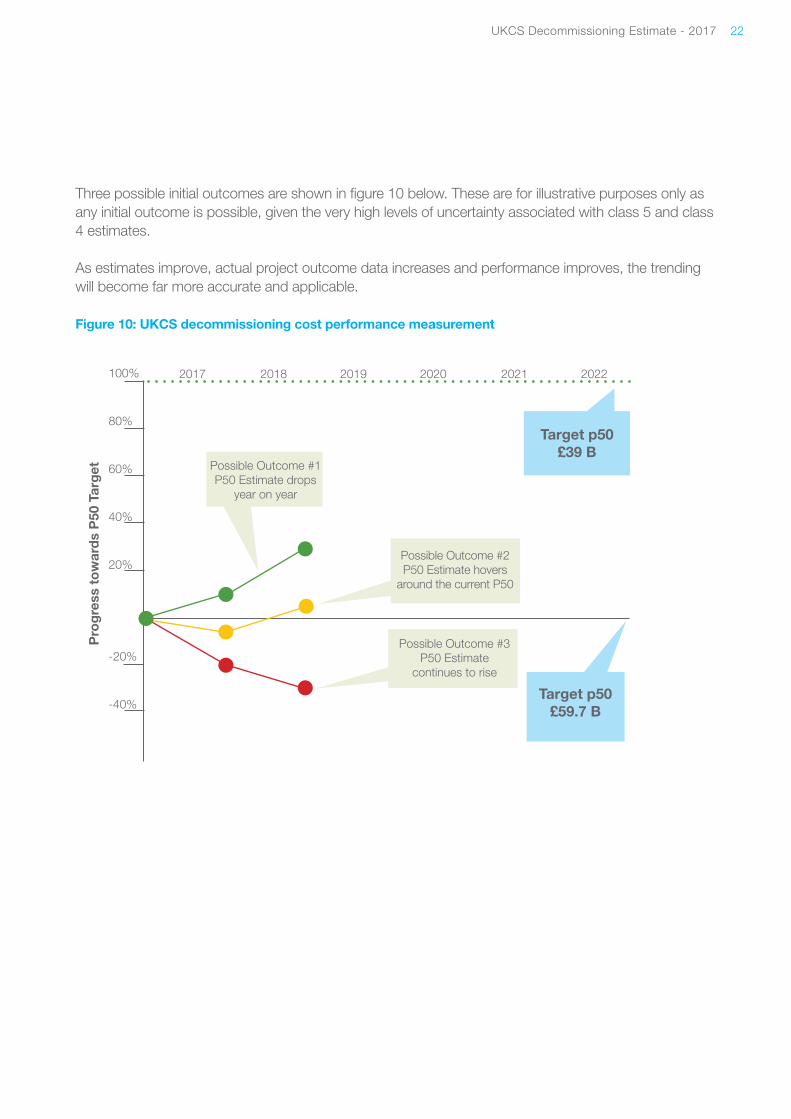
Three possible initial outcomes are shown in figure 10 below. These are for illustrative purposes only as any initial outcome is possible, given the very high levels of uncertainty associated with class 5 and class 4 estimates.
As estimates improve, actual project outcome data increases and performance improves, the trending will become far more accurate and applicable.
Figure 10: UKCS decommissioning cost performance measurement
100%
80%
60%
40%
20%
-20%
-40%
Possible Outcome #1P50 Estimate drops
year on year
Possible Outcome #2P50 Estimate hovers
around the current P50
Possible Outcome #3P50 Estimate
continues to rise
Target p50£39 B
Target p50£59.7 B
2017 2018 2019 2020 2021 2022
Pro
gre
ss t
ow
ard
s P
50 T
arg
et
UKCS Decommissioning Estimate - 2017 23
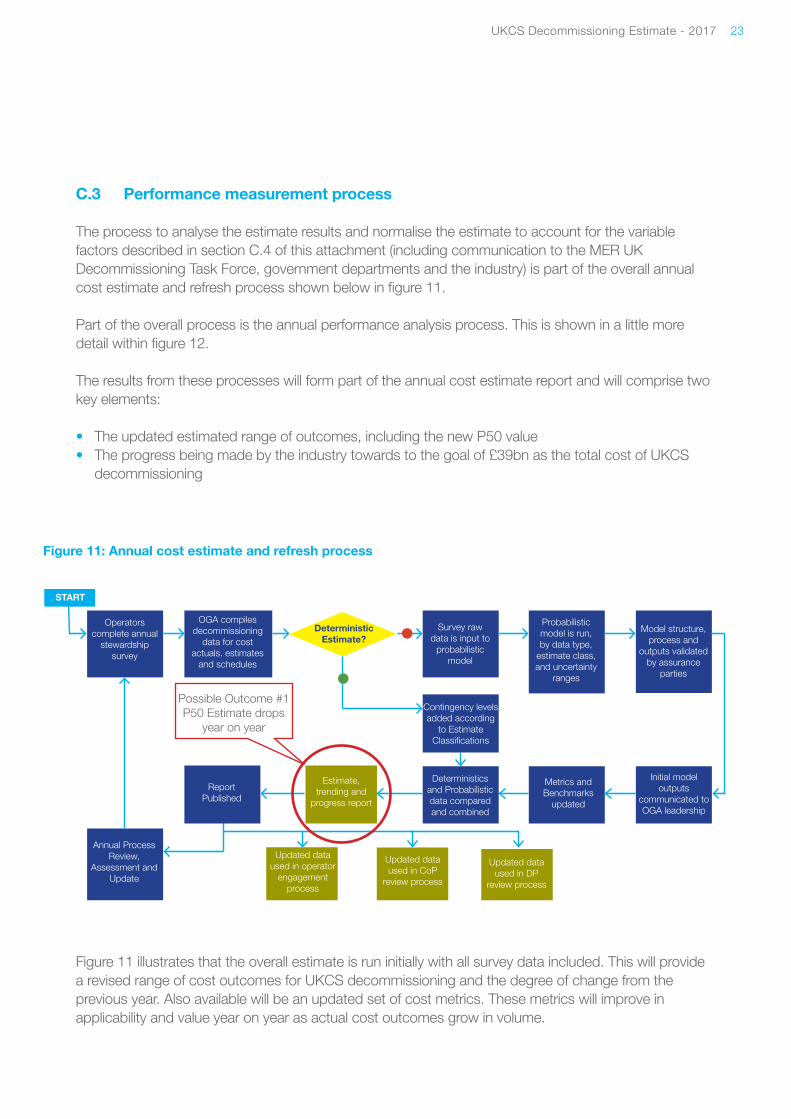
C.3 Performance measurement process
The process to analyse the estimate results and normalise the estimate to account for the variable factors described in section C.4 of this attachment (including communication to the MER UK Decommissioning Task Force, government departments and the industry) is part of the overall annual cost estimate and refresh process shown below in figure 11.
Part of the overall process is the annual performance analysis process. This is shown in a little more detail within figure 12.
The results from these processes will form part of the annual cost estimate report and will comprise two key elements:
• The updated estimated range of outcomes, including the new P50 value• The progress being made by the industry towards to the goal of £39bn as the total cost of UKCS
decommissioning
Figure 11: Annual cost estimate and refresh process
Operators complete annual
stewardship survey
OGA compiles decommissioning
data for cost actuals. estimates
and schedules
DeterministicEstimate?
Survey raw data is input to
probabilistic model
Probabilistic model is run, by data type,
estimate class, and uncertainty
ranges
Model structure, process and
outputs validated by assurance
parties
Contingency levels added according
to Estimate Classifications
Report Published
Estimate, trending and
progress report
Deterministics and Probabilistic data compared and combined
Metrics and Benchmarks
updated
Initial model outputs
communicated to OGA leadership
Annual Process Review,
Assessment and Update
START
Updated data used in operator
engagement process
Updated data used in CoP
review process
Updated data used in DP
review process
Possible Outcome #1P50 Estimate drops
year on year
Figure 11 illustrates that the overall estimate is run initially with all survey data included. This will provide a revised range of cost outcomes for UKCS decommissioning and the degree of change from the previous year. Also available will be an updated set of cost metrics. These metrics will improve in applicability and value year on year as actual cost outcomes grow in volume.
UKCS Decommissioning Estimate - 2017 24
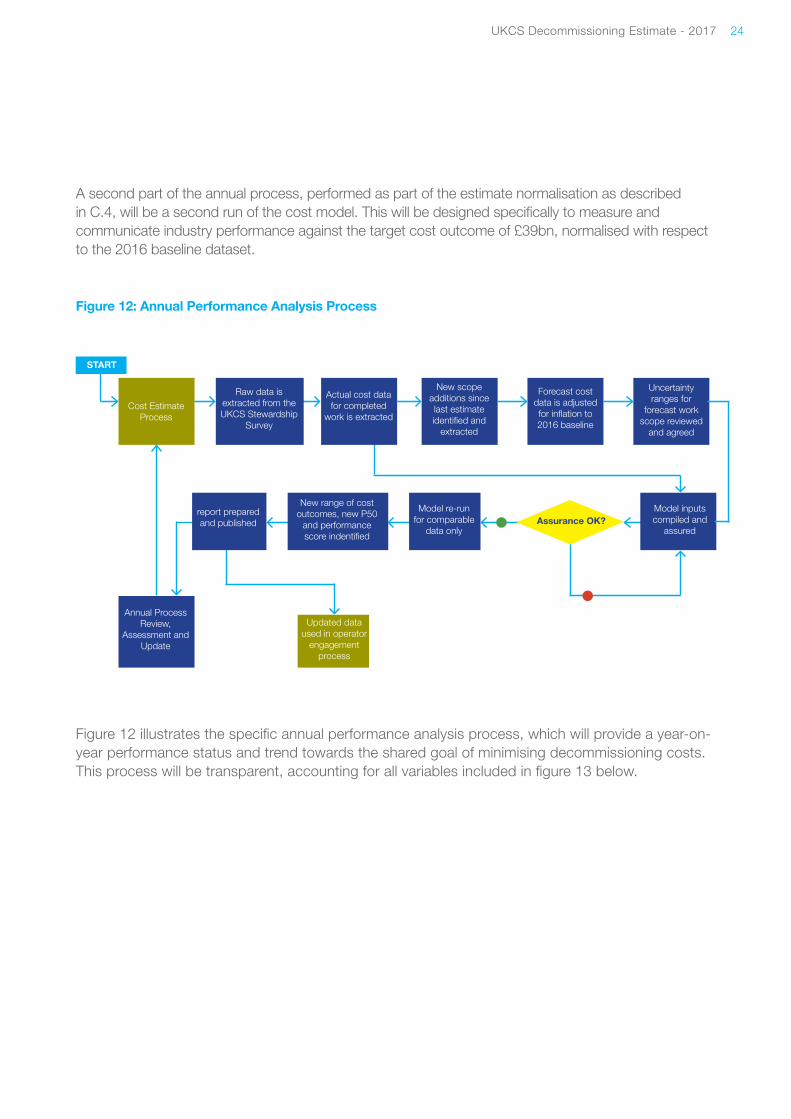
A second part of the annual process, performed as part of the estimate normalisation as described in C.4, will be a second run of the cost model. This will be designed specifically to measure and communicate industry performance against the target cost outcome of £39bn, normalised with respect to the 2016 baseline dataset.
Figure 12: Annual Performance Analysis Process
Figure 12 illustrates the specific annual performance analysis process, which will provide a year-on-year performance status and trend towards the shared goal of minimising decommissioning costs. This process will be transparent, accounting for all variables included in figure 13 below.
Cost Estimate Process
Raw data is extracted from the UKCS Stewardship
Survey
Assurance OK?
New scope additions since last estimate identified and
extracted
Forecast cost data is adjusted for inflation to 2016 baseline
Uncertainty ranges for
forecast work scope reviewed
and agreed
Actual cost data for completed
work is extracted
Model inputs compiled and
assured
Model re-run for comparable
data only
New range of cost outcomes, new P50
and performance score indentified
report prepared and published
Annual Process Review,
Assessment and Update
START
Updated data used in operator
engagement process
UKCS Decommissioning Estimate - 2017 25
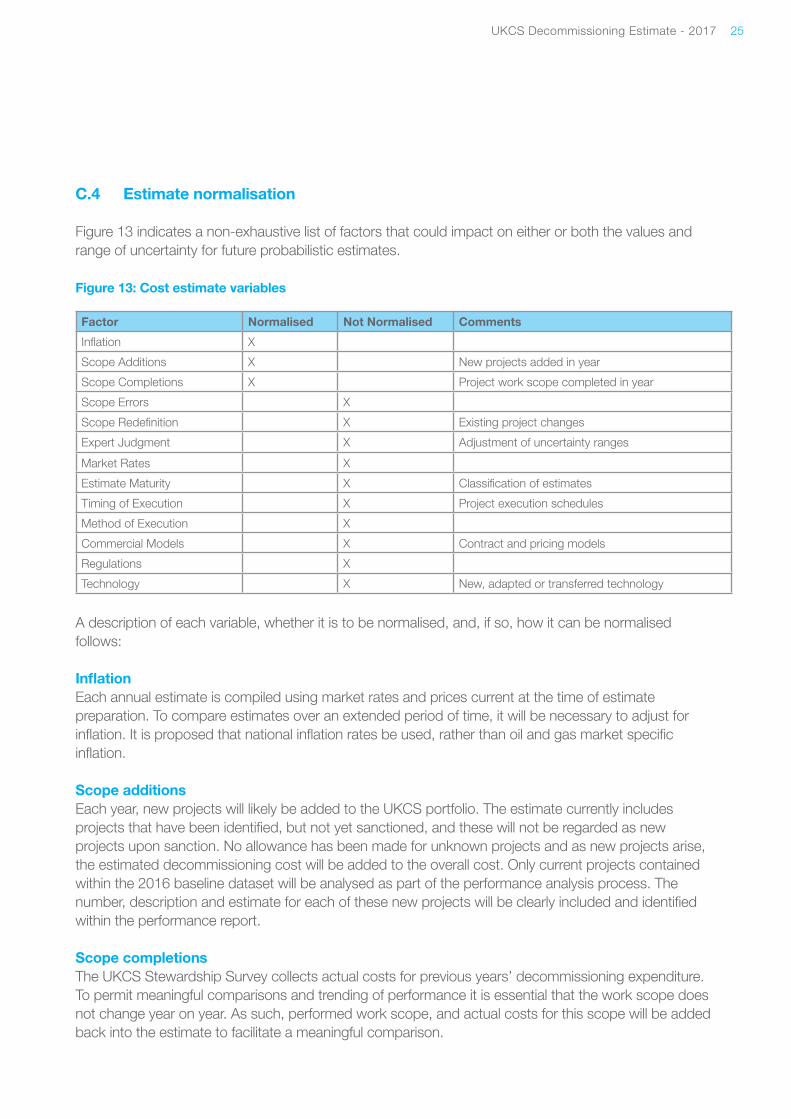
C.4 Estimate normalisation
Figure 13 indicates a non-exhaustive list of factors that could impact on either or both the values and range of uncertainty for future probabilistic estimates.
Figure 13: Cost estimate variables
A description of each variable, whether it is to be normalised, and, if so, how it can be normalised follows:
Inflation Each annual estimate is compiled using market rates and prices current at the time of estimate preparation. To compare estimates over an extended period of time, it will be necessary to adjust for inflation. It is proposed that national inflation rates be used, rather than oil and gas market specific inflation.
Scope additionsEach year, new projects will likely be added to the UKCS portfolio. The estimate currently includes projects that have been identified, but not yet sanctioned, and these will not be regarded as new projects upon sanction. No allowance has been made for unknown projects and as new projects arise, the estimated decommissioning cost will be added to the overall cost. Only current projects contained within the 2016 baseline dataset will be analysed as part of the performance analysis process. The number, description and estimate for each of these new projects will be clearly included and identified within the performance report.
Scope completionsThe UKCS Stewardship Survey collects actual costs for previous years’ decommissioning expenditure. To permit meaningful comparisons and trending of performance it is essential that the work scope does not change year on year. As such, performed work scope, and actual costs for this scope will be added back into the estimate to facilitate a meaningful comparison.
Factor Normalised Not Normalised Comments
Inflation X
Scope Additions X New projects added in year
Scope Completions X Project work scope completed in year
Scope Errors X
Scope Redefinition X Existing project changes
Expert Judgment X Adjustment of uncertainty ranges
Market Rates X
Estimate Maturity X Classification of estimates
Timing of Execution X Project execution schedules
Method of Execution X
Commercial Models X Contract and pricing models
Regulations X
Technology X New, adapted or transferred technology
UKCS Decommissioning Estimate - 2017 26
Scope errorsAny errors identified in decommissioning estimates that are representative of simply a better understanding of a previously identified project will attract no adjustments to the analysis. These errors will be considered to be included in the previously identified ranges of uncertainty.
Scope redefinitionIf a project requires to be re-defined, in terms of scope, but the objectives of the project are unchanged, no adjustment will be made to the analysis. Like errors, these re-definitions will be considered to be included in the previously identified ranges of uncertainty.
Expert judgmentEach estimate classification attracts a different upper and lower uncertainty percentage range. For this initial estimate the higher value of each range was selected, as described in section 5 of this report. This selection was based on an assessment of high optimism within the operator community and this assessment may change over time as estimates change and knowledge of estimates increase. This could cause the range chosen to narrow or widen. This change of range will be part of, and identical within, both model runs and no further normalisation will be done for the performance analysis process.
Market ratesMarket rates will vary continually over the entire time period of UKCS decommissioning and will move in different directions with changes in demand, capability and capacity. No adjustment will be made to the performance model to attempt any quantification of these changes and any such movement will be considered to be included in the previously identified ranges of uncertainty.
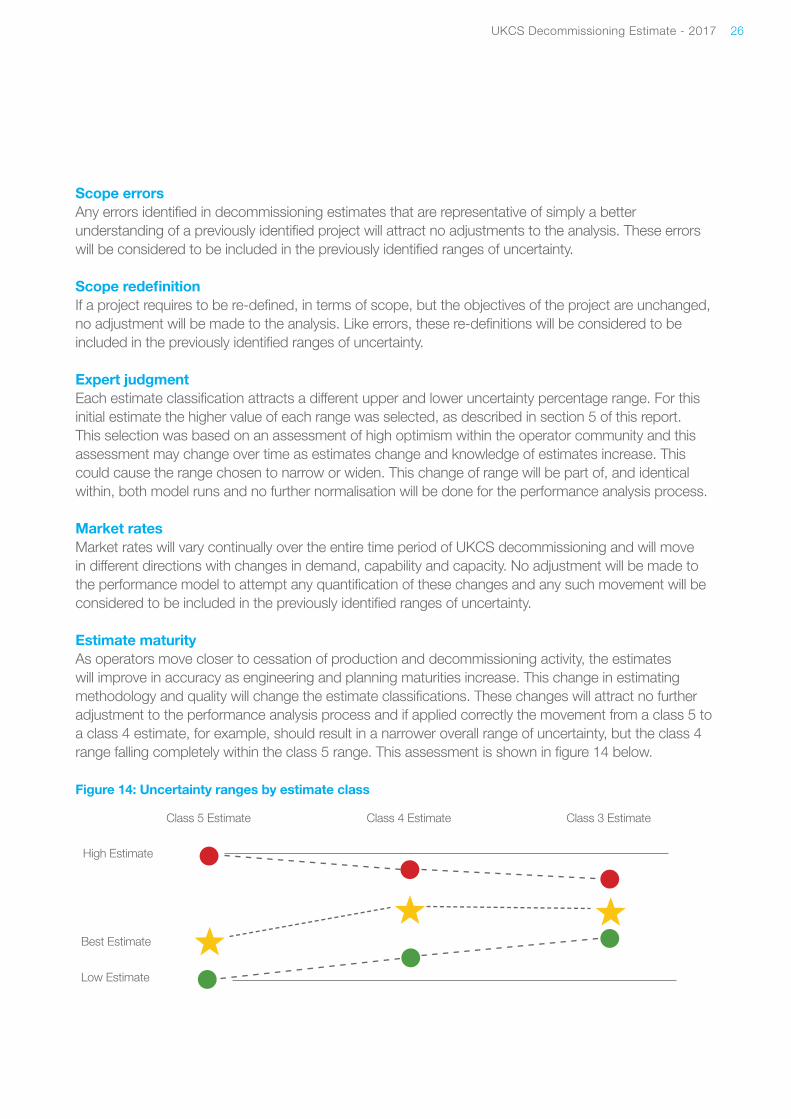
Estimate maturityAs operators move closer to cessation of production and decommissioning activity, the estimates will improve in accuracy as engineering and planning maturities increase. This change in estimating methodology and quality will change the estimate classifications. These changes will attract no further adjustment to the performance analysis process and if applied correctly the movement from a class 5 to a class 4 estimate, for example, should result in a narrower overall range of uncertainty, but the class 4 range falling completely within the class 5 range. This assessment is shown in figure 14 below.
Figure 14: Uncertainty ranges by estimate class
Class 5 Estimate Class 4 Estimate Class 3 Estimate
High Estimate
Best Estimate
Low Estimate
UKCS Decommissioning Estimate - 2017 27
Timing of executionAn acceleration of or delay decommissioning activity can have a significant impact on cost outcomes. However, no adjustment will be made to the performance model to attempt any quantification of these timing changes as any such movement will be considered to be included in the previously identified ranges of uncertainty.
Method of executionAs operator planning and market engagement matures, the assumed or planned execution methodologies may change. It is assumed that these changes will be made for the correct reasons, including cost reduction and no adjustment will be made to the performance model to attempt any quantification of these methodology changes.
Commercial modelsLike execution methods, commercial models may change as operator planning and market engagement matures. Again it is assumed that these changes will be made for the correct reasons, including cost reduction. No adjustment will be made to the performance model to attempt any quantification of these commercial and contractual changes.
RegulationsOver time, changes to the regulatory environment may occur. These changes may increase or decrease scope, but the programme goal to achieve decommissioning in compliance with the regulations will remain unchanged. As such, with no change in goal, no adjustment will be made to the performance model to attempt any quantification of regulatory change.
TechnologyDevelopment of new technologies, plus the adaptation and adoption of existing technology is a major focus area within decommissioning. This is seen as an opportunity to help achieve the programme goal, but not a change in the goal. As with execution methodologies, which may change in line with new technology, no adjustment will be made to the performance model.
UKCS Decommissioning Estimate - 2017 28
During the assurance process, two statistical questions were raised on the model:
• Why was a 90 percentile range taken for the tri-gen distribution?• Why was the remaining percentage (10%) split non-uniformly on the high and low sides?
The OGA elected to follow the AACE recommended practice which states that, after applying its recommended high and low-range percentages, the resulting confidence range is 90%, which is considered to be the appropriate range for decommissioning projects.
As described in section 5 of the report, an unequal distribution was selected to reflect the optimism bias of estimating and the probability of most estimates being provisioning rather than project estimates.
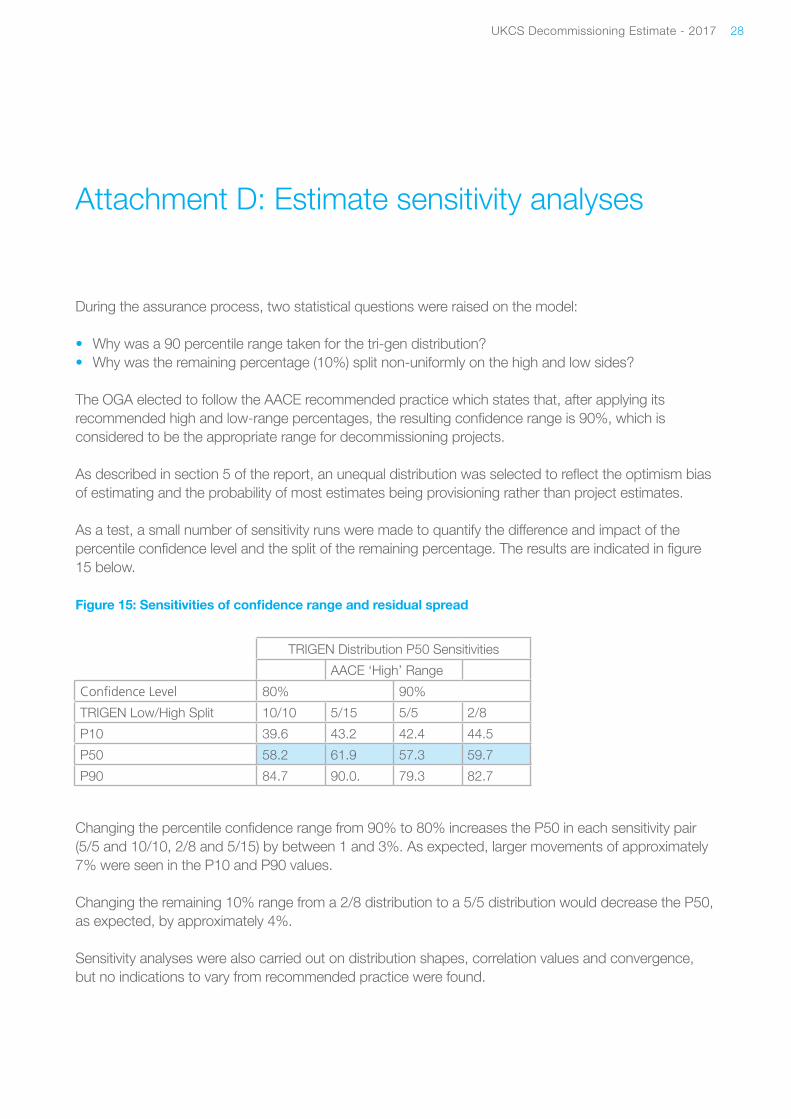
As a test, a small number of sensitivity runs were made to quantify the difference and impact of the percentile confidence level and the split of the remaining percentage. The results are indicated in figure 15 below.
Figure 15: Sensitivities of confidence range and residual spread
Changing the percentile confidence range from 90% to 80% increases the P50 in each sensitivity pair (5/5 and 10/10, 2/8 and 5/15) by between 1 and 3%. As expected, larger movements of approximately 7% were seen in the P10 and P90 values.
Changing the remaining 10% range from a 2/8 distribution to a 5/5 distribution would decrease the P50, as expected, by approximately 4%.
Sensitivity analyses were also carried out on distribution shapes, correlation values and convergence, but no indications to vary from recommended practice were found.
Attachment D: Estimate sensitivity analyses
TRIGEN Distribution P50 Sensitivities
AACE ‘High’ Range
Confidence Level 80% 90%
TRIGEN Low/High Split 10/10 5/15 5/5 2/8
P10 39.6 43.2 42.4 44.5
P50 58.2 61.9 57.3 59.7
P90 84.7 90.0. 79.3 82.7

Oil and Gas Authority is a limited company registered in England and Wales with registered number 09666504 and
VAT registered number 249433979. Our registered office is at 21 Bloomsbury Street, London, United Kingdom, WC1B 3HF
Copyright © Oil and Gas Authority 2017
ogauthority.co.uk


