ORIGINAL ARTICLE Ultrasound (US) and Computed Tomographic (CT) Appearances of Large (Giant) Hepatic Cavernous Hemangiomas S A Samad, FRCR A Maimunah, MMed A Zulfiqar, MMed M Zaharah, MMed Department of Radiology, Faculty of Medicine, Universiti Kebangsaan Malaysia, Jalan Raja Muda Abdul Aziz, 50300 Kuala Lumpur Summary The sonographic and CT appearances of 9 large cavernous hemangiomas of the liver were studied. On sonography, 6 masses (67%) exhibit heterogenous echo pattern; where in 2 patients the echotexture was a mixture of hypoechoic and isoechoic areas and in 4 patients there are varying amounts of bright hyperreflective areas similar to the texture typical of small hemangiomas. The masses were predominantly hypoechoic in the remaining 3 patients (33%). Incremental bolus or bolus-infusion dynamic CT showed peripheral contrast enhancement of varying intensities and thickness in all patients. The lesions were incorrectly diagnosed as hepatomas in 4 patients, suspected as hemangiomas with a differential diagnosis of hepatomas in 4 patients and an early liver abscess in 1 patient. It is concluded that large cavernous hemangiomas of the liver do not exhibit the typical homogenous hyperreflective echo texture as exhibited by small lesions and they mimic primary and secondary hepatic neoplasms. However, the diagnosis of hemangioma should be entertained when such a mass contains bright hyperechoic areas within its heterogenous echo pattern and exhibit peripheral enhancement on contrast enhanced CT. In addition to correlation with appropriate clinical information, confirmation of diagnosis include delayed scanning during a routine incremental bolus dynamic CT, single-slice dynamic contrast enhanced CT, angiography or isotope scintigraphy and magnetic resonance imaging depending on the availability of facility. Key Words: Giant cavernous hemangioma, Liver, Ultrasound, CT Introduction Cavernous hemangioma of the liver is rare. Its frequency at autopsy is reported to be 7.3%1. The lesion is usually asymptomatic and less than 3 cm. Lesions more than 4 cm are termed 'giant hemangiomas'2-4. With widespread use of ultrasound and CT to evaluate the abdomen, cavernous hemangiomas are detected with increasing frequency as incidental findings. Its incidence at imaging by sonography, CT and magnetic resonance imaging (MRI) may approach 15%'. Unfortunately they are 82 discovered on imaging of the abdomen for other reasons such as staging of malignancy which poses problem in diagnosis. Familiarity with the variety of sonographic and CT features of hemangioma is important to avoid misdiagnosis. The classical sonographic appearances of a hepatic cavernous hemangioma is that of a homogenous hyperreflective mass with a well defined margin usually seen with small lesions less than 2 cm'-B. On CT, the accepted criteria for diagnosis which is based on contrast enhanced single-slice dynamic CT technique, Med J Malaysia Vol 50 No 1 Mar 1995
Transcript
ORIGINAL ARTICLE
Ultrasound (US) and Computed Tomographic (CT) Appearances of Large (Giant) Hepatic Cavernous Hemangiomas
S A Samad, FRCR A Maimunah, MMed A Zulfiqar, MMed M Zaharah, MMed Department of Radiology, Faculty of Medicine, Universiti Kebangsaan Malaysia, Jalan Raja Muda Abdul Aziz, 50300 Kuala Lumpur
Summary
The sonographic and CT appearances of 9 large cavernous hemangiomas of the liver were studied. On sonography, 6 masses (67%) exhibit heterogenous echo pattern; where in 2 patients the echotexture was a mixture of hypoechoic and isoechoic areas and in 4 patients there are varying amounts of bright hyperreflective areas similar to the texture typical of small hemangiomas. The masses were predominantly hypoechoic in the remaining 3 patients (33%). Incremental bolus or bolus-infusion dynamic CT showed peripheral contrast enhancement of varying intensities and thickness in all patients. The lesions were incorrectly diagnosed as hepatomas in 4 patients, suspected as hemangiomas with a differential diagnosis of hepatomas in 4 patients and an early liver abscess in 1 patient. It is concluded that large cavernous hemangiomas of the liver do not exhibit the typical homogenous hyperreflective echo texture as exhibited by small lesions and they mimic primary and secondary hepatic neoplasms. However, the diagnosis of hemangioma should be entertained when such a mass contains bright hyperechoic areas within its heterogenous echo pattern and exhibit peripheral enhancement on contrast enhanced CT. In addition to correlation with appropriate clinical information, confirmation of diagnosis include delayed scanning during a routine incremental bolus dynamic CT, single-slice dynamic contrast enhanced CT, angiography or isotope scintigraphy and magnetic resonance imaging depending on the availability of facility.
Cavernous hemangioma of the liver is rare. Its frequency at autopsy is reported to be 7.3%1. The lesion is usually asymptomatic and less than 3 cm. Lesions more than 4 cm are termed 'giant hemangiomas'2-4. With widespread use of ultrasound and CT to evaluate the abdomen, cavernous hemangiomas are detected with increasing frequency as incidental findings. Its incidence at imaging by sonography, CT and magnetic resonance imaging (MRI) may approach 15%'. Unfortunately they are
82
discovered on imaging of the abdomen for other reasons such as staging of malignancy which poses problem in diagnosis. Familiarity with the variety of sonographic and CT features of hemangioma is important to avoid misdiagnosis.
The classical sonographic appearances of a hepatic cavernous hemangioma is that of a homogenous hyperreflective mass with a well defined margin usually seen with small lesions less than 2 cm'-B. On CT, the accepted criteria for diagnosis which is based on contrast enhanced single-slice dynamic CT technique,
Med J Malaysia Vol 50 No 1 Mar 1995
ULTRASOUND AND CT APPEARANCES OF LARGE HEPATIC CAVERNOUS HEMANGIOMAS
include: (a) a low density lesion on unenhanced scan (b) early peripheral enhancement after bolus of intravenous contrast injection, (c) progressive centripetal opacification and (d) isodense filling-in with or without unopacified clefts occurring not less than 3 minutes after contrast injection9-11 • Problem in the diagnosis of cavernous hemangiomas occurs, because not all hemangiomas exhibit typical sonographic or CT appearances. There is a tendency for large lesions to exhibit heterogeneity in echotexture on sonographi·12. Approximately 40% of cavernous hemangiomas show mixed or reduced echogenicity mimicking sonographic appearance of cancer). The pattern of dynamic enhancement seen on a single-slice dynamic CT is lacking with the routinely employed bolus or bolusinfusion incremental CT. Our encounter with several cases of large or giant cavernous hemangiomas misdiagnosed as hepatomas led us to restudy the ultrasound and CT images of 8 lesions to determine whether any of the typical features previously described on ultrasound and single-slice dynamic CT were present to allow correct diagnosis.
Materials and Methods
This is a study on 9 patients (7 females, 2 males), seen from 1985 to 1992. Their ages ranged from 30 to 63 years (mean 50 years). Hemangiomas were confirmed by biopsy in 3 patients and hepatic angiography in the remaining 6 patients. Four patients were referred from other hospitals with CT. The remaining 5 were patients who had CT examinations in our hospital using Toshiba 9005. Contrast enhancement is achieved by the routine technique of bolus or bolus-infusion incremental scanning, where a rapid bolus of 100 cc or rapid bolus of 100 cc followed by infusion of 50 cc of water soluble contrast medium. Scanning was carried out at the end of bolus injection with slices of 10 mm thickness at 10 mm intervals. All patients had ultrasound examinations in our institution, using the 3.75 MHz sector and convex probes of the Toshiba 100A.
The clinical diagnosis of the patients were: suspected liver tumour (6), cholelithiasis (2) and liver abscess (1).
The combined ultrasound and CT diagnoses of these lesions were hepatomas (4), suspected hemangioma with a differential of hepatoma (4) and early liver
Med J Malaysia Vol 50 No 1 Mar 1995
abscess (1). All the 4 cases referred from other institutions were diagnosed as hepatomas. On ultrasound, the features reviewed were location, size, echogenicity and margin of lesion, whereas on CT apart from the size and location of lesion, the pattern of enhancement was also assessed.
Results
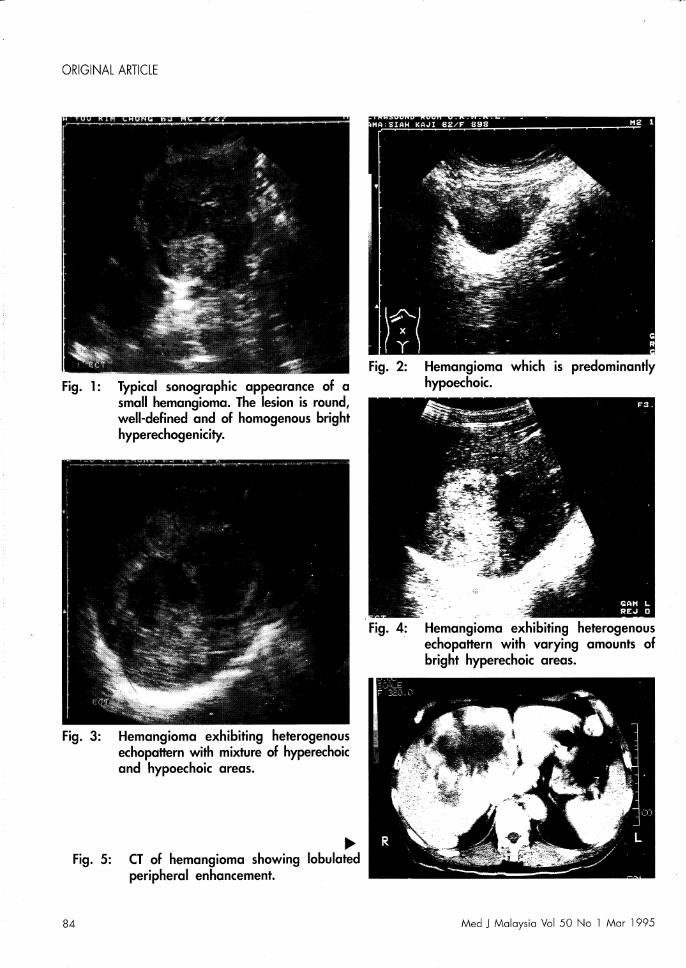
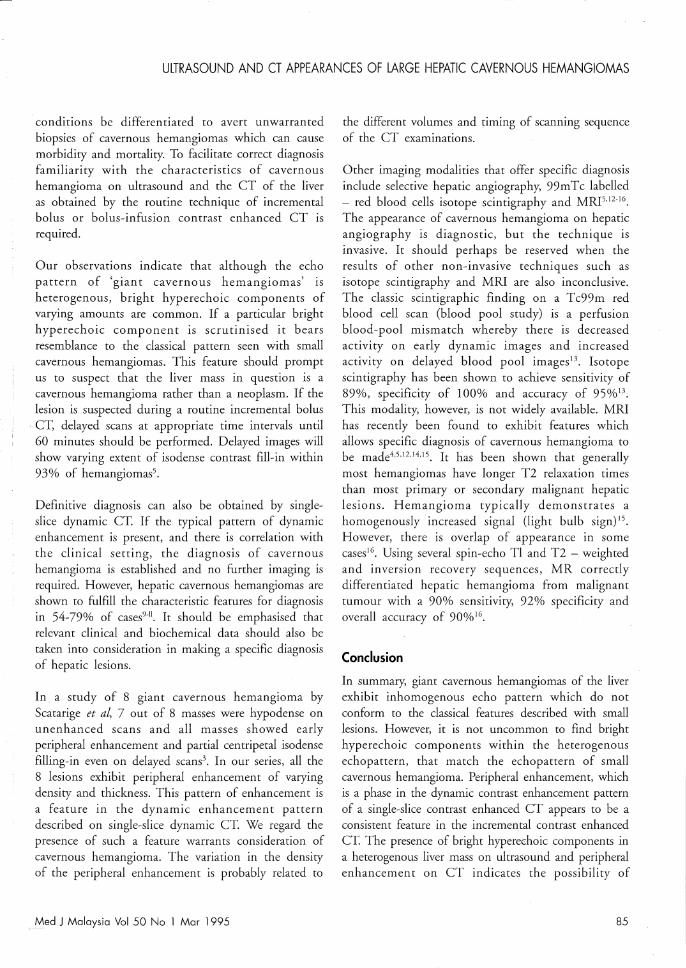
The size of the masses ranged from 4 to 12 cm, with a mean of 10 cm. The masses were located in the right lobe only (4), both right and left lobes (3) and left lobe only (2). In 2 patients, the hemangiomas were multiple. One patient with a mass in the left lobe had diffuse hemangioma in the right lobe detected on angiography and manifested as a diffusely hyperreflective bright right lobe. The other patient had the large hemangioma in the right lobe and a smaller one in the left lobe. This smaller lesion exhibited the typical sonographic appearances of a hemangioma; round well-defined mass with homogenous bright hyperechoic pattern (Figure 1). The echo pattern of the large masses were heterogenous in 6 (67%) and predominantly hypoechoic in 3 (37%) (Figure 2). Of the 6 lesions showing heterogenous pattern, 2 exhibited mixture of hyperechoic and hypoechoic areas (Figure 3) and the remaining 4 demonstrated varying amounts of bright hyperechoic areas (Figure 4). The walls of all masses were well-defined with varying degrees of lobulations. In none of these cases was there acoustic enhancement. All lesions showed hypodensity on plain CT and peripheral enhancement of vatying density and thickness (Figure 5) on contrast enhanced CT. Calcifications were seen in 2 cases.
Discussion
The classical echo pattern of homogenous hyperechogenicity for cavernous hemangiomas is seen in 58-73% of cases, usually with smalllesions)-~. Larger lesions exhibit heterogenous pattern which mimic neoplasms? On incremental CT, a technique routinely employed to assess focal lesions in the liver, the pattern of enhancement of a particular scan slice lacks the dynamic enhancement pattern seen with single-slice contrast enhanced dynamic CT. The inhomogenous appearance could lead to a misdiagnosis of malignant neoplasm of the liver. It is important that the two
83
ORIGINAL ARTICLE
Fig. 1: Typical sonographic appearance of a small hemangioma. The lesion is round/ well-defined and of homogenous bright hyperechogenicity.
Fig. 3: Hemangioma exhibiting heterogenous echopattern with mixture of hyperechoic and hypoechoic areas.
~ Fig. 5: CT of hemangioma showing lobulated
peripheral enhancement.
Fig. 2: Hemangioma which is predominantly hypoechoic.
Fig. 4: Hemangioma exhibiting heterogenous echopattern with varying amounts of bright hyperechoic areas.
84 Med J Malaysia Vol 50 No 1 Mar 1995
ULTRASOUND AND CT APPEARANCES OF LARGE HEPATIC CAVERNOUS HEMANGIOMAS
conditions be differentiated to avert unwarranted biopsies of cavernous hemangiomas which can cause morbidity and mortality. To facilitate correct diagnosis familiarity with the characteristics of cavernous hemangioma on ultrasound and the eT of the liver as obtained by the routine technique of incremental bolus or bolus-infusion contrast enhanced eT is required.
Our observations indicate that although the echo pattern of 'giant cavernous hemangiomas' is heterogenous, bright hyperechoic components of varying amounts are common. If a particular bright hyperechoic component is scrutinised it bears resemblance to the classical pattern seen with small cavernous hemangiomas. This feature should prompt us to suspect that the liver mass in question is a cavernous hemangioma rather than a neoplasm. If the lesion is suspected during a routine incremental bolus eT, delayed scans at appropriate time intervals until 60 minutes should be performed. Delayed images will show varying extent of isodense contrast fill-in within 93% of hemangiomas5.
Definitive diagnosis can also be obtained by singleslice dynamic eT. If the typical pattern of dynamic enhancement is present, and there is correlation with the clinical setting, the diagnosis of cavernous hemangioma is established and no further imaging is required. However, hepatic cavernous hemangiomas are shown to fulfill the characteristic features for diagnosis in 54-79% of cases9-1I • It should be emphasised that relevant clinical and biochemical data should also be taken into consideration in making a specific diagnosis of hepatic lesions.
In a study of 8 giant cavernous hemangioma by Scatarige et al, 7 out of 8 masses were hypodense on unenhanced scans and all masses showed early peripheral enhancement and partial centripetal isodense filling-in even on delayed scans]. In our series, all the 8 lesions exhibit peripheral enhancement of varying density and thickness. This pattern of enhancement is a feature in the dynamic enhancement pattern described on single-slice dynamic eT. We regard the presence of such a feature warrants consideration of cavernous hemangioma. The variation in the density of the peripheral enhancement is probably related to
""ed J Malaysia Vol 50 No 1 Mar 1995
the different volumes and timing of scanning sequence of the eT examinations.
Other imaging modalities that offer specific diagnosis include selective hepatic angiography, 99mTc labelled - red blood cells isotope scintigraphy and MRP,12-16. The appearance of cavernous hemangioma on hepatic angiography is diagnostic, but the technique is invasive. It should perhaps be reserved when the results of other non-invasive techniques such as isotope scintigraphy and MRI are also inconclusive. The classic scintigraphic finding on a Tc99m red blood cell scan (blood pool study) is a perfusion blood-pool mismatch whereby there is decreased activity on early dynamic images and increased activity on delayed blood pool images l3 • Isotope scintigraphy has been shown to achieve sensitivity of 89%, specificity of 100% and accuracy of 95%13. This modality, however, is not widely available. MRI has recently been found to exhibit features which allows specific diagnosis of cavernous hemangioma to be made4,5,12,14,15. It has been shown that generally
most hemangiomas have longer T2 relaxation times than most primary or secondary malignant hepatic lesions. Hemangioma typically demonstrates a homogenously increased signal (light bulb sign) 15. However, there is overlap of appearance in some cases1G. Using several spin-echo Tl and T2 - weighted and inversion recovery sequences, MR correctly differentiated hepatic hemangioma from malignant tumour with a 90% sensitivity, 92% specificity and overall accuracy of 90%16.
Conclusion
In summary, giant cavernous hemangiomas of the liver exhibit inhomogenous echo pattern which do not conform to the classical features described with small lesions. However, it is not uncommon to find bright hyperechoic components within the heterogenous echopattern, that match the echopattern of small cavernous hemangioma. Peripheral enhancement, which is a phase in the dynamic contrast enhancement pattern of a single-slice contrast enhanced eT appears to be a consistent feature in the incremental contrast enhanced eT. The presence of bright hyperechoic components in a heterogenous liver mass on ultrasound and peripheral enhancement on eT indicates the possibility of
85
ORIGINAL ARTICLE
cavernous hemangioma. Confirmation requires further radiological examinations such as dynamic single-slice
References
1. Ishak KG, Rabin L. Benign tumours of the liver. Med Clin North Am 1975;59 : 995-1013.
2. Adam YG, Huvos AG, Former JG. Giant hemangiomas of the liver. Ann Surg 1970;172 : 230-45.
3. Scartarige Je, Kenny JM, Fishman EK, Herlong FH, Siegelman SS. CT of giant cavernous hemangioma. Am J Roentgenol 1987;149 : 83-5.
4. Choi BI, Han MC, Park HJ, Kim SH, Han MH, Kim CW Giant cavernous hemangioma of the liver: CT and MR imaging in 10 cases. Am J Roentgenol 1989;152 : 1221-6.
5. Ferrucci JT, Freeny Pe, Stark DD, Foley WD, et aL Advances in hepatobiliary radiology. Radiology 1988;168 : 319-38.
6. Bree RL, Scwab RE, Neiman HL. Solitary echogenic spot in the liver; is it diagnostic of hemangioma? Am ] Roentgenol 1983;140 : 41-5.
7. Taboury J, Porcel A, Tubiana ]M, Monnier JP. Cavernous hemangioma of the liver studied by ultrasound. Radiology 1983;149 : 781-5.
8. Pen ]H, Pelckmans PA, Van Maercke YM, Degryse HR, de Schepper AM. Clinical significance of focal echogenic liver lesions. Gastrointest Radiol 1986;11 : 61-6.
contrast enhanced CT, angiography, blood pool scintigraphy and MRI, if available.
9. Freeny PC, Marks WM. Patterns of contrast enhancement of benign and malignant hepatic neoplasms during bolus dynamic and delayed CT. Radiology 1986;160 : 613-8.
10. Freeny PC, Marks WM. Hepatic hemangioma: dynamic bolus CT. Am J Roentgenol 1986;147: 711-9.
12. Nelson RC, Chezmar JL. Diagnostic approach to hepatic hemangiomas. Radiology 1990;176 : 11-3.
13. Robinowytz SA, McKusick KA, Strauss HW 99mTc red blood cell scintography in evaluating focal liver lesions. Am J Roentgenol 1984;143 : 63-8.
14. Stark DD, Felcher Re, Willenberg S et al. Magnetic resonance imaging of cavernous hemangioma of the liver: tissue specific characterisation. Am J Roentgenol 1985;145 : 213-22.
15. Wittenberg],. Stark DD, Forman BH et al. Differentiation of hepatic med.st~ses from hepatic hemangiomas and cysts by using MRI. Am J Roentgenol 1988; 151 : 79-84.